
Module 3Assessing practices to increase
statistical literacy
Regional Workshop on Statistical Literacy: Increasing Effective Use of Agricultural and Rural Statistics
13‐17 July 2015 Daejeon, Republic of Korea
Effectiveness of data producers in facilitating statistical literacy, with respect to:
1. Awareness
2. Understanding
3. Analysis
4. Communication
Module outline

What is awareness of statistics? Able to define what data are needed
Understand the main sources of agriculture and rural statistics
Know what is available, when, and how to access it
Able to assess which statistical information is fit‐for‐purpose
Select appropriate source of data
Know how the national statistical system works
3.1 Facilitating awareness (1)
What can data producers do?1. Promote statistics through many channels
2. Publish a work program and release calendar
3. Provide a well‐organised and useable web site
4. Participate and represent statistics at events
5. Have a quality framework and assessment tool
6. Provide explanatory notes and information
7. Provide information services (e.g. library)
8. Understand their users
9. Work together
3.1 Facilitating data awareness (2)

Source: http://web0.psa.gov.ph/content/primer‐2012‐census‐agriculture‐and‐fisheries
Source: www.ssb.no/en/jord‐skog‐jakt‐og‐fiskeri

“On the Web, usability is a necessary condition for survival. If a website is difficult to use, people leave.”
Dr. Jakob Nielsen (2003)
Source: www.unece.org/fileadmin/DAM/stats/documents/ece/ces/ge.50/2007/mtg1/wp.20.e.pdf
What is understanding statistics?
Know about statistical concepts (e.g. percentages, survey vs census, standard classifications)
Able to read tables and graphs
Able to find help to fill gaps in understanding
3.2 Facilitating understanding (1)

What can data producers do?
1. Provide guidance and training
2. Explain clearly using plain language
3. Good presentation
4. Provide teaching resources
5. Contact details for questions
6. Understand their users
3.2 Facilitating understanding (2)
Source: www.abs.gov.au/websitedbs/a3121120.nsf/home/statistical+language

Source: www.gapminder.org
Source: ftp://ftp.fao.org/docrep/fao/012/a0218e/a0218e.pdf
Develop teaching resources• Step‐by‐step• Lesson plans• Easy to pick up and use• Prepared by experts• Build literacy at a young
age

Source: United States Department of Agriculture (USDA), Rural America at a Glance, 2012 Edition (www.ers.usda.gov/media/965908/eb‐21_single_pages.pdf)
What is statistical analysis?
Critical questioning
Apply techniques to link, integrate or extract information
Transform data into tables and graphs
Reach conclusions
Understand statistical models or frameworks underlying the data
3.3 Facilitating analysis (1)
What can data producers do?1. Disseminate microdata and data in electronic
format
2. Provide detailed metadata
3. Have a permissible copyright license (e.g. Creative Commons)
4. Provide analysis tools and training
5. Develop partnerships with research institutions and academia
6. Understand their users
3.3 Facilitating analysis (2)
Source: www.gsars.org/wp‐content/uploads/2014/09/Providing‐Access‐to‐Agricultural‐Microdata‐Guide.pdf
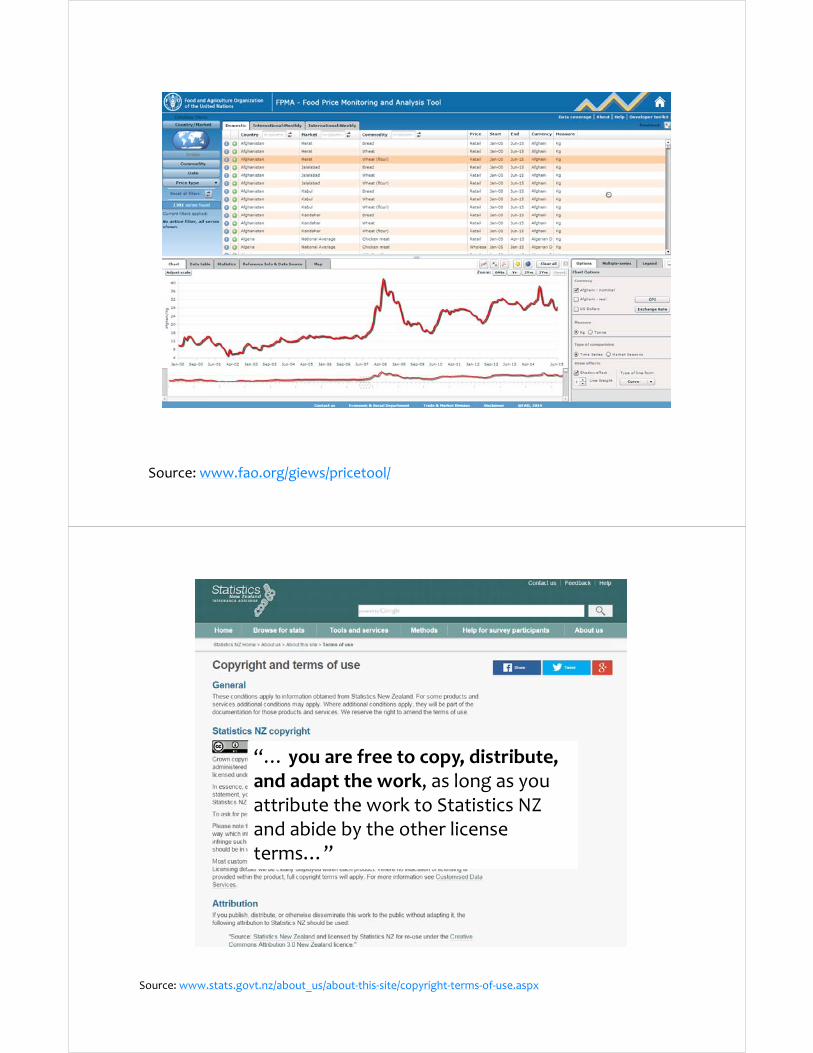
Source: www.fao.org/giews/pricetool/
Source: www.stats.govt.nz/about_us/about‐this‐site/copyright‐terms‐of‐use.aspx
“… you are free to copy, distribute, and adapt the work, as long as you attribute the work to Statistics NZ and abide by the other license terms…”

What is statistical communication?
Describe information in writing and visually
Relate statistics to the policy issue
Use easy‐to‐understand language
Articulate the limitations of the data
Present in a format suited to audience
Seek feedback
3.4 Facilitating communication (1)
What can data producers do?
1. Lead by example
2. Provide templates and visualization tools
3. Publish a statistical style guide
4. Establish consultative forums
5. Provide training in statistical communication
6. Collate and promote best practices
3.4 Facilitating communication (2)

Source: www.spc.int/pafpnet/attachments/article/145/policy‐brief‐21‐Pacific‐Regional‐Food‐Security‐2014.pdf
Source: www.gov.uk/service‐manual/user‐centred‐design/data‐visualisation.html

Data users’ conference
• Opportunity to share information
• Showcase new products
• Learn about actual data use
• Improve quality of statistics
• Understand users


