
Modeling anomalous depth dependent dissolution effects in
chemically amplified resists
Mosong Cheng, Jacek Tyminski*, Ebo Croffie, Andrew Neureuther
Electronic Research Laboratory
Department of Electrical Engineering and Computer Sciences
231 Cory Hall, University of California, Berkeley, CA 94720
Phone: (510)642-4590, Fax: (510)642-2739
*Nikon Precision Inc. 1399 Shoreway Rd, Belmont, CA 94002-4107
Phone: (650)508-4674, Fax: (650)508-4672
Abstract
A post exposure bake and dissolution model for JSR KRF-K2G resist has been
established for bake temperature and time effects from large area exposures on
production equipment. Data from TARC coated K2G resist were well behaved and
provided key understanding of the PEB processes. Data from K2G without TARC
showed inhibition of surface dissolution that is possibly due to photoacid evaporation.
Both processes showed an intrinsic thickness reduction of 50 nm in the first 30 seconds
of PEB and then a continued decrease of 4nm per minute of bake time. An algebraic
dissolution model for resist showing an “S-shape” in the logarithm dissolution rate versus
exposure dose is developed using a barrier model. This model was fit with the dissolution
rates deduced from the coated K2G as a function of activated site concentration. The
rates agree well with DRM data and the DRM data showed further details of depth
dependent effects. The methodology of large area exposure allowed the simulation

parameters for PEB temperature and time effects to be quantitatively determined very
effectively.
Keywords: chemically amplified resist, post exposure bake, dissolution rate
monitoring, dissolution model, fitting process, simulation
I. Introduction
Chemically amplified resists are based on the acid catalytic deprotection of a polymer
matrix. During the standard post exposure bake (PEB) step, several mechanisms are
involved, including a deblocking reaction, photoacid diffusion, acid loss, free volume
generation, polymer matrix densification, evaporation of small species such as acid and
volatile groups. Some of the systems also suffer from substrate or air contamination. As a
result, the dissolution rate distribution within resists is not uniform and can distort the
formation of final patterns after development [1].
Dissolution Rate Monitor (DRM) measurements have been widely used as a tool to
quantify development pattern formation process. While DRM data is a great input for
resist modeling, the data in Fig. 1 presents a formidable challenge. It shows that the
dissolution rate in JSR KRF-K2G resist depends on depth. However, this dependence is
anomalous in that the rate increases from the top of the resist to the bottom of the resist
when the exposure dose is low, while the exposure energy decreases from top to bottom.
Note that if a top anti-reflective coating (TARC) is applied before exposure, then this
anomalous behavior disappears, as shown in Fig 1 (b).

The goal of this paper is to establish a PEB and development model for JSR KRF-
K2G resist that accounts for PEB time and temperature effects. The approach is to utilize
the large area exposure methodology developed by M. Zuniga et al. [2] and to compare
result with the DRM data shown above. This paper begins with observation of intrinsic
compaction during PEB. Data on thickness loss versus exposure dose after development
are then presented. The data is then normalized using activated site concentration as a
common basis. The dissolution parameters of the resist are then fit and compared with
DRM data. Finally an isolated line profile simulation of the resist is presented.
II. Post exposure bake model
During the post exposure bake (PEB) process, several chemical and physical
reactions occur. Photoacid catalyses the deblocking/deprotection process [3], in which the
blocked polymer is converted to a soluble hydroxyl group and a volatile group. The
volatile group then generates free volume. Meanwhile, the photoacid can diffuse and its
diffusivity is enhanced by the amount of free volume. Furthermore, if the PEB
temperature approaches the glass transition temperature Tg, the deprotected polymer
matrix starts densifying, which reduces the acid diffusion [3]. As a result of PEB, the
evaporation of solvent / free volume can lead to compaction of resist. A model for these
effects is forth coming from collaboration work of S. Postinkov and E. Croffie [4].
Based on M. Zuniga’s work [6], and given the acid evaporation phenomena which
exists in some resists, we assume the following model:
(3)
(2) (x)CK- ).(
(1) )1(
asC0
ae2
1
eDD
CKCDt
C
CCKt
C
aaa
maas
as
=
=
=

Where Cas is the activated site concentration, Ca is the photo acid concentration, K1 is
the reaction rate constant, K2 is the acid loss rate within resist, Ke is the acid evaporation
rate at the surface, D0 is the acid diffusion coefficient in protected polymer and is a
constant.
Equation (1) describes the deblocking reaction and (2) describes the acid diffusion
and acid loss process. There are several mechanisms, which contribute to acid loss. One
is free volume loss mechanism given by K2. Another is surface evaporation described by
Ke. Here we assumed the acid concentration in air is 0, and therefore the evaporation rate
is only proportional to the resist surface acid concentration. Equation (3) gives the acid
diffusion coefficient which is assumed to increase exponentially with the concentration of
activated site.
III. Dissolution model
“S-shape” dissolution rate versus dose curve has been observed and reported for poly-
vinyl phenol [7] which is the resin in K2G.. When dose is low, R is flat. When dose
reaches some threshold, R increases dramatically, which causes a high contrast. And with
dose increasing, R approaches its saturation value. Since there are no models in the
literature which give such an “S-shape” dissolution rate curve, we begin by establishing
an algebraic model.
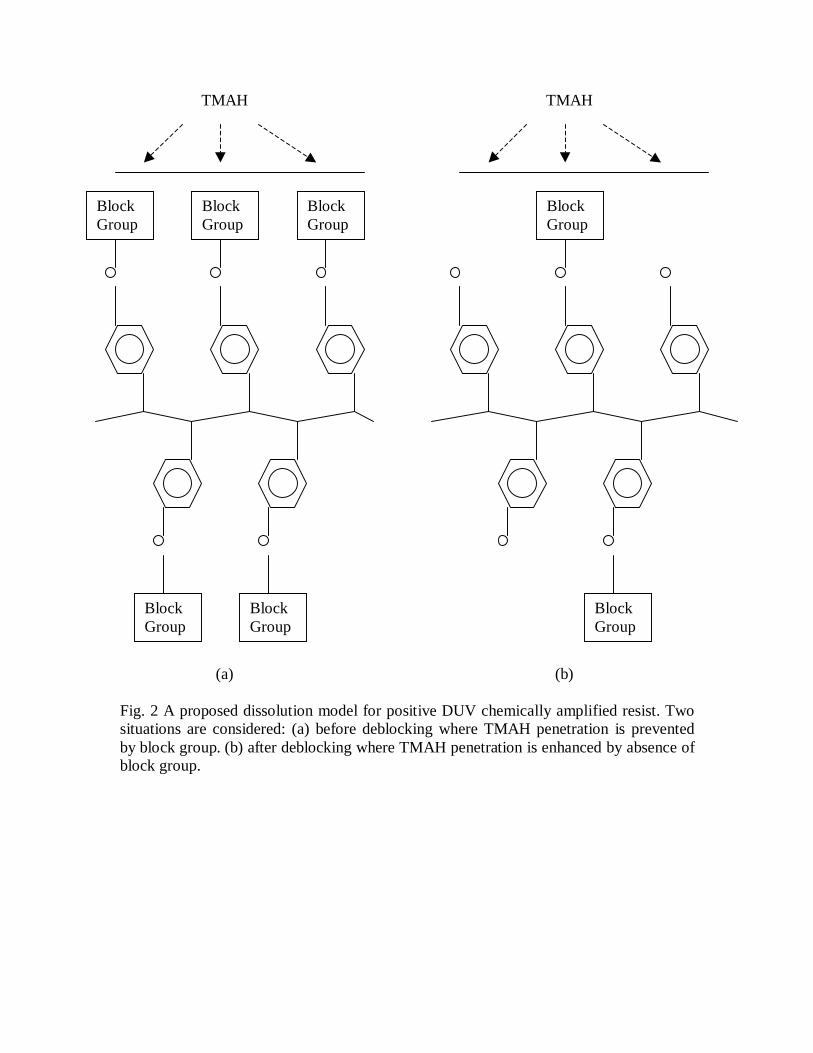
KRF-K2G consists of poly(p-vinyl)phenol partially blocked with a blocking group
and a photoacid generator [5]. Fig. 2 from [8] depicts how protected groups prevent
penetration of developer as a basis for a model for positive DUV chemically amplified

resist. We assume three mechanisms are involved in the development of a positive
chemically amplified resist: the penetration of developer into the surface layer of resist,
the reaction of the developer with the resist and the transportation of the product back
into the bulk developer. A block group can prevent the penetration of developer into the
resist, hence blocks the dissolution.
To establish a model, we assume that the rate limiting step is the penetration of the
developer which is governed by a barrier effect with activation energy Eu for unprotected
sites and activation energy Ep for fully protected sites. We assume for partially
deprotected sites, the activation energy is a linear combination (1-Cas)Eu+Cas.Ep, where
Cas is the normalized amount of deprotected sites. Therefore the developer penetration
rate in partially deprotected polymer is
Here D and Ds are the developer concentration in the bulk developer and at the surface of
polymer, respectively, D>Ds. T is the temperature.
Also, Rp0 is the intrinsic penetration rate without depreotection, Rp2 and w are the
deprotection enhanced penetration components. Both of them are functions of T.
The dissolution rate is also given by the surface reaction rate of polymer with the
developer, also the dissolution rate, and is
(4) )D-)(D())((R s20/))((
10paspuasu wC
ppskTEECE
pp eRRDDeRR +=+=
(5) ss kDR =
Here k is the removal rate of polymer.
At steady state, Rs=Rp. After substitution of (4) to (5) and denoting new parameters,
the dissolution rate can be simplified as
Here Cas is the activation level, r0 is the development rate for the unexposed resist, a,
b and w are constant. The parameters r0, a, b and w have temperature dependence. This
model predicts a “S-shape” curve for a logarithm of dissolution rate versus Cas or dose.
IV. Experiment
Large area exposures of JSR KRF-K2G were made on a Nikon exposure tool. The
nominal processing conditions were: softbake 90oC, 90sec; resist thickness 750nm; post
exposure bake 100 oC, 60sec; developed with 0.261N TMAH, 21 oC, 60sec.
The large-area exposures were followed by post exposure bake at different
temperatures. Wafers with and without TARC were exposed with doses varying from 6
to 35 mJ/cm2, and baked for the matrix of bake times and temperatures shown in Table 1.
Note that a star pattern of various bake temperature for fixed bake time and then varying
bake time for fixed temperature was used.
Table I. PEB conditions for the experiment
Temp. oC 20 40 60 80 90 100 110 120 100 100 100 100
Time(sec) 60 60 60 60 60 60 60 60 30 120 240 480
After PEB and development, the remaining resist thickness in the exposed and
unexposed areas was measured.
(6) 1
)1(R 0
wCas
wCas
be
aer
++
=
V. Results and Analysis
We now proceed to establish a quantitative model for the effects of PEB and
dissolution on the thickness of resist developed. However, we noticed a considerable
thickness change of even unexposed resist which could not be accounted for by
development. Thus we begin in section 1 with an intrinsic compaction. We then
temporarily assume a threshold model in section 2 to estimate reaction parameters. In
section 3, with these reaction parameters, a non-threshold model for calculating resist
thickness loss is then developed and used to extract dissolution rate parameters. Finally in
section 4, DRM curves are fit to obtain the acid diffusion parameters.
1. Intrinsic compaction
Significant resist thickness changes were observed during PEB and before
development. We call this change “intrinsic compaction”. The resist thicknesses are
shown in Fig 3 and Fig 4 for unexposed regions after development. It can be seen that the
resist thickness is decreased. The thickness reduction is about the same for both top-
coated and non-top-coated resists. The resist thickness loss is fairly linear with PEB time.
It shrinks about 50nm within the first 30sec of PEB. Then it continues to shrink with the
rate of 3 – 4nm per minute as can be seen in Fig. 4. Note that the resist thickness
decreases sharply when the PEB temperature is above 100oC.
Since this thickness loss is very large for unexposed films while the dissolution rate
for unexposed resist is only 0.15nm/s, we believe this effect is due to a shrinkage of the
materials. Possible mechanism for this intrinsic compaction is resist densification in
which the residual solvent and/or free volume are driven out by PEB, which could be
considered as a continuation of the soft bake. The effect of high temperature can be

explained by the thermal decomposition effect. When the PEB temperature is high, some
deprotection of the resin can take place that results in free volume and subsequent
compaction.
2. Extraction of reaction parameters K1,K2 and m
An example of the photoacid concentration as a function of depth after exposure is
shown in Fig. 5. This plot was obtained by using the BLEACH program in SAMPLE3D
with the Dill’s parameters A=-0.16 m-1, B=0.91 m-1, C=0.0013mJ-1, the resist layer
thickness 750nm, refractive index n=1.56, k=-0.02.
To obtain the reaction/acid loss rates of the resist, the method described by M. Zuniga
et al. [2] was used which is based on a threshold of activated site concentration for
development. Ignoring diffusion and assuming uniform acid concentrations in resist, the
relationship between acid concentration and bake time to achieve a given activation level
is given by
Or
Fig. 6 shows the resist thickness after development versus dose for different PEB
temperatures and times for both TARC and non-TARC processes. It can be seen that JSR
KRF-K2G has a very high contrast. When the PEB temperature is below 80oC, almost no
deprotection process occurs even at high exposure doses. Also, varying the temperature
by 10oC from the nominal 100oC temperature will vary the dose-to-clear by about 1
mJ/cm2. Given the nominal dose-to-clear of 16 mJ/cm2, this means the sensitivity is
(7) 0K if )1ln()]exp(1[C 21
22
ma = asthC
K
mKtmK
(8) 0K if )1ln(
.C 21
ma ==
K
Ct asth

varied by about 6%. When the PEB time is doubled, the dose-to-clear is reduced by 1
mJ/cm2 which corresponds to a sensitivity increases of about 5%.
Assuming identical resist thickness loss corresponding to identical Cas, and using
average acid concentration obtained from BLEACH as the initial Ca, we calculated the
different amount of Ca to achieve a certain resist thickness loss for different bake times.
Then fitting these Ca and times with equation (7), we were able to obtain the reaction
rate. We fitted the reaction parameters to the thickness developed in the ranges from
50nm to 450nm and obtained the reaction parameters at a PEB temperature of 100oC. The
values in Table II show a difference primarily in the K2 value.
Table II. reaction parameters when PEB temperature is 100oC.
K1 (sec-1 ) K2 (sec-1 ) m
No TARC 5.57 0.07 1
TARC 5.40 0.05 1
This indicates acid evaporation exists. As a first order approximation, the evaporation
rate Ke is the difference and is 0.02 sec-1.
Given the resist thickness loss at other PEB temperatures [6], we have obtained the
reaction parameters, which are shown in Table below.
Table III. Reaction parameters
LnK1 (sec-1) EK1 (eV) lnK2 (sec-1) EK2 (eV) m Ke (sec-1)
5.6 0.13 -0.6 0.13 1 0.02

3. Extraction of dissolution parameters
Having obtained the reaction parameters in section 2, we then extracted the
dissolution parameters by fitting the resist thickness developed versus Cas data with
equation (6) for 100oC, 60sec PEB. Note that when Cas reaches 0.9 which is enough to
clear the resist, the experimental dissolution rate saturates at 700nm/60sec 12nm/sec.
We fitted the data in the region Cas<0.9 with an optimization program that is on the basis
of Method of Feasible Direction and can reach the global optimum with certain
constraints. Finally we obtained the following dissolution parameters:
Table IV. Dissolution parameters
r0 (nm/s) a b w
3.54 2.1*10-5 0 18.12
For TARC-coated, PEB 100oC and 60sec, The resist thickness curve versus Cas
generated by the above parameters and the experimental data are both shown in Fig 7.
In order to justify the model, Fig 8 shows the thickness developed versus exposure
dose curves from experimental data and simulation with the above parameters for 100oC,
30 sec PEB, TARC-coated process. It can be seen that the two curves fit at low, moderate
and high doses. However, the transition of the experimental curve is higher
exponentially.
4. Fitting DRM data and extracting acid diffusion parameters
With the reaction rate and dissolution rate parameters obtained above, we can now fit
the dissolution rate versus depth with the DRM data and also extract the possible acid
diffusion parameters with reaction and dissolution parameters fixed. For this purpose, a

fast program capable of simulating 1-dimensional transportation-reaction systems was
developed. And the MFD optimization program described in section 3 was also applied.
Table V summaries the diffusion parameters obtained from the fitting process. Fig. 9
shows the simulation results for no-TARC resist, PEB 100oC, 60sec, it fits considerably
well with the DRM data.
Table V Diffusion parameters
D0 (nm2/s)
250 6
VI. Resist profile simulation
This anomalous behavior of JSR KRF-K2G resist without TARC may cause severe
distortion of pattern during development of the resist. An example is “T-top”. To
overcome this effect, a TARC is applied to the resist and Fig 10 shows the resist profile
after development, for TARC-coated, dose 7mJ/cm2, PEB 100oC, 60sec, develop 10sec.
VII. Conclusion
In this paper a methodology for extracting PEB and dissolution parameters is used to
deduce a model for the JSR KRF-K2G resist. PEB reaction rate and dissolution rate
versus chemical state parameters were extracted from large-area exposure and resist
thickness measurements. The simulated dissolution rate curves were then compared to the
DRM data and this allowed further modeling of acid evaporation.

Intrinsic compaction of the resist during PEB process is described. A linear scale
transform of space coordinate system is suggested for modeling this compaction
phenomenon. We also quantified the PEB temperature and time effects on resist
sensitivity. A 10 oC increase of bake temperature causes a 6% increase on sensitivity.
Doubling the bake time only increases the sensitivity by 5%. The “S-shape” dissolution
rate versus dose curve is developed using energy barrier model, which is able to explain
the dissolution of poly-vinyl phenol. Since DRM data provide very detailed information
about both PEB and dissolution effects, fitting DRM data could be a solid basis for
extracting and calibrating bake and dissolution models. The parameters extracted from
large area exposures agree with DRM data but the DRM data was independently matched
in attempting to model depth dependent effects.
Reference:
[1] H. Miyamoto, et al., “Study for the design of high resolution Novolak-DNQ
photoresist: the effects of low molecular weight phenolic compounds on resist systems”,
Proc. SPIE, Vol. 2438, 1995
[2] M. Zuniga, A. Neureuther, “Post Exposure Bake Characterization and Parameter
Extraction for Positive Deep-UV Resists through Broad Area Exposure Experiments”,
Proc. of the SPIE, Vol. 2724, 1996.
[3] B. Mortini, S. Tedesco, B. Dal’Zotto, P. Paniez, “Specific behavior of chemically
amplified systems with low activation energy under electron-beam exposure:
implementation of 248 and 193 nm resists”, J. Vac. Sci. Technol. B, 15(6), Nov/Dec
1997, pp2534-2540
[4] See papers by S. Postinkov and E. Croffie in this proceedings.
S. Postinkov et al, “A study of resolution limit due to intrinsic bias in chemically
amplified resists”,
E. Croffie et al, “New moving boundary transport model for acid diffusion in
chemically amplified resists”.
[5] A. Tritchkov, R. Jonckheere, L. Van den hove, “Use of positive and negative
chemically amplified resists in electron-beam direct-write lithography”, J. Vac. Sci.
Technol. B, 13(6), Nov/Dec 1995, pp2986-2993
[6] M. Zuniga, A. Neureuther, “Reaction Diffusion Modeling and Simulation in
Positive Deep Ultraviolet Resists”, J. Vac. Sci. Tech. B, Dec 95 (2957).
[7] T. Itani, H. Iwasaki, M. Fujimoto, K. Kasama, Proc. SPIE, 2195, 126(1994)
[8] T. Itani, H. Iwasaki, H. Yoshin, M. Fujimoto, K. Kasama, Proc SPIE, 2438,
91(1995)
[9] M. Cheng, E. Croffie, A. Neureuther, “Methodology of Modeling and simulating
line-end shortening effects in deep-UV resist”, Proc. SPIE, Vol 3678 (1999)
[10] J. Sheats, B. Smith, “Microlithography: science and technology”, Marcel Dekker
Inc., 1998

(a)
(b)
Fig. 1 Dissolution rate vs depth into JSR KRF-K2G resist. In (a), the resist is coated onbare silicon without ARC, in (b), resist is coated with top ARC.
K2G on Bare Silicon
0
10
20
30
40
50
60
70
80
90
0 100 200 300 400 500 600 700 800
z-Position [ nm ]
Dev
elo
pm
ent
Rat
e [
nm
/sec
]
0
0.7
1.4
2.1
2.8
3.5
3.7
4
4.3
4.6
4.9
5.2
5.5
5.8
6.1
6.4
6.7
7
7.3
7.6
8.8
K2G; ARC
0
100
200
300
400
500
600
700
0 100 200 300 400 500 600 700 800
z-Positon [ nm ]
Dev
elo
pm
ent
Rat
e [
nm
/sec
]
0
0.7
1.4
2.1
2.8
3.5
3.7
4
4.3
4.6
4.9
5.5
5.8
6.1
6.4
7
7.3
7.6
8.5
8.8
9.1
31.3
(a) (b)
Fig. 2 A proposed dissolution model for positive DUV chemically amplified resist. Twosituations are considered: (a) before deblocking where TMAH penetration is preventedby block group. (b) after deblocking where TMAH penetration is enhanced by absence ofblock group.
TMAH
BlockGroup
BlockGroup
BlockGroup
BlockGroup
BlockGroup
TMAH
BlockGroup
BlockGroup

Fig. 3 Unexposed resist thickness vs. PEB temperature
Unexposed resist thickness reduction varying PEB temperature
620640660680700720740760
80 90 100 110 120
Bake temperature(C)
Th
ickn
ess
(nm
)
w/o TARCw/ TARC
Ref

Fig. 4 Unexposed resist thickness vs PEB time
Unexposed resist thickness reduction varying PEB time
620640660680700720740760
30 60 120 240 480
Bake time(sec)
Th
ickn
ess
(nm
)
w/o TARC
w/ TARC
Ref

Fig 5 Acid concentration in resist, the exposure dose is 8mJ/cm2, note that there is verylittle difference between TARC-coated and non-TARC-coated layers.
0
0.005
0.01
0.015
0.02
0.025
0
68.9
138
207
276
344
413
482
551
620
689
Depth(nm)
No
rmal
ized
aci
d c
on
cen
trat
ion
w/o TARC
w/ TARC

(a) (b)
(b) (d)
Fig. 6. Resist thickness after development versus dose. The curves in (a)and (c) are for different bake temperatures. The curves in (b) and(d) are for different bake times at 100oC.
Resist thickness after develop, varying bake temperature, no TARC
0100200300400500600700800
6 10 14 18 22 26 30 34
Dose(mJ/cm^2)
Th
ickn
ess(
nm
) 20C
40C
60C
80C
90C
100C
110C
120C
Resist thickness after develop, varying bake time, no TARC
0
200
400
600
800
6 10 14 18 22 26 30 34
Dose(mJ/cm^2)
Res
ist
thic
knes
s(n
m)
30s
60s
120s
240s
480s
Resist thickness after develop, varying bake temperature, with TARC
0100200300400500600700800
6 10 14 18 22 26 30 34
Dose(mJ/cm^2)
Th
ickn
ess(
nm
) 20C
40C
60C
80C
90C
100C
110C
120C
Resist thickness after develop, varying bake time, with TARC
0
200
400
600
800
6 10 14 18 22 26 30 34
Dose(mJ/cm^2)
Res
ist
thic
knes
s(n
m)
30s
60s
120s
240s
480s

Fig. 7 Resist thickness vs Cas, PEB 100oC, 60sec. Experimental data are marked with “*”and simulated results are marked with “o”.
Dissolution rate vs. normalized activated site concentration
1
10
100
1000
10000
0.46
1451
1
0.67
3353
6
0.80
1878
9
0.87
9833
5
0.92
7115
3
0.95
5793
2
normalized activated site concentration
dis
solu
tio
n r
ate(
nm
/s)
Calculate
Experimental

Fig. 8 Resist thickness loss vs. dose curves, PEB 100oC, 30sec.
Resist thickness loss vs. dose
1
10
100
1000
6 10 14 18 22 26 30 34
Dose(mJ/cm̂ 2)
Th
ickn
ess
dev
elo
ped
(nm
)
Calculation
Experimental

Fig 9 DRM date, experimental and simulation. PEB 100oC, 60sec, dose 6.7mJ/cm2.
K2G without TARC
0
2
4
6
8
10
12
14
16
18
0 100 200 300 400 500 600 700 800
z-Position [ nm ]
Dev
elo
pm
ent
Rat
e [
nm
/sec
]
Simulation for dose6.7mJ/cm^2
DRM curve for dose6.7mJ/cm^2

Fig. 10 Resist profile simulation


