
Dashboard View Range
Starting Year 2013
Projection Period: 2012 - 2022
Cash Flow Summary FYE 2013 2014 2015 2016 2017
Revenue Under Existing Rates 1,036,086$ 1,036,483$ 1,036,897$ 1,037,321$ 1,037,755$
Revenue with Proposed Increase 1,053,186$ 1,071,025$ 1,089,230$ 1,107,800$ 1,126,745$
Annual Expenditures 979,300$ 1,061,397$ 1,078,251$ 1,099,914$ 1,126,843$
Net Cash Flow After Increase 73,885$ 9,628$ 10,978$ 7,886$ (99)$
Rate Increase
original annual increase 2.00% 2.00% 2.00% 2.00% 2.00%
Quick Adjustment Panel FYE 2013 2014 2015 2016 2017
Economic Assumptions
General Cost Inflation
original 2.50% 2.50% 2.50% 2.50% 2.50%
Construction Cost Inflation
original 3.00% 3.00% 3.00% 3.00% 3.00%
Labor Cost Inflation
original 2.50% 2.50% 2.50% 2.50% 2.50%
Customer Growth
original 0.00% 0.00% 0.00% 0.00% 0.00%
Benefits
original 3.50% 3.50% 3.50% 3.50% 3.50%
Fund Earnings
original 1.00% 1.00% 1.00% 1.00% 1.00%
Quick Adjustment Panel FYE 2013 2014 2015 2016 2017
System Reinvestment 4 - System Reinvestment is not Funded
Enter a %
original 100% 100% 100% 100% 100%
Enter a $ amount
original -$ -$ -$ -$ -$
Bill Calculator FYE 2013 2014 2015 2016 2017
Meter Size 3/4" 4,200
Base Charge 31.35$ 31.98$ 32.62$ 33.27$ 33.94$
Volume Charge 8.57 8.74 8.91 9.09 9.27
Total 39.92$ 40.72$ 41.54$ 42.37$ 43.21$
Monthly Usage (gallons)
$900,000
$950,000
$1,000,000
$1,050,000
$1,100,000
$1,150,000
2013 2014 2015 2016 2017
Revenue Requirement
Annual Expenditures Revenue Under Existing Rates Revenue with Proposed Increase
$41.54
$42.37
$43.21
$42
$43
$44
Mo
nth
ly R
ate
Typical Single Family Rate
$-
$100,000
$200,000
$300,000
$400,000
$500,000
$600,000
2013 2014 2015 2016 2017
Fund Balances
Operating Fund Capital Fund Debt Reserve Target Balance
Model Dashboard
60 60 60 60 58
0
10
20
30
40
50
60
70
2013 2014 2015 2016 2017
Days of O & M
Target Range
City of Petersburg, AlaskaWater UtilitySummary
FY Ending
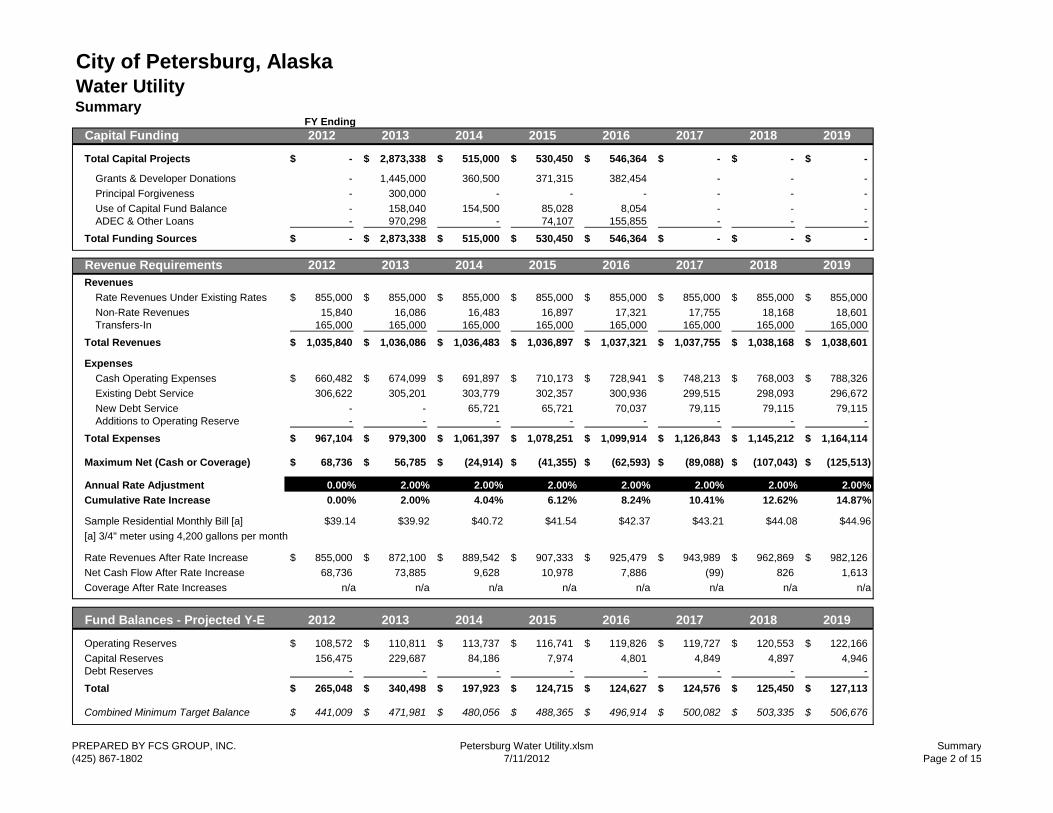
Capital Funding 2012 2013 2014 2015 2016 2017 2018 2019
Total Capital Projects -$ 2,873,338$ 515,000$ 530,450$ 546,364$ -$ -$ -$
Grants & Developer Donations - 1,445,000 360,500 371,315 382,454 - - -
Principal Forgiveness - 300,000 - - - - - -
Use of Capital Fund Balance - 158,040 154,500 85,028 8,054 - - -
ADEC & Other Loans - 970,298 - 74,107 155,855 - - -
Total Funding Sources -$ 2,873,338$ 515,000$ 530,450$ 546,364$ -$ -$ -$
Revenue Requirements 2012 2013 2014 2015 2016 2017 2018 2019
Revenues
Rate Revenues Under Existing Rates 855,000$ 855,000$ 855,000$ 855,000$ 855,000$ 855,000$ 855,000$ 855,000$
Non-Rate Revenues 15,840 16,086 16,483 16,897 17,321 17,755 18,168 18,601
Transfers-In 165,000 165,000 165,000 165,000 165,000 165,000 165,000 165,000
Total Revenues 1,035,840$ 1,036,086$ 1,036,483$ 1,036,897$ 1,037,321$ 1,037,755$ 1,038,168$ 1,038,601$
Expenses
Cash Operating Expenses 660,482$ 674,099$ 691,897$ 710,173$ 728,941$ 748,213$ 768,003$ 788,326$
Existing Debt Service 306,622 305,201 303,779 302,357 300,936 299,515 298,093 296,672
New Debt Service - - 65,721 65,721 70,037 79,115 79,115 79,115
Additions to Operating Reserve - - - - - - - -
Total Expenses 967,104$ 979,300$ 1,061,397$ 1,078,251$ 1,099,914$ 1,126,843$ 1,145,212$ 1,164,114$
Maximum Net (Cash or Coverage) 68,736$ 56,785$ (24,914)$ (41,355)$ (62,593)$ (89,088)$ (107,043)$ (125,513)$
Annual Rate Adjustment 0.00% 2.00% 2.00% 2.00% 2.00% 2.00% 2.00% 2.00%
Cumulative Rate Increase 0.00% 2.00% 4.04% 6.12% 8.24% 10.41% 12.62% 14.87%
Sample Residential Monthly Bill [a] $39.14 $39.92 $40.72 $41.54 $42.37 $43.21 $44.08 $44.96
[a] 3/4" meter using 4,200 gallons per month
Rate Revenues After Rate Increase 855,000$ 872,100$ 889,542$ 907,333$ 925,479$ 943,989$ 962,869$ 982,126$
Net Cash Flow After Rate Increase 68,736 73,885 9,628 10,978 7,886 (99) 826 1,613
Coverage After Rate Increases n/a n/a n/a n/a n/a n/a n/a n/a
Fund Balances - Projected Y-E 2012 2013 2014 2015 2016 2017 2018 2019
Operating Reserves 108,572$ 110,811$ 113,737$ 116,741$ 119,826$ 119,727$ 120,553$ 122,166$
Capital Reserves 156,475 229,687 84,186 7,974 4,801 4,849 4,897 4,946
Debt Reserves - - - - - - - -
Total 265,048$ 340,498$ 197,923$ 124,715$ 124,627$ 124,576$ 125,450$ 127,113$
Combined Minimum Target Balance 441,009$ 471,981$ 480,056$ 488,365$ 496,914$ 500,082$ 503,335$ 506,676$
PREPARED BY FCS GROUP, INC.
(425) 867-1802
Petersburg Water Utility.xlsm
7/11/2012
Summary
Page 2 of 15

City of Petersburg, AlaskaWater UtilityAssumptions
Economic & Financial Factors FYE 2012 2013 2014 2015 2016 2017 2018 2019
1 General Cost Inflation Anchorage 4-yr Avg. CPI 2.50% 2.50% 2.50% 2.50% 2.50% 2.50% 2.50%
2 Construction Cost Inflation 3.00% 3.00% 3.00% 3.00% 3.00% 3.00% 3.00%
3 Labor Cost Inflation 2.50% 2.50% 2.50% 2.50% 2.50% 2.50% 2.50%
4 Customer Growth per email 0.00% 0.00% 0.00% 0.00% 0.00% 0.00% 0.00%
5 General Inflation plus Growth 2.50% 2.50% 2.50% 2.50% 2.50% 2.50% 2.50%
6 Benefits 3.50% 3.50% 3.50% 3.50% 3.50% 3.50% 3.50%
7 Other Escalation 0.00% 0.00% 0.00% 0.00% 0.00% 0.00% 0.00%
8 No Escalation 0.00% 0.00% 0.00% 0.00% 0.00% 0.00% 0.00%
Fund Earnings per email 1.00% 1.00% 1.00% 1.00% 1.00% 1.00% 1.00% 1.00%
Accounting Assumptions FYE 2012 2013 2014 2015 2016 2017 2018 2019
FISCAL POLICY RESTRICTIONS
Min. Op. Fund Balance Target (days of O&M expense) 60 60 60 60 60 60 60 60
Max. Op. Fund Balance (days of O&M expense) 60 60 60 60 60 60 60 60
Minimum Capital Fund Balance Target
Select Minimum Capital Fund Balance Target 1 Defined as % of Plant
1 - Defined as % of Plant
Plant-in-Service in 2011 [a] 33,243,655$
Minimum Capital Fund Balance - % of plant assets 1.00% 1.00% 1.00% 1.00% 1.00% 1.00% 1.00% 1.00%
332,437$ 361,170$ 366,320$ 371,624$ 377,088$ 377,088$ 377,088$ 377,088$
2 - Amount at Right ==> -$ -$ -$ -$ -$ -$ -$ -$
[a] Fixed assets records as of June 30, 2011
RATE FUNDED SYSTEM REINVESTMENT
Select Reinvestment Funding Strategy 4 System Reinvestment is not Funded
Amount of Annual Cash Funding from Rates
1 - Equal to Annual Depreciation Expense
2 - Equal to Annual Depreciation Expense less Annual Debt Principal Payments
3 - Equal to Amount at Right ==> -$ -$ -$ -$ -$ -$ -$ -$
4 - Do Not Fund System Reinvestment 100% 100% 100% 100% 100% 100% 100% 100%
PREPARED BY FCS GROUP, INC.
(425) 867-1802
Petersburg Water Utility.xlsm
7/11/2012
Assumptions
Page 3 of 15

City of Petersburg, AlaskaWater UtilityAssumptions
Capital Financing Assumptions FYE 2012 2013 2014 2015 2016 2017 2018 2019
ALASKA MUNICIPAL BOND BANK - REVENUE BONDS
Term (years) 20 20 20 20 20 20 20 20
Interest Cost 3.25% 3.25% 3.25% 3.25% 3.25% 4.25% 4.25% 4.25%
Issuance Cost 0.00% 0.00% 0.00% 0.00% 0.00% 0.00% 0.00% 0.00%
Target Revenue Bond Coverage 1.25
ADEC & OTHER LOANS
Term (years) 20 20 20 20 20 20 20 20
Interest Cost 1.50% 1.50% 1.50% 1.50% 1.50% 1.50% 1.50% 1.50%
Issuance Cost 0.00% 0.00% 0.00% 0.00% 0.00% 0.00% 0.00% 0.00%
PREPARED BY FCS GROUP, INC.
(425) 867-1802
Petersburg Water Utility.xlsm
7/11/2012
Assumptions
Page 4 of 15

City of Petersburg, AlaskaWater UtilityExisting Debt Input
Existing Debt Service - Revenue Bonds FYE 2012 2013 2014 2015 2016 2017 2018 2019
REVENUE BOND 1
Annual Interest Payment -$ -$ -$ -$ -$ -$ -$ -$
Annual Principal Payment - - - - - - - -
Total Annual Payment -$ -$ -$ -$ -$ -$ -$ -$
Use of Debt reserve for Debt Service - - - - - - - -
REVENUE BOND 2
Annual Interest Payment -$ -$ -$ -$ -$ -$ -$ -$
Annual Principal Payment - - - - - - - -
Total Annual Payment -$ -$ -$ -$ -$ -$ -$ -$
Use of Debt reserve for Debt Service - - - - - - - -
REVENUE BOND 3
Annual Interest Payment -$ -$ -$ -$ -$ -$ -$ -$
Annual Principal Payment - - - - - - - -
Total Annual Payment -$ -$ -$ -$ -$ -$ -$ -$
Use of Debt reserve for Debt Service - - - - - - - -
REVENUE BOND 4
Annual Interest Payment -$ -$ -$ -$ -$ -$ -$ -$
Annual Principal Payment - - - - - - - -
Total Annual Payment -$ -$ -$ -$ -$ -$ -$ -$
Use of Debt reserve for Debt Service - - - - - - - -
TOTAL REVENUE BONDS
Annual Interest Payment -$ -$ -$ -$ -$ -$ -$ -$
Annual Principal Payment - - - - - - - -
Total Annual Payment -$ -$ -$ -$ -$ -$ -$ -$
Use of Debt reserve for Debt Service - - - - - - - -
Annual Debt Reserve Target on Existing Revenue Bonds - - - - - - - -
PREPARED BY FCS GROUP, INC.
(425) 867-1802
Petersburg Water Utility.xlsm
7/11/2012
Existing Debt
Page 5 of 15

City of Petersburg, AlaskaWater UtilityExisting Debt Input
Existing Debt Service - State Loans FYE 2012 2013 2014 2015 2016 2017 2018 2019
Scow Bay Water Extension - ADEC Loan 685041
Annual Interest Payment 23,015$ 21,525$ 20,013$ 18,478$ 16,921$ 15,340$ 13,735$ 12,106$
Annual Principal Payment 99,305 100,795 102,307 103,841 105,399 106,980 108,585 110,214
Total Annual Payment 122,320$ 122,320$ 122,320$ 122,319$ 122,320$ 122,320$ 122,320$ 122,320$
Cabin Creek Water Project - ADEC Loan 685021
Annual Interest Payment 12,793$ 11,372$ 9,950$ 8,529$ 7,107$ 5,686$ 4,264$ 2,843$
Annual Principal Payment 94,766 94,766 94,766 94,766 94,766 94,766 94,766 94,766
Total Annual Payment 107,559$ 106,138$ 104,716$ 103,295$ 101,873$ 100,452$ 99,030$ 97,609$
Water Treatment Upgrade - ADEC Loan 685051
Annual Interest Payment 18,041$ 17,161$ 16,267$ 15,360$ 14,439$ 13,505$ 12,556$ 11,593$
Annual Principal Payment 58,702 59,582 60,476 61,383 62,304 63,239 64,187 65,150
Total Annual Payment 76,743$ 76,743$ 76,743$ 76,743$ 76,743$ 76,743$ 76,743$ 76,743$
Water Upgrades Project - ADEC Loan 685251 [a]
Amount of Loan
Annual Interest Payment -$ -$ -$ -$ -$ -$ -$
Annual Principal Payment - - - - - - -
Total Annual Payment -$ -$ -$ -$ -$ -$ -$
Water Treatment Plant Upgrades, Phase III - ADEC Loan 685241 [a]
Full Amount of Loan
less: Principal Forgiveness (50%) -
Loan to be Repaid -$
Annual Interest Payment -$ -$ -$ -$ -$ -$ -$
Annual Principal Payment - - - - - - -
Total Annual Payment -$ -$ -$ -$ -$ -$ -$
TOTAL STATE LOANS
Annual Interest Payment 53,849$ 50,058$ 46,230$ 42,367$ 38,467$ 34,531$ 30,555$ 26,542$
Annual Principal Payment 252,773 255,143 257,549 259,990 262,469 264,985 267,538 270,130
Total Annual Payment 306,622$ 305,201$ 303,779$ 302,357$ 300,936$ 299,515$ 298,093$ 296,672$
[a] Repayment to begin one year after completion of project. Per loan agreement, repayment will either be with equal annual principal payments or equal annual total
payments, with the latter option shown in the above schedule.
PREPARED BY FCS GROUP, INC.
(425) 867-1802
Petersburg Water Utility.xlsm
7/11/2012
Existing Debt
Page 6 of 15
City of Petersburg, AlaskaWater UtilityOperating Revenue and Expenditure Forecast
Actual Budget Budget Projection Projection Projection Projection Projection Projection
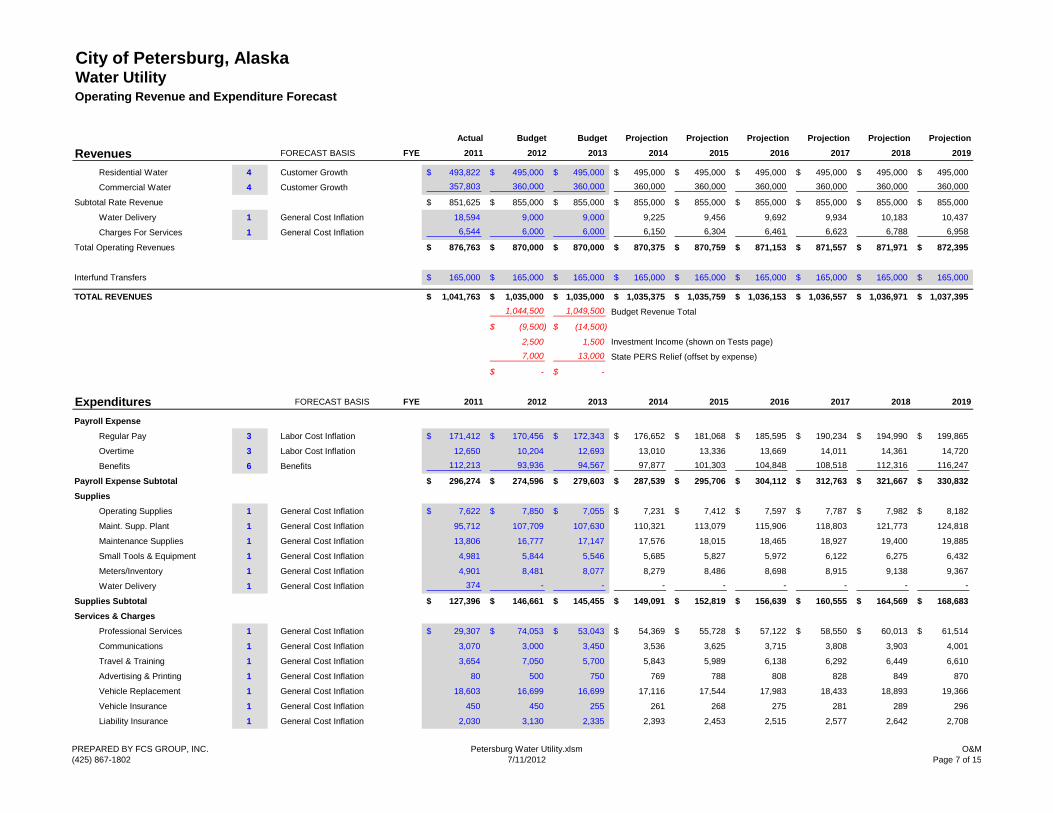
Revenues FORECAST BASIS FYE 2011 2012 2013 2014 2015 2016 2017 2018 2019
Residential Water 4 Customer Growth 493,822$ 495,000$ 495,000$ 495,000$ 495,000$ 495,000$ 495,000$ 495,000$ 495,000$
Commercial Water 4 Customer Growth 357,803 360,000 360,000 360,000 360,000 360,000 360,000 360,000 360,000
Subtotal Rate Revenue 851,625$ 855,000$ 855,000$ 855,000$ 855,000$ 855,000$ 855,000$ 855,000$ 855,000$
Water Delivery 1 General Cost Inflation 18,594 9,000 9,000 9,225 9,456 9,692 9,934 10,183 10,437
Charges For Services 1 General Cost Inflation 6,544 6,000 6,000 6,150 6,304 6,461 6,623 6,788 6,958
Total Operating Revenues 876,763$ 870,000$ 870,000$ 870,375$ 870,759$ 871,153$ 871,557$ 871,971$ 872,395$
Interfund Transfers 165,000$ 165,000$ 165,000$ 165,000$ 165,000$ 165,000$ 165,000$ 165,000$ 165,000$
TOTAL REVENUES 1,041,763$ 1,035,000$ 1,035,000$ 1,035,375$ 1,035,759$ 1,036,153$ 1,036,557$ 1,036,971$ 1,037,395$
1,044,500 1,049,500 Budget Revenue Total
(9,500)$ (14,500)$
2,500 1,500 Investment Income (shown on Tests page)
7,000 13,000 State PERS Relief (offset by expense)
-$ -$
Expenditures FORECAST BASIS FYE 2011 2012 2013 2014 2015 2016 2017 2018 2019
Payroll Expense
Regular Pay 3 Labor Cost Inflation 171,412$ 170,456$ 172,343$ 176,652$ 181,068$ 185,595$ 190,234$ 194,990$ 199,865$
Overtime 3 Labor Cost Inflation 12,650 10,204 12,693 13,010 13,336 13,669 14,011 14,361 14,720
Benefits 6 Benefits 112,213 93,936 94,567 97,877 101,303 104,848 108,518 112,316 116,247
Payroll Expense Subtotal 296,274$ 274,596$ 279,603$ 287,539$ 295,706$ 304,112$ 312,763$ 321,667$ 330,832$
Supplies
Operating Supplies 1 General Cost Inflation 7,622$ 7,850$ 7,055$ 7,231$ 7,412$ 7,597$ 7,787$ 7,982$ 8,182$
Maint. Supp. Plant 1 General Cost Inflation 95,712 107,709 107,630 110,321 113,079 115,906 118,803 121,773 124,818
Maintenance Supplies 1 General Cost Inflation 13,806 16,777 17,147 17,576 18,015 18,465 18,927 19,400 19,885
Small Tools & Equipment 1 General Cost Inflation 4,981 5,844 5,546 5,685 5,827 5,972 6,122 6,275 6,432
Meters/Inventory 1 General Cost Inflation 4,901 8,481 8,077 8,279 8,486 8,698 8,915 9,138 9,367
Water Delivery 1 General Cost Inflation 374 - - - - - - - -
Supplies Subtotal 127,396$ 146,661$ 145,455$ 149,091$ 152,819$ 156,639$ 160,555$ 164,569$ 168,683$
Services & Charges
Professional Services 1 General Cost Inflation 29,307$ 74,053$ 53,043$ 54,369$ 55,728$ 57,122$ 58,550$ 60,013$ 61,514$
Communications 1 General Cost Inflation 3,070 3,000 3,450 3,536 3,625 3,715 3,808 3,903 4,001
Travel & Training 1 General Cost Inflation 3,654 7,050 5,700 5,843 5,989 6,138 6,292 6,449 6,610
Advertising & Printing 1 General Cost Inflation 80 500 750 769 788 808 828 849 870
Vehicle Replacement 1 General Cost Inflation 18,603 16,699 16,699 17,116 17,544 17,983 18,433 18,893 19,366
Vehicle Insurance 1 General Cost Inflation 450 450 255 261 268 275 281 289 296
Liability Insurance 1 General Cost Inflation 2,030 3,130 2,335 2,393 2,453 2,515 2,577 2,642 2,708
PREPARED BY FCS GROUP, INC.
(425) 867-1802
Petersburg Water Utility.xlsm
7/11/2012
O&M
Page 7 of 15
City of Petersburg, AlaskaWater UtilityOperating Revenue and Expenditure Forecast
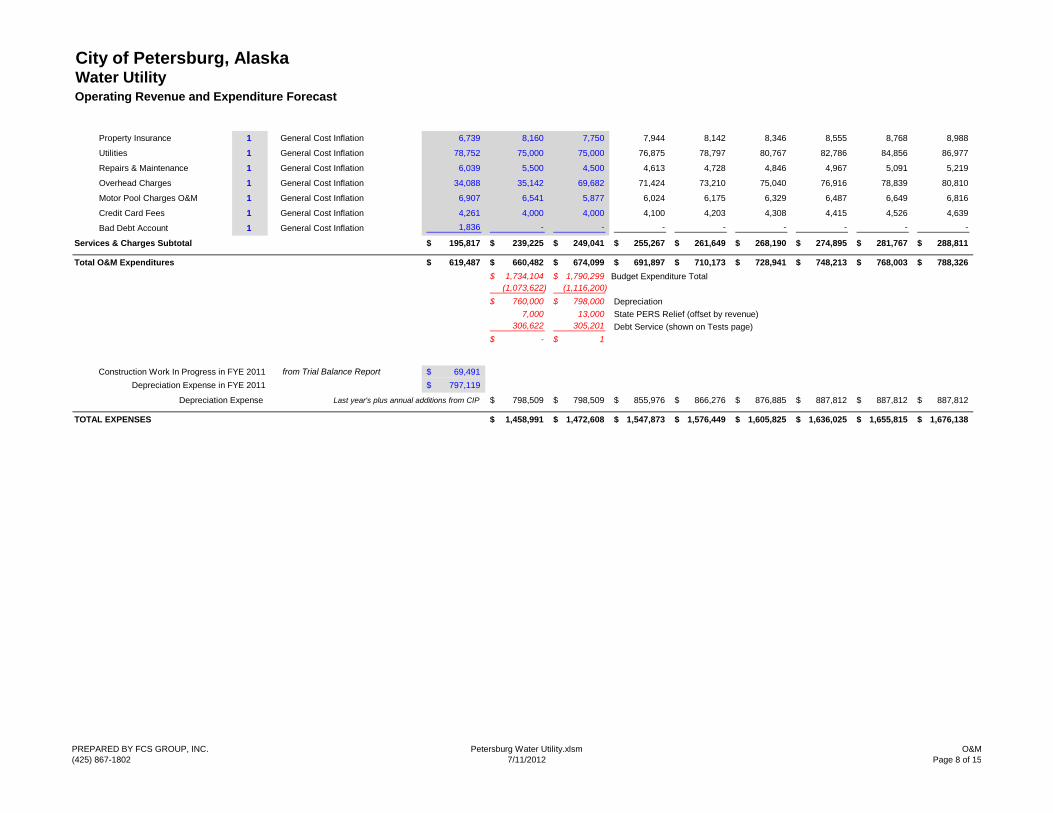
Property Insurance 1 General Cost Inflation 6,739 8,160 7,750 7,944 8,142 8,346 8,555 8,768 8,988
Utilities 1 General Cost Inflation 78,752 75,000 75,000 76,875 78,797 80,767 82,786 84,856 86,977
Repairs & Maintenance 1 General Cost Inflation 6,039 5,500 4,500 4,613 4,728 4,846 4,967 5,091 5,219
Overhead Charges 1 General Cost Inflation 34,088 35,142 69,682 71,424 73,210 75,040 76,916 78,839 80,810
Motor Pool Charges O&M 1 General Cost Inflation 6,907 6,541 5,877 6,024 6,175 6,329 6,487 6,649 6,816
Credit Card Fees 1 General Cost Inflation 4,261 4,000 4,000 4,100 4,203 4,308 4,415 4,526 4,639
Bad Debt Account 1 General Cost Inflation 1,836 - - - - - - - -
Services & Charges Subtotal 195,817$ 239,225$ 249,041$ 255,267$ 261,649$ 268,190$ 274,895$ 281,767$ 288,811$
Total O&M Expenditures 619,487$ 660,482$ 674,099$ 691,897$ 710,173$ 728,941$ 748,213$ 768,003$ 788,326$
1,734,104$ 1,790,299$ Budget Expenditure Total
(1,073,622) (1,116,200)
760,000$ 798,000$ Depreciation
7,000 13,000 State PERS Relief (offset by revenue)
306,622 305,201 Debt Service (shown on Tests page)
-$ 1$
Construction Work In Progress in FYE 2011 from Trial Balance Report 69,491$
Depreciation Expense in FYE 2011 797,119$
Depreciation Expense Last year's plus annual additions from CIP 798,509$ 798,509$ 855,976$ 866,276$ 876,885$ 887,812$ 887,812$ 887,812$
TOTAL EXPENSES 1,458,991$ 1,472,608$ 1,547,873$ 1,576,449$ 1,605,825$ 1,636,025$ 1,655,815$ 1,676,138$
PREPARED BY FCS GROUP, INC.
(425) 867-1802
Petersburg Water Utility.xlsm
7/11/2012
O&M
Page 8 of 15
City of Petersburg, AlaskaWater UtilityCapital Improvement Program
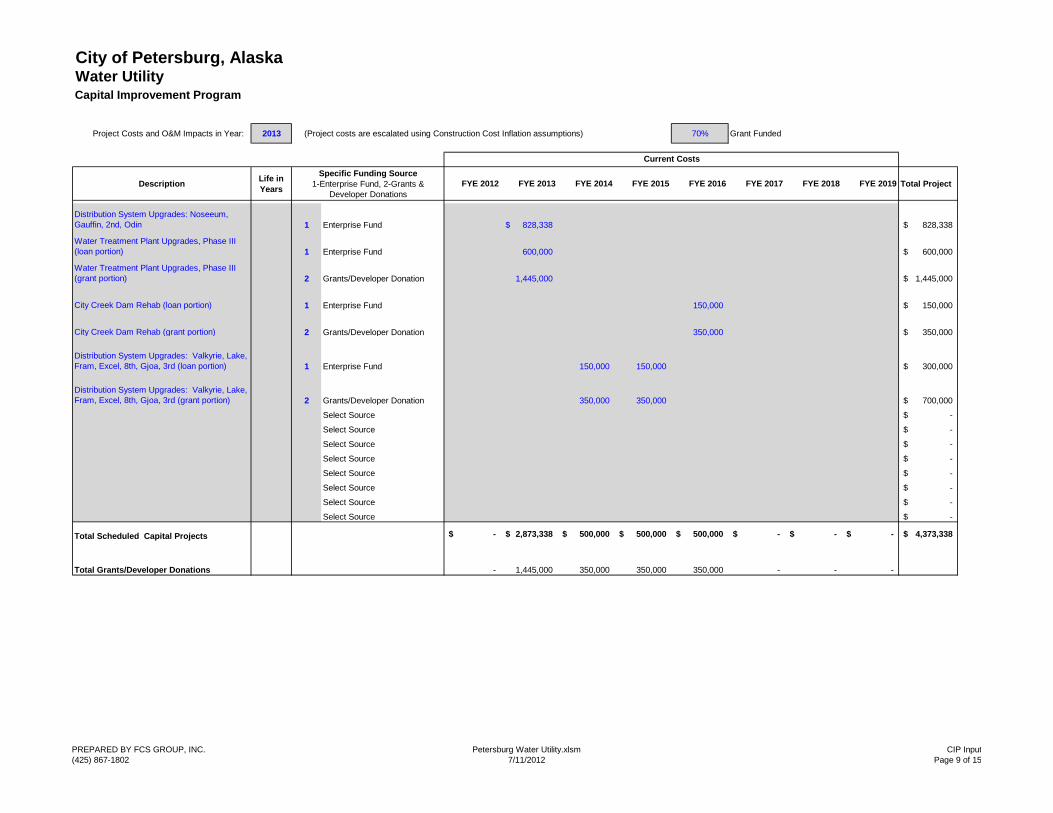
Project Costs and O&M Impacts in Year: 2013 (Project costs are escalated using Construction Cost Inflation assumptions) 70% Grant Funded
DescriptionLife in
Years
Specific Funding Source
1-Enterprise Fund, 2-Grants &
Developer Donations
FYE 2012 FYE 2013 FYE 2014 FYE 2015 FYE 2016 FYE 2017 FYE 2018 FYE 2019 Total Project
Distribution System Upgrades: Noseeum,
Gauffin, 2nd, Odin 1 Enterprise Fund 828,338$ 828,338$
Water Treatment Plant Upgrades, Phase III
(loan portion) 1 Enterprise Fund 600,000 600,000$
Water Treatment Plant Upgrades, Phase III
(grant portion) 2 Grants/Developer Donation 1,445,000 1,445,000$
City Creek Dam Rehab (loan portion) 1 Enterprise Fund 150,000 150,000$
City Creek Dam Rehab (grant portion) 2 Grants/Developer Donation 350,000 350,000$
Distribution System Upgrades: Valkyrie, Lake,
Fram, Excel, 8th, Gjoa, 3rd (loan portion) 1 Enterprise Fund 150,000 150,000 300,000$
Distribution System Upgrades: Valkyrie, Lake,
Fram, Excel, 8th, Gjoa, 3rd (grant portion) 2 Grants/Developer Donation 350,000 350,000 700,000$
Select Source -$
Select Source -$
Select Source -$
Select Source -$
Select Source -$
Select Source -$
Select Source -$
Select Source -$
Total Scheduled Capital Projects -$ 2,873,338$ 500,000$ 500,000$ 500,000$ -$ -$ -$ 4,373,338$
Total Grants/Developer Donations - 1,445,000 350,000 350,000 350,000 - - -
Current Costs
PREPARED BY FCS GROUP, INC.
(425) 867-1802
Petersburg Water Utility.xlsm
7/11/2012
CIP Input
Page 9 of 15
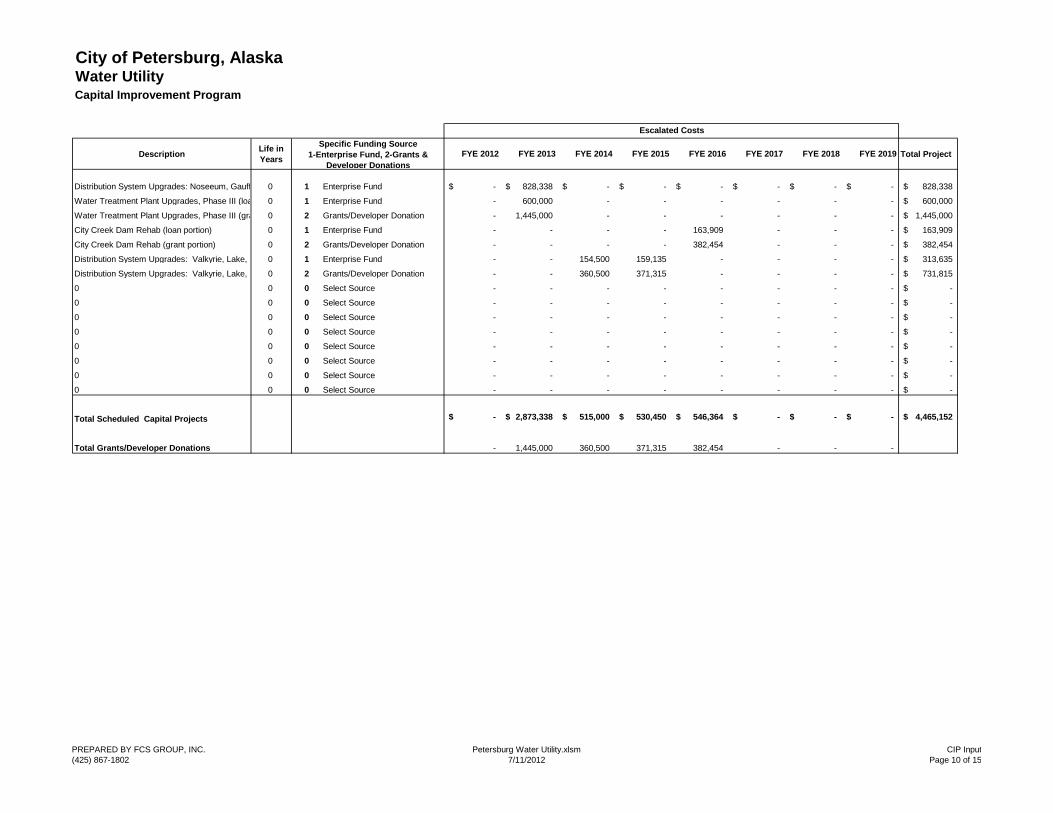
City of Petersburg, AlaskaWater UtilityCapital Improvement Program
DescriptionLife in
Years
Specific Funding Source
1-Enterprise Fund, 2-Grants &
Developer Donations
FYE 2012 FYE 2013 FYE 2014 FYE 2015 FYE 2016 FYE 2017 FYE 2018 FYE 2019 Total Project
Distribution System Upgrades: Noseeum, Gauffin, 2nd, Odin0 1 Enterprise Fund -$ 828,338$ -$ -$ -$ -$ -$ -$ 828,338$
Water Treatment Plant Upgrades, Phase III (loan portion)0 1 Enterprise Fund - 600,000 - - - - - - 600,000$
Water Treatment Plant Upgrades, Phase III (grant portion)0 2 Grants/Developer Donation - 1,445,000 - - - - - - 1,445,000$
City Creek Dam Rehab (loan portion) 0 1 Enterprise Fund - - - - 163,909 - - - 163,909$
City Creek Dam Rehab (grant portion) 0 2 Grants/Developer Donation - - - - 382,454 - - - 382,454$
Distribution System Upgrades: Valkyrie, Lake, Fram, Excel, 8th, Gjoa, 3rd (loan portion)0 1 Enterprise Fund - - 154,500 159,135 - - - - 313,635$
Distribution System Upgrades: Valkyrie, Lake, Fram, Excel, 8th, Gjoa, 3rd (grant portion)0 2 Grants/Developer Donation - - 360,500 371,315 - - - - 731,815$
0 0 0 Select Source - - - - - - - - -$
0 0 0 Select Source - - - - - - - - -$
0 0 0 Select Source - - - - - - - - -$
0 0 0 Select Source - - - - - - - - -$
0 0 0 Select Source - - - - - - - - -$
0 0 0 Select Source - - - - - - - - -$
0 0 0 Select Source - - - - - - - - -$
0 0 0 Select Source - - - - - - - - -$
Total Scheduled Capital Projects -$ 2,873,338$ 515,000$ 530,450$ 546,364$ -$ -$ -$ 4,465,152$
Total Grants/Developer Donations - 1,445,000 360,500 371,315 382,454 - - -
Escalated Costs
PREPARED BY FCS GROUP, INC.
(425) 867-1802
Petersburg Water Utility.xlsm
7/11/2012
CIP Input
Page 10 of 15

City of Petersburg, AlaskaWater UtilityCapital Funding Analysis
Summary of Expenditures FYE 2012 2013 2014 2015 2016 2017 2018 2019
TOTAL CAPITAL EXPENDITURES -$ 2,873,338$ 515,000$ 530,450$ 546,364$ -$ -$ -$
Capital Financing Plan FYE 2012 2013 2014 2015 2016 2017 2018 2019
Project Specific Grants / Developer Donations -$ 1,445,000$ 360,500$ 371,315$ 382,454$ -$ -$ -$
Project to be Funded - 1,428,338 154,500 159,135 163,909 - - -
OTHER FUNDING SOURCES
Principal Forgiveness 300,000$
Capital Fund Balance - 158,040 154,500 85,028 8,054 - - -
ADEC & Other Loans [NOTE A] - 970,298 - 74,107 155,855 - - -
Alaska Municipal Bond Bank Revenue Bonds
Rates - - - - - - - -
Total -$ 1,428,338$ 154,500$ 159,135$ 163,909$ -$ -$ -$
TOTAL CAPITAL RESOURCES -$ 2,873,338$ 515,000$ 530,450$ 546,364$ -$ -$ -$
Info: Capital Contingency Deficit (175,961) (131,483) (282,134) (363,651) (372,287) (372,239) (372,191) (372,142)
NOTE A: USER INPUT FOR ADEC & OTHER LOANS
Select Amount of Loan Proceeds: 2 1 2 2 2 2 2 2
Calculated Input Calculated Calculated Calculated Calculated Calculated Calculated
1 - Amounts at Right ==> -$ 1,128,338$ -$ -$ -$ -$ -$ -$
2 - Calculated by the Model
New Debt Computations FYE 2012 2013 2014 2015 2016 2017 2018 2019
REVENUE BONDS
Amount to Fund -$ -$ -$ -$ -$ -$ -$ -$
Issuance Costs - - - - - - - -
Reserve Required - - - - - - - -
Amount of Debt Issue -$ -$ -$ -$ -$ -$ -$ -$
ADEC & OTHER LOANS
Amount to Fund -$ 1,128,338$ -$ 74,107$ 155,855$ -$ -$ -$
Issuance Costs - - - - - - - -
Amount of Debt Issue -$ 1,128,338$ -$ 74,107$ 155,855$ -$ -$ -$
PREPARED BY FCS GROUP, INC.
(425) 867-1802
Petersburg Water Utility.xlsm
7/11/2012
Capital Funding
Page 11 of 15

City of Petersburg, AlaskaWater UtilityCapital Funding Analysis
Debt Service Summary FYE 2012 2013 2014 2015 2016 2017 2018 2019
EXISTING DEBT SERVICE
Annual Interest Payments 53,849$ 50,058$ 46,230$ 42,367$ 38,467$ 34,531$ 30,555$ 26,542$
Annual Principal Payments 252,773 255,143 257,549 259,990 262,469 264,985 267,538 270,130
Total Debt Service Payments 306,622$ 305,201$ 303,779$ 302,357$ 300,936$ 299,515$ 298,093$ 296,672$
Revenue Bond Payments Only - - - - - - - -
NEW DEBT SERVICE
Annual Interest Payments -$ -$ 16,193$ 15,450$ 15,661$ 16,770$ 15,835$ 14,886$
Annual Principal Payments - - 49,528 50,271 54,376 62,345 63,280 64,230
Total Debt Service Payments -$ -$ 65,721$ 65,721$ 70,037$ 79,115$ 79,115$ 79,115$
Revenue Bond Payments Only - - - - - - - -
TOTAL DEBT SERVICE PAYMENTS 306,622$ 305,201$ 369,500$ 368,078$ 370,974$ 378,630$ 377,208$ 375,787$
Total Interest Payments 53,849 50,058 62,423 57,817 54,129 51,301 46,390 41,428
Total Principal Payments 252,773 255,143 307,077 310,261 316,845 327,330 330,819 334,360
Total Revenue Bond Payments Only - - - - - - - -
PREPARED BY FCS GROUP, INC.
(425) 867-1802
Petersburg Water Utility.xlsm
7/11/2012
Capital Funding
Page 12 of 15
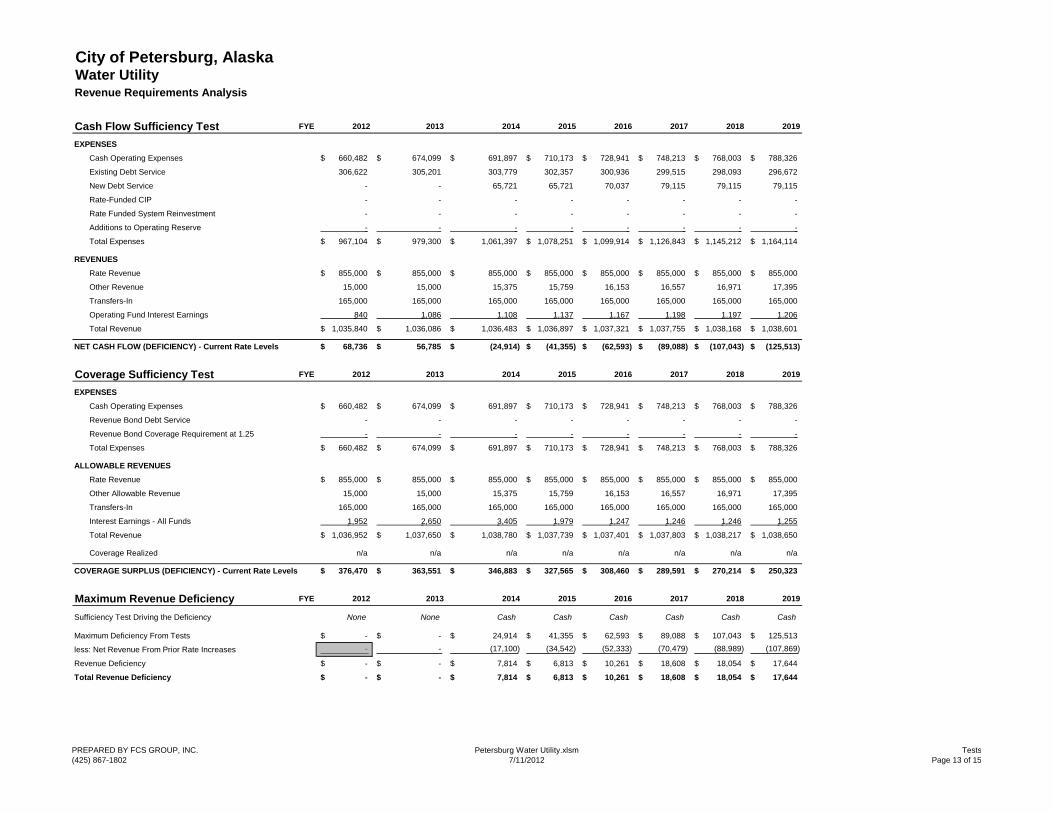
City of Petersburg, AlaskaWater UtilityRevenue Requirements Analysis
Cash Flow Sufficiency Test FYE 2012 2013 2014 2015 2016 2017 2018 2019
EXPENSES
Cash Operating Expenses 660,482$ 674,099$ 691,897$ 710,173$ 728,941$ 748,213$ 768,003$ 788,326$
Existing Debt Service 306,622 305,201 303,779 302,357 300,936 299,515 298,093 296,672
New Debt Service - - 65,721 65,721 70,037 79,115 79,115 79,115
Rate-Funded CIP - - - - - - - -
Rate Funded System Reinvestment - - - - - - - -
Additions to Operating Reserve - - - - - - - -
Total Expenses 967,104$ 979,300$ 1,061,397$ 1,078,251$ 1,099,914$ 1,126,843$ 1,145,212$ 1,164,114$
REVENUES
Rate Revenue 855,000$ 855,000$ 855,000$ 855,000$ 855,000$ 855,000$ 855,000$ 855,000$
Other Revenue 15,000 15,000 15,375 15,759 16,153 16,557 16,971 17,395
Transfers-In 165,000 165,000 165,000 165,000 165,000 165,000 165,000 165,000
Operating Fund Interest Earnings 840 1,086 1,108 1,137 1,167 1,198 1,197 1,206
Total Revenue 1,035,840$ 1,036,086$ 1,036,483$ 1,036,897$ 1,037,321$ 1,037,755$ 1,038,168$ 1,038,601$
NET CASH FLOW (DEFICIENCY) - Current Rate Levels 68,736$ 56,785$ (24,914)$ (41,355)$ (62,593)$ (89,088)$ (107,043)$ (125,513)$
Coverage Sufficiency Test FYE 2012 2013 2014 2015 2016 2017 2018 2019
EXPENSES
Cash Operating Expenses 660,482$ 674,099$ 691,897$ 710,173$ 728,941$ 748,213$ 768,003$ 788,326$
Revenue Bond Debt Service - - - - - - - -
Revenue Bond Coverage Requirement at 1.25 - - - - - - - -
Total Expenses 660,482$ 674,099$ 691,897$ 710,173$ 728,941$ 748,213$ 768,003$ 788,326$
ALLOWABLE REVENUES
Rate Revenue 855,000$ 855,000$ 855,000$ 855,000$ 855,000$ 855,000$ 855,000$ 855,000$
Other Allowable Revenue 15,000 15,000 15,375 15,759 16,153 16,557 16,971 17,395
Transfers-In 165,000 165,000 165,000 165,000 165,000 165,000 165,000 165,000
Interest Earnings - All Funds 1,952 2,650 3,405 1,979 1,247 1,246 1,246 1,255
Total Revenue 1,036,952$ 1,037,650$ 1,038,780$ 1,037,739$ 1,037,401$ 1,037,803$ 1,038,217$ 1,038,650$
Coverage Realized n/a n/a n/a n/a n/a n/a n/a n/a
COVERAGE SURPLUS (DEFICIENCY) - Current Rate Levels 376,470$ 363,551$ 346,883$ 327,565$ 308,460$ 289,591$ 270,214$ 250,323$
Maximum Revenue Deficiency FYE 2012 2013 2014 2015 2016 2017 2018 2019
Sufficiency Test Driving the Deficiency None None Cash Cash Cash Cash Cash Cash
Maximum Deficiency From Tests -$ -$ 24,914$ 41,355$ 62,593$ 89,088$ 107,043$ 125,513$
less: Net Revenue From Prior Rate Increases - - (17,100) (34,542) (52,333) (70,479) (88,989) (107,869)
Revenue Deficiency -$ -$ 7,814$ 6,813$ 10,261$ 18,608$ 18,054$ 17,644$
Total Revenue Deficiency -$ -$ 7,814$ 6,813$ 10,261$ 18,608$ 18,054$ 17,644$
PREPARED BY FCS GROUP, INC.
(425) 867-1802
Petersburg Water Utility.xlsm
7/11/2012
Tests
Page 13 of 15

City of Petersburg, AlaskaWater UtilityRevenue Requirements Analysis
Rate Increases FYE 2012 2013 2014 2015 2016 2017 2018 2019
Rate Revenue with no Increase 855,000$ 855,000$ 855,000$ 855,000$ 855,000$ 855,000$ 855,000$ 855,000$
Revenues from Prior Rate Increases - - 17,100 34,542 52,333 70,479 88,989 107,869
Rate Revenue Before Rate Increase (Incl. previous increases) 855,000 855,000 872,100 889,542 907,333 925,479 943,989 962,869
Required Annual Rate Increase 0.00% 0.00% 0.90% 0.77% 1.13% 2.01% 1.91% 1.83%
Number of Months New Rates Will Be In Effect 12 12 12 12 12 12 12 12
Info: Percentage Increase to Generate Required Revenue 0.00% 0.00% 0.90% 0.77% 1.13% 2.01% 1.91% 1.83%
Policy Induced Rate Increases 0.00% 2.00% 2.00% 2.00% 2.00% 2.00% 2.00% 2.00%
ANNUAL RATE INCREASE 0.00% 2.00% 2.00% 2.00% 2.00% 2.00% 2.00% 2.00%
CUMULATIVE RATE INCREASE 0.00% 2.00% 4.04% 6.12% 8.24% 10.41% 12.62% 14.87%
Sample Residential Monthly Bill [a] $39.14 $39.92 $40.72 $41.54 $42.37 $43.21 $44.08 $44.96
[a] 3/4" meter using 4,200 gallons per month
Impacts of Rate Increases FYE 2012 2013 2014 2015 2016 2017 2018 2019
Rate Revenues After Rate Increase 855,000$ 872,100$ 889,542$ 907,333$ 925,479$ 943,989$ 962,869$ 982,126$
Full Year Rate Revenues After Rate Increase 855,000 872,100 889,542 907,333 925,479 943,989 962,869 982,126
Net Cash Flow After Rate Increase 68,736 73,885 9,628 10,978 7,886 (99) 826 1,613
Coverage After Rate Increase n/a n/a n/a n/a n/a n/a n/a n/a
Minimum Coverage for New Bond Issuances 1.25 1.25 1.25 1.25 1.25 1.25 1.25 1.25
2012 2013 2014 2015 2016 2017 2018 2019
Projected Rate Revenues w/o Any Rate Increase 855,000$ 855,000$ 855,000$ 855,000$ 855,000$ 855,000$ 855,000$ 855,000$
Additional Revenues From 2012 Rate Increase - - - - - - - -
Additional Revenues From 2013 Rate Increase 17,100 17,100 17,100 17,100 17,100 17,100 17,100
Additional Revenues From 2014 Rate Increase 17,442 17,442 17,442 17,442 17,442 17,442
Additional Revenues From 2015 Rate Increase 17,791 17,791 17,791 17,791 17,791
Additional Revenues From 2016 Rate Increase 18,147 18,147 18,147 18,147
Additional Revenues From 2017 Rate Increase 18,510 18,510 18,510
Additional Revenues From 2018 Rate Increase 18,880 18,880
Additional Revenues From 2019 Rate Increase 19,257
Total Additional Revenues From Rate Increases -$ 17,100$ 34,542$ 52,333$ 70,479$ 88,989$ 107,869$ 127,126$
EFFECTIVE RATE REVENUES AFTER RATE INCREASE 855,000$ 872,100$ 889,542$ 907,333$ 925,479$ 943,989$ 962,869$ 982,126$
Adjustment for Partial Year Increase - - - - - - - -
PREPARED BY FCS GROUP, INC.
(425) 867-1802
Petersburg Water Utility.xlsm
7/11/2012
Tests
Page 14 of 15

City of Petersburg, AlaskaWater UtilityFund Activity
WATER FUND 420 FYE 2012 2013 2014 2015 2016 2017 2018 2019
OPERATING RESERVES
Beginning Balance [a] 83,985$ 108,572$ 110,811$ 113,737$ 116,741$ 119,826$ 119,727$ 120,553$
plus: Net Cash Flow after Rate Increase 68,736 73,885 9,628 10,978 7,886 (99) 826 1,613
less: Transfer of Surplus to Capital Fund (44,148) (71,647) (6,702) (7,974) (4,801) - - -
Ending Balance 108,572$ 110,811$ 113,737$ 116,741$ 119,826$ 119,727$ 120,553$ 122,166$
Minimum Target Balance 108,572 110,811 113,737 116,741 119,826 122,994 126,247 129,588
Maximum Funds to be Kept as Operating Reserves 108,572 110,811 113,737 116,741 119,826 122,994 126,247 129,588
Info: No of Days of Cash Operating Expenses 60 60 60 60 60 58 57 57
CAPITAL RESERVES
Beginning Balance [b] 111,215$ 156,475$ 229,687$ 84,186$ 7,974$ 4,801$ 4,849$ 4,897$
plus: Rate Funded System Reinvestment - - - - - - - -
plus: Grants / Developer Donations / Other Outside Sources - 1,745,000 360,500 371,315 382,454 - - -
plus: Net Debt Proceeds Available for Projects - 1,128,338 - 74,107 155,855 - - -
plus: Interest Earnings 1,112 1,565 2,297 842 80 48 48 49
plus: Transfer of Surplus from Operating Fund 44,148 71,647 6,702 7,974 4,801 - - -
plus: Direct Rate Funding - - - - - - - -
less: Capital Expenditures - (2,873,338) (515,000) (530,450) (546,364) - - -
Ending Balance 156,475$ 229,687$ 84,186$ 7,974$ 4,801$ 4,849$ 4,897$ 4,946$
Minimum Target Balance 332,437$ 361,170$ 366,320$ 371,624$ 377,088$ 377,088$ 377,088$ 377,088$
DEBT RESERVE
Beginning Balance -$ -$ -$ -$ -$ -$ -$ -$
plus: Reserve Funding from New Debt - - - - - - - -
Ending Balance -$ -$ -$ -$ -$ -$ -$ -$
Minimum Target Balance - - - - - - - -
[a] Interfund Cash Balance from FYE 2011 Trial Balance (Fund 420)
[b] Cash & Investments for Fund 705 (Water Treatment Plant)
PREPARED BY FCS GROUP, INC.
(425) 867-1802
Petersburg Water Utility.xlsm
7/11/2012
Funds
Page 15 of 15


