Mobile Collateral versus Immobile Collateral
Gary Gorton, Yale and NBER
Tyler Muir, Yale
The Transformation of the Financial System
• Over the last 30 years prior to the crisis, the architecture of the financial system changed.
• Immobile collateral bank loans became mobile collateral in the form of MBS and ABS—can be traded, posted in derivative positions, collateral for repo and ABCP, rehypothecated.
The Financial Crisis Regulatory Aftermath
• New money vulnerable to runs. • Since the financial crisis, “reform” has aimed to
return to the system of immobile collateral. – Must post collateral to CCPs, but CCPs do not post
back. – On-balance sheet derivatives require collateral, and it
cannot be rehypothecated. – The LCR requires essentially that all repo be backed
dollar for dollar with Treasuries—a kind of narrow banking. One kind of money backs another kind of money.
Policy Evaluation
• How can we understand the possible effects of the LCR? – Lucas Critique need a GE model – Without such a model, what should policy makers do?
• We tried this system before: the U.S. National
Banking Era. Intended to end banking panics.
• Private bank notes had to be backed by Treasuries—didn’t go well.
Agenda
• Examine the transformation to a system of mobile collateral.
• Provide some new evidence on the scarcity of Treasuries now and prior to the crisis.
• Examine National Banking Era – Evidence of a convenience yield on Treasuries – Rise of a shadow banking system: demand deposits – Conceptual confusion – Banking panics
• Implications for the future
0%
10%
20%
30%
40%
50%
60%
70%
80%
90%
100%
1952Q1 1957Q1 1962Q1 1967Q1 1972Q1 1977Q1 1982Q1 1987Q1 1992Q1 1997Q1 2002Q1 2007Q1
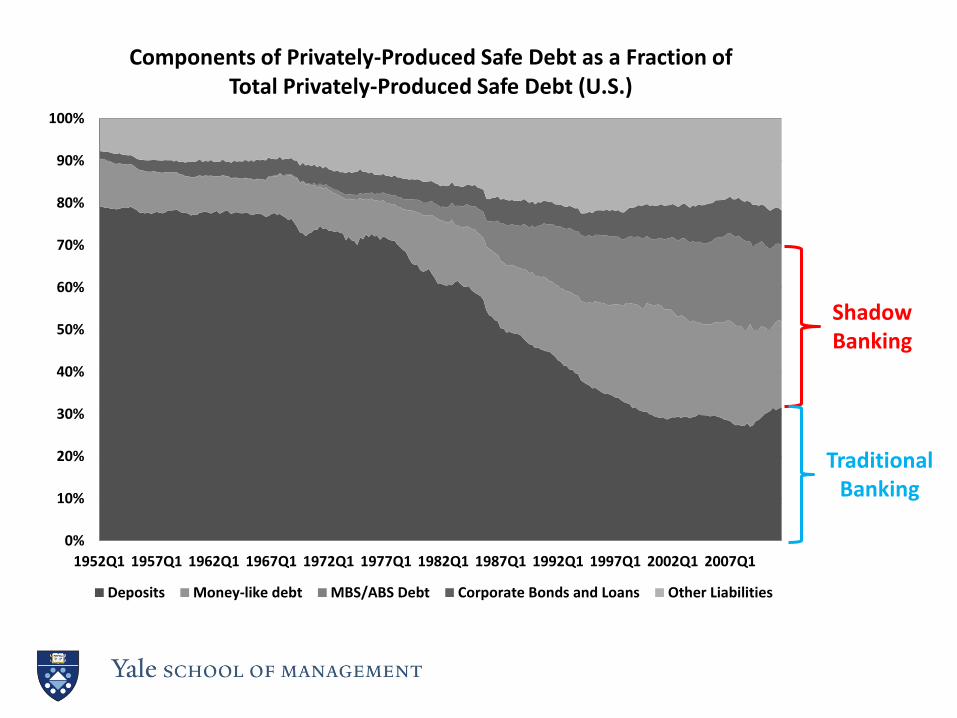
Components of Privately-Produced Safe Debt as a Fraction of Total Privately-Produced Safe Debt (U.S.)
Deposits Money-like debt MBS/ABS Debt Corporate Bonds and Loans Other Liabilities
Shadow Banking
Traditional Banking
0%
10%
20%
30%
40%
50%
60%
70%
1980 1982 1984 1986 1988 1990 1992 1994 1996 1998 2000 2002 2004 2006 2008
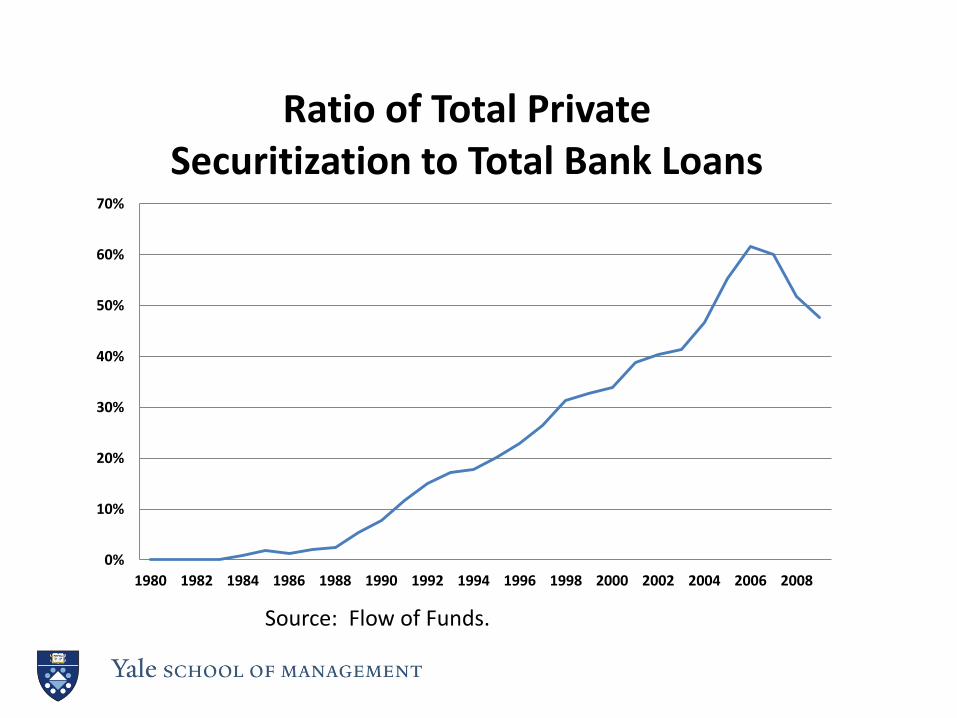
Ratio of Total Private Securitization to Total Bank Loans
Source: Flow of Funds.
-
100
200
300
400
500
600
700
800
900
19
54
19
57
19
60
19
63
19
66
19
69
19
72
19
75
19
78
19
81
19
84
19
87
19
90
19
93
19
96
19
99
20
02
20
05
20
08
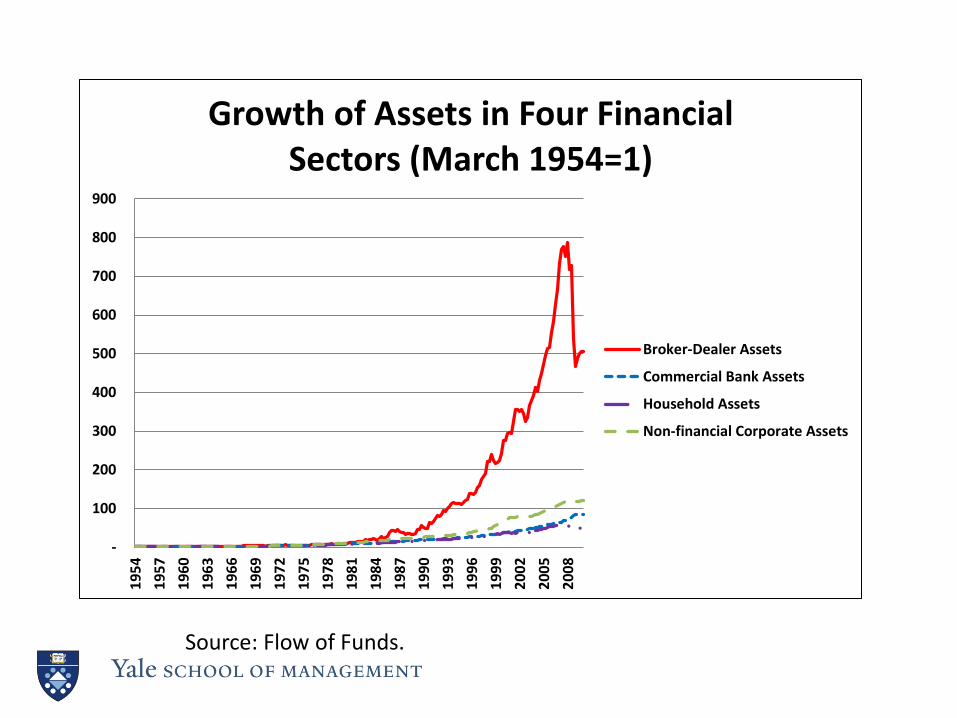
Growth of Assets in Four Financial Sectors (March 1954=1)
Broker-Dealer Assets
Commercial Bank Assets
Household Assets
Non-financial Corporate Assets
Source: Flow of Funds.
(0.100)
-
0.100
0.200
0.300
0.400
0.500
0.600
0.700
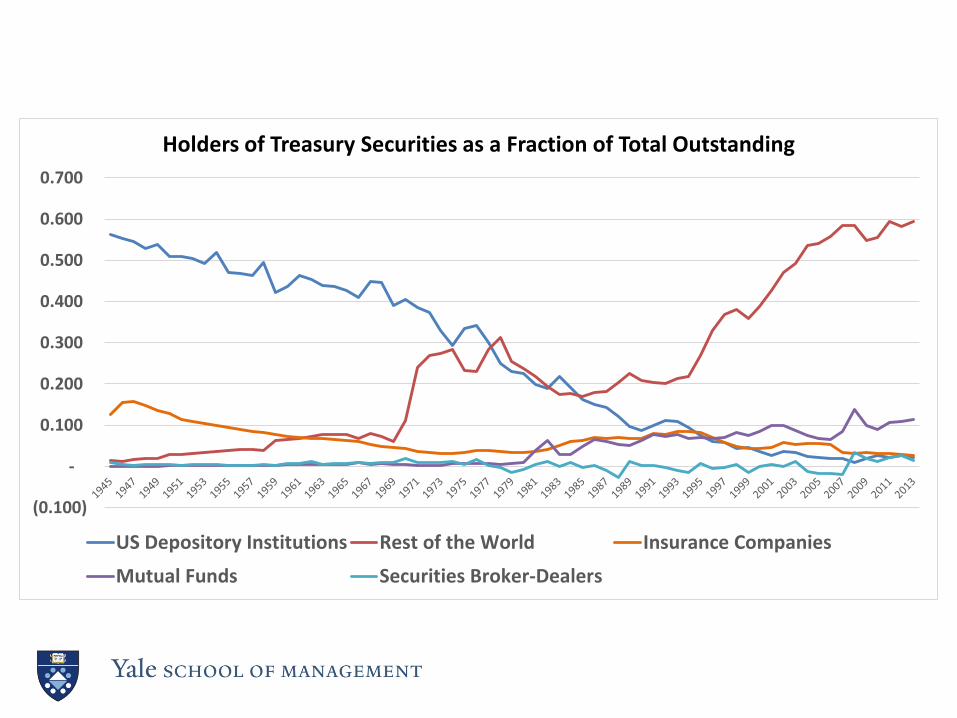
Holders of Treasury Securities as a Fraction of Total Outstanding
US Depository Institutions Rest of the World Insurance Companies
Mutual Funds Securities Broker-Dealers
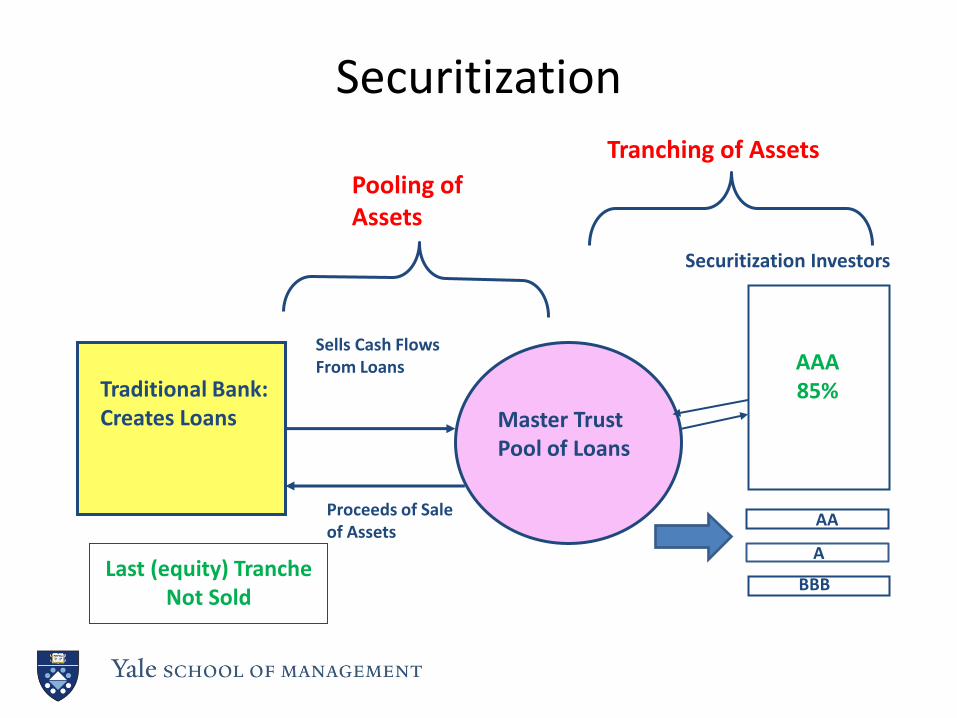
Securitization
Pooling of Assets
Master Trust Pool of Loans
Traditional Bank: Creates Loans
Sells Cash Flows From Loans AAA
85%
A
BBB Last (equity) Tranche
Not Sold
Securitization Investors
Proceeds of Sale of Assets
Tranching of Assets
AA
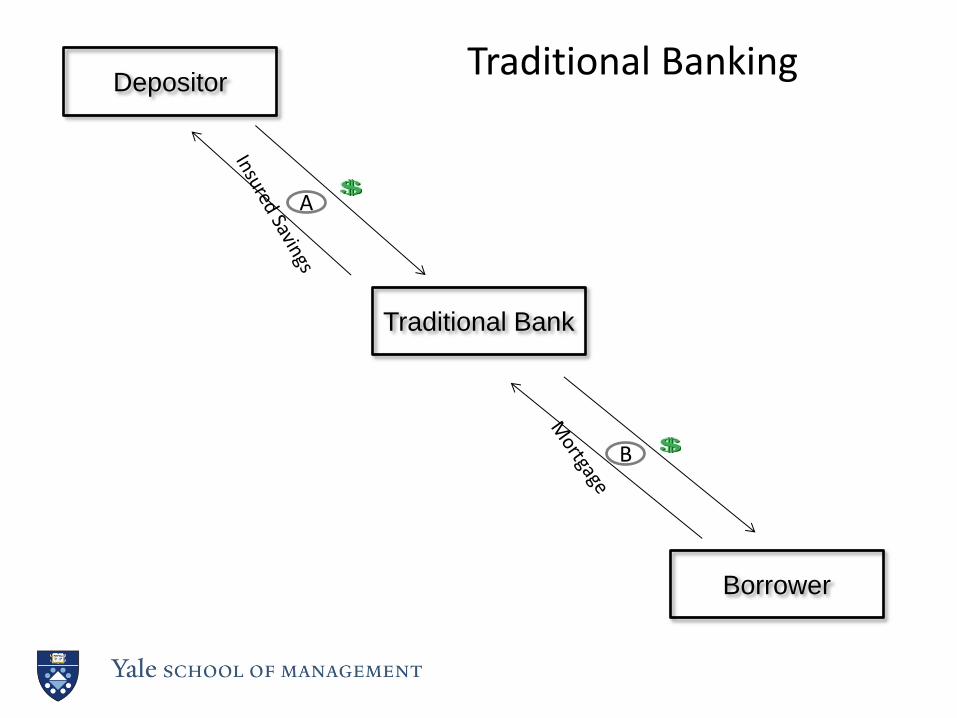
Borrower
Traditional Bank
Depositor Traditional Banking
A
B
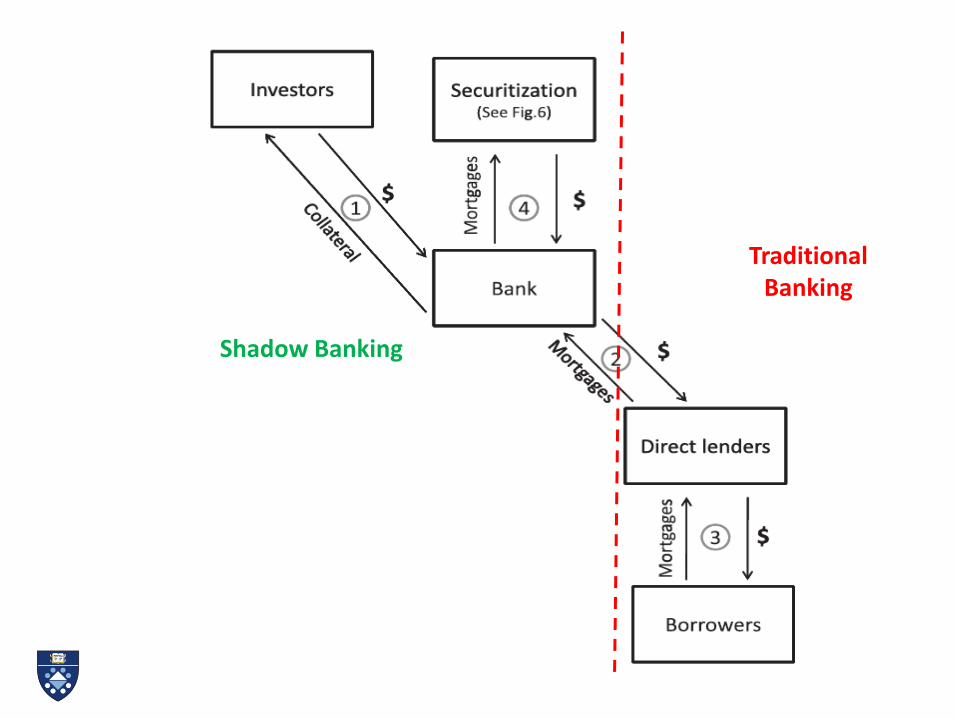
Shadow Banking
Traditional Banking
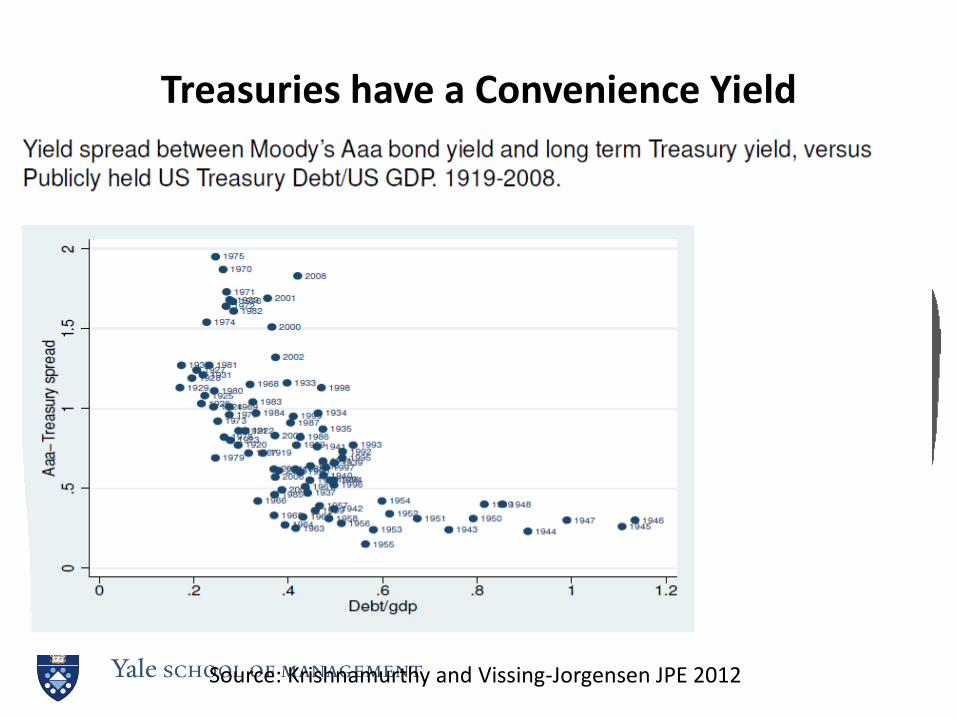
Treasuries have a Convenience Yield
Source: Krishnamurthy and Vissing-Jorgensen JPE 2012

Private Response to Scarcity of Treasuries
• Lei (2012): Examines daily issuance data on 20,000 MBS/ABS deals with 300,000 tranches from 1978-2011.
• Finds that MBS/ABS issuance occurs when convenience yield rises.
• Sunderam (2014) finds the same phenomenon with weekly data on ABCP.
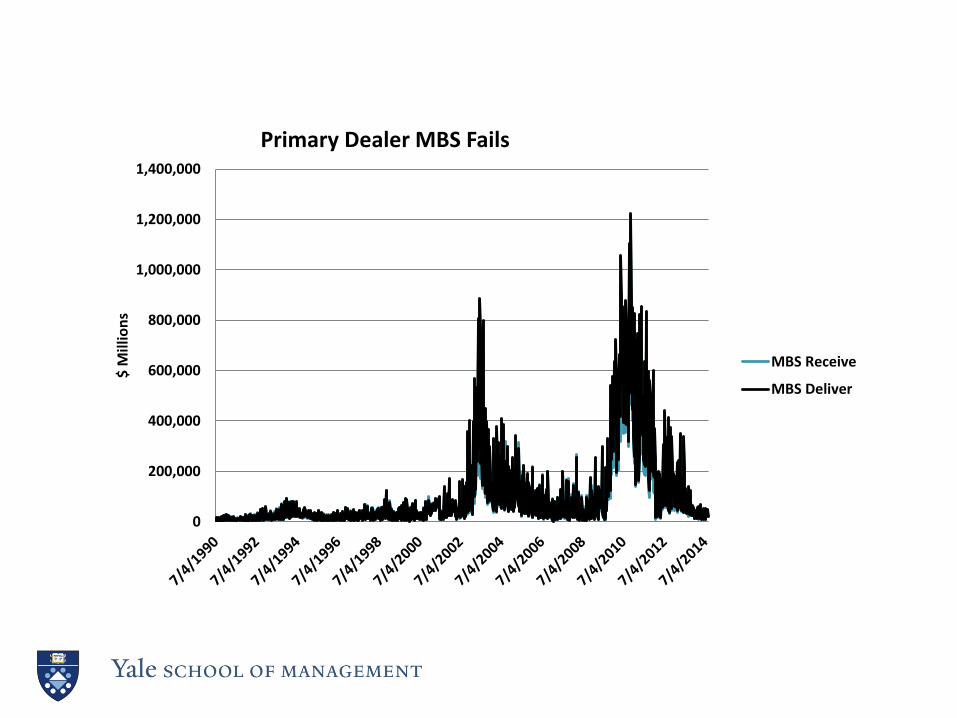
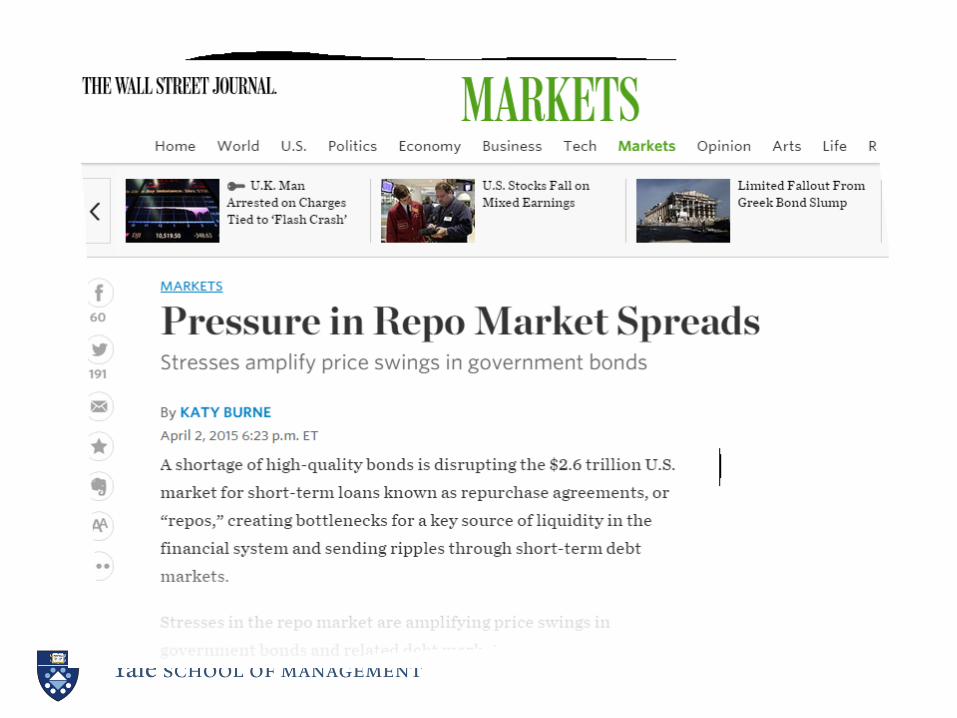
More Evidence of Scarcity
• Repo fails
– Occur when one side of the contract “fails to deliver” or “fails to receive”
• Question: Are fails due to a shortage of safe debt?
0
500,000
1,000,000
1,500,000
2,000,000
2,500,000
3,000,000
$ M
illio
ns
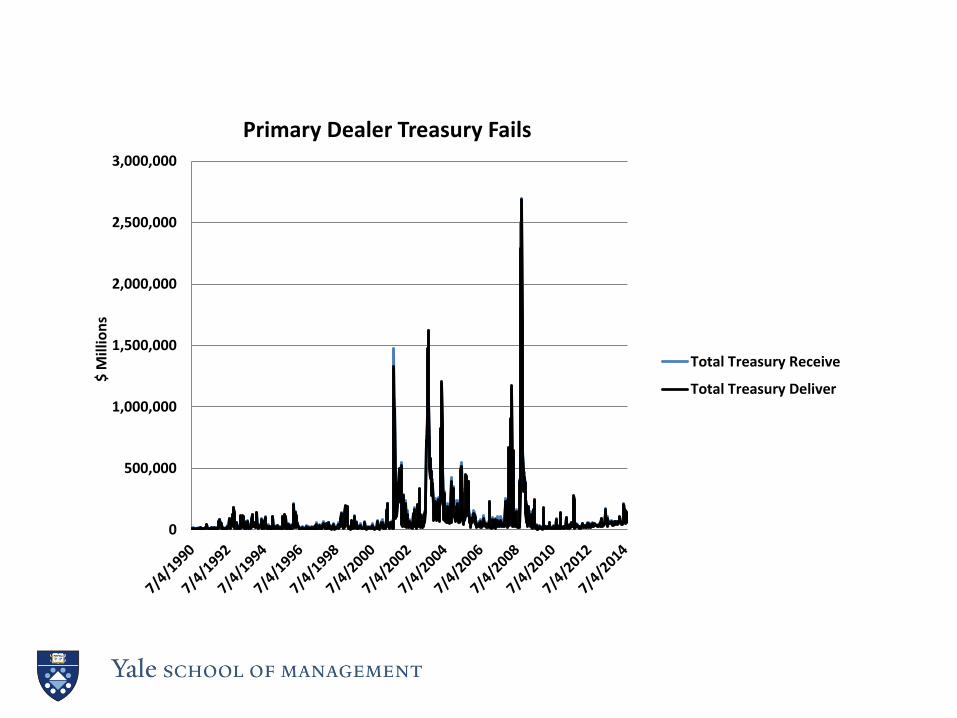
Primary Dealer Treasury Fails
Total Treasury Receive
Total Treasury Deliver
0
200,000
400,000
600,000
800,000
1,000,000
1,200,000
1,400,000
$ M
illio
ns
Primary Dealer MBS Fails
MBS Receive
MBS Deliver
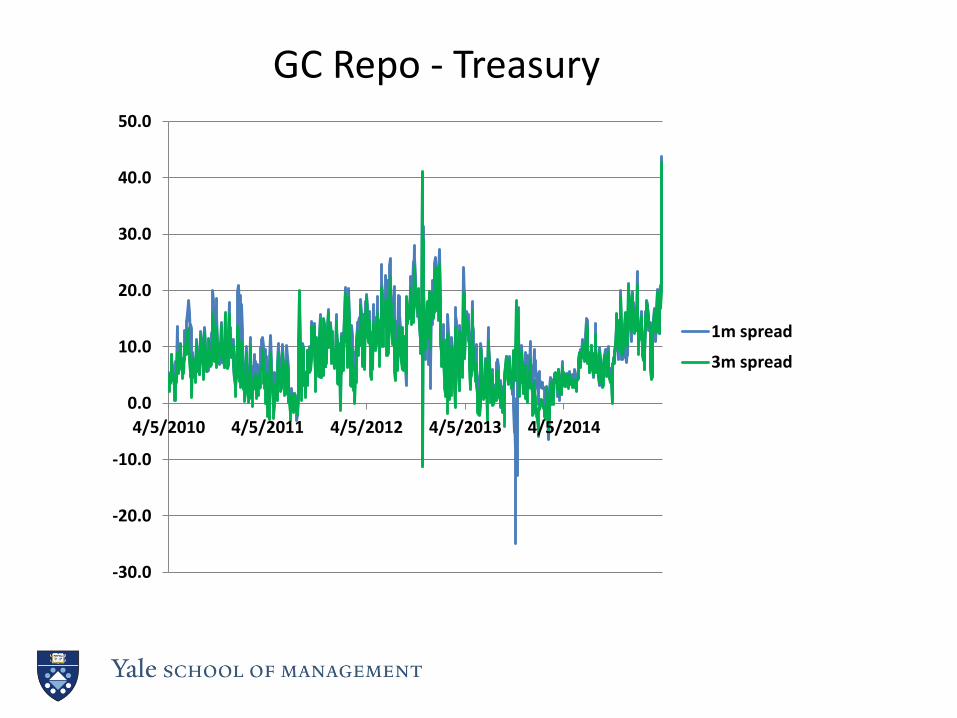
A Measure of Scarcity
• GC Repo minus Treasury (1 month)
– 36 bps average over 1978 -2011
-30.0
-20.0
-10.0
0.0
10.0
20.0
30.0
40.0
50.0
4/5/2010 4/5/2011 4/5/2012 4/5/2013 4/5/2014
1m spread
3m spread
GC Repo - Treasury
Econometrics
• Shows that repo fails are caused by a rise in the scarcity premium or convenience yield.
• When Treasuries are scarce, there are more repo fails.
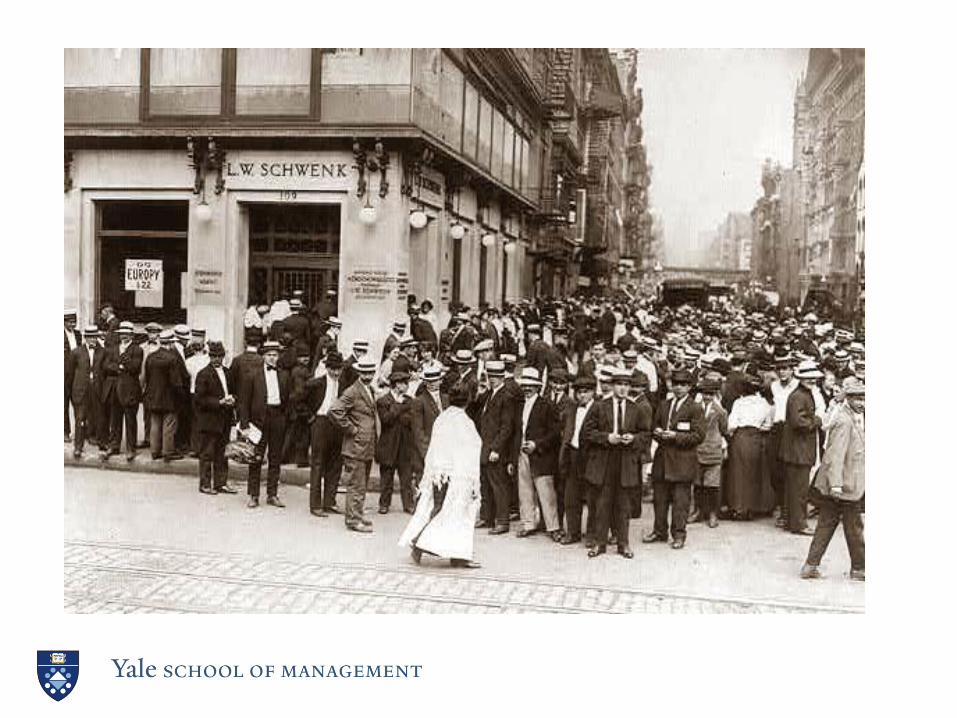
Bank Runs
• This new money—repo, ABCP-- was vulnerable to bank runs, just as in most of U.S. history.
The National Banking Era
• National Banking Act passed in 1863 to finance Civil War.
– Set up a new system of National Banks
– These banks could issue bank-specific national bank notes by depositing US Treasuries with the Treasury Dept.
– Expected to end banking panics.
The Under-Issuance Puzzle
• Too little money was issued, the “under-issuance puzzle” - - a puzzle for over a century!
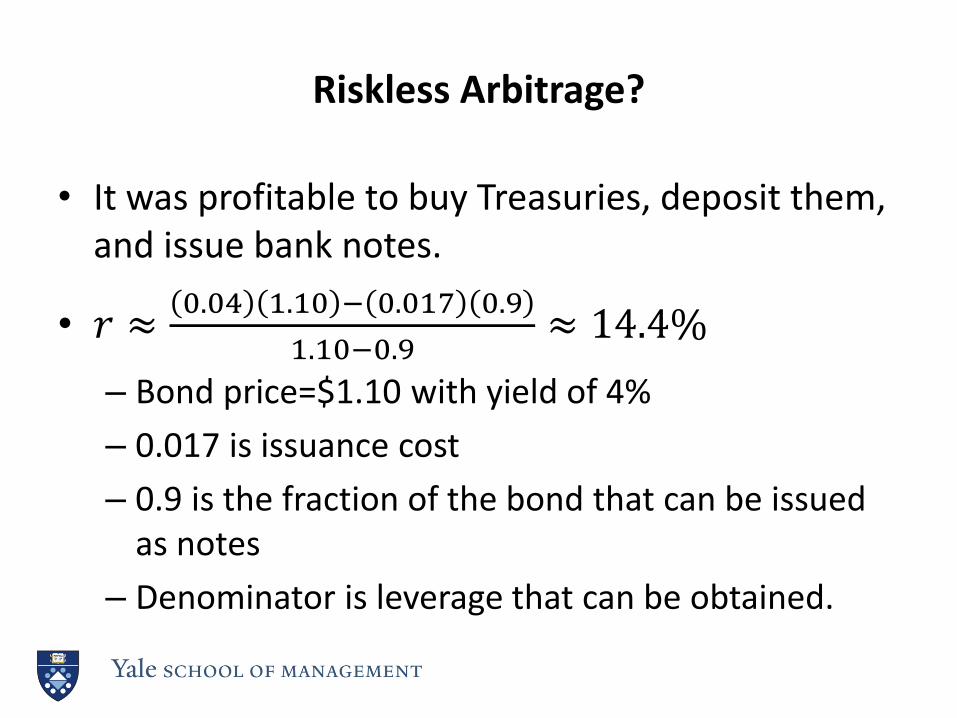
Riskless Arbitrage?
• It was profitable to buy Treasuries, deposit them, and issue bank notes.
• 𝑟 ≈0.04 1.10 − 0.017 0.9
1.10−0.9≈ 14.4%
– Bond price=$1.10 with yield of 4%
– 0.017 is issuance cost
– 0.9 is the fraction of the bond that can be issued as notes
– Denominator is leverage that can be obtained.
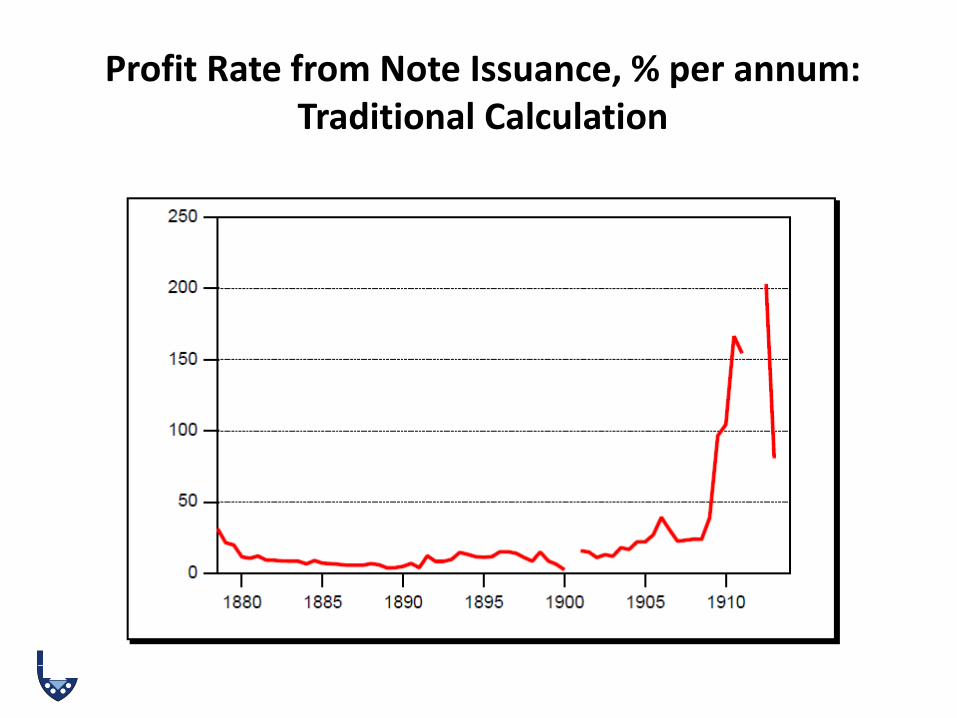
Profit Rate from Note Issuance, % per annum: Traditional Calculation
But . . .
• There was no arbitrage opportunity. “Profit” due to:
– a convenience yield on Treasuries
– and costly bank capital.
• Treasuries scarce. Had to reverse them in at 1-2%.
• Banks held Treasuries on balance sheet.
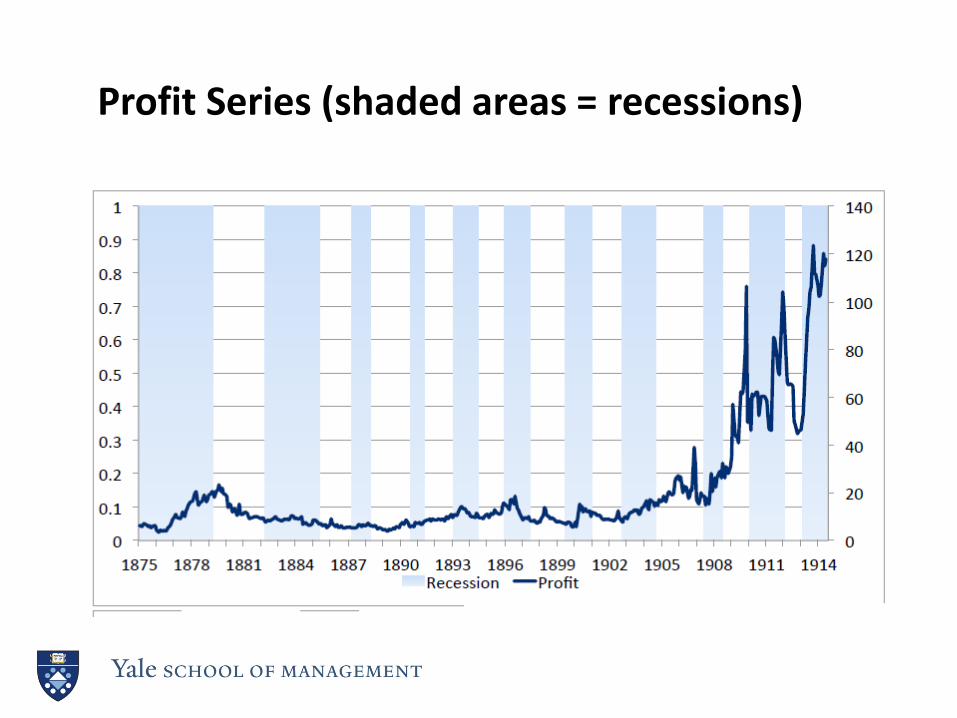
Profit Series (shaded areas = recessions)
“Arb Profits” Reflect Convenience Yield?
• Measures/Proxies for convenience yield:
– Follow Krish and V-J: outstanding Treasuries to GDP
– Also look at “available Treasuries”
– Muni spreads
• No proxies for bank capital.
Econometric Results
• “Arb profits” explained by scarcity of Treasuries (and costs of bank capital).
– Banks had other uses for Treasuries
– Insurance companies also demanded Treasuries
Meanwhile --
• - - - the shadow banking system grew---
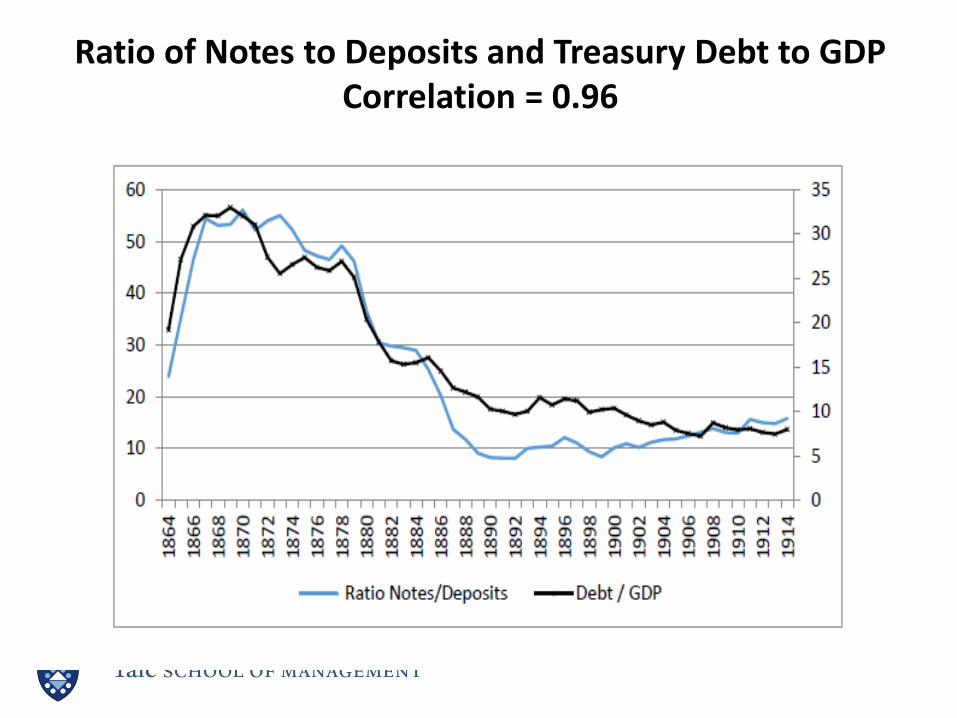
Ratio of Notes to Deposits and Treasury Debt to GDP Correlation = 0.96
Demand Deposits not Understood
• Bray Hammond (1957), in his Pulitzer Prize-winning book Banks and Politics in America, wrote: “. . . the importance of deposits was not realized by most American economists . . . till after 1900” (p. 80).
• Russell C. Leffingwell, the Assistant Secretary of the Treasury wrote as late as 1919: “All of these people who believe in the quantity theory of money . . . choose to call bank deposits money, but bank deposits are not money.”
Conclusions
• Design of Nat’l Banking System led to the rise of demand deposits—”shadow banking.”
• Five major banking panics.
• Same problems now:
– Unintended consequences
– Conceptual issues
“Those who ignore history are entitled to repeat it.”


