
University of Kentucky University of Kentucky
UKnowledge UKnowledge
Theses and Dissertations--Chemical and Materials Engineering Chemical and Materials Engineering
2014
MIXED SURFACTANT SYSTEMS: THERMODYNAMICS AND MIXED SURFACTANT SYSTEMS: THERMODYNAMICS AND
APPLICATIONS IN METAL OXIDE IMPRINTING APPLICATIONS IN METAL OXIDE IMPRINTING
Suvid Joshi University of Kentucky, [email protected]
Right click to open a feedback form in a new tab to let us know how this document benefits you. Right click to open a feedback form in a new tab to let us know how this document benefits you.
Recommended Citation Recommended Citation Joshi, Suvid, "MIXED SURFACTANT SYSTEMS: THERMODYNAMICS AND APPLICATIONS IN METAL OXIDE IMPRINTING" (2014). Theses and Dissertations--Chemical and Materials Engineering. 29. https://uknowledge.uky.edu/cme_etds/29
This Doctoral Dissertation is brought to you for free and open access by the Chemical and Materials Engineering at UKnowledge. It has been accepted for inclusion in Theses and Dissertations--Chemical and Materials Engineering by an authorized administrator of UKnowledge. For more information, please contact [email protected].

STUDENT AGREEMENT: STUDENT AGREEMENT:
I represent that my thesis or dissertation and abstract are my original work. Proper attribution
has been given to all outside sources. I understand that I am solely responsible for obtaining
any needed copyright permissions. I have obtained needed written permission statement(s)
from the owner(s) of each third-party copyrighted matter to be included in my work, allowing
electronic distribution (if such use is not permitted by the fair use doctrine) which will be
submitted to UKnowledge as Additional File.
I hereby grant to The University of Kentucky and its agents the irrevocable, non-exclusive, and
royalty-free license to archive and make accessible my work in whole or in part in all forms of
media, now or hereafter known. I agree that the document mentioned above may be made
available immediately for worldwide access unless an embargo applies.
I retain all other ownership rights to the copyright of my work. I also retain the right to use in
future works (such as articles or books) all or part of my work. I understand that I am free to
register the copyright to my work.
REVIEW, APPROVAL AND ACCEPTANCE REVIEW, APPROVAL AND ACCEPTANCE
The document mentioned above has been reviewed and accepted by the student’s advisor, on
behalf of the advisory committee, and by the Director of Graduate Studies (DGS), on behalf of
the program; we verify that this is the final, approved version of the student’s thesis including all
changes required by the advisory committee. The undersigned agree to abide by the statements
above.
Suvid Joshi, Student
Dr Stephen Rankin, Major Professor
Dr Thomas Dziubla, Director of Graduate Studies

MIXED SURFACTANT SYSTEMS: THERMODYNAMICS AND APPLICATIONS
IN METAL OXIDE IMPRINTING
DISSERTATION
A dissertation submitted in partial fulfillment of the
requirements for the degree of Doctor of Philosophy in the
College of Engineering
at the University of Kentucky
By
Suvid Joshi
Lexington, Kentucky
Director: Dr. Stephen E Rankin, Professor of Chemical Engineering
Lexington, Kentucky
2014
Copyright © Suvid Joshi 2014

ABSTRACT OF DISSERTATION
MIXED SURFACTANT SYSTEMS: THERMODYNAMICS AND APPLICATIONS
IN METAL OXIDE IMPRINTING
In this work we study mixtures of cationic surfactant (CTAB) and sugar based
surfactant(s) (octyl beta-D-glucopyranoside (C8G1), dodecyl maltoside (C12G2) and
octyl beta-D-xylopyranoside (C8X1)) to understand the non-ideal thermodynamic
behavior of the mixtures of cationic and non-ionic surfactants in water and synthesis of
imprinted materials. The thermodynamics of micellization, mixing and dilution of these
systems are studied using Isothermal Titration Calorimetry (ITC) and the experimental
data obtained are modeled with a pseudo-phase separation model with non-ideal mixing
described by regular solution theory. It is shown that a model accounting for enthalpy of
demicellization and enthalpy of dilution based on McMillan-Mayer model is able to fit
ITC data set for CTAB-C8G1 system with varying mole fractions.
In addition to measuring non-ideal mixing behavior, mixtures of cationic and
saccharide-based surfactants are of interest for the molecular imprinting of oxide
materials. Mixtures of CTAB and either C8G1 or C8X1 are utilized to prepare
nonporous adsorbent materials which act as selective adsorbents towards the headgroup
of the saccharide surfactant. The approach is based on the Stöber silica particle synthesis
process in which surfactants are added to soft particles present at the onset of turbidity to
imprint their surface. This approach is shown to yield particles displaying selective
adsorption for sugars with different number of carbons, but also provide enantioselective
adsorption of targeted saccharides. Enantioselectivity of D-glucose, D-xylose and D-
maltose is demonstrated by imprinting with C8G1, C8X1 and C12G2, respectively. The
imprinting technique provides the first example of selective adsorption based on non-
covalent imprinting of silica for sugars.
The mixed surfactant are also used to synthesize templated porous materials
incorporating titanium which are used for epoxidation catalysis. The porous materials
obtained have high surface area, uniform pore sizes in the mesopore range, and provided
high selectivity and activity towards epoxidation of styrene. Titanosilicate thin films are
also synthesized using cationic and saccharide surfactant mixtures to understand the
incorporation of the titanium into the porous material. It is demonstrated that large
amounts of isolated, tetracoordinated titanium sites can be incorporated into mesoporous

silica-based materials via the complexation of the titanium precursor with a saccharide-
based surfactant.
KEYWORDS: surfactants, silica, thermodynamics, adsorption, catalysis
Suvid Joshi
April 30, 2014
MIXED SURFACTANT SYSTEMS: THERMODYNAMICS AND APPLICATIONS
IN METAL OXIDE IMPRINTING
By
Suvid Joshi
Dr Stephen Rankin
Director of Dissertation
Dr Thomas Dziubla
Director of Graduate Studies

To, Late Dr. Shivram Dattatray Joshi
iii
ACKNOWLEDGMENTS
Gurur-Brahmaa Gurur-Vissnnur-Gururdevo Maheshvarah |
Guru sakshat Param Brahma Tasmai Shrii-Gurave Namah ||1||
The Guru is Brahma, the Guru is Vishnu, the Guru Deva is Maheswara (Shiva). The
Guru is Verily the Para-Brahman (Supreme Brahman); Salutations to that Guru. .The
couplet summarizes all I have to say for my advisor Dr Stephen Rankin. I would like to
express my deepest gratitudes to Dr Rankin for all the guidance he provided me
throughout my PhD. Without him, the journey through my PhD would have been much
harder. I would also like to thank Dr Barbara Knutson for encouragement she provided
during my PhD. I would also like to thank my committee members Dr Paul Bummer and
Dr Jeffrey Seay
I would like to thank all my past and present lab mates and people who worked on
USDA grant, especially Dr Jyothirmai Ambati, Dan Schlipf, Suraj Nagpure, Ravinder
Garlapalli, Saikat Das, Said Zahadul Islam, Dr Janet Mohandas and Srivenu Seelam for
banter that helped me enjoy every second in the lab. Dr Gifty Osei-Prempeh for patiently
teaching me to use my first instrument at the University of Kentucky.
I would like to thank CMEGSA (MACE) and all its members for amazingly
entertaining meetings, tailgating and evenings at Pazzo’s. I would like to thank all of the
Gazette Janata for giving me a family away from India. My special thanks to Anwesha,
Apurv and Sweta for listening to me the way only friends can and giving advice no one
else could. I would also like to thank UKCC, and all the members of UKCC for keeping
me engaged over the past 5 years playing cricket and providing regular breaks and
enjoyment.

iv
The acknowledgement would be incomplete without thanking my family who had my
back every step of the way. I would like to thank my mother for standing by me through
all the difficult times and my father for giving me confidence and guiding me to be a
better person every time I faltered. I would also like to thank my brother Abhijat, who
stood by me every time I needed support.
v
TABLE OF CONTENTS
ACKNOWLEDGMENTS ................................................................................................. iii
TABLE OF CONTENTS .................................................................................................... v
LIST OF TABLES ........................................................................................................... viii
LIST OF FIGURES ........................................................................................................... ix
1. INTRODUCTION .......................................................................................................... 1
1.1 Research Hypothesis ................................................................................................. 3
1.2 Research Contribution .............................................................................................. 4
2. BACKGROUND ............................................................................................................ 6
2.1. Summary .................................................................................................................. 6
2.2 Introduction to saccharide surfactants ...................................................................... 7
2.3 Mixed micelles involving saccharide surfactants ................................................... 11
2.3.1 Thermodynamic models................................................................................... 12
2.3.2 Mixtures with cationic, anionic and nonionic surfactants ............................... 16
2.3.3 Adsorption of surfactant mixtures on solid surfaces........................................ 18
2.4. Molecular imprinting ............................................................................................. 20
2.5. Silica based materials ............................................................................................. 24
2.5.1. Sol-gel process ................................................................................................ 24
2.5.2. Templated porous silicates .............................................................................. 25
2.5.3. Metal oxide incorporation into the silica framework ...................................... 27
2.5.4. Nonporous silica particles ............................................................................... 29
2.6. Characterization techniques ................................................................................... 32
2.6.1 Isothermal Titration Calorimeter (ITC) ........................................................... 32
2.6.2. Fourier Transform Infrared Spectroscopy (FTIR) .......................................... 34
2.6.3. X-ray diffraction (XRD) ................................................................................. 37
2.6.4. Scanning Electron Microscopy ....................................................................... 38
2.6.5 Nitrogen adsorption ......................................................................................... 39
2.6.6 Dynamic Light Scattering (DLS) ..................................................................... 42
2.7. Conclusion ............................................................................................................. 44
3. MODELING THERMODYNAMIC BEHAVIOR OF NON-IDEAL MIXED
SURFACTANTS: USE OF REGULAR SOLUTION THEORY FOR ISOTHERMAL
TITRATION CALORIMETRY DATA ........................................................................... 50
3.1. Summary ................................................................................................................ 50
vi
3.2. Introduction ............................................................................................................ 51
3.3. Experimental .......................................................................................................... 55
3.3.1. Materials ......................................................................................................... 55
3.3.2. Methods........................................................................................................... 55
3.3.3. Surfactant pseudo-phase equilibrium model ................................................... 56
3.4. Thermodynamic model of micellization ................................................................ 58
3.4.1 Fitting the model .............................................................................................. 62
3.5. Results and Discussion .......................................................................................... 62
3.6. Conclusion ............................................................................................................. 71
4. INTERFACIAL MOLECULAR IMPRINTING OF STÖBER PARTICLE
SURFACES: A SIMPLE APPROACH TO TARGETED SACCHARIDE
ADSORPTION ................................................................................................................. 84
4.1 Summary ................................................................................................................. 84
4.2 Introduction ............................................................................................................. 85
4.3 Experimental Section .............................................................................................. 89
4.3.1 Materials .......................................................................................................... 89
4.3.2 Octyl-β-D-xylopyranoside synthesis (C8X1) .................................................. 89
4.3.3 Particle synthesis .............................................................................................. 89
4.3.4 Particle characterization ................................................................................... 92
4.3.5 Saccharide Adsorption Measurements:............................................................ 92
4.3.6 Saccharide Analysis ......................................................................................... 93
4.4. Results and Discussion .......................................................................................... 93
4.5. Conclusions .......................................................................................................... 106
5. IMPRINTING OF STÖBER PARTICLES TO TARGET MONOSACCHARIDES
AND DISACCHARIDES FOR APPLICATION IN CHIRAL SEPARATION ............ 120
5.1 Summary ............................................................................................................... 120
5.2 Introduction ........................................................................................................... 121
5.3 Materials and methods .......................................................................................... 126
5.3.1 Materials ........................................................................................................ 126
5.3.2. Particle synthesis ........................................................................................... 126
5.3.3. Particle characterization ................................................................................ 127
5.3.4. Saccharide Adsorption Measurements .......................................................... 128
5.3.5. Saccharide Analysis ...................................................................................... 128
5.4 Results and Discussion ......................................................................................... 129
5.5 Conclusion ............................................................................................................ 136

vii
6. INCORPORATION OF TITANIUM IN SILICA STRUCTURES USING
SACCHARIDE SURFACTANTS TO STABILIZE AND LOCALIZE TITANIUM
PRECURSORS ............................................................................................................... 146
6.1. Summary .............................................................................................................. 146
6.2. Introduction .......................................................................................................... 147
6.3 Experimental Section ............................................................................................ 152
6.3.1 Materials ........................................................................................................ 152
6.3.2 Synthesis ........................................................................................................ 152
6.3.3 Catalytic testing ............................................................................................. 156
6.3.4 Material characterization ............................................................................... 157
6.4. Results and discussion ......................................................................................... 158
6.4.1 Titanosilicate thin films ................................................................................. 158
6.4.2 Titanosilicate bulk materials .......................................................................... 158
6.4.3. Titania incorporated Stöber particles ............................................................ 162
6.5. Conclusion ........................................................................................................... 164
7. CONCLUSIONS AND FUTURE WORK ................................................................. 176
7.1. Conclusions .......................................................................................................... 176
7.2. Future work .......................................................................................................... 183
APPENDIX A ................................................................................................................. 187
A.1. Visual basic code to estimate micellar mole fraction ......................................... 187
A.2 Supplemental information .................................................................................... 190
APPENDIX B ................................................................................................................. 196
B.1. Calibration curves for xylose and glucose .......................................................... 196
B.2. Sugar adsorption .................................................................................................. 198
APPENDIX C ................................................................................................................. 205
APPENDIX D ................................................................................................................. 209
REFERENCES ............................................................................................................... 211
VITA ............................................................................................................................... 257

viii
LIST OF TABLES
Table 2.1. cmc’s , free energies of micellization and enthalpies of micellization for some
glucosidic surfactants with varying tail length, head group and anomeric center. ........... 49
Table 3.1. Properties obtained for single surfactant demicellization obtained from fitting
the model to the data and from experiments. .................................................................... 82
Table 3.2. Comparison of cmc of C8G1/CTAB mixtures calculated using best-fit
parameters from the models, from the onset of micellization in the ITC curves, from
differential analysis of the ITC data, and ideal values based on literature cmc values of
C8G1 and CTAB............................................................................................................... 82
Table 3.3. Summary of dilution parameters providing best fits for Models 1 and 2. ...... 83
Table 4.1. Physical characteristics of particles synthesized with low-concentration
ammonia with and without various surfactants, determined using nitrogen adsorption,
SEM and DLS. ................................................................................................................ 117
Table 4.2. Langmuir isotherm parameters found by nonlinear regression for D-glucose
and for D-xylose adsorbed to all silica samples. The curves corresponding to these
parameters are shown in Figure 4.2.a .............................................................................. 118
Table 4.3. Synthesis conditions for particles prepared with fresh, saturated ammonia and
varying ratios of surfactants, time of surfactant addition and temperature, and their
physical characteristics determined using nitrogen adsorption, SEM and DLS. ............ 119
Table 5.1. Physical characteristics of particles prepared without surfactant, with a 1:1
mixture of CTAB and C8G1 and with a 1:1 mixture of CTAB and C12G2. ................. 145
Table 6.1. Textural and surface properties of titanosilicates.......................................... 175
Table 6.2. Catalytic activity of titanosilicates with varying titanium content................ 175
ix
LIST OF FIGURES
Figure 2.1 The figure shows the basic setup of an ITC instrument working on power
compensation method and raw data obtained for a general case (From Freyer, M W and
Lewis, E A, Methods in Cell Biology, 2008(153). Produced with permission. ............... 45
Figure 2.2 Explanation of x-ray diffraction to obtain constructive interference. (Produced
with permission from Smith, F. Industrial Applications of X-Ray Diffraction Smith,
1999, CRC Press (158)). ................................................................................................... 46
Figure 2.3 Schematic representation of perfect, imperfect crystals and amorphous
materials. Adapted from Heiney et al(159)....................................................................... 47
Figure 2.4. Common classifications of the adsorption isotherm. Adapted from Sing et
al(171). .............................................................................................................................. 48
Figure 3.1. Representation of thermodynamic cycle used to represent demicellization of
a non-ideal mixed micelle when the concentration of the system after injection of an
aliquot is below the cmc of the mixture. ........................................................................... 74
Figure 3.2. Representation of thermodynamic cycle for demicallization of a non-ideal
mixed micelle when the concentration in the ampoule is above cmc of the mixture. ...... 75
Figure 3.3. (a) Enthalpy vs. concentration diagram for (a) CTAB injected from a syringe
containing 8 mM CTAB into an ampoule containing water and (b) C8G1injected from a
syringe containing142 mM C8G1 into an ampoule containing water. ............................. 76
Figure 3.4. Enthalpy vs. concentration diagrams for demicellization experiments
measured using ITC for 0.25, 0.5, 0.75, 0.83 bulk mole fraction of C8G1 in C8G1/CTAB
mixed surfactant solutions. The total concentrations of surfactants in the syringe used for
these experiments were 12 mM, 8 mM, 60 mM and 80 mM, respectively. ..................... 77
Figure 3.5. Experimental and best-fit enthalpy vs concentration diagrams obtained by
fitting Model 1, in which enthalpy of dilution was modeled using all terms in equation
3.13. The plots are divided into (a) low concentration experiments with 8 mM CTAB, 12
mM 3:1 CTAB:C8G1 and 8 mM 1:1 CTAB:C8G1 and (b) high concentration
experiments with 60 mM 1:3 CTAB:C8G1, 80 mM 1:5 CTAB:C8G1 and 142 mM C8G1.
........................................................................................................................................... 78
Figure 3.6. Experimental and best-fit enthalpy vs concentration diagrams obtained by
fitting Model 2, in which enthalpy of dilution was modeled using all terms in equation
3.14. The plots are divided into (a) low concentration experiments with 8 mM CTAB, 12
mM 3:1 CTAB:C8G1 and 8 mM 1:1 CTAB:C8G1 and (b) high concentration
experiments with 60 mM 1:3 CTAB:C8G1, 80 mM 1:5 CTAB:C8G1 and 142 mM C8G1.
........................................................................................................................................... 79
Figure 3.7. Critical micellar concentrations plotted against C8G1 mole fraction in the
bulk mixture. The ideal/literature curve refers to cmc values obtained for pure surfactants
x
from literature along with an ideal model (=0) for cmcs of mixed surfactants. Models 1
and 2 are curves plotted using the best-fit parameters from the two models. The points
labeled “onset” are calculated based on the slope change in the ITC curve corresponding
to the onset of micellization and the points labeled “differential” are calculated from the
extremum in the derivative of heat with respect to concentration in the ITC curves. ...... 80
Figure 3.8. Calculated mole fraction of C8G1 in the micelle as a function of total bulk
surfactant concentration for surfactant solutions at each injection step for mixtures
containing 3:1, 1:1, 1:3 and 1:5 CTAB:C8G1. Curves are plotted using (a) best-fit Model
1 parameters and (b) best-fit Model 2 parameters. ........................................................... 81
Figure 4.1. (A) High wavenumber and (B) low wavenumber regions of the FTIR spectra
of imprinted Stöber particles, showing the presence of surfactant on the particles before
washing and its removal upon washing. Spectra are shown for (a) sample 1, non-
imprinted silica, (b) sample 2, prepared with CTAB, (c) sample 3, prepared with C8G1,
(d) sample 4, prepared with a 1:1 CTAB / C8G1 mixture, (e) crystalline C8G1 and (f)
crystalline CTAB. Spectra labeled with primes (a’ through d’) are the spectra of washed
samples 1-4, respectively. ............................................................................................... 108
Figure 4.2. Representative SEM micrograph of monodisperse nonporous silica particles
synthesized using the Stöber process, with imprinting using a 1:1 mixture of CTAB and
C8G1 by weight (sample 4). SEM micrographs of all other samples are qualitatively
similar, and included in the Supplemental Information. ................................................. 109
Figure 4.3. Comparison of adsorption isotherms for D-glucose and D-xylose adsorbing
from aqueous solution onto (a) sample 1, non-imprinted particles, (b) , sample 2,
prepared with CTAB, (c) sample 3, prepared with C8G1, and (d) sample 4, prepared with
a 1:1 mixture of CTAB and C8G1. The vertical axis represents moles of saccharide
adsorbed per m2 of silica particle area, and the horizontal axis represents the final moles
of sugar per liter of solution. Curves are best-fit Langmuir isotherms found by globally
optimizing adsorption parameters for all adsorbents (see text for further explanation). 110
Figure 4.4. Adsorption isotherms for adsorption of glucose onto particles prepared with
different ratios of surfactants (samples 5-8), expressed as moles of glucose per m2 of
particle surface vs. moles of glucose remaining per liter of aqueous solution. .............. 111
Figure 4.5. FTIR absorbance curves for unwashed Stöber particles in KBr pellets. All
samples (numbers 8-12) were imprinted with a 1:1 mixture of CTAB and C8G1 by
addition of the surfactant at the indicated times after addition of TEOS. The CH2
stretching bands between 2800 and 3000 cm-1
indicate surfactant incorporation in the
particles. .......................................................................................................................... 112
Figure 4.6. Moles of sugar adsorbed per area as a function of the time of addition of
surfactant during the particle synthesis (for samples 8-12). Results are shown for three
different initial glucose concentrations, indicated in the legend. The rightmost set of
points is for sample 5, prepared without any surfactant added. ...................................... 113
xi
Figure 4.7 FTIR absorbance spectra for 1:1 CTAB / C8X1 imprinted Stöber particles
(sample 13) before and after washing to remove the template. The siloxane stretching
band is visible between 1000 and 1300 cm-1
, and the CH2 stretching band (indicating the
presence of surfactants) is visible between 2800 and 3000 cm-1
in the unwashed sample.
......................................................................................................................................... 114
Figure 4.8. Adsorption isotherms for xylose and glucose on comparable particles
imprinted with a 1:1 mixture of C8X1 and CTAB (sample 13) or prepared without
surfactant (non-imprinted, sample 14). ........................................................................... 115
Figure 5.1. Projections of the 3D geometry of the monosaccharides investigated in this
study: (a) D-glucose, (b) D-galactose, (c) L-glucose and (d) D-mannose. The structures
are all optimized using the Universal Force Field (UFF) as implemented in Avogadro,
and the translucent surfaces are van der Waals surfaces colored by electrostatic potential.
Hydrogen atoms were used for geometry optimization and to generate the surfaces, but
are not depicted in the stick geometries shown. The circled atoms in (b) and (d) are the
oxygen atoms with different chirality from D-glucose ................................................... 139
Figure 5.2. SEM images after washing and drying of particles made A) without addition
of surfactants and B) particles prepared with addition of 1:1 mixture of CTAB and C8G1.
......................................................................................................................................... 140
Figure 5.3. FTIR spectra of Stöber particles in KBr pellets. (a) Washed non-imprinted
Stöber particles, (a’) As synthesized Stöber particles without surfactant addition, (b)
Washed Stöber particles imprinted with 1:1 CTAB/C8G1 mixture, (b’) As synthesized
Stöber particles imprinted with 1:1 CTAB/C8G1 mixture by adding surfactant at 1
minute after TEOS addition. ........................................................................................... 140
Figure 5.4. Comparison of the results of adsorption from aqueous solution of D-glucose
and (A) L-glucose, (B) D-galactose and (C) D-mannose. The figures show that there is a
higher preference for adsorption of D-glucose on C8G1 imprinted materials compared to
other hexoses, while no significant difference is observed for adsorption of hexoses on
non-imprinted Stöber particles. ....................................................................................... 141
Figure 5.5. 3D structures of (a) cellobiose and (b) maltose obtained by starting with the
experimental coordinates and performing geometry optimization with the UFF potential.
The translucent surfaces are van der Waals surfaces colored by electrostatic potential
using Avogadro. Note that the left glucopyranose units are oriented in roughly the same
way in both molecules. ................................................................................................... 142
Figure 5.6. SEM images of C) 1to1 CTAB and C12G2 imprinted nanoparticles. ........ 143
Figure 5.7. FTIR curves for particles imprinted with 1:1 mixture of CTAB and C12G2
before and after washing. CH2 stretching bands can be seen between 3000 and 2800 cm-1
before washing which are absent after washing. ............................................................ 143
Figure 5.8. Adsorption of maltose and cellobiose on maltose imprinted Stöber particles
and non-imprinted Stöber particles ................................................................................. 144
xii
Figure 6.1. FTIR for titanosilicate thin films with increasing amount of titania
incorporation from bottom to top. The figure shows increase in the intensity of the peak
at 960 cm-1
as the amount of incorporated titanium increases. ....................................... 166
Figure 6.2. Nitrogen adsorption isotherms for mesoporous titanosilicates.................... 167
Figure 6.3. Pore size distribution for mesoporous titanosilicates estimated using the KJS
method............................................................................................................................. 168
Figure 6.4. Low angle X-ray diffraction pattern for mesoporous titanosilicates and pure
mesoporous silica. ........................................................................................................... 169
Figure 6.5. FT-IR absorbance spectra of titano silicates with varying Ti content (a) TS-1
(Ti 2.9 %) and mesoporous titanosilicates with Ti content corresponding to (b) no Ti (c)
Ti 7.4 % (d) Ti 5.35 % (e) Ti 3.29% and (f) Ti1.14% ........................................... 170
Figure 6.6. Ratio of the integrated areas of the 960 and 800 cm-1
IR bands with respect to
the framework titanium content in different bulk titanosilicate powders. ...................... 171
Figure 6.7. Diffuse reflectance UV-visible spectra of samples (a) BaSO4 as background
(b) SiO2 (Ti 0 %) (c) TS1 (Ti 2.9 %) (d) S-3 (Ti 5.35%) (e) S-1 (Ti1.14%) (f) S-2
(Ti 3.29%) (g) S-4 (Ti 7.4%) and (h) TiO2 (Ti 100%). ............................................ 172
Figure 6.8. Conversion and selectivity of various titanosilicate samples with respect to Ti
content. With increasing mol percentage the samples go from S1 (1.29% titanium) to S4
(7.1 % titanium). ............................................................................................................. 173
Figure 6.9. Reflectance spectra of calcined and uncalcined titanosilicate Stöber particles
collected using ATR. A) Spectra between 2600 and 3000 cm-1
wavenumber, showing
peaks between 2900 cm-1
and 3000 cm-1
associated with CH2 stretching before
calcination and disappearance of such peaks after calcination. B) Spectra between 700
and 1700 cm-1 shows siloxane stretching band with peak at 1050 cm-1 and a peak at at
960 cm-1 due to Si-O-Ti vibrations and Si-OH bond vibrations. After calcination the
intensity at 960 cm-1 reduces due to removal of surface hydroxyl groups and residual
intensity as a result of Si-O-Ti vibrations is observed. ................................................... 174

1
CHAPTER ONE
1. INTRODUCTION
Surfactants from an important category of chemicals which find multiple applications
in industry and the laboratory due to their amphiphilic nature. Saccharide surfactants
represent an important class of amphiphiles due to their possible production from
renewable resources and biodegradability. However, saccharide surfactants alone do not
always confer the set of properties needed for a given application. Surfactant mixtures
are often used in industrial applications instead of a single surfactant due to their superior
properties compared to individual surfactants(1-3). Mixtures of non-ionic (such as sugar-
based) and ionic surfactants often exhibit synergism which tends to lower the cmc of the
surfactants and the surface tension of their solutions compared to ideal surfactant
mixtures(4). In our lab templated porous materials have been synthesized using mixtures
of cationic surfactants and saccharide surfactants(5, 6). The long-term goal of their use
for materials synthesis is to utilize the saccharide headgroups to imprint the surface of the
materials with selective adsorption and catalytic sites. Thus, understanding the behavior
of mixtures of cationic and saccharide surfactant in micelles at low concentrations may
help in screening surfactants for synthesis of templated materials.
Mixtures of cationic surfactants and saccharide surfactants have been studied
experimentally using a variety of techniques in the past(2). From a theoretical point of
view, modeling the mixing behavior of surfactants is a challenging problem that has been
approached from a variety of directions(7). Significant models have been proposed by
the Blakschtein group(4, 8-10) and by Nagarajan(11). Despite the availability of detailed
models, experimental data are often not detailed enough to justify their use. Rubingh’s
2
model,(12) which is based on regular solution theory (RST), is often used to model the
effects on the critical micelle concentration (cmc) of nonideal mixing as represented with
a single thermodynamic parameter (β) which can be used to compare the degree of non-
ideality of various surfactant mixtures. RST assumes that the excess entropy of mixing is
zero and the validity of the model has been questioned by Hoffman and Poessnecker(13).
Despite its limitations, its widespread use in surfactant systems makes RST a reasonable
starting point for the development of a nonideal surfactant thermodynamic mocel. In this
dissertation, a model for isothermal titration calorimetry (ITC) has been developed using
RST and applied to cationic / saccharide mixtures.
In addition to these fundamental studies, mixed surfactants are of particular interest to
our group as novel metal oxide templating systems. Silica surface can be functionalized
or imprinted to create sites complementary to the template molecule. It has been
hypothesized that the polymerization of silica precursor around template molecules can
be used to create molecular recognition sites specific to a particular molecule(14). In this
regard, saccharide surfactants are of interest because the headgroup can create molecular
recognition sites which are specific to a target saccharide and may lead to applications
like sensing and separations. Molecular imprinting has been widely explored in the past
using both organic and inorganic polymer matrices(15-19) for applications including
catalysis, sensing and adsorption. In this dissertation, molecular imprinting will be
explored on the surface of nonporous silica particles for preferential adsorption of
targeted saccharide molecules.
In addition to bare surfaces, transition metals supported on silica are of significant
interest due to their potential catalytic activity. Silica is an excellent support due to its

3
mechanical, chemical and thermal stability. Synthesis of templated materials,
incorporating transition metals in the silica structure has been explored in the past(20,
21). The catalytic activity of the mixed metal oxides is high and arises from the variable
oxidation and coordination states of transition metals. Saccharide surfactants during such
a synthesis could play a dual role of reducing the reactivity of transition metal oxide
precursors and acting as structure directing agents. Use of saccharide surfactants will be
demonstrated in this work for synthesis of porous and nonporous titanosilicates.
1.1 Research Hypothesis
Three hypotheses will be tested in this dissertation. First, during modeling of the
non-ideal mixing behavior of surfactants, it is hypothesized that a model for the
thermodynamics of mixing based on RST can model the non-ideal mixing behavior of
cationic and saccharide surfactants. Consistent application of RST to thermodynamic
data obtained using Isothermal Titration Calorimetry (ITC) will be explored to model the
broad micellization transitions observed for some non-ideal surfactant mixtures.
The second hypothesis tested is that Stöber(22) silica particle can be imprinted for a
desired target molecule by adding a mixture of surfactants that includes an analogue of
the target at a point just after the particles form. It is believed that such a process will be
tunable for selectivity towards various saccharides through minor changes in the
synthesis procedure and selection of the right surfactant mixture. Such nonporous
imprinted materials are expected to be selective adsorbents with low diffusion resistance,
and could be used for sensing applications as well. It is also hypothesized that such
molecularly imprinted materials may demonstrate preferential adsorption based on chiral
differences between the target saccharide and closely related compounds.

4
The third hypothesis is that it is possible to synthesize porous or nonporous metal-
silicates with well distributed transition metal sites using complexation of saccharide
surfactants with the transition metal oxide precursor. The complexation is expected both
to reduce the hydrolysis rate of the transition metal precursor and to help distribute metal
sites throughout the material.
1.2 Research Contribution
The work shown in the dissertation mainly contributes to the fields of material
synthesis and thermodynamics of non-ideal surfactant mixing. Chapter 2 presents a
literature survey of areas addressed, building a foundation for the work shown in the
dissertation. Some of the experimental techniques used in the work are also discussed
here in detail. In chapter 3, Isothermal Titration Calorimetry (ITC) is used to measure the
demicellization thermodynamics for a surfactant system consisting of
hexadecyltrimethylammonium bromide (CTAB) and n-octyl-β-D-glucopyranoside
(C8G1). A model is developed for this non-ideal surfactant mixture through application
of regular solution theory and applied to the CTAB / C8G1 system.
Chapter 4 demonstrates the use of CTAB and C8G1 to synthesize imprinted
nonporous materials capable of preferential adsorption of D-glucose compared with D-
xylose. The chapter also discusses experiments performed to support the hypothesis that
early time of addition (around 1 minute after silica precursor addition) is the best time of
addition to get maximum amount of surfactant onto the surface of particle as well as to
show best enhancement of imprint molecule adsorption. Versatility of the method is
shown through use of a different saccharide surfactant (n-octyl-β-D-xylopyranoside
(C8X1)), to target D-xylose adsorption. Chapter 5 extends the use of the molecular
imprinting technique described in Chapter 4 to study the difference in adsorption of

5
saccharides differing in chirality. Materials imprinted for D-glucose have prepared for
comparison of the adsorption of D-glucose, D-mannose, D-galactose and L-glucose.
Synthesis of materials imprinted with a combination of CTAB and n-dodecyl-β-D-
maltopyranoside (C12G2) is also demonstrated. The synthesized materials are used to
compare adsorption of D-maltose and D-cellobiose, which differ from each other only by
the anomeric form of the 1,4 glucosidic linkage.
Chapter 6 will discuss a collection of work done on the synthesis of mesoporous thin
films, bulk materials and nonporous materials incorporating titania within the silica
framework. Thin films are synthesized first to demonstrate the incorporation of isolated
tetracoordinated titanium sites through ligand assisted templating. Bulk titanosilicates
are then synthesized and characterized for use as epoxidation catalysts to further
demonstrate the presence and utility of tetracoordinated titanium sites. Finally, the
possibility of incorporation of titania by surfactant complexation during the synthesis of
nonporous particles is also demonstrated in this chapter. Chapter 7 provides a summary
of the research presented in the dissertation and discusses potential future direction
suggested by this research.
Copyright © Suvid Joshi 2014
6
CHAPTER TWO
2. BACKGROUND
2.1. Summary
This chapter briefly reviews prior work relevant to remaining chapters of this
dissertation. The first part discusses saccharide surfactants and their technological
importance. This section also contains a discussion of the thermodynamic effects of
surfactant headgroup, anomeric form and tail length. Adsorption of glucosidic surfactants
on solid surfaces is also discussed. In the second part, mixtures of glucosidic surfactants
with other surfactants are discussed, and the application of regular solution theory to
mixture of surfactants studied in Chapter 3 is developed. Adsorption of mixtures of
surfactants is also discussed with primary focus on cationic/non-ionic surfactant
mixtures. The third part of chapter discusses molecular imprinting strategies with
emphasis on imprinting of inorganic materials. The same section also discusses various
routes that have been reported to synthesize imprinted materials and the use of surfactants
to develop imprinted sites on inorganic materials. This is relevant to Chapters 4-5 of the
dissertation. Synthetic methods of forming silica materials are then discussed with
methods involved in both porous, nonporous and thin films synthesis. The porous
materials are discussed in relation with strategies involved in pore templating and
coassembly of surfactants and inorganic species to form networked structures.
Incorporation of metal oxides in the silica structure is also discussed. Finally, the chapter
includes an introduction to several of the techniques used in the course of completion of
this work including isothermal titration calorimetry (ITC), x-ray diffraction (XRD),
7
Fourier transform infrared (FTIR) spectroscopy, scanning electron microscopy (SEM),
nitrogen adsorption porosimetry, and dynamic light scattering (DLS).
2.2 Introduction to saccharide surfactants
Surfactants are amphiphilic molecules with polar headgroups and nonpolar tails. They
tend to arrange themselves at interfaces in an orientation that leads to reduction in surface
energy. Saccharide surfactant are generally nonionic surfactants, with hydrocarbon tails
and nonionic polar headgroups which are derivatives of sugars. Saccharide surfactants
include sorbitan esters, sucrose esters, alkyl polyglycosides and other categories such as
methylglucosides and anionic alkyl polyglycosides(23). Out of these, (poly)glucoside
surfactants and their derivatives are of particular interest due to the possibility of
synthesis from renewable resources, high biocompatibility, high surface activity, solid
surface adsorption affinity, and biodegradability.(23) Emil Fisher discovered the reaction
of alcohols with glucose to form alkyl glucosides more than 100 years ago(24). Further
developments led to processes for the reaction of glucose with various lengths of alkyl
chains. The reaction product is a mix of glucosides polymerized to various degrees and
attached to alkyl chains and hence industrially the mix is known as alkyl
polyglucosides(23). Glycosidic formulations find applications in detergency(25), as
antifoaming agents(26), in synthesis of templated materials(27), in cosmetic applications,
biomimetic sciences(28) and biochemical separations(29).(23)
Like all surfactants, alkyl polyglycosides undergo aggregation at concentrations
above the critical micelle concentration (cmc). At the cmc, a steep change in enthalpy is
generally observed, which is similar to changes observed during type I transitions in
thermodynamics (melting of solids)(23). Similarity to other phase transitions has led to
8
the pseudo phase separation approach, in which micellar aggregates are treated as a new
phase at equilibrium with a homogeneous monomer solution(30, 31). Enthalpic data for
glycosides with varying chain lengths and different headgroups have been reported by
various groups and are listed in Table 1. With increase in tail length, the surfactants
aggregate at lower concentrations due to unfavorable interactions of hydrophobic chain
with water. As would be expected, Boyd et al. reported a decrease in cmc with increasing
chain length for maltosides and glucosides(32). On the other hand, with increasing
polymerization in the headgroup, hydration would be expected to increase due to the
increase in polar hydroxyl groups, which would correlate with an increase in cmc, but
such behavior is not observed for maltosides and glucosides(33, 34). The tail length tends
to govern the cmc for glycosides.
Glycosides are classified based on the headgroup, the tail length and chirality of the
headgroup (α vs. β anomer or L vs. D isomer(35)). A large variation in bulk and surface
properties of these surfactants is observed based on isomerization of the headgroup. The
change in structure of the surfactants has significant thermodynamic and physicochemical
effects. Solution properties of glucoside surfactant micellization in water have been
studied using techniques including light scattering, fluorescence techniques, surface
tension, speed of sound measurements, densitometry and NMR. It has generally been
reported that α anomers have lower cmc values compared to β anomers, suggesting that α
anomers aggregate more easily due to higher hydrophobicity caused by the orientation of
the headgroup(36-38). The anomeric form also tends to influence the type of self-
assembled structure formed – for example, Foscher et al.(39) reported difference in self
assembled structures formed by α-C8G1 which formed large non-spherical aggregates

9
and β-C8G1 formed spherical micelles. The difference in anomeric structure influences
orientation of polar residue and in turn influencing packing of monomers. Table 1
provides list of the effects of chain length, headgroup and anomeric center on the cmc of
the surfactants. The Krafft temperature of α anomers has also been reported to be higher
than for β anomers, consistent with lower aqueous solubility of the α anomer(40).
Thermodynamic properties including the enthalpy, Gibbs free energy and entropy of
micelle formation can be indirectly determined from cmc measurements using the van’t
Hoff relation(41, 42). Based on the pseudophase model, the Gibbs free energy of
micellization for a nonionic surfactant can be determined from equation 2.1.
(2.1)
The van’t Hoff equation then gives equation 2.2:
(
)
( )
(2.2)
The entropy of the system can then be determined as
(2.3)
In addition to micellization, lyotropic liquid crystal behavior of glycoside surfactants
has been studied to a significant extent. Nilsson et al. presented SAXS and NMR
measurements regarding the liquid crystalline behavior of glucosides with varying carbon
tail length from 8 to 10(43, 44). They observed similar behavior for 8 and 9 carbon chain
where binary phase diagrams were dominated by large micellar regions and smaller
10
liquid crystal regions containing hexagonal region followed by bicontinous cubic phase
and lamellar phase at high concentrations. They also observed that for C10G1 only two
phases existed, either micellar or lamellar. Boyd et al. discussed the effect of maltosides
in comparison to glucosides in lyotropic phase formation(45). They concluded that
increasing degree of polymerization in headgroup had significantly increased surfactant
solubility. Increasing chain lengths significantly impacted lyotropic phase behavior due
to hydrophobic effects leading to phase separation at low concentrations. It was also
observed that the anomeric configuration had large effects on lyotropic phases for shorter
chain lengths, but the effects diminished for longer chains. Apart from these studies Boyd
et al(32) and Platz et al(46) have also drawn similar conclusions about phase behavior of
alkyl glucosides.
Adsorption of glycosidic surfactants on both hydrophilic and hydrophobic surfaces
has been studied in the past. Zhang et al studied the adsorption of C12G2 on alumina and
silica at pH 7 and 25 ˚C. It was observed that the adsorption of saccharide surfactants
took place in three stages. Initially the surfactants form a monolayer on the solid surface
in the first stage. In the second stage adsorption hemimicelles or solloids are formed due
to chain-chain interactions and in the third stage a plateau region is observed. The region
of change in slope between second and third stage is cmc of the surfactant associated
with formation of micelles on the solid surface. Although in the study, alumina adsorbed
surfactant strongly, on the silica surface the adsorption was negligible(47).
Adsorption on the alumina surface has also been reported based on changes in the
surfactant headgroup, tail length, pH of the medium and addition of salt. It was reported
that with a change in headgroup from maltose to glucose the amount of adsorbed
11
surfactant increased. Closer packing due to smaller headgroup was reported as the reason.
With change in tail length the inflection point at the point of surface saturation varied
based on the cmc of the surfactant(23). The S shaped adsorption isotherms indicated
stronger surfactant-surfactant interactions compared to surfactant solid interactions(48).
The S shaped curves indicate weak driving force for adsorption at low concentrations.
Stronger interactions, like electrostatic forces would lead to higher driving force for
adsorption and a slope of 1 at lower concentrations(49). Through change in pH it was
observed that the adsorption of surfactants on alumina was not affected by the charge on
the solid surface(47, 50).
Although adsorption has been studied on fully formed solid surfaces, the study in the
thesis will talk about adsorption of surfactants during formation of silica particles when
particles are still soft. The surfactant amount used is just enough to form a monolayer on
the silica surface and no micelle formation at solid liquid interface is expected.
2.3 Mixed micelles involving saccharide surfactants
As mentioned earlier, due to biodegradability and potential synthesis from renewable
resources, glycosidic surfactants are of significant current interest. Using mixtures of
surfactants can extend their applications, especially when synergy arises in their
interfacial properties due to favorable interactions between the components of the
mixture. Mixtures that include sugar surfactants have been shown to reduce the amount
of surfactant required for microemulsion stabilization(51), to provide better detergency in
mixtures with cationic surfactants(52), to enhance micelle enahanced ultrafiltration,(53,
54) and for micellar catalysis(23, 55). A novel potential application of these mixtures
would be in materials synthesis. In addition to the advantages of sugar-based surfactants
found in other applications, their interactions with metal oxide precursors and organic
12
groups are of interest to our group for potential molecular imprinting to impart selectivity
towards sugars. Mixtures of surfactants have been used as micellar templates for
synthesis of ordered porous materials(56, 57) and sugar surfactants mixed with cationic
surfactants have been shown to be applicable to materials formation in concentrated
lyotropic liquid crystal-like solutions(5, 6). In this section, mixed surfactant micelle
thermodynamics and studies of mixed sugar surfactant systems are discussed.
2.3.1 Thermodynamic models
Mixed surfactant systems have been well studied over the past few decades(55).
Learning the solution behavior of surfactants and surfactant mixtures is important both
for fundamental understanding of these systems and for developing their applications.
Solution thermodynamics has been well studied and theoretical aspects of micellar
thermodynamics have been summarized by Hines(7), and models proposed for
micellization have been summarized by Nishikido(58). Various thermodynamic theories
have been proposed to consistently explain micellization behavior and thermodynamics
in mixtures by Nagrajan(11), Blankschtein and coworkers(4, 9, 10, 59), Maeda(60),
Motomura(61), Clint(62), and Holland and Rubingh(12). The thermodynamic framework
of Clint for ideal mixtures of surfactants and the regular solution theory model of Holland
and Rubingh for non-ideal surfactant mixtures are here. Both models are based on
pseudophase approximation approach. In the pseudophase approximation, micelles are
assumed to act as a separate phase from the bulk monomeric phase, and thermodynamic
equilibrium between the micellar phase and the monomeric phase is used to develop
required relationships. Clint’s(62) model utilizes the pseudo phase approximation to give
a thermodynamic model for ideal mixture of surfactants. The model begins by defining
13
the chemical potential of surfactants in monomeric and micellar form. Assuming activity
coefficients of one for monomers,
(2.4)
Where is the standard chemical potential and
is the concentration of
monomeric surfactant i in the bulk solution. For a mixed micelle the chemical potential of
the ith
component in a micelle with ideal mixing can be expressed in a pseudo-
equilibrium framework as(62):
(2.5)
where is the cmc of the pure component i, is the surfactant mole fraction of i in the
micelle. At equilibrium, and so using equations 2.4 and 2.5 leads to:
(2.6)
Where, is the mole fraction of ith
component in the total mixed solute, and is the
cmc of the mixture. For an n component ideal mixture, the cmc of the mixture is
calculated as:
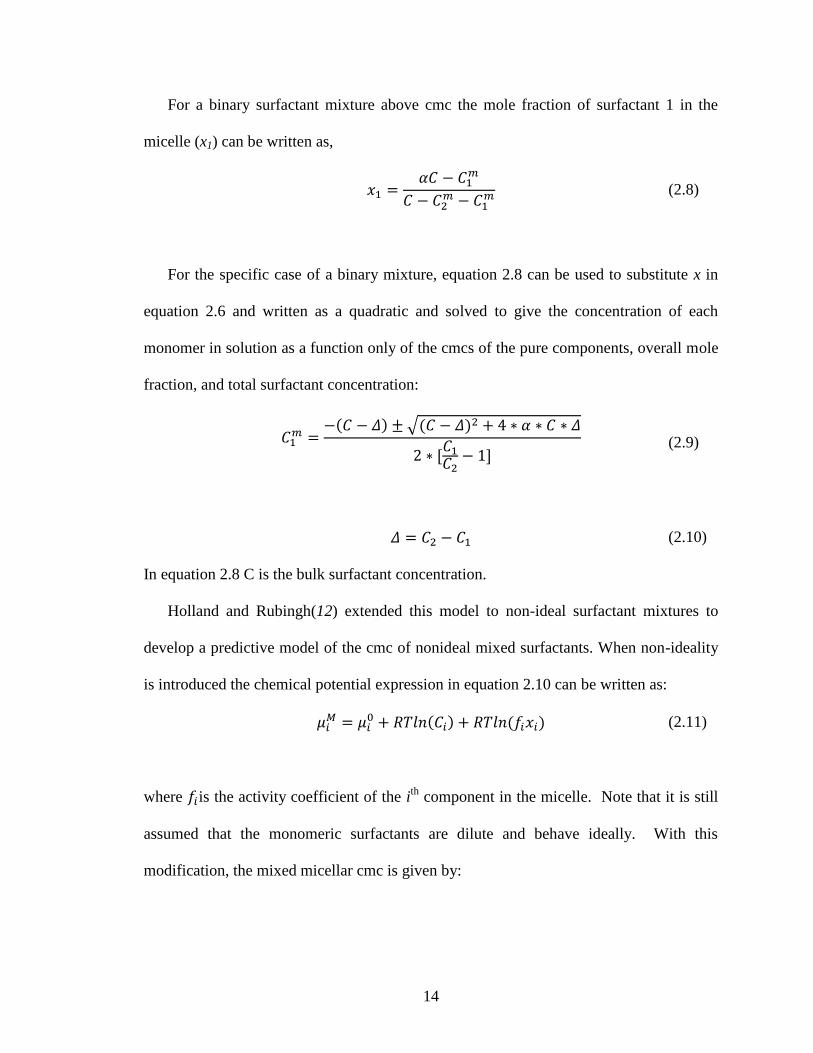
For a binary surfactant mixture above cmc the mole fraction of surfactant 1 in the
micelle (x1) can be written as,
∑(
)
(2.7)
Based on phase separation approximation, applied to ideal micelles.
14
For a binary surfactant mixture above cmc the mole fraction of surfactant 1 in the
micelle (x1) can be written as,
(2.8)
For the specific case of a binary mixture, equation 2.8 can be used to substitute x in
equation 2.6 and written as a quadratic and solved to give the concentration of each
monomer in solution as a function only of the cmcs of the pure components, overall mole
fraction, and total surfactant concentration:
√
(2.9)
(2.10)
In equation 2.8 C is the bulk surfactant concentration.
Holland and Rubingh(12) extended this model to non-ideal surfactant mixtures to
develop a predictive model of the cmc of nonideal mixed surfactants. When non-ideality
is introduced the chemical potential expression in equation 2.10 can be written as:
(2.11)
where is the activity coefficient of the ith
component in the micelle. Note that it is still
assumed that the monomeric surfactants are dilute and behave ideally. With this
modification, the mixed micellar cmc is given by:

15
∑(
)
(2.12)
For a binary system, based on the regular solution theory (RST) the activity
coefficients are given by:
( ) (2.13)
(2.14)
where β is the thermodynamic interaction parameter which relates to the
difference in the enthalpic interactions between the two components compared to their
interactions with like compounds. Although RST assumes that the excess entropy of
mixing is zero, the approximation is adequate to predict nonideal cmc trends and is
widely used in practice(23). To further expand the applicability of the theory, an
equation for the concentration of monomers of each type can be developed following the
derivation of Clint, which leads to the following nonideal monomer concentration
expression:
√
(2.15)
(2.16)

16
A visual basic function is used in excel to solve for the value of x1 and x2 using
Newton Raphson method. For non-ideal surfactant mixtures, equation 2.6 can be written
as:
(2.17)
Similarly for non-ideal binary surfactant mixtures equation 2.8 for the mole fraction
of surfactant 1 in micelle can be written as:
(2.18)
Where α1 is the mole fraction of surfactant 1 in the bulk and C is the overall
concentration of the surfactant solution.
Using equation 2.18 and substituting for f1 and f2 using equations 2.13 and 2.14
respectively, a nonlinear equation with only x1 as the unknown can be obtained.
(
)
( )
(2.19)
Equation 2.19 has been solved in the work shown in Chapter 3 using Newton
Raphson method. A differential of equation 2.19 was taken for the solution and a guess
value 10 times smaller than the bulk mole fraction of surfactant with higher cmc value
was used to calculate x1. As excel cycles thorugh possible nonlinear solutions, the values
of cmcs of surfactant 1 and 2 in the binary mixture model get updated, thus landing on a
final value of micellar mole fraction and concentrations of surfactant in micellar and
monomeric form.
2.3.2 Mixtures with cationic, anionic and nonionic surfactants
Mixtures of alkyl polyglycosides have been studied with various ionic and nonionic
surfactants for quite a while. The studies involved either water as the medium or salt
17
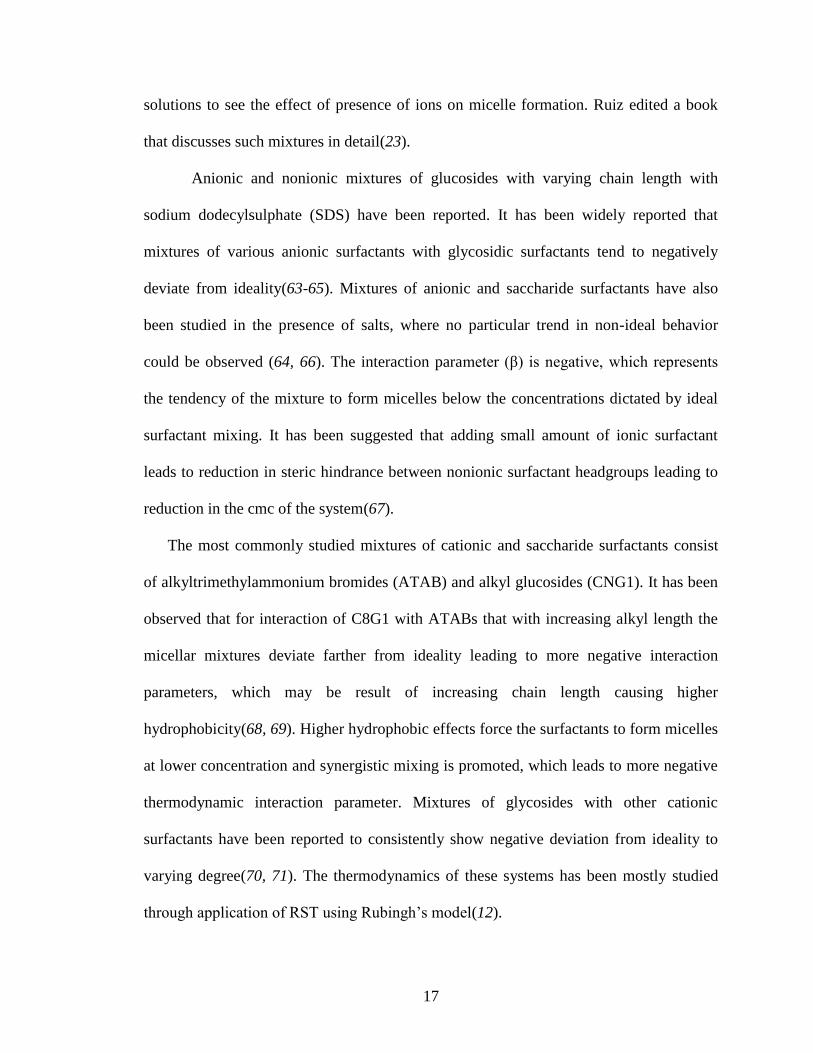
solutions to see the effect of presence of ions on micelle formation. Ruiz edited a book
that discusses such mixtures in detail(23).
Anionic and nonionic mixtures of glucosides with varying chain length with
sodium dodecylsulphate (SDS) have been reported. It has been widely reported that
mixtures of various anionic surfactants with glycosidic surfactants tend to negatively
deviate from ideality(63-65). Mixtures of anionic and saccharide surfactants have also
been studied in the presence of salts, where no particular trend in non-ideal behavior
could be observed (64, 66). The interaction parameter (β) is negative, which represents
the tendency of the mixture to form micelles below the concentrations dictated by ideal
surfactant mixing. It has been suggested that adding small amount of ionic surfactant
leads to reduction in steric hindrance between nonionic surfactant headgroups leading to
reduction in the cmc of the system(67).
The most commonly studied mixtures of cationic and saccharide surfactants consist
of alkyltrimethylammonium bromides (ATAB) and alkyl glucosides (CNG1). It has been
observed that for interaction of C8G1 with ATABs that with increasing alkyl length the
micellar mixtures deviate farther from ideality leading to more negative interaction
parameters, which may be result of increasing chain length causing higher
hydrophobicity(68, 69). Higher hydrophobic effects force the surfactants to form micelles
at lower concentration and synergistic mixing is promoted, which leads to more negative
thermodynamic interaction parameter. Mixtures of glycosides with other cationic
surfactants have been reported to consistently show negative deviation from ideality to
varying degree(70, 71). The thermodynamics of these systems has been mostly studied
through application of RST using Rubingh’s model(12).

18
Mixtures of nonionic surfactants with other nonionic surfactants have also been
studied. Unlike ionic and nonionic surfactant mixtures, saccharide surfactants mixed with
other nonionic surfactants show ideal behavior in some cases(67, 70, 72, 73), but there
are some mixtures with nonionic surfactants which show deviation from ideality in
absence of salt(67, 70) as well as in presence of salt(67, 73). The non-ideal behavior
shows negative deviation from ideality. Sierra and Svensson suggested that such
behavior could be result of favorable packing leading to formation of micelles at lower
concentrations than ideal behavior would suggest(67). Tsamaloukas et al.(74) applied
Clint’s(62) model to mixing of maltosides with varying chain lengths to ITC data. The
behavior of maltosides in water is ideal in nature. It was found that it was possible to
model the enthalpic curves of mixtures of maltosides based on Clint’s model(62). Apart
from matching the demicellization curves for maltosides the fitting also provided the
enthalpy of demicellization and cmcs of the pure components.
2.3.3 Adsorption of surfactant mixtures on solid surfaces
Adsorption of mixtures of saccharide surfactants with anionic and cationic surfactants
on both hydrophilic and hydrophobic surfaces is documented(23). Due to the application
at hand, mixtures of cationic and saccharide surfactants will be discussed here.
In a surfactant mixture, the species that adsorbs is called the active species and the
species that coadsorbs on the solid is called the passive species. Usually ionic surfactants
only adsorb on the surface of oppositely charged solids, while the adsorption of sugar
surfactants is not generally affected by the charge of the solids. The interactions can be
described as follows,

19
1. Active nonionic + active ionic/nonionic surfactants: This kind of interaction
occurs when both surfactants favor adsorption on the solid. In the pre-saturation
region synergistic adsorption takes place, while in plateau region antagonistic
interactions result due to competition. Due to electrostatic interactions ionic
surfactants adsorb more in the plateau region. Such interaction has been reported
for SDS/ octaethylene glycol mono-n-dodecyl ether (C12EO8) adsorption on
kaolinite(75).
2. Active nonionic + passive ionic surfactants: On similarly charged solids ionic
surfactants become passive. Ionic surfactants co-adsorb in such a case through
chain-chain interactions with active sugar surfactant. Nonionic surfactants also
reduce electrostatic repulsions in such a case. In the plateau region the adsorption
of mixture is lower than adsorption of just sugar surfactant in such a case.
3. Passive nonionic + active ionic surfactants: In presence of ionic surfactant with
opposite charge as solid surface, the adsorption of sugar surfactant is aided by
ionic surfactant through synergism. Chain-chain interactions promote adsorption
of sugar base surfactants in the plateau region as well as preplateau region. Many
such examples are available in the literature where an increase of sugar surfactant
adsorption was reported by orders of magnitude in presence of an active ionic
surfactant(76-78).
It was observed by Zhang et al.(79) that on a fully formed silica at pH 9, C12G2 did
not adsorb, while in presence of dodecyltrimethylammonium bromide (DTAB)
adsorption of the mixture took place. It was also reported that the synergistic interactions
led to higher adsorption of DTAB from solution in presence of sugar surfactant before a
20
plateau due to surface saturation and formation of hemimicelles was observed. The
adsorption amount increase in C12G2 adsorption is a result of hydrophobic chain-chain
interaction while adsorption of DTAB resulted from electrostatic interactions.
Although these interactions are reported on fully formed solid surfaces, such
interactions are expected to be relevant to imprinted Stöber particle synthesis for mixtures
of CTAB and C8G1 when used as an imprinting mixture. It is believed that better
surfactant/ surface interaction are likely to results due to electrostatic interactions of
CTAB with the precipitated liquid-like silica precursors, leading to better interaction of
soft silica with C8G1.
2.4. Molecular imprinting
Molecular imprinting is the technique of creating molecular recognition sites in a
polymer matrix through use of a template. Molecular imprinting was reported nearly 60
years ago(19) and vast amount of literature is available on the same topic(15, 17-19, 80-
84). Polyakov(85) and his group in 1931 revealed that silica prepared by addition of
toluene, xylene or benzene led to adsorption advantage to the molecule added to the silica
gel during preparation(16). The property was attributed to changes in the silica structure
based on the additive. Dickey in 1949 reported that adding methyl orange at the
beginning of silica synthesis led to creation of molecular recognition sites which
demonstrated selectivity for methyl orange(14). Haldeman and Emmett later verified the
results for other alkyl orange dyes and showed that the entrapped dyes interfered with the
results of the experiments(86). Curti et al in 1950’s also demonstrated chiral selectivity
using molecularly imprinted silica as stationary phases in chromatographic columns(87).
Klotz extended the molecular imprinting for methyl orange using polymers instead of

21
silica(88) and Wulff et al demonstrated imprinting of polymers for resolution of
racemates(89).
Imprinting involves three steps starting with template selection followed by
incorporation of the template into a matrix and removal of the template, leaving behind
recognition sites(19). Multiple techniques can be used to develop molecularly imprinted
sites in a material. The techniques are briefly discussed here; reviews by Collinson(80)
and Alexander et al(16) provide elaborate discussions of the techniques.
Covalent imprinting involves covalent bonding of the imprinting molecule with the
polymerizable group(16). The covalent bonds between the template and polymers must
be chosen so that they can be broken to leave behind the imprinted functionality.
Selectivity can be obtained by re-establishing the covalent bond with the target
molecules. Though the bond formation is very specific, only a limited number of groups
can undergo such imprinting(16). The rebinding kinetics in covalent imprinting approach
is also found to be very slow. The examples of such imprinting are for carboxylic
acids(90), amino acids(91), aldehydes(92), ketones(93) and various saccharide
derivatives(94-96).
Non-covalent approach involves use of weak forces like hydrogen bonding, van der
Waals forces, ion-pairing and dipole interactions(16) for molecular recognition. This
method is most commonly used for imprinting due to simplicity. Removal of templates is
very simple in this approach and washing may be enough to remove templates(80).
Though the technique is simpler, non-covalent approach gives the possibility of non-
specific binding. Arshady and Mosbach described the use of such technique as host guest
complex formation to accomplish non-covalent binding with easy removal of

22
template(97). Collinson and coworkers have also demonstrated the non-covalent
imprinting approach for sol-gel silica materials(98, 99).
Other approaches to molecular imprinting are available.(16) In stoichiometric non-
covalent imprinting(100), the equilibrium favors the complex formed between
polymerizable species and the imprinting molecule. The semi-covalent approach involves
template binding through covalent bond formation. After template removal the sites left
behind show non-covalent binding with target molecules. This technique provides
uniform site distribution for binding. Sometimes a spacer is added in this approach to
reduce formation of sites close to each other(101). Metal ion imprinting approach
involves property of transition metals to form complexes with compounds as the active
imprinting agent(83).
Imprinted silica materials find a large number of applications in selective catalysis,
separation, adsorption and sensing(19, 102). Silica is chemically and thermally stable and
has the ability to incorporate heteroatoms in the structure linked by covalent bonds. Due
to higher stability, removal of templates in silica based materials using harsher conditions
becomes possible. Silica based materials also provide the ability to block the non-
imprinted sites using silanol chemistry. Due to the mild condition involved in the
synthesis of such materials using sol-gel method it is also possible to imprint the
materials for biomolecular recognition(80). It is also possible to process the silica based
materials in various forms like bulk porous/nonporous materials, thin films and
membranes. These advantages make silica materials useful for molecular imprinting.
Chapter 4 and 5 discuss imprinted materials for saccharide separations. Some
examples of molecularly imprinted silica are discussed here for various applications like
23
detection, catalysis, sensing and separation. Dai et al demonstrated the use of silica based
molecularly imprinted materials for enhanced metal ion sorption using UO2(NO3)2.6H2O
as template. The prepared material gave enhanced selectivity for uranyl ion(103)
compared to a non-imprinted gel. Makote and Collinson(98) made molecularly imprinted
silica films which demonstrated molecular recognition of dopamine. An example of
chromatographic separation using imprinted silica as stationary phase was demonstrated
by Curti et al. which showed partial resolution of enantiomers(87).
Enzyme mimicking catalysis has also been demonstrated on silica based materials by
incorporating a metal site. Morihara et al. reported such enantioselective catalysis for
alumina incorporated silica material(104). Markowitz et al(105-107) reported the
synthesis of silica nanoparticles in reverse microemulsion where the surfactant used to
stabilize the emulsion also acted as the imprinting molecule. The resultant material was
shown to show higher selectivity for D-arginine catalysis compared to L-arginine.
Chemical sensing applications of molecularly imprinted silica have also been reported
in the literature. Xie et al reported imprinting of silica nanotubes for TNT, where acid-
base interactions between TNT and 3-aminopropyltriethoxysilane (APTS) led to creation
of molecular recognition sites. The material was suggested by authors to be ideal for
biomolecule imprinting and detection(108). Dickert and Hayden(109) imprinted
polymers as well as sol-gel materials for whole yeast cells and coated QCM sensors. The
sensors demonstrated detection till 21 g/L of yeast cells in growth medium. Valdes and
group(110, 111) also reported molecular imprinting on silica surface for detection of
toxins using fluorescence.

24
In this work nonporous particles with selectivity which can be tuned to a specific
saccharide will be demonstrated. The nonporous particles are tunable to different
saccharides with use of different surfactants. Chapter 4 and Chapter 5 describe the work
on these particles.
2.5. Silica based materials
Silica is abundant in nature and is utilized as such to manufacture glasses which can
be tuned to have certain properties by doping the structure with various atoms. Silica has
tetrahedral networked structure with each silica atom linked to four oxygen atoms.
Through a reletiavely recent innovation, silica can also be synthesized from silicon
alkoxides and other silicon precursors using sol-gel synthesis. These materials can be
tuned to be porous, nonporous and provide similar physical characteristics as silica.
Dopants can be added to these silica networks during synthesis for catalysis. Some of the
sol-gel materials are discussed here with emphasis on mesoporous and nonporous silica
materials and their applications. The sol-gel process provides the advantage of processing
metal and semi-metal alkoxides at room temperatures instead of high temperatures
usually required to form metal oxide networks. Processing at room temperature provides
the advantage of using organic molecules, like surfactants, as templates and structure
directing agents. Chapters 4,5 and 6 demonstrate the use of surfactants as imprinting
molecules and structure directing agents in synthesis of mixed metal oxides.
2.5.1. Sol-gel process
Sols are defined dispersion of colloidal particles in liquids. A gel is a rigid network of
such colloidal particles which ranges over more than a micrometer(112). Sol-gel process
can be broken down in to seven steps as described by Hench and West(112). The first
step involves hydrolysis of the alkoxide species in the silica precursor. The hydrolysis

25
process can either be catalyzed by a base or an acid. The hydrolyzed species form a
network consisting of Si-O-Si units. The sol can then be given a shape in the casting step.
During gelation the colloidal particles formed lead to formation of three dimensional
networks. During aging which takes place over a long period of time polycondensation
continues and gives rigidity to the structure. Aging is followed by drying which involves
removal of the liquid from the materials. Control of drying step is important to prevent
materials from developing cracks. Dehydration and chemical stabilization is then carried
out to remove surface silanol groups to obtain a non-reactive porous structure. The
materials can then be heated at temperatures higher than a 1000 ˚C for densification
which leads to elimination of pores. Though seven steps have been described here, not all
the steps are carried out all of the time. In basic medium when a lot of water is present
during synthesis the sol agglomerates to form particles, while in acidic conditions and
limited amounts of water condensation of sol in to networked structures takes place(113),
which can be dried to form porous materials.
2.5.2. Templated porous silicates
To explain ordered structure formation in mesoporous silicates various mechanisms
were suggested. Kuroda, Inagaki and co-workers suggested a layered to hexagonal
transition mechanism(114, 115). Davis and co-workers suggested a silicate rod-assembly
mechanism, where a few layers of silicates deposit on the micellar surface and then the
silicate rods assemble in ordered fashion to give the final mesostructure(116).
Stuckey and co-workers proposed the most widely accepted mechanism for organic-
inorganic assembly through a cooperative formation mechanism(117). The mechanism
suggested that silicate polyanions interact with the surfactants through coulombic forces.
26
The final mesophase forms in the self-assembled configuration with the lowest energy
state possible. Further evidence of this was obtained through NMR, SAXS and polarized
light microscopy(118, 119). The mechanism suggested that silicates interact with
surfactants in four possible ways. In basic medium silicate anions (I-) interact with
surfactant cations (S+) through coulombic forces. In strongly acidic medium cationic
silicates and cationic surfactants interact in presence of a strong anionic group for
aseembly (S+X
-I+), where X- is a strong anionic group like halogen, nitrate or sulfate.
Similar to this the other pathways could be S-I+ and S
-X
+I-. Pinnavia and co-workers
suggested a mechanism for synthesis in neutral medium through hydrogen bonding(120,
121).
Surfactant templated materials can be synthesized by the hydrothermal method(122).
In this approach the surfactants are initially dissolved in a solvent to obtain homogenous
solution. Silica precursor is then added which undergoes either acidic or basic
hydrolysis. The hydrolyzed species interact with the surfactants forming gels. The
treatment of the gels formed in reaction mixtures at temperatures ranging between 80 to
150 ˚C is called hydrothermal treatment. The gels are treated to promote solidification of
the network structure. Generally very high temperatures are not used to avoid degradation
of surfactants which would lead to disordered structure. Removal of templates leads to
formation of mesoporous silicates. To remove surfactants treatments like calcination in
air, ultraviolet irradiation, solvent extraction and microwave digestion can be used.
Another route to synthesize templated mesoporous materials is true liquid crystal
templating. This method was first demonstrated by Attard et al(123). When the
concentration of surfactants is raised above the cmc, at a certain point the concentrated

27
solution starts behaving like a liquid crystal, which has a defined crystal structure as well
as flow properties like liquids. The liquid crystal templating approach utilizes the
concentration of surfactants in the liquid crystal range followed by addition of silica
precursor which can be hydrolyzed to create templated materials. This method provides
the ability to predict the final crystalline structure of silicates, which follow the
crystalline structure of the liquid crystals.
The third route to prepare templated silicates is called evaporation induced self-
assembly (EISA). At the beginning, the surfactant concentration in the solution is very
low (below cmc). A solvent with low boiling point is used for such syntheses. A sol
containing the hydrolyzed precursor and surfactants is initially prepared. The dilute
solution is then coated in a thin layer on a substrate and, as the solvent rapidly evaporates,
organized self-assembly of surfactants and silica takes place leading to formation of
templated materials. The first example of this method was reported by Ogawa et al using
spin coating technique(124).
2.5.3. Metal oxide incorporation into the silica framework
Mesoporous silicates make very good supports for incorporation of transition metal
atoms due to their high surface area, uniform and controllable pore size and high thermal
stability. Various transition metals including Ti, V and Cr have been incorporated in the
silica structure to create catalysts. The catalytic activity of these metallosilicates results
from the variable oxidation state of the transition metal atoms. In addition to use as
catalysts, these materials have also been used in electronic, magnetic and optical
applications(125).

28
Titanium containing silica materials are perhaps the most widely studied mixed
oxides. Titanium containing zeolites TS-1(126) and TS-2(127) were synthesized as
oxidizing agents for small molecules. These materials require mild conditions for
oxidation but are limited in application due to their small pore size. It is possible to
incorporate Ti in mesoporous silicates to catalyze bulkier molecule oxidation. Corma et
al(128) and Tanev et al(20) reported synthesis of titanium containing MCM-41 materials.
It was demonstrated that larger accessible pores provide better catalytic activity for
oxidation of large organic molecules(129, 130). Sugar surfactants tend to form complexes
with transition metals. Use of saccharide surfactants has been demonstrated in Chapter 6
to synthesize porous titanosilicates. Saccharide surfactants help in reducing hydrolysis
rate of titania precursor and also acts as a templating agent. The reduction of hydrolysis
rate helps in homogenously distributing titania in the mesostructure.
Titanium can be present in zeolite framework or it can be present as extra framework
titanium. Titania is incorporated directly in the framework by replacement of tetravalent
silicon. The extraframework titanium can have multiple valence states as it is not
restricted by bond formation. It is necessary to incorporate titania in the zeolite
framework as the isolated tetra coordinated sites are thought to be responsible for
oxidation.(131, 132).
Titanium incorporation in materials frameworks can be obtained through sol-gel
synthesis, but due to high reactivity of titanium alkoxides, it is necessary to stabilize it.
Various methods including substoichiometric water addition(133) to hydrolyze the silica
precursor, ligand stabilization of the precursor,(134) and the non-hydrolytic method(135)
29
have been suggested. Ligand stabilization has been used in work presented here to
synthesize silicates with isolated titanium sites.
2.5.4. Nonporous silica particles
Synthesis of dispersions of monodisperse nonporous silica particles were first
described by Werner Stöber et al. in 1968(22). In this work various reaction mixtures
containing different alcohols, alkyl silicates, water and ammonia either dissolved in
alcohol or as ammonium hydroxide were used to make particles of different size. It was
reported that ammonium hydroxide not only catalyzed the hydrolysis, but was also
important for particle morphology. It was reported that in the absence of ammonia, non-
spherical particles of large size distribution were obtained. Bogush et al(136) reported
variation in particle size as a function of temperature at various TEOS concentrations.
They found that at a particular TEOS concentration the size of particles decreased with
increase in temperature of synthesis. They also reported that narrow size distribution
particles between 20 to 800 nm could be synthesized. The effects of variation of water
concentration was also studied at room temperature. It was found that keeping other
reaction conditions the same the size of particles varied like a bell curve. At low
concentrations of water the particle size was small and systematically increased till a
maximum size was obtained. Increasing the water concentration further led to reduction
in size of the particles. The final solids density was low in these synthesis methods. Wang
et al(137) reported a method to synthesize Stöber particles in high concentration of
TEOS. Branda et al(138) reported effect of mixing alkoxides (3-
Aminopropyltriethoxysilane (APTS) and TEOS) on the size of particles; they reported

30
that mixing alkoxides led to formation of fewer but larger particles. The behavior was
explained using an aggregation model.
Stöber particles have been used as supports in various imprinting applications. For
example, Li et al.(139) used silica as support and imprinted the coated polymer layer for
paclitaxel. They observed two types of binding sites with different dissociation constants
on such particles. Wu et al(140) synthesized core-shell particles for chiral separation
application in high performance liquid chromatography. Gao et al(141) used Stöber
particles modified with acrylamide shell for high density TNT imprinting. Direct
modification of Stöber particles has also been reported by incorporating. For example Ow
et al(142) synthesized core shell fluorescent silica particles by incorporation of dye
molecule in Stöber synthesis method. Luckarift et al(143) demonstrated encapsulation of
lysozyme in silica particles with implications in development of anti-fouling materials.
Although multiple applications have been studied, direct imprinting of Stöber particles
has not yet been demonstrated. To design such a technique it is necessary to understand
the formation of Stöber particles.
Stöber particle formation in the past has been explained either through controlled
aggregation model or monomer addition model. LaMer and Dinegar(144) proposed that
all the nuclei for particles formed within a short period of time and that after that the
growth of the particles took place by addition of monomers. The particle growth was
limited by diffusion such that the smaller particles grew faster and larger particles grew
slower. Matsoukas and Gulari(145) used Raman spectroscopy and dynamic light
scattering to find that rate of hydrolysis of TEOS is equivalent to rate of particle growth.
Thus, hydrolysis of TEOS was rate limiting step. Based on these results, Matsoukas and

31
Gulari(146) presented a model which was similar to LaMer. Dinegar(144) suggested that
monomer addition with self-sharpening growth of silica particles formed through
ammonia catalyzed hydrolysis of silicon alkoxides. Aggregation model suggests that the
growth of particles initially occurs through aggregation of colloidally unstable nuclei till
a point where aggregation no longer occurs. The particle smoothening takes place later.
This model was suggested by Feeney et al. for formation of colloidal latex particles(147).
Hochberg et al(148) found proof for formation of such nuclei after polyacrylamide
reached a certain molecular weight when it phase separated. Bogush and Zukoski(149)
used NMR and conductivity measurements to determine the growth kinetics of Stöber
particles. They concluded that unlike monomer addition the growth of particles was not
size limited and that surface reaction limited aggregative growth was happening. Rate of
loss of hydrolyzed silica species was also found to be different than the rate of particle
growth. The aggregation model was further supported by Kim and Zukoski(150) who,
using the theory of colloidal stability, demonstrated that nuclei below the size of 20 nm
would not be stable and would aggregate. Tan and Rankin(151) studied the formation of
porous silica particles in the presence of CTAB and found that such particles formed
initially by nucleation of disordered clusters, followed by aggregation of clusters to form
particles and finally assembly of surfactant micelles at particle surface. Through TEM
imaging they found particles with rough edges at 50 s after TEOS addition similar to
those observed by Bailey and Mecartney(152) for Stöber particles. They also found that
turbidity occurred at 60 s and that particles of final size with surface aggregated micelles
were visible at 70 s.
32
Based on the evidence a strategy to imprint external surface of silica particles by
adding surfactant at the point of turbidity (60 s after TEOS addition). It is expected that
addition of just enough surfactant at such a point of time when particles are soft enough
for surfactant interaction and have achieved their final shape would be helpful for direct
molecular imprinting of silica surface in Stöber synthesis method. The synthesis and
process optimization has been shown in chapter 4. Chapter 4 also demonstrates the use of
such particles in selective adsorption of glucose/xylose on like imprinted materials.
Chapter 5 demonstrates the use of such particles for enantiomeric separation of hexose
and maltose imprinted particles for separation of maltose and cellobiose.
2.6. Characterization techniques
2.6.1 Isothermal Titration Calorimeter (ITC)
In ITC, the heat associated with a chemical or physical process occurring in one cell
is compared with a cell maintained at a constant temperature. There are three different
ways to measure heat change: a) temperature change, b) power compensation
(isothermal) and c) heat conduction(153, 154). It is necessary to understand the type of
calorimeter to understand what the raw data means. A very good review of the three
methods is given by Lewis and Freyer(153).
In a power compensation calorimeter (the approach used here) the temperature of the
cell is maintained constant by using a temperature sensor and a heater/cooler assembly.
As a reaction or thermodyhamic process occurs, the power supplied to the heater/cooler
to bring the system back to isothermal state is measured. The raw signal in an isothermal
calorimeter is the power needed to keep the system isothermal as a function of time. The
other two types of calorimeters operate under similar principles except that temperature
changes or heat conduction are measured over time.
33
A typical schematic of a power compensation calorimeter is shown in Figure 1. Two
cells are employed: a reference cell which usually contains a liquid with similar thermal
properties to the liquid in the sample cell and the sample cell itself. A syringe is
employed to inject titrant into the sample cell which contains either another reactant or a
solution of the titrant at a lower concentration. The cells are surrounded with a large
isothermal bath, and the system is kept in an adiabatic jacket to prevent any effects
associated with external stimuli. The injection process is either carried out stepwise in
small aliquots or as a batch process where all of the titrant is injected into the ampoule
(sample cell) at one time. In the TAM III ITC instrument (TA Instruments), the sample
and reference cells are submerged in an oil bath at a constant temperature. Raw data can
be processed to generate enthalpy vs. concentration diagrams by integrating the area
under the curve for each of the peaks associated with heat evolved in each single
injection step.
For ITC measurements, samples were prepared in the syringe with at least 5 times the
concentration of the expected or known cmc of the surfactant mixture. Care was taken to
avoid very high concentrations to prevent crystallization of dissolved surfactants. In case
of samples where surfactant was not easily solubilized, samples were heated up to 40 ˚C
during initial formation to promote solubilization. Reference cell was always filled with
liquid, with similar physical properties or the solvent in the experimental cell. The
syringe, ampoule and stirring assembly were washed multiple times with DIUF water and
then flushed with dry air to avoid contamination. While filling the ampoules with DIUF
water during experiments, care was taken to make sure that the total volume after
injection of sample from syringe did not go above the mentioned ampoule capacity.

34
Vacuum grease was applied along the edge of ampoule cover to prevent leaks in case the
ampoule was filled. Syringe was filled till the edge to avoid air bubbles. It was necessary
to handle the stirrers with care so as to avoid bending of the stirring rods. Experimental
cell assembly was carefully lowered into the isothermal chamber in three steps separated
by five minutes to avoid sudden change in isothermal chambers temperature. At least
three hours were provided before starting the experiment to attain equilibrium. Enough
time was provided between the injection steps to avoid crossover of tails of data peaks to
the next injection step.
2.6.2. Fourier Transform Infrared Spectroscopy (FTIR)
FTIR investigates vibrational features in the infrared range of wavelengths (2500 to
16000 nm). Atoms connected with a covalent bond can be thought of as balls connected
to springs (associated with bond stretching, bond bending and bond torsion). Atoms
which are lighter or which are weakly bound vibrate at higher frequencies while heavier
atoms or strongly bound atoms have lower vibrational frequencies. As the atoms vibrate
the change in intensity is observed as peaks in absorption spectra. The difference in the
vibrational energy of the atoms is given by(155)
(2.20)
Where h is the Planck’s constant, c is the velocity of light, υ is the frequency and λ is
the wavelength.
Various types of vibrational modes possible are stretching (asymmetric and
symmetric) and bending (scissoring, rocking, wagging and twisting). Depending on the
molecule, the same subunit may give rise to multiple bands due to these different modes.

35
However, if the modes are identified and distinct bands associated with a particular
molecule are isolated, quantitative information may be obtained. An additional FTIR
sampling mode useful for strongly absorbing is attenuated total reflection (ATR) FTIR.
In this technique, the IR beam passes through a faceted infrared-transparent crystal in
which it is internally reflected. The sample (here, an aqueous solution) is dispersed at the
surface of the crystal. The evanescent wave generated at the surface of the crystal is the
basis for the spectral measurement, and gives a total path length on the order of microns.
This allows interfacial sampling or examining solids and liquids with a high extinction
coefficient. Upon exiting the crystal, the infrared beam is reflected back through a series
of mirrors to the detector.
This method has been utilized frequently in this work for qualitative as well as
quantitative analysis. Most of the qualitative analysis was carried out using KBr pellets
to determine presence of certain vibrations indicative of the presence of organic and
inorganic species. The pellets were analyzed using a Thermo Nicolet Nexus 470 FTIR
with nitrogen purged chamber. A DTGS detector with KBr beam splitter was used to
obtain spectra. At least 128 scans at a resolution of 8 cm-1
or higher were collected. KBr
pellets were uniformly pressed using a mechanical pellet press with approximately 1 wt%
sample dispersed in dry KBr. Presence of titania in silica framework during synthesis of
porous titanosilicates was carried out using FTIR. Characteristic peaks associated with
Ti-O-Si vibrations at 960 cm-1
were observed(156). Similarly the presence of surfactants
on Stöber particles as well as removal based on presence/absence of CH2 stretching bands
were utilized to see incorporation and removal of surfactant after washing. The band at
2849 cm-1
is associated with symmetric stretching and the band at 2919 cm-1
is associated
36
with asymmetric stretching(157). For analysis of thin films, the films were dip coated
onto 200 μm thick silicon wafers, it was found that thickness higher than 200 μm was not
gave poor quality spectra. A liquid nitrogen cooled mercury cadium telluride (MCT)
detector was used to detect spectra for thin films.
FTIR-ATR was used as a quantitative technique to analyze saccharide solutions for
adsorption studies. For all spectra, the ATR spectrum of DIUF water was subtracted to
remove the hydroxyl stretching bands between 3400 and 3800 cm-1
. The bands associated
with glucose have been isolated from a collective peak usually observed between 900 to
1500 cm-1
. Generally for sugars, OH vibrational spectra is observed between 3876 to
3005 cm-1
, CH vibrations are seen up to 2061 cm-1
. The C=O stretching is observed
between 1850 to 1634 cm-1
and so on. The region between 900 and 1200 cm-1
was used
to obtain calibration curves in the study. This region has a combination of CO and CC
stretching bands between 1191 and 995 cm-1
. Some CH bending is also observed till 900
cm-1
and below. The low wavenumber region between 600 and 1500 cm-1
has been
shown to have differences based on sugar under study. Elimination of OH vibrational
bands by subtraction of ATR spectra for water created a flat baseline except in the region
between 600 to 1500 cm-1
. Despite this, integrating using the region from 900 to 1200
cm-1
was found to give a highly linear calibration curve. ATR accessory for Nexus 470
with a ZnSe crystal was used for analysis of liquids. For measurement of sugar solution
supernatant for adsorption isotherms, samples were carefully withdrawn to avoid
contamination due to silica particles. In case turbidity was observed the samples were
pushed through a 200 μm syringe filter to remove silica particles.

37
2.6.3. X-ray diffraction (XRD)
Atoms in well-defined spatial arrangements tend to scatter or diffract x-rays in
specific directions related to their structure. It is possible to measure the angle and
intensity of a diffracted beam relative to the source to determine the spatial arrangement.
The diffraction is possible using x-rays because their wavelength is on the order of
atomic spacing. In this work XRD has been used to find the ordering of pores in
synthesized titanosilicates. As the pore sizes are in the range of 2 to 3 nm the diffraction
patterns are usually obtained at low angles. Silica is amorphous in nature and hence no
peaks are obtained at higher angles. It may be possible that titania crystallites may give
diffraction patterns at higher angles, but for the purpose of the work done here higher
angle diffraction patterns were not collected for these materials.
Constructive interference of diffracted X-rays leads to intense peaks at particular
angles. The constructive interference of x-rays is governed by Bragg’s law(158).
(2.21)
In the above equation λ is the characteristic wavelength of x-rays, d is the inter-planar
spacing and θ is the angle of the detector relative to the source. Figure 2.2 shows how
constructive interference is obtained. As the x-rays hit planes 1, 2, and 3 they are
diffracted to give vectors represented as 1’, 2’, and 3’. Constructive interference occurs
when the distance between the planes is a function of n times the characteristic
wavelength (λ). The extra distance travelled by x-rays hitting plane 2 in comparison to
plane 1 is given by 2dsin(θ), which is equivalent to n times λ where n is an integer.
38
The width of the peak in an x-ray diffraction pattern can be used as a measure of
degree of crystallanity of a solid. If the peaks are narrow and sharp, the diffraction pattern
corresponds to highly crystalline materials, if the peaks are broad in a diffraction pattern
the pattern corresponds to imperfect crystals and amorphous materials don’t give any
well-defined peaks. The difference is illustrated in Figure 2.3 adopted from Heiney et
al(159).
XRD patterns were collected for the mesoporous materials between 1.5 to 8˚ angles.
The diffraction patterns were observed due to the diffraction from the inorganic walls of
the porous materials. The mesoporous silicates are amorphous in nature and hence no
diffraction patterns were observed for larger angles (above 10˚). Mesoporous
titanosilicates usually give broad peaks in the low angle range indicating imperfect
mesocrystals. Even though the pores are ordered locally, they are based on liquid crystal-
like structures, which contain many curved defects that give rise to the broad peaks
observed. In case long range order is present for the pores, multiple diffraction peaks can
be obtained. Long range order also helps in determining the crystallographic structure of
the pores based on reciprocal d spacing. For example 2D hexagonal phase is identified by
a reciprocal d spacing ratio of 1:√3: √4: √7: √9 corresponding to (100), (110), (200),
(210), (300) planes in the material. Similarly, Ia3d cubic phase is identified by reciprocal
d spacing ratios of √6: √10: √14: √16: √18: √20 indexed as (211), (220), (321), (400),
(420), (332), (422), etc.
2.6.4. Scanning Electron Microscopy
Scanning electron microscopy involves the use of high velocity electrons to scan the
surface of a material. An electron beam generated using an electron gun is accelerated

39
through a series of condenser lenses (electromagnets) until it hits the sample. Usually
nonconductive samples are coated with a conductive coating to prevent accumulation of
electric charge. As the electron beam hits the surface of material under analysis, Auger
electron, secondary electrons, back scattered electrons and x-rays are emitted. Various
detectors are employed to collect information from the various types of scattering
phenomenon. Secondary electrons which are a result of inelastic scattering are used to
create the image of a surface. The secondary electrons have low energy (<50 eV) and are
emitted from the K shell of atoms(160). The secondary electrons are detected by an
Everhart-Thornley detector(161). SEM can be used to image objects and has resolution to
the order of nm. In this work SEM has been used to obtain images of particles ranging
between 300 to 600 nm. The sample were prepared by grinding the particle clumps using
a mortar and pestle. In some cases the particles were suspended in either ethanol or water
through sonication and a few drops of solution were used to distribute sample on the
carbon tape. The solvent was allowed to evaporate in a fume hood in presence of flowing
air. This was done to form a thinner sample layer promoting better conductivity of
electron beam. The particles were coated with gold / palladium to promote conductivity.
2.6.5 Nitrogen adsorption
Nitrogen adsorption is a technique which is used to characterize the surface area and
pore size for a material. It is non-destructive and provides accurate data as long as a
sufficient quantity of adsorbent is provided. Nitrogen adsorption is carried out at 77 K
and the materials are degassed at temperatures above 100 ˚C to remove any adsorbed
moisture from the pores. Here these experiments will be used to measure the surface area

40
and pore size distributions in titanosilicates, and to confirm the absence of pores in
nonporous particles and to confirm particle size based on the surface area.
According to the IUPAC nitrogen adsorption isotherms can be broadly classified in to
six different categories. A diagram of the six different types of isotherms has been
presented in Figure 2.5. Type I isotherms are typically associate with micropores and the
relative pressure at which adsorption takes place is less than 0.1 (P/P0). Type II
isotherms are associated with nonporous materials where monlayer formation is
succeeded by multilayer formation at high relative pressure. Type III isotherms are
associated with mixed micro and meso porosity. Type IV are a result of weak gas solid
interaction and originate from nonporous or mesoporous solids, where complete filling of
small capillaries takes place. Type V isotherms are associated with both micro and
mesoporous materials. Type V isotherms are also associated with weak interaction of
probe molecule and material. Type VI isotherms represent stepwise multilayer formation
on uniform nonporous surfaces(162, 163).
The specific surface area of porous and nonporous materials will be evaluated using
the Brauner Emmett and Teller (BET) multilayer adsorption model(164). The model
assumes that the adsorbed molecules in a monolayer don’t interact with molecules
adsorbed on other sites in the same layer. The molecules in the first layer are part of the
surface for deposition of the second molecular level(165). The BET method takes into
account the monolayer capacity while calculating the surface area of a material.
Experimental data from adsorption experiments is used to fit the linear form of BET to
obtain the surface area. BET isotherm is not valid over the complete isotherm range but is
accurate between 0.05 to 0.3 P/P0. The linearized form of BET is shown in equation 2.18.
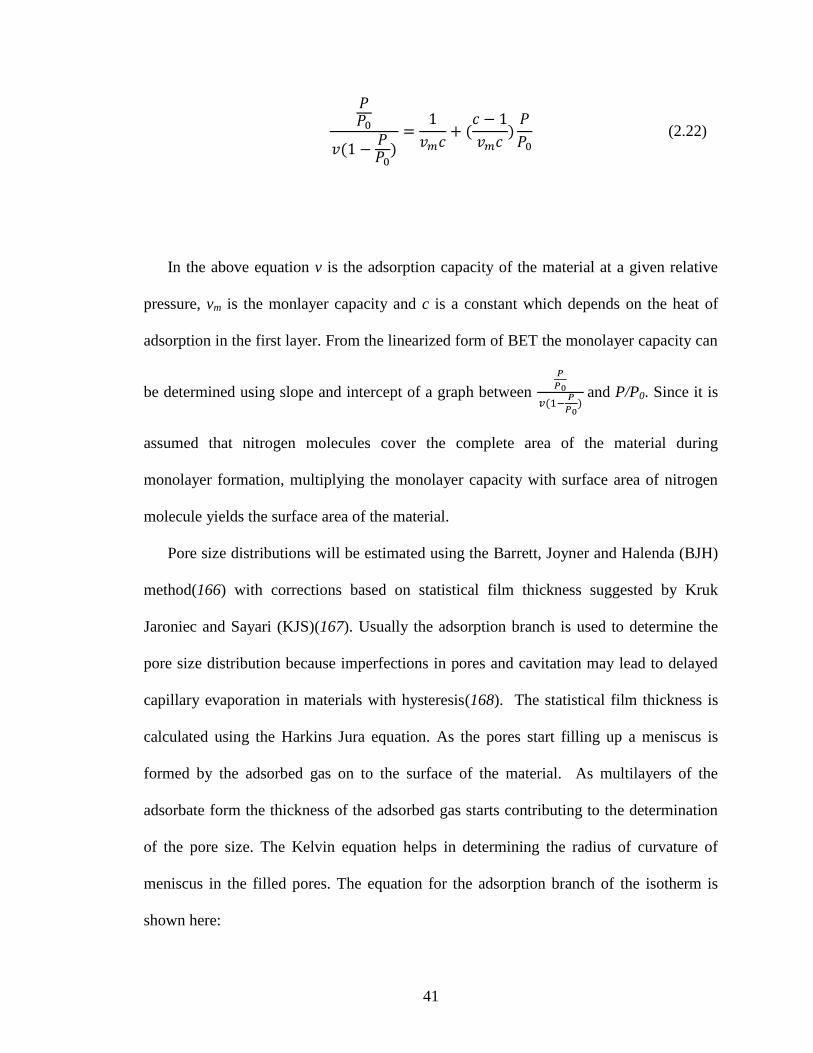
41
(2.22)
In the above equation v is the adsorption capacity of the material at a given relative
pressure, vm is the monlayer capacity and c is a constant which depends on the heat of
adsorption in the first layer. From the linearized form of BET the monolayer capacity can
be determined using slope and intercept of a graph between
and P/P0. Since it is
assumed that nitrogen molecules cover the complete area of the material during
monolayer formation, multiplying the monolayer capacity with surface area of nitrogen
molecule yields the surface area of the material.
Pore size distributions will be estimated using the Barrett, Joyner and Halenda (BJH)
method(166) with corrections based on statistical film thickness suggested by Kruk
Jaroniec and Sayari (KJS)(167). Usually the adsorption branch is used to determine the
pore size distribution because imperfections in pores and cavitation may lead to delayed
capillary evaporation in materials with hysteresis(168). The statistical film thickness is
calculated using the Harkins Jura equation. As the pores start filling up a meniscus is
formed by the adsorbed gas on to the surface of the material. As multilayers of the
adsorbate form the thickness of the adsorbed gas starts contributing to the determination
of the pore size. The Kelvin equation helps in determining the radius of curvature of
meniscus in the filled pores. The equation for the adsorption branch of the isotherm is
shown here:
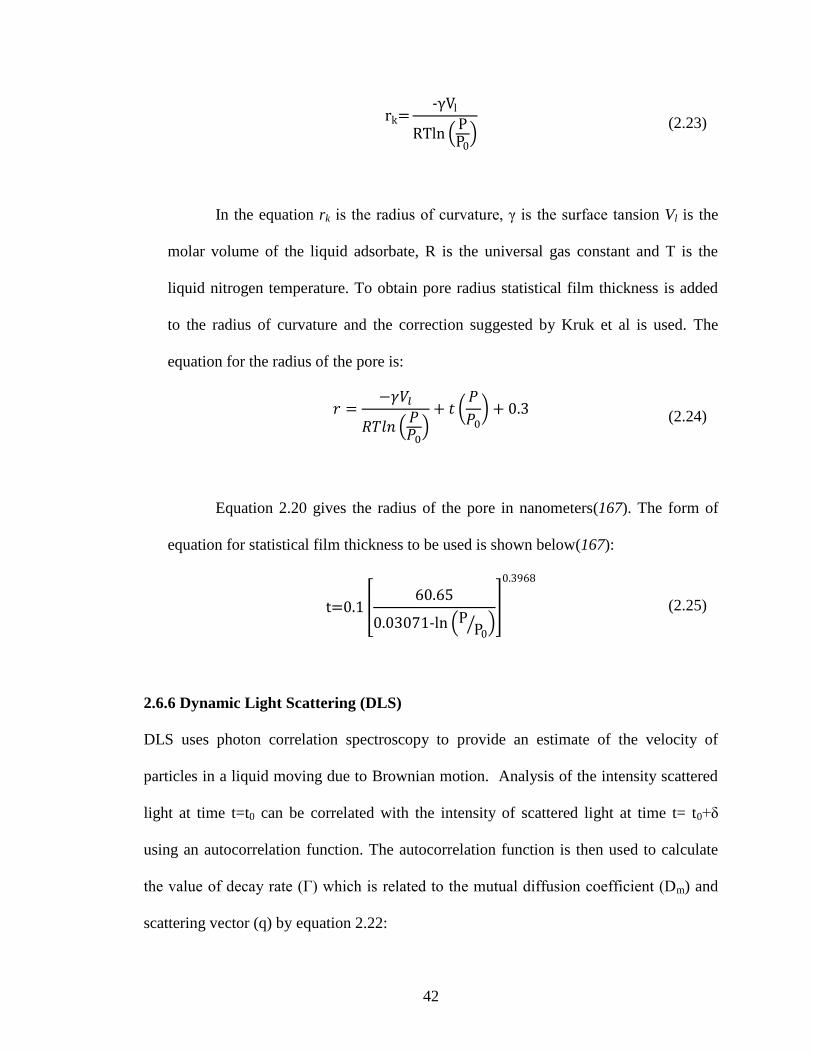
42
(
)
(2.23)
In the equation rk is the radius of curvature, γ is the surface tansion Vl is the
molar volume of the liquid adsorbate, R is the universal gas constant and T is the
liquid nitrogen temperature. To obtain pore radius statistical film thickness is added
to the radius of curvature and the correction suggested by Kruk et al is used. The
equation for the radius of the pore is:
(
) (
)
(2.24)
Equation 2.20 gives the radius of the pore in nanometers(167). The form of
equation for statistical film thickness to be used is shown below(167):
[
( ⁄ )
]
(2.25)
2.6.6 Dynamic Light Scattering (DLS)
DLS uses photon correlation spectroscopy to provide an estimate of the velocity of
particles in a liquid moving due to Brownian motion. Analysis of the intensity scattered
light at time t=t0 can be correlated with the intensity of scattered light at time t= t0+δ
using an autocorrelation function. The autocorrelation function is then used to calculate
the value of decay rate (Γ) which is related to the mutual diffusion coefficient (Dm) and
scattering vector (q) by equation 2.22:
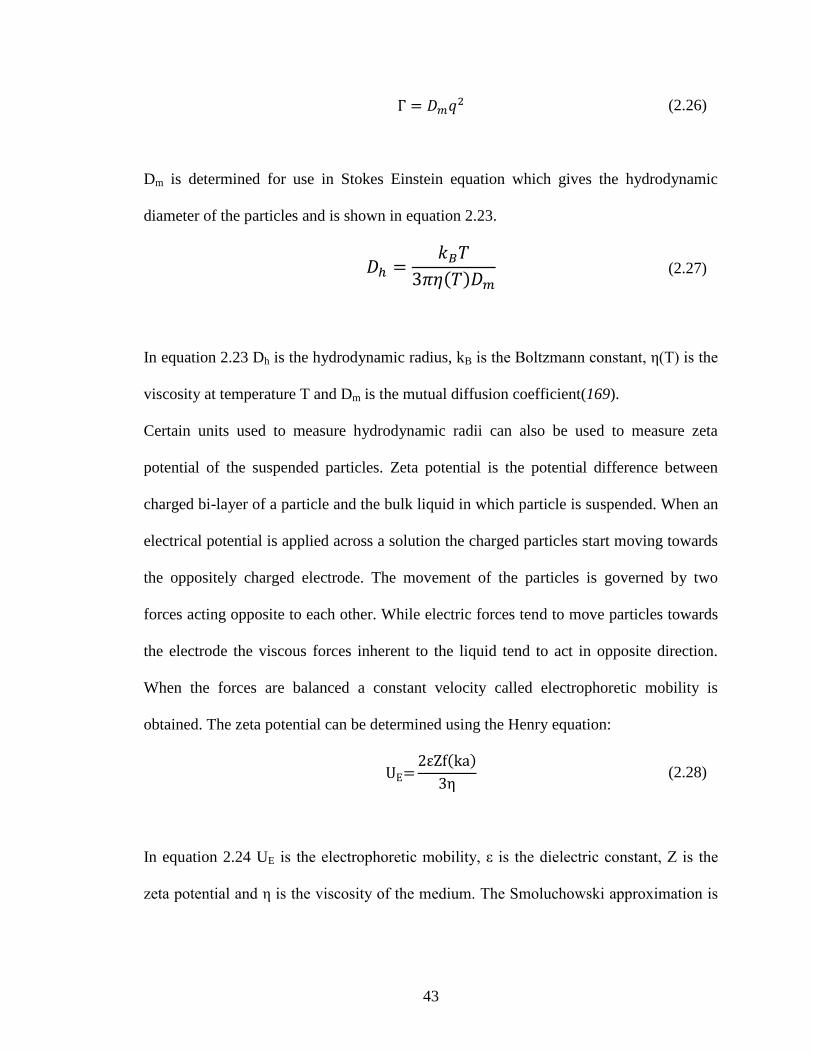
43
(2.26)
Dm is determined for use in Stokes Einstein equation which gives the hydrodynamic
diameter of the particles and is shown in equation 2.23.
(2.27)
In equation 2.23 Dh is the hydrodynamic radius, kB is the Boltzmann constant, η(T) is the
viscosity at temperature T and Dm is the mutual diffusion coefficient(169).
Certain units used to measure hydrodynamic radii can also be used to measure zeta
potential of the suspended particles. Zeta potential is the potential difference between
charged bi-layer of a particle and the bulk liquid in which particle is suspended. When an
electrical potential is applied across a solution the charged particles start moving towards
the oppositely charged electrode. The movement of the particles is governed by two
forces acting opposite to each other. While electric forces tend to move particles towards
the electrode the viscous forces inherent to the liquid tend to act in opposite direction.
When the forces are balanced a constant velocity called electrophoretic mobility is
obtained. The zeta potential can be determined using the Henry equation:
(2.28)
In equation 2.24 UE is the electrophoretic mobility, ε is the dielectric constant, Z is the
zeta potential and η is the viscosity of the medium. The Smoluchowski approximation is

44
used to obtain the value of Henry’s function [f(ka)]. For suspensions in water the value is
usually approximated to 1.5(170).
2.7. Conclusion
In the next chapters, the use of the techniques discussed here will be shown with
applications in quantitative and qualitative measurements. The background knowledge
presented here will provide the framework for studying the thermodynamic behavior of
mixed micelles based on data obtained using ITC. A model is based on what was
discussed here is elaborated in Chapter 3 for the ITC data. The mixed surfactant system
has also been used to develop imprinted nonporous materials demonstrating saccharide
selectivity. The same technique has been extended to show preferential sites for D-
xylose, D-glucose and D-maltose with minor process modifications. Chiral separation of
hexoses and maltose and cellobiose has been demonstrated. Not only does chiral
separation support the molecular imprinting principles, but also provides possibility of
development of molecularly imprinted chiral separation phases with low diffusion
resistance and uniform morphology. The use of surfactant mixtures has been further
extended to synthesize epoxidation catalyst with high pore accessibility and higher
activity compared to a zeolite. The mixed metal oxide porous materials have been
processed in both thin film and bulk form. The incorporation of titania in the materials
leads to catalytic sites and provides proof that the well dispersed Ti sites are
tetracoordinated. Titania incorporating nonporous particles have been synthesized with
possibility of applications in asymmetric catalysis and specific adsorption of saccharides.

45
Figure 2.1 The figure shows the basic setup of an ITC instrument working on power
compensation method and raw data obtained for a general case (From Freyer, M W and
Lewis, E A, Methods in Cell Biology, 2008(153). Produced with permission.
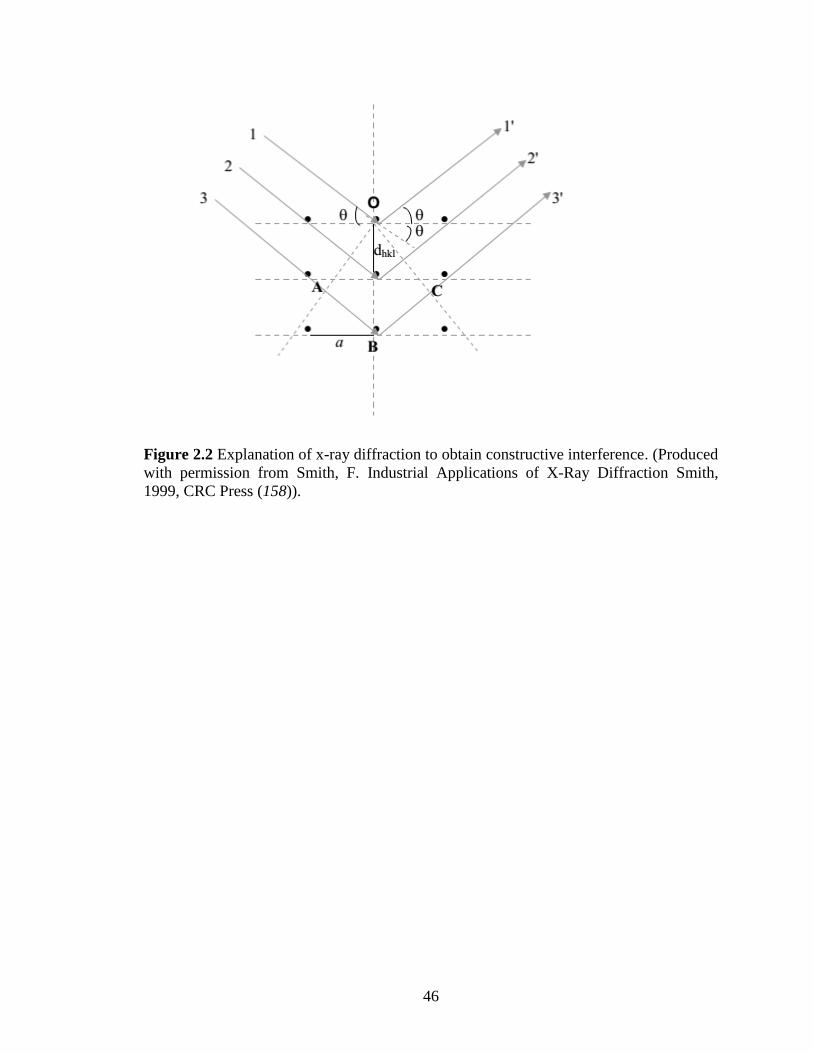
46
Figure 2.2 Explanation of x-ray diffraction to obtain constructive interference. (Produced
with permission from Smith, F. Industrial Applications of X-Ray Diffraction Smith,
1999, CRC Press (158)).
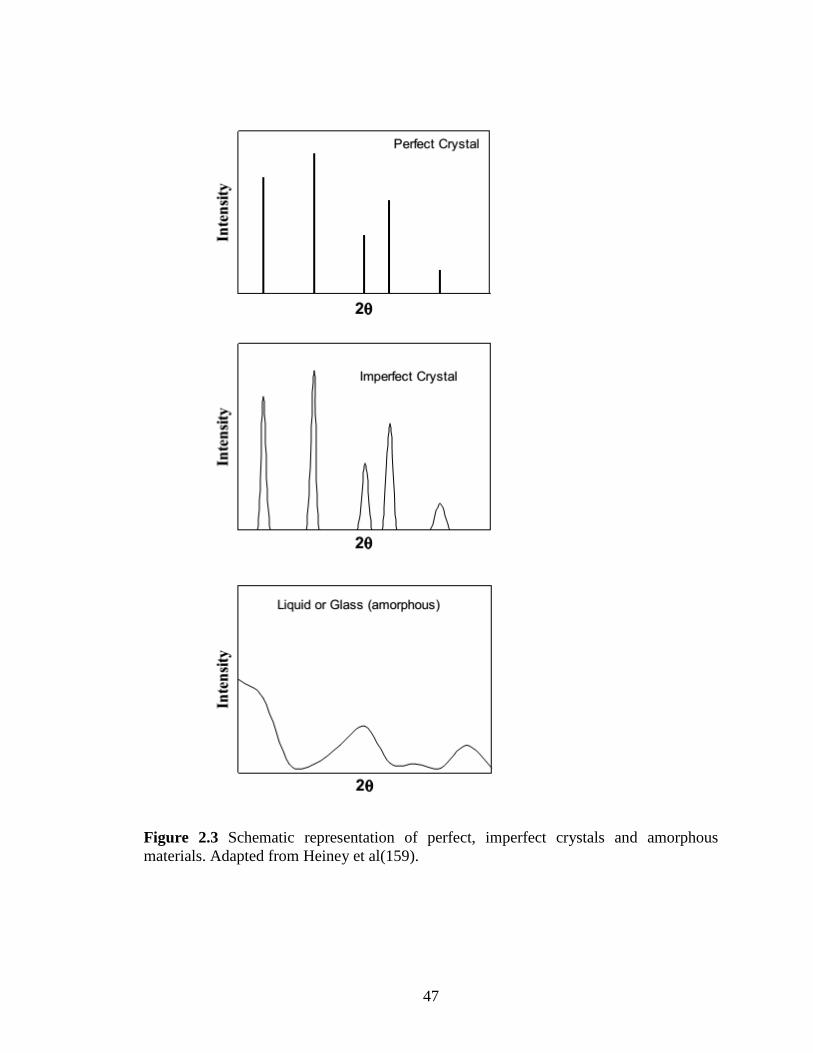
47
Figure 2.3 Schematic representation of perfect, imperfect crystals and amorphous
materials. Adapted from Heiney et al(159).

48
Figure 2.4. Common classifications of the adsorption isotherm. Adapted from Sing et
al(171).
49
Table 2.1. cmc’s , free energies of micellization and enthalpies of micellization for some
glucosidic surfactants with varying tail length, head group and anomeric center.
Surfactant CMC
(mM)
(kJ/mol)
(kJ/mol)
n-octyl-β-D-glucopyranoside (β-C8G1) 18.3(45) -19.9(45) 7.01(172)
n-octyl-α-D-glucopyranoside (α-C8G1) 12(45) -21.0(45)
n-nonyl-β-D-glucopyranoside (β-C9G1) 6.9(173) -5(174)
n-decyl-β-D-glucopyranoside (β-C10G1) 1.96(45) -25.4(45) -7.5(35)
n-decyl-α-D-glucopyranoside (α-C10G1) 0.85(37)
n-dodecyl-β-D-glucopyranoside (β-
C12G1)
0.19 -10.1(35)
n-octyl-β-D-maltopyranoside (β-C8G2) 19.1(45) -19.8(45) -8.4(74)
n-dodecyl-β-D-maltopyranoside (β-
C12G2)
0.13(45) -32.1(45) -0.9(74)
n-dodecyl-α-D-maltopyranoside (α-
C12G2)
0.12(175)
Copyright © Suvid Joshi 2014

50
CHAPTER THREE
3. MODELING THERMODYNAMIC BEHAVIOR OF NON-IDEAL MIXED
SURFACTANTS: USE OF REGULAR SOLUTION THEORY FOR
ISOTHERMAL TITRATION CALORIMETRY DATA
3.1. Summary
A model for non-ideal surfactant mixtures studied using isothermal titration calorimetry
(ITC) is presented. Compared to common techniques used to measure characteristics of
micellar systems like surface tension measurements, ITC provides the advantage of
measuring enthalpy changes directly during an experiment. ITC has been used commonly
in the past to measure protein ligand binding, but use of ITC for micellar thermodynamic
measurements is still a developing area. In this work a non-ideal mixing model for ITC
data has been developed through consistent application of regular solution theory (RST).
Enthalpy of dilution was found to play a significant role in the full ITC curves, and non-
ideal mixing is modeled based on an extension of the McMillan-Mayer model that
includes terms for interactions of monomers and micelles with solvent and amongst each
other. The model is applied to hexadecyltrimethylammonium bromide (CTAB) and n-
octyl-β-D-glucopyranoside (C8G1), which form a non-ideal mixed surfactant pair.
Nonlinear regression was used to fit the full model to the results of six ITC experiments
with varying surfactant composition to determine the cmc values, enthalpies of
demicellization, and thermodynamic interaction parameter (β) based on regular solution
theory. The parameters associated with McMillan-Mayer model were also obtained as
fitting parameters. The key feature that this new model was able to match in this type of
ITC study, which does not arise in ideal micellization models, is the broad transition from
monomeric solutions to micellar solutions for mixtures of CTAB and C8G1 with a high
fraction of C8G1. This broad transition is the result of the continuous variation of micelle

51
composition with respect to the total surfactant concentration (even though the overall
composition of the surfactants remains fixed during the experiment). The models
described in this work provide the opportunity to determine micellar properties of both
pure surfactants and their mixtures from a limited set of ITC data, and to begin to develop
new experiments to better understand both the effects of molecular structure of the mixed
surfactants and the nature of dilution enthalpy in mixed surfactant systems.
3.2. Introduction
Mixed surfactant systems are of widespread and growing interest for potential
applications in industry(176). Much of this interest stems from synergy that arises from
favorable interactions among surfactants and enhance their properties for various
applications. Mixed surfactants also find application in emerging areas, such as in
micellar templates for the synthesis of silicates for applications including catalysis and
separation(56, 57, 177-179). In these applications, surfactant mixtures are used to
modulate the micellar assembly process, or to provide specific sites for interactions with
the materials precursors. Many of the novel features associated with mixed surfactant
usage stem from the interactions between headgroups differing in charge and structure.
For instance, favorable interactions among surfactants depress the critical micelle
concentration (cmc) relative to ideal mixtures, which has distinct advantages for
detergency applications. Hence, there is a persistent need to better characterize and
model nonideal mixing behavior in surfactant systems, either to select the best surfactant
mixture for a desired application, or to better utilize known mixtures.
Various methods have been used in the past to study interactions of surfactants with
other surfactants, polymers and lipid vesicles(1, 68, 74, 180). While they each have their
strengths, many of these techniques require many repeated experiments (for example,
52
varying mixed surfactant composition and temperature) to determine thermodynamic
quantities such as enthalpy changes of micellization and of mixing within micelles. For
example, the change in slope of a property (such as surface tension or conductivity) is
most commonly used to assess the cmc, and hence only one “transition point” is
indicated. The transition point creates an impression that micelle formation represents a
step change in aggregation, while in reality (see below) micelle formation in mixed
surfactant systems is a continuous and dynamic process. Beyond the cmc, which may be
defined as the onset of micelle formation, the composition of the micelles keeps changing
dynamically with increasing concentration. This is analogous to vapor-liquid phase
transitions in mixtures where a continuous change in composition and phase quantity
occurs along the pathway from bubble point to dew point (rather than a discontinuous
change from vapor to liquid). To understand the process of micelle formation beyond the
cmc, a technique is needed that can continuously monitor micelle formation in small
steps before and after the onset of micellization.
Isothermal titration calorimetry (ITC) is such an alternative technique which can be
used to directly obtain fundamental thermodynamic data associated with physical and
chemical changes in solution. ITC has been used to study protein-ligand binding,
surfactant-vesicle interactions, and drug binding to substrates(181-187). Over the past
two decades, the use of titration calorimetry to study thermodynamics of micelle
formation has gained momentum. Most reports use titration calorimetry to determine
enthalpy, Gibbs free energy and entropy changes, along with the cmc of the system(172,
188, 189). ITC has also been used in recent years in attempts to interpret the enthalpy
associated with dilution of micelles and dilution of monomers during an experiment(190).
53
ITC provides the distinct advantage over other techniques of directly measuring
thermodynamic quantities (directly associated with heat) and the cmc of mixed micellar
systems. Thermodynamic parameters can in principle be determined by ITC using a
small set of experiments with very small amounts of surfactants.
In an ITC experiment, the enthalpy associated with going from micelles at a given
concentration into a more dilute solution of the same overall composition is measured. A
broader transition is observed than just a single “cmc”, and it is necessary to establish
where the cmc defined by other experiments should be located. For a sharp transition,
the cmc can be estimated from the maximum in the first derivative of enthalpy with
respect to concentration, which usually lies near the center of the transition region of the
heat vs. concentration curve (which will be described in more detail below). However, in
mixed micelles it is not unusual to see a broad transition region (which reflects the true
nature of the demicellization process) and it becomes necessary to better model the
gradually sloping heat curve that is obtained near the transition from micelle dissociation
(at low concentrations) to micelle dilution (at higher concentration). This model is also
needed because the high-concentration plateau usually observed for single surfactants
(where a surfactant solution from the injection syringe is being added to a less
concentrated but still micellar solution in the ampoule) is not easily observed because of
the limited concentration range selected. Hence it is necessary to use a model for ITC
experiments that does not rely on interpolation based on plateaus before and after the cmc
to model both enthalpy of demicellization and cmc values.
Various models have been proposed to describe micellization in mixed surfactant
systems(10, 11, 59, 60). Rubingh’s model(12, 191) which uses the regular solution

54
activity coefficient model, is widely used to interpret mixed surfactant cmc data(68, 192,
193). This model is usually used to extract interaction parameters from cmc data
collected as a function of composition in mixed systems, but it can also be used to infer
thermodynamic parameters (such as enthalpy of mixing) from cmc data. While it would
be possible to take this approach in ITC experiments, they provide more direct
thermodynamic data on the heat evolved during a dynamic transition, so a model that
accounts not just for the onset of micellization but also for the heat evolved during the
entire ITC experiment is necessary. The model presented here is based on phase
separation approximation as used by Clint,(62) which in its original formulation
described ideal surfactant mixtures and was developed to predict the demicellization
experiment end point for mixed surfactant system. Recently the model was applied to
ITC measurements of mixtures of maltosides by Tsamaloukas et al (74) and some of the
modeling equations have been adapted from their work.
A mixture of cationic and nonionic (saccharide-based) surfactants was selected for
this work. Mixing in these types of systems has been investigated in some detail using
traditional cmc measurements with analysis using Rubingh’s model(68) In part, this is
because nonionic surfactants help to increase the detergency of cationic surfactants(23).
In particular, alkyl polyglucosides are very interesting due to their high detergency,
biodegradability and possible synthesis from renewable resources(194). In our group, we
are interested in using the polyfunctional saccharide headgroup for the design of
mesoporous materials with specific adsorption and catalytic properties, and mixtures of
cationic and sugar-based surfactants have used for predictive synthesis of mesoporous
materials by lyotropic liquid crystal templating(5, 6). To provide further insights into
55
mixing in these systems, a model is proposed here to model heat evolved during ITC
experiments of nonideal surfactant mixtures. For illustrative purposes, a binary
surfactant system consisting of N-octyl-β-D-glucopyranoside (C8G1) and
cetyltrimethylammonium bromide (CTAB) is used in the experiments. Regular solution
theory is consistently applied to model the onset of micellization (which we will refer to
as the cmc) and nonideal mixing in a phase separation model of micellization. By fitting
the model to a set of ITC experiments with varying composition, we show that this model
is able to capture the essential features of the ITC data, and to provide thermodynamic
data consistent with micellization concentrations and heats for both single and mixed
surfactants. The thermodynamic interaction parameter (β) found by this approach will be
shown to be consistent with prior estimates and consistent with the excess enthalpy of
mixing in the cationic / saccharide surfactant micelles.
3.3. Experimental
3.3.1. Materials
Deionized ultrafiltered (DIUF) water was obtained from Fisher Scientific.
Hexadecyltrimethylammonium bromide (or cetyltrimethylammonium bromide, CTAB)
was obtained from Fischer chemicals and was of 99% purity. N-octyl-β-d-
glucopyranoside (C8G1, 99+% purity) was obtained from Affymetrix. All chemicals
were used as received.
3.3.2. Methods
The calorimetry experiments were performed using a TAM III isothermal titration
calorimeter manufactured by TA Instruments. For demicellization, the surfactant
solutions of known concentration above the cmc were prepared for analysis and loaded
into a 1 ml syringe. Care was taken to prevent any air bubbles from forming in the

56
syringe. The ampoule was loaded with up to 2.4 ml of DIUF water at the start of each
experiment. The ampoule was slowly lowered into the calorimeter channel with pauses at
three points to allow for thermal equilibration. All of the demicellization experiments
were performed at 25 °C. Titrations were performed by adding 20 or 25 µl of the
surfactant solution per injection from the syringe to the ampoule. Usually 5 to 7 minutes
was provided between injections to allow time for thermal equilibration. The first
injection is not considered for data analysis(195). The number of data points (the total
volume of surfactant solution added) was varied depending on the experiment but were
selected to give a range of concentrations such that there would be several data points
below the cmc and many points above the cmc.
3.3.3. Surfactant pseudo-phase equilibrium model
For binary surfactant mixtures, the following equations can be developed based on
regular solution theory to provide a consistent thermodynamic framework for modeling
the ITC measurements. First, the pseudo-phase model for equilibrium between
monomeric surfactant and surfactants in micelles gives(12):
(3.1)
In Eq. 3.1, stands for the monomeric concentration of the i
th component. the
mole fraction of component i in the micelle, the activity coefficient of component i in
the micelle, and the cmc of pure component i.
For a binary surfactant mixture, a mole balance be used to derive an expression for
the mole fraction of the component 1 in the micelle:
(3.2)

57
In Eq. 3.2, is the overall mole fraction of surfactant 1 and C is the overall
concentration of the surfactant in solution. By using Eq. 3.1 to substitute for each
monomer concentration in Eq. 3.2, we obtain:
(3.3)
Eq. 3.3 can be used to obtain a non-linear equation for by utilizing the fact that in a
binary mixture,
(3.4)
The following equation is obtained
(3.5)
From regular solution theory (RST),
(3.6)
(3.7)
Substituting Eq. 3.6 in Eq. 3.7, we obtain a non-linear equation with as the only
unknown quantity once cmc values, , the total surfacdtant concentration and bulk
composition are specified:
( ) (
)
(3.8)
Eq. 3.8 can be solved numerically to calculate mole fraction of both the components
in the micelles. Here, this was done by implementing the Newton-Raphson method using
a VBA function in Excel starting from an initial guess of x1 = 10% of the 1. The VBA
code is provided as part of Appendix A.

58
Once the composition of the micelle at equilibrium with the bulk monomer solution is
known, species concentrations can be determined. To calculate the amount of surfactant
in monomeric form, a variant of Clint’s phase separation model of micellar mixtures was
used(62) that incorporates activity coefficients:(196, 197).
√
(3.9)
where
(3.10)
Once the monomeric concentrations are known, material balances can be used to
determine the concentrations of each surfactant in micelles. To be consistent with RST,
the excess enthalpy of mixing of surfactants in micelles is calculated using Eq. 3.11.
(3.11)
3.4. Thermodynamic model of micellization
The complex process of redistribution of surfactants between monomeric and micellar
form during an ITC experiment was broken down using a thermodynamic cycle so that
mass and energy balance could be applied and well-defined thermodynamic quantities
could be obtained. When the solution in the syringe is above the mixed micelle cmc but
the concentration in the ampoule is below the cmc, demicellization is the only process
that must be considered. As shown in Figure 3.1 the first step involves breaking of the
mixed surfactant micelles into separate micelles of pure components. The heat of forming
pure component micelles by demixing existing micelles is associated with the excess
enthalpy of mixing (specifically, ). The second step requires the
dissociation of the individual micelles into monomers of the pure components and is
associated with the enthalpy of demicellization of each surfactant i (
). It is
59
important to note that since the micelles are considered to be non-ideal, the enthalpy of
mixing is non-zero and needs to be separated from enthalpy of demicellization. The
overall process that results is the demicellization of a mixed micelle into monomers of
constituent surfactants.
Figure 3.2 depicts the thermodynamic cycle that can be followed to estimate the heat
of ITC experiments when the concentration in the ampoule is above the cmc. Above the
cmc a dynamic equilibrium exists between the micelles and monomers already present in
the ITC ampoule and the micelles and monomers which are being added from the
syringe. The process is broken down into three thermodynamic steps. In the first step,
the micelles existing in the ampoule inside the ITC undergo demixing and
demicellization to form a solution containing only monomers of the surfactant mixture
and the enthalpy of demixing/demicellization is calculated. Second, the new aliquot is
added from the syringe in to the ampoule and is demixed/demicellized to form a
monomeric mixture and the heat associated this process is calculated. Finally, the new
aliquot is mixed with the existing contents of the ampoule, new overall concentrations are
established and a new micelle/monomer equilibrium is established at a higher total
surfactant concentration. The heat associated with the micellization process and mixing
of surfactants in the micelles is calculated and used to estimate the overall heat associated
with the injection following the cycle illustrated in Fig. 2. The net heat associated with
this process is summarized in Eq. 3.12, where the overall heat (Q) is expected to be
equivalent to what is measured by ITC.

60
(
)
(
)
(3.12)
In equation 3.12 stands for the change in enthalpy of dilution associated with change
in concentration in the ampoule.
is the enthalpy of dilution associated with the
surfactant added to the ampoule from the syringe. (
)
and
(
)
are the terms associated with demicellization of micelles present in the ampoule in step k-1 and
reforming of micelles in step k for surfactants S1 and S2 respectively.
and
are the enthalpies associated with demicellization of surfactant
present in micellar form at each injection step for surfactant 1 and surfactant 2 respectively from
the syringe.
is the enthalpy of demixing micelles in the syringe when
aliquot is added to the ampoule.
corresponds to the enthalpy of
demixing whatever was present in micellar form in the ampoule at step k-1 and
is the enthalpy of mixing associated with reforming the micelles at a
higher concentration in step k after the injected aliquot from the syringe.
In the model proposed by Tsamaloukas(74) an arbitrary constant value was used as
the enthalpy of dilution for each ITC experiment, and the enthalpy of dilution and these
values were independently varied during nonlinear regression. This did not provide

61
model results that were able to match the slopes of the ITC curves before and after the
cmc accurately. Dilution in the case of non-ideal mixtures is more complex than this, and
it is apparent from the raw ITC data that the heat of dilution follows a linear relationship
with respect to concentration, and that the slopes vary above and below the cmc. These
trends are poorly fit with a constant, arbitrary enthalpy of dilution. To address this, a
dilution model is used that has a concentration dependence, and that can be used in
conjunction with the thermodynamic cycles in Figs. 1 and 2 to develop a more nuanced
description of the ITC experiments. The model is based on the McMillan-Mayer
framework for dilute multicomponent mixtures(198). Assuming that the solvent
molality is roughly constant in dilute solutions, the excess enthalpy of mixing for solutes
can be expressed in this framework by a polynomial expansion in terms of the
concentrations of solutes(199). For purposes of describing interactions among solutes, we
consider four types of solutes: monomers of C8G1, monomers of CTAB, C8G1 in
micellar form, and CTAB in micellar form. Other forms of dilution model were
considered but this was found to provide the best match to the experimental data. If hix is
the coefficient describing excess enthalpic interactions between solute i in form x (x = m
for monomers and mic for micelles) and water, and hijx is the coefficient describing excess
enthalpic interactions between solute i and solute j in form x with water as solvent, to
second order, the heat of dilution can be expressed as:
(
)
(3.13)
62
Initial attempts to fit the entire data set using a single set of interaction parameters
was not successful, so two sets were used – one to fit low-concentration experiments
(total surfactant concentration < 12 mM) and one to fit high-concentration experiments.
3.4.1 Fitting the model
Non-linear regression was used to simultaneously fit the data for all ITC experiments
to obtain one set of parameters for the model outlined above. Fitting of the model to the
ITC heat curves was accomplished by using the Levenberg-Marquardt algorithm to
minimize the sum of squares of the errors (SSE) between the data and the model, as
implemented in Excel’s Solver. The parameters used to fit the entire data set include the
enthalpy of demicellization for pure surfactants, cmc values for the pure surfactants,
thermodynamic interaction parameter β, and parameters associated with enthalpy of
dilution of the micelles and monomers.
To fit the data initially the mole fractions at each step was iteratively calculated using
equation 3.8 providing experimental cmc values. All the data obtained was
simultaneously fit using equation 3.12, by substituting enthalpy of dilution from equation
3.13. Square errors were calculated and a weighted square error term was summed to
calculate SSE. A higher weighting was applied to the data from the mixed surfactant
(multiplier of 1) experiments compared to pure surfactants (multiplier of 0.5) to ensure
that they were well fit. Error analysis on the parameters obtained from fits was
performed using solver statistics module in Excel(200).
3.5. Results and Discussion
Surfactant mixtures as well as pure surfactants were studied using ITC. The enthalpy
versus concentration diagrams for the pure surfactants CTAB and C8G1 are presented in
Figure 3.2. Traditional techniques can be used to determine both the cmc and the
63
enthalpy of demicellization for CTAB and C8G1. In both experiments, a high
concentration solution (approximately five times the cmc) is added from the syringe in
small steps into a thermodynamically isolated ampoule at 25 ˚C. As we add the micellar
solution into the ampoule, initially a very dilute monomeric solution is formed due to
demicellization. ITC records the heat associated with this process. As more and more
surfactant is added in to the ampoule, we approach the cmc. As we cross cmc, a sharp
change is observed in the enthalpy associated with the process. After the cmc, the process
mainly involves adding a micellar solution from the syringe to an already existing
micellar solution in the ampoule. Once stable micellar solution are present in both the
ampoule and the syringe, high concentration plateau is obtained with a small enthalpy per
injection, although a residual enthalpy can still be observed. This enthalpy results from
dilution effects associated with injecting a high-concentration solution from the syringe
into a low-concentration solution in the ampoule. To determine the enthalpy of
demicellization, lines are fit to the plateaus above and below the inflection and extended
beyond the inflection. A line is drawn perpendicular to the x axis at the cmc, and the
enthalpy of demicellization is measured from the length of the segment connecting the
lines. The process is represented in figure A.1 in appendix A. To determine the cmc by
this direct analysis of the heat curves, the first derivative of enthalpy with respect to
concentration is plotted against concentration and the cmc is estimated from the
extremum in the plot, since this represents an inflection in the heat vs. concentration
curve. The enthalpy of demicellization and cmc determined by this procedure will be
termed ‘differential’ values based on the cmc estimation method.
64
Using this technique, the differential cmc for CTAB was determined to be 0.97 mM
while for C8G1 it was determined to be 25.6 mM. These cmc values are comparable to
values reported previously(68, 201). Based on differential analysis, the enthalpy of
micellization for CTAB at 25 ˚C was estimated to be -6.6 kJ/mol, which differs
somewhat from the value of -10.2 kJ/mol reported in the literature(202). The enthalpy of
micellization of C8G1 at 25 ˚C was found to be 6.0 kJ/mol which is close to the value
reported in literature(35).
The enthalpy vs concentration diagrams for mixed surfactant systems are presented in
Figure 3.3. Unlike single surfactant demicellization experiments, for mixed surfactant
systems, curves are seen to deviate from the sharp sigmoidal shape usually associated
with demicellization. The curves broad transitions after the onset of a micellar transition
is observed. This trend is most apparent in solutions with higher mole fraction of C8G1
compared to CTAB. The broad transition region is attributed to shifting concentration of
surfactant in the micelle, which leads to a gradual phase change over a range of
concentration. As more and more surfactant is added into the ampoule from the syringe,
the micelles start reorganizing from micelles which have higher CTAB mole fraction to
micelles which have higher C8G1 mole fraction. This change causes a long tail like
transition region until a point where the mole fraction change in the micelles in the
ampoule start to reach a plateau. At this point, a high-concentration plateau is observed
indicating the end of the curve.
A clear change can be observed in enthalpies of demicellization as well. The mixed
micelles dominated by higher mole fraction of CTAB in the bulk have endothermic
enthalpies of demicellization. As the bulk mole fraction of C8G1 increases, the micelles
65
formed in the ampoule after titration gradually become dominated by C8G1. As the mole
fraction of C8G1 in the bulk solutions increases, the enthalpy of demicellization shifts
from endothermic to exothermic.
The obtained experimental data from demicellization experiments performed using
ITC was fit using two variants of the model outlined above. The first variant (Model 1)
includes all parameters in the dilution term and the best-fit curves are shown in Figure
3.5. The second variant (Model 2) does not include first-order terms in the enthalpy of
dilution model, and the best-fit curves are shown in Figure 3.6. Using the models, single
unified values were obtained for enthalpies of demicellization, cmc values of pure
surfactants and thermodynamic interaction parameter (β).
Model 1 was developed using all terms in equation 3.13 for enthalpy of dilution and
calculating the modeled enthalpy using equation 3.12. It can be observed from Figure 3.5
that Model 1 fit the data for mixed systems quite well. However, good fits were not be
obtained for the demicellization curves of CTAB and C8G1 alone. This may be in part
because the pure surfactant ITC curves were weighted less during regression, to provide
the best opportunity for the mixed micellar system to be fit. This naturally may have led
to more noticeable deviations of model curves for single surfactants. The parameters
obtained by regression along with the associated standard deviations are presented in
Table 3.3. It was observed with Model 1 that cmc values and β could be estimated with
good standard deviations, but that the uncertainty associated with the enthalpies of
demicellization were unacceptably high. This appears to be related to large uncertainties
observed in the first-order terms for the McMillan-Mayer dilution model (Table 3.3).
The reason for the large uncertainties in all of these parameters is that they are all related
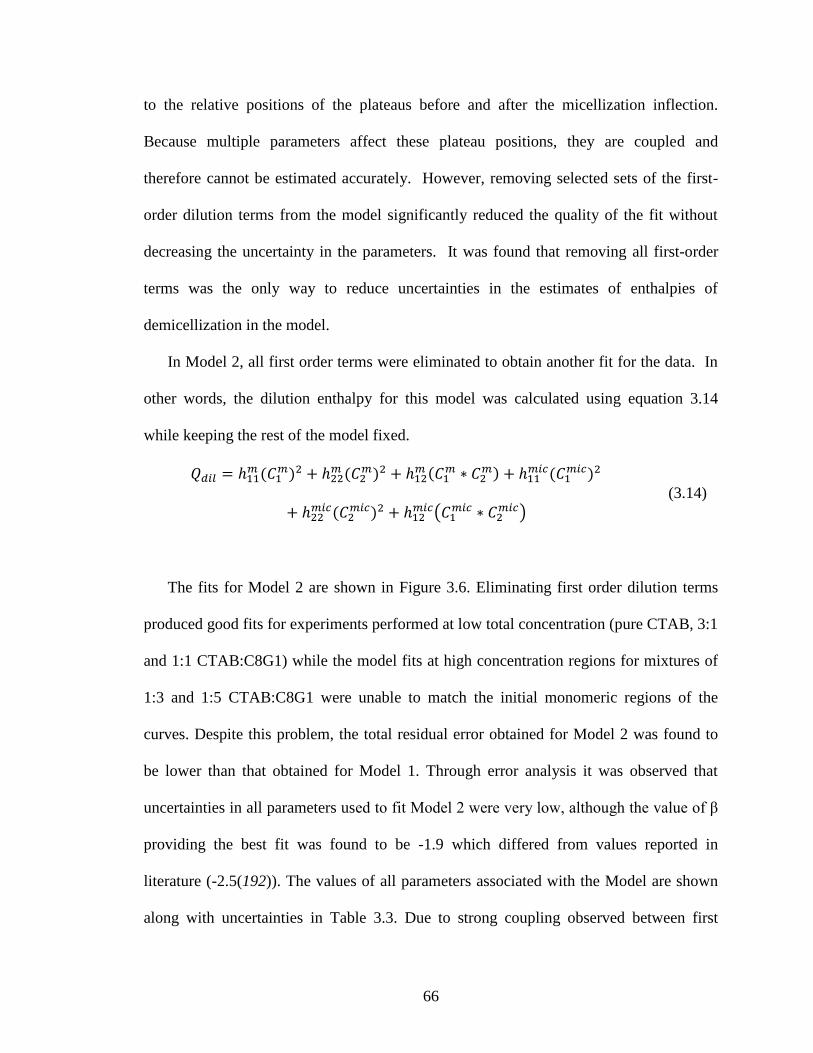
66
to the relative positions of the plateaus before and after the micellization inflection.
Because multiple parameters affect these plateau positions, they are coupled and
therefore cannot be estimated accurately. However, removing selected sets of the first-
order dilution terms from the model significantly reduced the quality of the fit without
decreasing the uncertainty in the parameters. It was found that removing all first-order
terms was the only way to reduce uncertainties in the estimates of enthalpies of
demicellization in the model.
In Model 2, all first order terms were eliminated to obtain another fit for the data. In
other words, the dilution enthalpy for this model was calculated using equation 3.14
while keeping the rest of the model fixed.
(
)
(3.14)
The fits for Model 2 are shown in Figure 3.6. Eliminating first order dilution terms
produced good fits for experiments performed at low total concentration (pure CTAB, 3:1
and 1:1 CTAB:C8G1) while the model fits at high concentration regions for mixtures of
1:3 and 1:5 CTAB:C8G1 were unable to match the initial monomeric regions of the
curves. Despite this problem, the total residual error obtained for Model 2 was found to
be lower than that obtained for Model 1. Through error analysis it was observed that
uncertainties in all parameters used to fit Model 2 were very low, although the value of β
providing the best fit was found to be -1.9 which differed from values reported in
literature (-2.5(192)). The values of all parameters associated with the Model are shown
along with uncertainties in Table 3.3. Due to strong coupling observed between first

67
order dilution terms and enthalpies of demicellization of CTAB and C8G1, the model
was also changed to fix the enthalpy of demicellization based on differential enthalpy
calculations while using equation 3.13 for dilution (Model 3). Large uncertainties were
obtained for first order dilution terms in Model 3 and the results are discussed in
Appendix A.
Table 3.1 compares the values of fitting parameters obtained for C8G1 and CTAB
using Models 1 and 2 and those obtained through differential enthalpy analysis. The cmc
values of CTAB and C8G1 estimated using Models 1 and 2 are slightly higher than that
estimated using the differential enthalpy analysis. However, this is not unexpected given
possible differences in how the cmc is defined (see next paragraph). Enthalpy of
demicellization values for both CTAB and C8G1 also differ from those obtained through
differential enthalpy analysis. During fitting more weight was given to the error
associated with mixed surfactant experiments while the weight on single surfactant
experiments was reduced, which may have led to deviations from the experimentally
obtained values. Another reason for the differences may be that enthalpy of dilution plays
a significant role in the net heat observed in this system. For instance, for CTAB, at the
cmc the heat recorded at the concentration used (8 mM CTAB in the syringe) is close to 2
kJ/mol, whereas in the report of Blandamer et al. (for 15.4 mM CTAB in the syringe), the
heat of injection is almost zero immediately following the cmc(201). By taking into
account both dilution and the thermodynamics of demicillization and demixing, Model 1
predicts enthalpy of demicillization values (9.5 kJ/mol for CTAB) closer to previously
reported values (10.2 kJ/mol (201)) than direct differential analysis.

68
Table 3.2 compares the cmc values for mixed systems found fitting the full set of ITC
data using Model 1 and Model 2 with cmc values estimated by differential analysis
(described above), or by estimating the onset of micellization from the intersection of
lines extrapolated from the ITC data near the initial change in slope in the heat curves.
The values are plotted along with theoretical predictions for ideal mixtures (=0) and
with parameters from Models 1 and 2 in Figure 3.7. Despite the difference in , the
values predicted by both models are very close to each other and match the cmc of
mixtures estimated from the onset of the micellization process. This makes sense given
that the models also define the cmc based on the onset of the micellization process.
However, the values of cmcs obtained through differential analysis are much larger than
those determined from the onset of micellization, and in some cases are larger than the
ideal cmc. The difference is caused by the broad transition associated with mixtures of
surfactants where once micelles start forming, continuous changes in the micellar mole
fraction cause a gradual change in the excess enthalpy of mixing which broadens the
transition from simple demicellization to micelle dilution as concentration increases. The
value of β found using the full models are consistent with values of estimated by
methods based only on the cmc values of mixed surfactant systems, which suggests that
the onset of the transition should be used for comparison to other experimental methods
of cmc determination.
Due to large number of parameters in the dilution equation, another attempt at fitting
the data was also undertaken in an effort to reduce the number of adjustable parameters
even beyond that in Model 2. This was accomplished by fixing the enthalpies of
demicellization and the cmcs of the pure surfactants found using the differential enthalpy

69
approach (the values are summarized in Table 3.1). The parameters associated with
dilution obtained from the fitting by this approach for both Model 1 and Model 2 dilution
equations are shown in Table A.2 in the appendix A. Fixing the enthalpies of
demicellization and cmcs of pure surfactants provides the benefit of giving certain
parameters with a limited, simpler set of experiments. Unfortunately, this approach did
not improve the fits obtained (R2 = 0.967 for Model 1 and R
2 = 0.955 for Model 2), and
perhaps more importantly, several of the relative uncertainties associated with the
dilution parameters increased. The increase in uncertainty is most likely because the
enthalpies observed in the ITC experiments are a sum of enthalpy of dilution and
enthalpy of demicellization. When the values are fixed for enthalpies of demicellization
based on the differential approach, the apparent enthalpy of demicellization should be
equivalent to the result of addition of demicellization and several terms related to dilution
of monomers and micelles before and after the cmc. Hence setting the enthalpy of
demicellization to the apparent value from differential analysis is the most likely cause of
an increase in overall error for some dilution enthalpy parameters, where now the
equation also has to accommodate for the error created by misappropriating the value of
demicellization enthalpy. Overall, while this would appear to be a beneficial approach,
fixing demicellization enthalpy and cmc to values found by differential analysis of pure
surfactants does not allow for separation of observed enthalpy in the experiment into
dilution and demicellization. Because fitting Models 1 and 2 with all parameters allowed
to vary does allow dilution contributions to be separated from demicelliation, it seems
that this actually is the preferred approach. In the future, it would be worth further
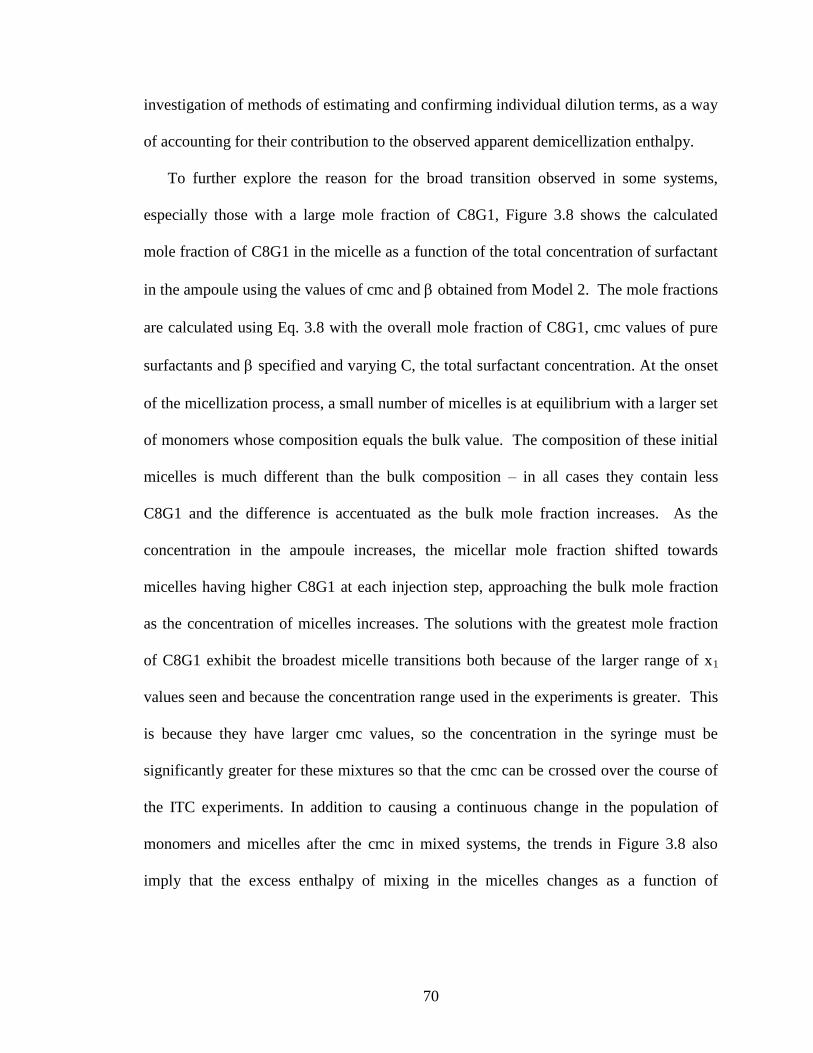
70
investigation of methods of estimating and confirming individual dilution terms, as a way
of accounting for their contribution to the observed apparent demicellization enthalpy.
To further explore the reason for the broad transition observed in some systems,
especially those with a large mole fraction of C8G1, Figure 3.8 shows the calculated
mole fraction of C8G1 in the micelle as a function of the total concentration of surfactant
in the ampoule using the values of cmc and obtained from Model 2. The mole fractions
are calculated using Eq. 3.8 with the overall mole fraction of C8G1, cmc values of pure
surfactants and specified and varying C, the total surfactant concentration. At the onset
of the micellization process, a small number of micelles is at equilibrium with a larger set
of monomers whose composition equals the bulk value. The composition of these initial
micelles is much different than the bulk composition – in all cases they contain less
C8G1 and the difference is accentuated as the bulk mole fraction increases. As the
concentration in the ampoule increases, the micellar mole fraction shifted towards
micelles having higher C8G1 at each injection step, approaching the bulk mole fraction
as the concentration of micelles increases. The solutions with the greatest mole fraction
of C8G1 exhibit the broadest micelle transitions both because of the larger range of x1
values seen and because the concentration range used in the experiments is greater. This
is because they have larger cmc values, so the concentration in the syringe must be
significantly greater for these mixtures so that the cmc can be crossed over the course of
the ITC experiments. In addition to causing a continuous change in the population of
monomers and micelles after the cmc in mixed systems, the trends in Figure 3.8 also
imply that the excess enthalpy of mixing in the micelles changes as a function of

71
concentration. This change is captured in Models 1 and 2, and is part of the reason that
that are abe to match most features of the experimental heat curves.
3.6. Conclusion
ITC was utilized to obtain continuous thermodynamic data for demicellization of
cetyltrimethylammonium bromide (CTAB), n-octyl--D-glucopyranoside (C8G1) and
mixtures of CTAB and C8G1. Broad transitions were observed for mixed surfactant
systems, especially for mixtures with higher bulk mole fractions of C8G1, which
precluded straightforward analysis of the data using differential analysis of heat vs.
concentration curves. The expected sigmoidal curves with sharp transitions at the cmc
were obtained for both CTAB and C8G1 individually, but significant dilution effects are
apparent in the data of these systems which also complicates the direct differential
analysis of the data.
To overcome the limitations in the direct analysis of ITC data in this mixed nonideal
surfactant system, a thermodynamic framework was developed using a pseudo-phase
separation approximation and regular solution theory to model the demicellization curves
of CTAB, C8G1 and CTAB/C8G1 mixtures. Due to the complex nature of this non-ideal
system, the enthalpy of dilution associated with the process was described using an
extension of the McMillan-Mayer approach with second order terms for the dilution
enthalpy of surfactants in monomers and micelles.
Surfactant demicellization curves for mixtures could be fit very well using Model 1,
which included all dilution terms, but the behavior of individual surfactant
demicellization for CTAB and C8G1 could not be matched well. In Model 1, a strong
coupling between first order terms in the dilution model and the enthalpy of
demicellization values was observed, leading to unacceptably high uncertainties in these

72
parameters. Therefore, Model 2 was developed by eliminating the first order terms in the
dilution enthalpy model. Model 2 fit the set of experimental data better overall and
acceptable uncertainties for all parameters were found. The cmc values found in model 2
matched prior literature quite well although the enthalpy of demicellization values were
significantly different (-8.6 kJ/mol for C8G1 and 8.3 kJ/mol for CTAB, compared to -
6.0(35) and 10.2 kJ/mol(202) in the literature). The value of found using Model 2 (-
1.9) was slightly smaller in magnitude than literature values reported based only on cmc
values (-2.5)(192) but the predicted cmc values are relatively insensitive to the value in
the C8G1/CTAB system.
In addition to these quantitative conclusions, several qualitative suggestions emerge
from this study regarding the use of ITC to study non-ideal surfactant mixtures. First,
broad micellization transitions are expected in these systems and can be explained based
on the shifting composition of the micelles relative to the bulk concentration as
concentration increases in these experiments. Second, when comparing to other methods
of cmc estimation, the onset of the micellization transition observed in ITC should be
used. The ITC method provides significantly more information regarding the evolution
of the system during micellization, but it appears from this study that other methods of
cmc estimation are most sensitive to the initial point at which micelles form. Finally,
when interpreting ITC curves, it is important to consider the effects of dilution enthalpy
on the observed heats. It seems logical and consistent to use the difference in heat
evolution at estimated cmc point on the ITC curve to estimate enthalpy of
(de)micellization, for instance, but significant dilution effects may contribute to the
process at this point. We hope that this work will inspire more research into models for

73
both activity coefficient models of mixed surfactant systems and dilution
thermodynamics of aggregation colloids.

74
Figure 3.1. Representation of thermodynamic cycle used to represent demicellization of
a non-ideal mixed micelle when the concentration of the system after injection of an
aliquot is below the cmc of the mixture.
75
Figure 3.2. Representation of thermodynamic cycle for demicallization of a non-ideal
mixed micelle when the concentration in the ampoule is above cmc of the mixture.

76
Figure 3.3. (a) Enthalpy vs. concentration diagram for (a) CTAB injected from a syringe
containing 8 mM CTAB into an ampoule containing water and (b) C8G1injected from a
syringe containing142 mM C8G1 into an ampoule containing water.

77
Figure 3.4. Enthalpy vs. concentration diagrams for demicellization experiments
measured using ITC for 0.25, 0.5, 0.75, 0.83 bulk mole fraction of C8G1 in C8G1/CTAB
mixed surfactant solutions. The total concentrations of surfactants in the syringe used for
these experiments were 12 mM, 8 mM, 60 mM and 80 mM, respectively.
78
Figure 3.5. Experimental and best-fit enthalpy vs concentration diagrams obtained by
fitting Model 1, in which enthalpy of dilution was modeled using all terms in equation
3.13. The plots are divided into (a) low concentration experiments with 8 mM CTAB, 12
mM 3:1 CTAB:C8G1 and 8 mM 1:1 CTAB:C8G1 and (b) high concentration
experiments with 60 mM 1:3 CTAB:C8G1, 80 mM 1:5 CTAB:C8G1 and 142 mM C8G1.
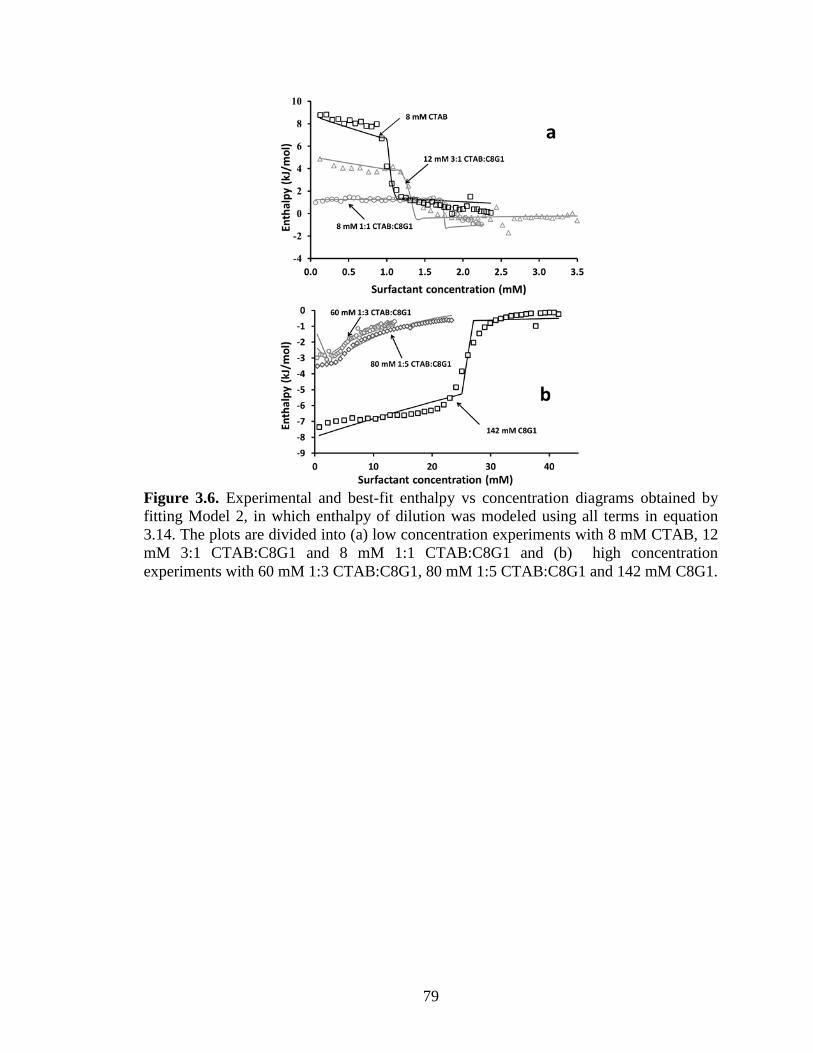
79
Figure 3.6. Experimental and best-fit enthalpy vs concentration diagrams obtained by
fitting Model 2, in which enthalpy of dilution was modeled using all terms in equation
3.14. The plots are divided into (a) low concentration experiments with 8 mM CTAB, 12
mM 3:1 CTAB:C8G1 and 8 mM 1:1 CTAB:C8G1 and (b) high concentration
experiments with 60 mM 1:3 CTAB:C8G1, 80 mM 1:5 CTAB:C8G1 and 142 mM C8G1.
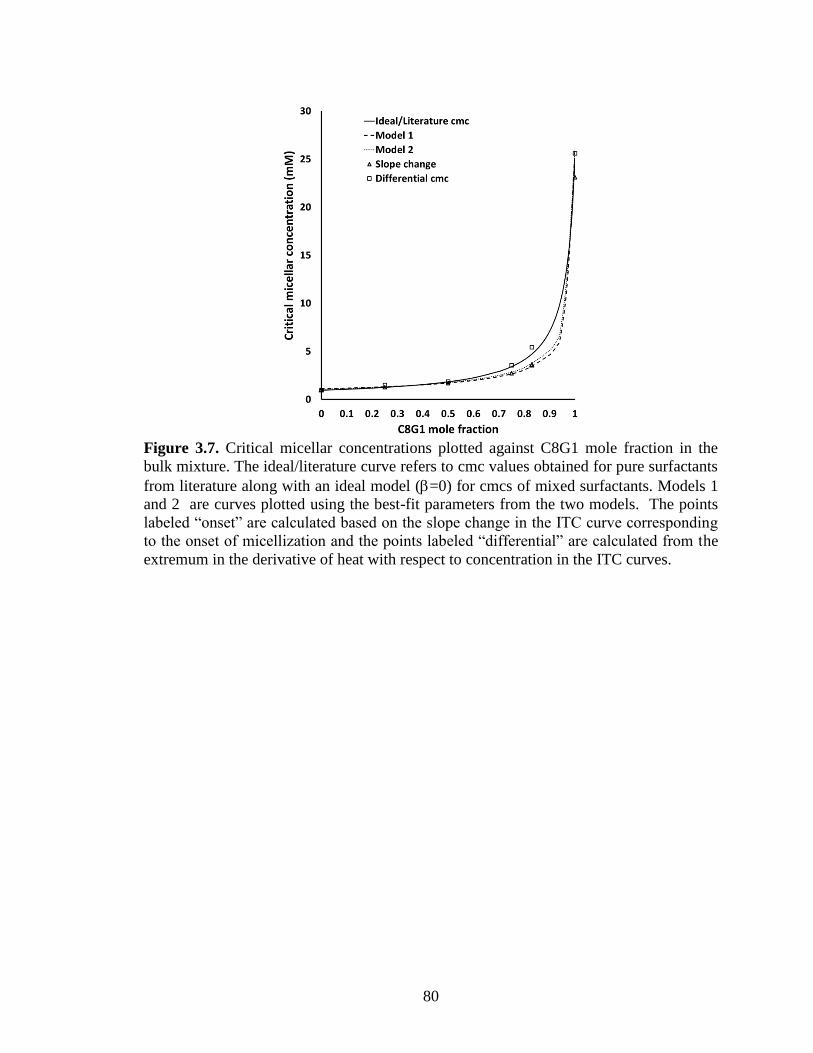
80
Figure 3.7. Critical micellar concentrations plotted against C8G1 mole fraction in the
bulk mixture. The ideal/literature curve refers to cmc values obtained for pure surfactants
from literature along with an ideal model (=0) for cmcs of mixed surfactants. Models 1
and 2 are curves plotted using the best-fit parameters from the two models. The points
labeled “onset” are calculated based on the slope change in the ITC curve corresponding
to the onset of micellization and the points labeled “differential” are calculated from the
extremum in the derivative of heat with respect to concentration in the ITC curves.
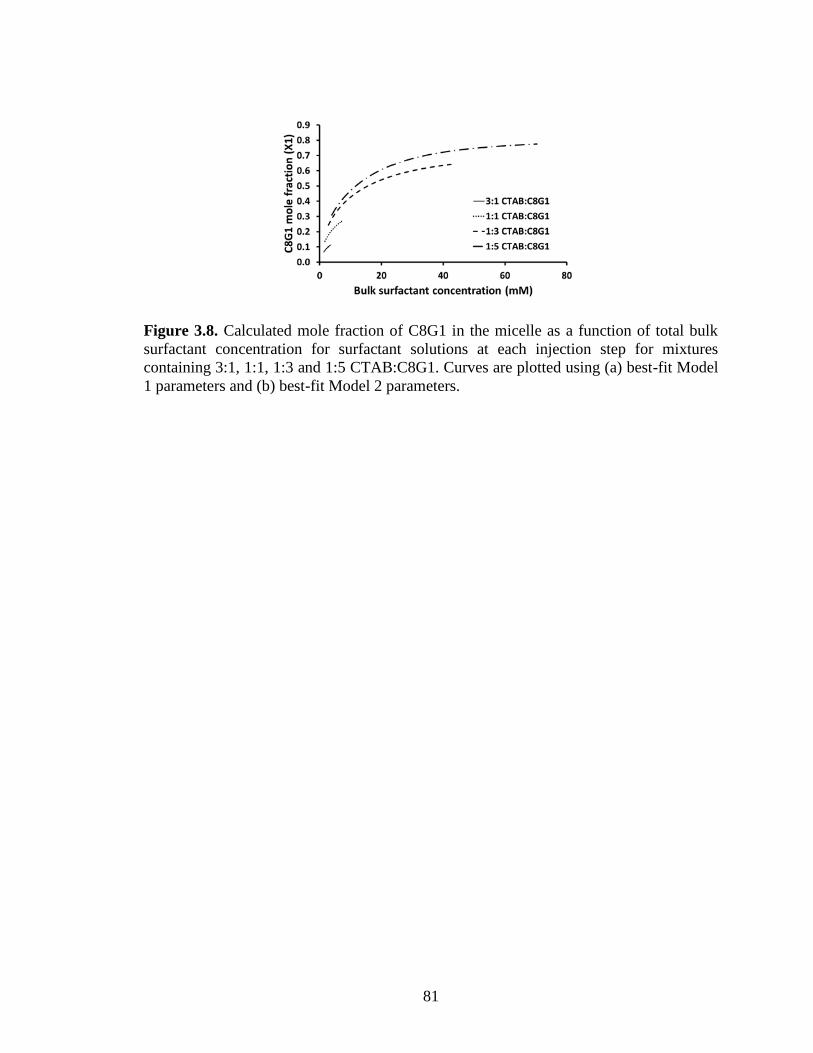
81
Figure 3.8. Calculated mole fraction of C8G1 in the micelle as a function of total bulk
surfactant concentration for surfactant solutions at each injection step for mixtures
containing 3:1, 1:1, 1:3 and 1:5 CTAB:C8G1. Curves are plotted using (a) best-fit Model
1 parameters and (b) best-fit Model 2 parameters.

82
Table 3.1. Properties obtained for single surfactant demicellization obtained from fitting
the model to the data and from experiments.
Obtained from
↓
cmc (C8G1) cmc
(CTAB)
ΔHm→aq
(C8G1)
ΔHm→aq
(CTAB)
Model 1 26.0 ± 0.14 1.11 ± 0.01 -6.3 ±
2.85×10⁵
9.5 ±
3.26×10⁵
-2.42 ±
0.065
Model 2 26.1 ± 0.11 1.05 ±
0.006
-8.6 ± 0.28 8.3 ± 0.32 -1.89 ±
0.059
Differential* 25.6 0.97 -6.0 6.6 -2.53
* Differential refers to property listed in the table calculated by plotting first differential
of enthalpy against concentration. The cmc is determined as the concentration at which a
maximum occurs while the enthalpy of demicellization was calculated as the distance
between regression lines for high and low concentration plateaus, parallel to y axis at the
cmc.
Table 3.2. Comparison of cmc of C8G1/CTAB mixtures calculated using best-fit
parameters from the models, from the onset of micellization in the ITC curves, from
differential analysis of the ITC data, and ideal values based on literature cmc values of
C8G1 and CTAB.
Mole fraction
C8G1
cmc from
Model 1
(mM)
cmc from
Model 2
(mM)
cmc from
onset
(mM)
Differential
analysis
(mM)
Ideal
/literature
(mM)
0 1.11 1.05 1.00 0.97 0.95(202)
0.25 1.31 1.30 1.13 1.51 1.25
0.5 1.70 1.75 1.62 1.86 1.86
0.75 2.70 2.84 2.70 3.55 3.41
0.83 3.42 3.71 3.63 5.43 4.72
1 26.0 26.1 23.1 25.6 25.24(68)

83
Table 3.3. Summary of dilution parameters providing best fits for Models 1 and 2.
Model 1 Model 2
Parametersa Best fit value ± std dev Best fit value ± std dev
(kJ l
2/mmol
2mol) -4.7 ± 1.4 -1.3 ± 0.24
(kJ l
2/mmol
2mol) -2.8 ± 1.3 1.4 ± 0.49
(kJ l
2/mmol
2mol) 5.1 ± 1.4 -0.14 ± 0.55
(kJ l
2/mmol
2mol) -0.20 ± 2.7x10
-2 -0.23 ± 0.02
(kJ l
2/mmol
2mol) -2.2 ± 0.31 -1.1 ± 0.25
(kJ l
2/mmol
2mol) 1.9 ± 0.27 1.1 ± 0.13
(kJ l/mmol
mol) -7.0 ± 6.4x10
5 ---
(kJ l/mmol
mol) 2.3 ± 1.7x10
5 ---
(kJ l/mmol
mol) 5.4 ± 6.4x10
5 ---
(kJ l/mmol
mol) 2.2 ± 2.5x10
5 ---
(H) (kJ l
2/mmol
2mol) 0.01 ± 0.002 6.9x10
-3 ± 1.43x10
-3
(H) (kJ l
2/mmol
2mol) 0.05 ± 0.01 0.058 ± 7.8x10
-3
(H) (kJ l
2/mmol
2mol) -1.3 ± 0.920 -0.59 ± 0.62
(H) (kJ l
2/mmol
2mol) 0.28 ± 0.17 0.24 ± 0.13
(H) (kJ l
2/mmol
2mol) 4.4 ± 3.7 -5.80 ± 1.5
(H) (kJ l
2/mmol
2mol) -0.28 ± 0.036 -0.30 ± 2.6x10
-2
(H) (kJ l/mmol
mol) -0.84 ± 2.3x10
5 ---
(H) (kJ l/mmol
mol) -6.8 ± 1.2x10
6 ---
(H) (kJ l/mmol
mol) 0.98 ± 3.2x10
5 ---
(H) (kJ l/mmol
mol) 3.03 ± 1.1x10
6 ---
R2 0.956 0.973
a (H) in Table A.1 indicates dilution parameters associated with the high concentration
region.
Copyright © Suvid Joshi 2014
84
CHAPTER FOUR
4. INTERFACIAL MOLECULAR IMPRINTING OF STÖBER PARTICLE
SURFACES: A SIMPLE APPROACH TO TARGETED SACCHARIDE
ADSORPTION
4.1 Summary
The use of surfactant headgroups for interfacial imprinting is established as a simple
and tunable approach to create molecularly imprinted silica nanoparticles based on a
modification of the Stöber method. Adsorption of D-glucose and D-xylose (initial
concentrations ranging from 0.139 to 1.67 mol/L) was measured on silica nanoparticles
created by the addition of a glucose-based surfactant (n-octyl-β-D-glucopyranoside
(C8G1)) or surfactant mixtures (C8G1 and cetyltrimethylammonium bromide (CTAB))
to Stöber particles shortly after their precipitation. Silica particles synthesized in the
presence of C8G1 as an imprinting surfactant have a significantly higher affinity for
glucose over xylose (as much as 3.25 times greater at 0.25 M saccharide), and an
enhanced affinity for glucose relative to nonimprinted silica particles (as much as 4 times
greater at 0.25 M), which adsorb glucose and xylose similarly. Glucose imprinting is
significantly enhanced using a surfactant mixture of 1:1 C8G1 / CTAB. The interfacial
activity of the nonionic imprinting surfactant at the silica surface is suggested to be
improved by the presence of interfacial cationic CTAB, which is driven to the silica
surface through electrostatic interactions. The concept of imprinting through the
interaction of surfactant head groups with the soft surface of silica particles is supported
by the importance of the time of addition of the surfactants. The greatest enhancement in
glucose adsorption is observed when the surfactants are added 1 minute after precursor
addition (at the onset of aggregated particle formation, as indicated by solution turbidity)
and the silica affinity for glucose decreases with the time of surfactant addition. The

85
versatility of the surfactant imprinting of Stöber particles is demonstrated by the
enhanced adsorption of xylose relative to glucose on particles imprinted using a 1:1
mixture of n-octyl-β-D-xylopyranoside and CTAB, suggesting that the process can be
customized to selectively adsorb target molecules of interest.
4.2 Introduction
Molecularly imprinted silica materials have been of growing interest recently for
applications requiring a high degree of substrate selectivity including catalysis and
separations.(17-19, 80, 106) Molecularly imprinted silica has been synthesized
successfully but complex techniques have been required such as covalent imprinting
using custom precursors(81, 203) or microemulsion-based synthesis.(106) Here, we
propose a simple alternative method based on the Stöber method(22) to synthesize
molecularly imprinted silica particles using surfactants for interfacial imprinting. We
hypothesize that addition of surfactants to the Stöber particles shortly after they
precipitate to their final aggregated size (at which point they are still soft) facilitates
imprinting the surface of these particles with sites complementary to a target molecule
which is also present as the headgroup of one of the surfactants, as illustrated in Scheme
1.
The Stöber method was first reported in 1968 as a method for making uniform
spherical silica particles.(22) Since then several mechanisms have been proposed for the
synthesis process, initially based on nucleation and growth(204) and later including
controlled aggregation.(205),(206) TEM investigations of the formation of Stöber
particles and surfactant-templated mesoporous particles suggest that uniformly sized, soft
droplets / particles of silica precursors form by aggregation shortly after the onset of
turbidity in these solutions, and subsequently react to form solid nanoparticles.(151, 207,

86
208) Primary particles < 10 nm in diameter have also been observed by several
techniques in Stöber particle and zeolite synthesis solutions(209-211), and have
properties consistent with either low-crosslink density polymers(207, 209) or micellar
aggregates(210, 212-215) rather than fully condensed particles. This suggests that
shortly after they form, the particles are susceptible to modification by noncovalent
interactions at their surface. As the particles age and become more rigid, they would be
expected to be less amenable to imprinting.
Many modifications of the Stöber method have been developed to functionalize them
– e.g. with dye molecules, (142, 216) magnetite(217) and biomolecules(143). Strategies
have also been described based on modifying fully cured Stöber particles with functional
groups or polymer layers to create selective adsorption sites, but none of these methods
targets the silica surface itself.(203, 218-221) On the other hand, many examples of
molecular imprinting (MI) of bulk sol-gel silica have been reported(19); in fact, silica gel
was initially used by Dickey as the matrix to demonstrate noncovalent MI with alkyl
orange dyes,(222, 223) although subsequent studies suggested that residual entrapped dye
interfered with those experiments.(224, 225) More recent evidence for MI of silica has
been presented, although elaborate template removal procedures are sometimes
required.(80, 226) One successful MI strategy is covalent imprinting, which involves
attaching a molecular template directly to the silica precursor, and thus requires synthesis
of a custom silane for each target molecule.(80, 227, 228) Successful non-covalent MI of
the surfaces of silica particles has also been reported by Markowitz et al. using reverse
water-in-oil microemulsion synthesis.(105-107) This approach requires that a surfactant
whose headgroup imprints for the target molecule of interest be incorporated into a stable

87
reverse microemulsion, which while successful may not be flexible or facile enough for
some targets.
Because it only depends on weak intermolecular forces such as hydrogen bonding and
van der Waals interactions, non-covalent imprinting is expected to be a flexible, facile
approach to MI if conditions are found to prevent interference from solvents and other
species. This approach has been explored for silica,(80, 229) but can result in
insufficiently selective imprinting(230, 231) and interference from nonspecific binding of
polar compounds(232, 233). Here we propose non-covalent imprinting by adsorption of
surfactants at the surface of freshly aggregated Stöber particles. The amphiphilic nature
of the surfactants is expected to drive them to the particle surface where their headgroups
(which are derivatives of the target molecule) can interact with silicates to facilitate
imprinting. In addition, several studies have indicated that water may be excluded from
the solid-liquid interface by surfactant monolayers,(234-237) which may contribute to MI
if it occurs at the Stöber particle-solution interface.
N-octyl-β-D-glucopyranoside (C8G1) will be used as the primary imprinting
molecule to target adsorption of D-glucose (referred to simply as glucose here) on silica.
This choice is motivated by the need to separate (D-)xylose (a five carbon sugar) and
glucose (a six carbon sugar) in mixtures derived by saccharification of lignocellulosic
biomass in a biorefinery.(238) This separation also offers a challenging proof of concept
for saccharide separations, as these sugars differ by one hydroxymethyl group and
otherwise have identical stereochemistry. Cetyltrimethylammonium bromide (CTAB)
will serve as a co-surfactant expected to bind strongly to the particle surface by
electrostatic interactions. Mixing cationic surfactants with nonionic sugar-based
88
surfactants has previously been shown to enhance their adsorption to solid silica
surfaces.(79, 235) C8G1 and CTAB have also been shown to be compatible with silica-
based materials synthesis (although the goal in that case was unrelated to the present
study).(6) The suggested technique for MI is inexpensive, requires no custom silane
precursors for imprinting or surface modification, and is easily scalable(239). Because it
is based on the general phenomenon of surfactant adsorption, the technique can be easily
tailored for various target molecules, and uniformly sized spherical Stöber particles
provide tunable size as well as favorable flow and transport properties for adsorption and
chromatography.(240)
To demonstrate the concept of surface MI, the adsorption of glucose and xylose will
first be compared using four materials: Stöber silica prepared without surfactants and
with only CTAB, only C8G1, or a 1:1 mixture CTAB and C8G1. Enhancement of
glucose adsorption over xylose in particles prepared with C8G1 will be interpreted using
a two-site Langmuir isotherm with sites specific for glucose. Once the concept is
established, a series of samples prepared with varying CTAB:C8G1 ratios (1:3, 1:1 and
3:1) will be used to determine the optimal surfactant mixture for enhancing glucose
adsorption. To test the hypothesis that MI results from interactions of the surfactants
with the soft surface of freshly precipitated particles, a series of samples will be discussed
in which a 1:1 CTAB / C8G1 surfactant mixture is added at times varying from 1 min to
4 h after initiating Stöber particle formation. Finally, to demonstrate the versatility of the
process, octyl-β-D-xyloside (C8X1) will be used in place of C8G1 to imprint the particles
for enhanced adsorption of xylose.
89
4.3 Experimental Section
4.3.1 Materials
Cetyltrimethylammonium bromide (CTAB) (99.9%) and deionized ultrafiltered (DIUF)
water were purchased from Fisher Scientific; tetraethyl orthosilicate (TEOS),
concentrated ammonium hydroxide (~29% w/v) and D-xylose (>99%) from Acros
Organics; absolute ethanol from Deacon Labs; octyl-β-D-glucopyranoside (C8G1,
99.9%) from Affymetrix; and D-glucose (>99.5%) from Sigma. All chemicals were used
as received without further purification.
4.3.2 Octyl-β-D-xylopyranoside synthesis (C8X1)
C8X1 was synthesized from D-xylose by first converting it to peracetylated β-D-
xylose using acetic anhydride in pyridine to protect hydroxyl groups. HBr was then used
to brominate the carbon neighboring oxygen in the furan ring. The brominated ring was
esterified by 1-octanol in presence of Ag2CO3 and CaSO4. Sodium methoxide in
methanol was used for deprotection of acetylated hydroxyl groups to obtain the final
product C8X1, which was purified by recrystallization. The full procedure is described
by Xu et al.(241)
4.3.3 Particle synthesis
Unless otherwise indicated, all silica materials were synthesized by the same room
temperature procedure. 58.2 g of anhydrous ethanol, 9.8 ml of ammonia solution and
10.8 g of DIUF water were first mixed and stirred for 15 min. Particle formation was
initiated by adding 5.26 g of TEOS under vigorous stirring. If surfactants were used, they
were added a set time after TEOS addition. The quantity and types of surfactants will be
described below. The default time was 1 min after TEOS addition, at which point the
reaction mixture had begun turning turbid. All particle solutions were stirred for 24 h
90
after surfactant addition (or after TEOS addition if no surfactant was used) at room
temperature to allow for solidification of the silica. The particles were then centrifuged at
5500 rpm for 5 min, the supernatant was discarded, and the particles were dried and aged
at 50 °C for 24 h.
Initial studies of differences in the adsorption of glucose and xylose caused by the
addition of surfactants were performed using a set of four samples. They were prepared
with an ammonia reagent containing ~15% w/v NH4OH and varying additives: either no
surfactant (sample 1), 20 mg of CTAB only (sample 2), 20 mg of C8G1 only (sample 3),
or 10 mg CTAB + 10 mg C8G1 (sample 4). The total amount of surfactant (20 mg) was
estimated to be enough to provide approximately a monolayer of surfactant at the surface
of the particles.
For the rest of the materials (samples 5-14), saturated aqueous ammonia (~29% w/v
NH4OH) was used to give larger, easier to handle particles (see below for
characterization). The first two series of these particles were prepared to observe the
effects of key process parameters on surfactant incorporation and subsequent glucose
adsorption. The first (samples 6-8) was prepared with varying ratios of CTAB: C8G1.
For comparison with these materials, sample 5 was prepared with no surfactant. Particles
with ratios of 1:3, 3:1, and 1:1 were prepared by adding 5 mg CTAB + 15 mg C8G1, 15
mg CTAB + 5 mg C8G1, or 10 mg CTAB + 10 mg C8G1 to samples 6-8, respectively.
Surfactant was added 1 min after introducing TEOS for samples 6-8. The second series
was prepared with a constant ratio of 1:1 CTAB to C8G1 (10 mg CTAB + 10 mg C8G1)
but with varying time of addition. Samples 8-12 were prepared with surfactant addition 1
91
min, 2.5 min, 5 min, 1 h or 4 h after introducing TEOS, respectively. Sample 5 also
serves as the control sample without surfactant for comparison to this series.
Versatility of the imprinting technique was demonstrated by using another saccharide
surfactant in place of C8G1. C8X1 imprinted particles (sample 13) were prepared by
first mixing 56.64 g of anhydrous ethanol, 9.8 ml of saturated aqueous ammonia and 10.8
ml of DIUF water in a conical flask, and stirring the mixture in a water bath maintained at
50 ˚C for 15 min. Because of the limited solubility of C8X1 in water, a mixture of 10 mg
CTAB and 10 mg C8X1 was prepared in 2 ml of ethanol (rather than using dry
surfactants as in all other particles in this study). The mixture was heated to 50 ˚C for 5
minutes in a tightly closed vial to prevent evaporation of ethanol. 5.26 g of TEOS was
then added to the conical flask containing ethanol, ammonia and water. 50 sec after
TEOS addition, the surfactant solution was added to the conical flask, the conical flask
was stirred at 50 ˚C for another minute, and then it was removed from the water bath and
stirred at room temperature for 24 h. Particles without surfactant (sample 14) were also
synthesized under the same conditions as sample 13 except that 50 sec after TEOS
addition, 2 ml of ethanol (without surfactants) was added to the conical flask. To recover
and wash the particles, the same procedure was used as for C8G1 imprinted particles.
Washing particles: After aging, all particles (on average 1.3 g of particles per batch)
were washed with 12-13 ml of ethanol in 15 ml centrifuge tubes to remove the surfactant
from the silica surface. Three washing cyles with ethanol were performed (with
sonication to disperse the particles each time), and the particles were subsequently
washed several times with DIUF water using sonication and centrifugation until the pH
92
of the supernatant was found to be approximately 7 using pH paper. The particles were
finally recovered by centrifugation and dried at 50 °C for 24 h.
4.3.4 Particle characterization
Nitrogen adsorption was performed using a Micromeritics Tristar 3000 automatic gas
adsorption instrument. The particles were degassed under flowing nitrogen for 5 h at 140
°C prior to analysis. Surface areas were determined using the multilayer adsorption
isotherm of Brunauer, Emmett and Teller (BET)(164). A Beckman Coulter Delsa Nano
C particle size analyzer was used to determine particle size and zeta potential in solution.
Particles were dispersed in DIUF water for DLS using a sonication bath until a uniform
colloidal suspension was obtained. The suspension was allowed to sit in a
microcentrifuge tube for 30 minutes to allow settling of any aggregates that were present.
A Hitachi S-4300 scanning electron microscope (SEM) was used to visualize the
particles. The samples were prepared for SEM by adding a small amount of particles on
carbon tape placed on a sample holder. Excess particles were blown off using pressurized
air. Particles were sputtered with a conductive Au / Pd layer using an Emscope SC400
before analysis. FTIR spectra of the solid samples were measured using a
ThermoElectron Nexus 470 instrument using samples pressed into KBr pellets at an
approximate concentration of 1 wt%. KBr pellets were prepared using a benchtop press.
4.3.5 Saccharide Adsorption Measurements:
The dried particles were used to measure the adsorption of glucose and xylose from
aqueous solutions. For detailed analysis (samples 1-4), the initial concentrations of the
saccharide solutions ranged from 0.139 mol/l to 1.67 mol/L in increments of 0.139
mol/L. For truncated analysis (used in samples 5-12), three initial glucose concentrations

93
of 0.139, 0.694 and 1.39 mol/l were used. For xylose-imprinted materials (samples 13
and 14), the initial concentrations were 0.15, 0.75 and 1.5 mol/L. For each adsorption
measurements, 50 mg of particles were initially wetted by suspending them in 1 mL of
DIUF water and stirring for 24 h in a 5 mL vial. The wetted particles were then
centrifuged and the particles were transferred to the original vials along with 1 ml of a
saccharide solution of known concentration. The solutions were stirred vigorously for 24
h at room temperature, centrifuged, and the supernatant was analyzed to determine the
final saccharide concentration.
4.3.6 Saccharide Analysis
Saccharide concentrations in solution were quantified using attenuated total reflection
(ATR) FTIR analysis of the solutions in a horizontal trough ATR accessory (from Pike
Technologies) with a ZnSe ATR element. The spectrum of pure DIUF water was
subtracted from each spectrum prior to analysis and the area under the curve from 900 to
1200 cm-1
was used to quantify the concentration of each saccharide(242). Linear
calibration curves (Appendix B Figure B.1) were measured for standard solutions with R2
= 0.997 (for glucose) and 0.999 (for xylose). The amount of saccharide adsorption was
determined by solution depletion, where the concentrations of saccharide before and after
adsorption as measured by ATR-FTIR were subtracted and the amount of saccharide per
mass of adsorbent was calculated by a mass balance. Adsorption measurements were
performed in triplicate to determine mean and standard deviation values for all samples.
4.4. Results and Discussion
As noted above, four samples were first prepared to investigate the effects of the
addition of surfactants early in the synthesis process on the adsorption of glucose and

94
xylose from aqueous solutions. These two sugars were selected because they are the
most abundant saccharides found in biomass hydrolyzates, but they also are a pair of
saccharides differing by a single hydroxymethyl group. Samples were prepared using no
surfactant (sample 1); or with CTAB (2), C8G1 (3), or a 1:1 mixture of CTAB and C8G1
(4) added 1 minute after TEOS addition. One minute is the point at which solutions
become turbid after TEOS addition.
Infrared spectroscopy was used to show the inclusion of surfactants in the as-prepared
samples, and their removal following washing. Removal of the templates from
molecularly imprinted materials is essential to avoid potential misinterpretation of the
effects observed in subsequent binding experiments, as has been pointed out for Dickey’s
original studies of molecular imprinting of silica gels(225). Figure 4.1 shows FTIR
spectra of unwashed and washed silica particles as well as the solid surfactant reagents.
Figure 4.1A shows the region containing bands associated with CH2 stretching in the
surfactants (near 2900 cm-1
, highlighted in grey). The bands are observed for CTAB,
C8G1 and in all particles prepared with surfactants, which suggests that even after
centrifugation the surfactants are associated with the surface of the particles. This is
consistent with MI occurring on the particle surface. Fig. 4.1A also shows that the
washing procedure completely removes surfactants from the particles, as indicated by the
absence of CH2 stretching bands in the washed particles. Figure 4.1B shows the region
containing the siloxane stretching bands from ca. 1100 to 1300 cm-1
for the Stöber
particles. These bands indicate that the silica particles are well cured and that there is no
harmful effect of washing on the particles. Silanol bands are present before and after

95
extraction (the bands at ~950 cm-1
and within the broad OH stretching band centered near
3400 cm-1
) but no obvious differences among the bands can be discerned.
Figure 4.2 shows a representative SEM micrograph for the 1:1 CTAB/C8G1 sample
(sample 4); all samples have similar smooth, monodisperse particles with no evidence of
surface features even at higher magnification (Appendix B Figure B.2). Nitrogen
adsorption measurements show that all of the particle samples are nonporous, as
indicated by the absence of capillary condensation in the adsorption isotherms (Appendix
B Figure B.3). The surface areas of the particles from the BET isotherm are estimated to
be on the order of 9-12 m2/g (Table 4.1), which is similar to the surface area calculated
using the average particle size from the SEM images and assuming a silica density of 1.8
(g/cm3)(243). The diameters of the particles from SEM all fall in the range from 310 to
350 nm (consistent with the correlation of Bogush et al. for a reagent containing ~ 15
w/v% ammonia) and no systematic trend is observed regarding the relationship between
surfactant used and particle size although sample 4 (prepared with a 1:1 CTAB/C8G1
mixture) has the greatest particle size and smallest surface area. The hydrodynamic
diameters from DLS agree well but are slightly larger than the diameters of the particles
in SEM because of water adsorbed to the particle surfaces and concentration effects in the
DLS measurement. Zeta potential measurements indicate that the particles prepared
without surfactants (1) and imprinted with non-ionic C8G1 (3) are the least negative,
while using CTAB during synthesis gives particles with a higher negative surface charge
(samples 2 and 4). CTAB may induce the formation of particles with a higher density of
hydroxyl groups at the particle surfaces, or more acidic hydroxyl groups. Despite small
differences among samples 1-4, the characteristics summarized in Table 1 show that the
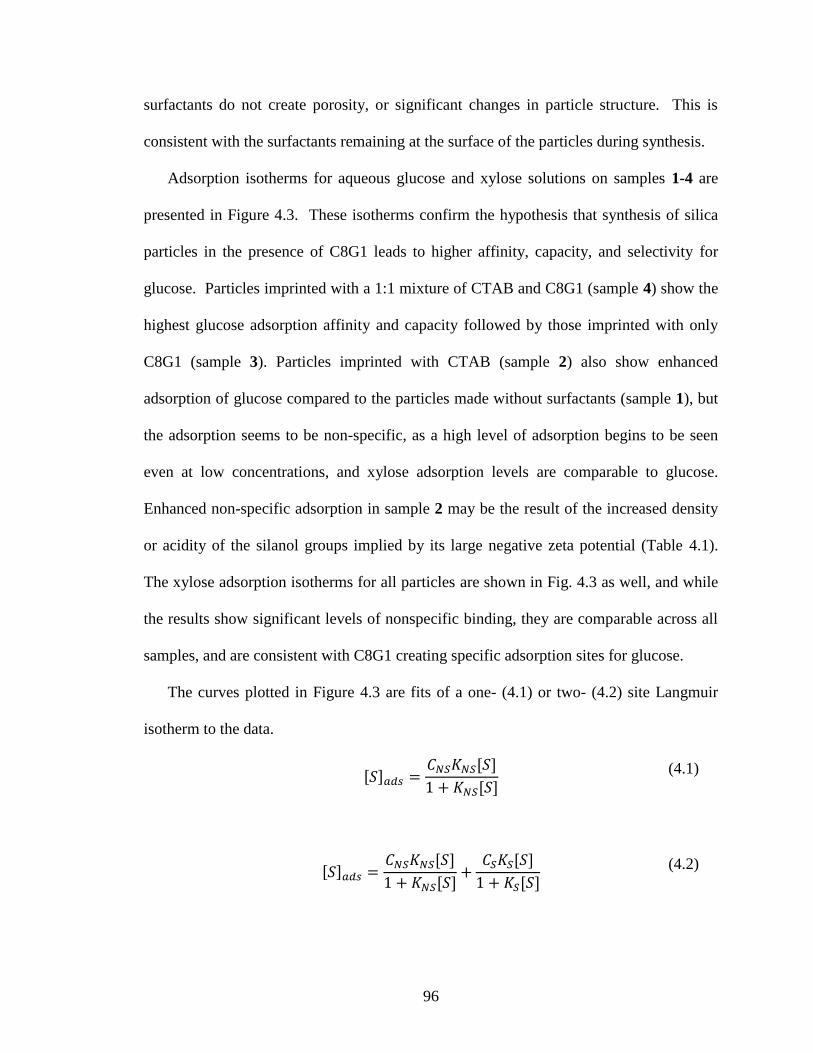
96
surfactants do not create porosity, or significant changes in particle structure. This is
consistent with the surfactants remaining at the surface of the particles during synthesis.
Adsorption isotherms for aqueous glucose and xylose solutions on samples 1-4 are
presented in Figure 4.3. These isotherms confirm the hypothesis that synthesis of silica
particles in the presence of C8G1 leads to higher affinity, capacity, and selectivity for
glucose. Particles imprinted with a 1:1 mixture of CTAB and C8G1 (sample 4) show the
highest glucose adsorption affinity and capacity followed by those imprinted with only
C8G1 (sample 3). Particles imprinted with CTAB (sample 2) also show enhanced
adsorption of glucose compared to the particles made without surfactants (sample 1), but
the adsorption seems to be non-specific, as a high level of adsorption begins to be seen
even at low concentrations, and xylose adsorption levels are comparable to glucose.
Enhanced non-specific adsorption in sample 2 may be the result of the increased density
or acidity of the silanol groups implied by its large negative zeta potential (Table 4.1).
The xylose adsorption isotherms for all particles are shown in Fig. 4.3 as well, and while
the results show significant levels of nonspecific binding, they are comparable across all
samples, and are consistent with C8G1 creating specific adsorption sites for glucose.
The curves plotted in Figure 4.3 are fits of a one- (4.1) or two- (4.2) site Langmuir
isotherm to the data.
(4.1)
(4.2)

97
In the equations, [S]ads = the concentration of saccharide adsorbed per unit of area, CNS =
the non-specific capacity of the adsorbent, CS is specific capacity of the adsorbent, KNS =
the non-specific equilibrium coefficient for binding, KS = the specific equilibrium
coefficient for binding, and [S] = the aqueous saccharide concentration. The coefficients
found by nonlinear regression are summarized in Table 4.2. For both xylose and glucose,
the set of adsorption parameters was simultaneously fit to all four isotherms while
keeping KNS constant among all adsorbents but allowing CNS, KS and CS values to vary
among samples. The square of the difference between measured adsorbed glucose
concentrations and the model concentrations were weighted using the inverse of the
standard deviation in the measurement, and minimization of the sum of the squared
residuals (SSR) was performed using the Levenberg-Marquardt algorithm.(244)
A single-site model (Equation 4.1) was used whenever possible, and was found to
provide an adequate fit for glucose adsorption onto the samples prepared without
surfactants or with only CTAB (samples 1 and 2). Equation 1 was also used for all
xylose adsorption isotherms. The two-site Langmuir adsorption isotherm was only used
for adsorption of glucose onto the samples made with C8G1 (3) and the 1:1 C8G1/CTAB
mixture (4). This model gave a significantly superior fit for these samples, mainly
because it is able to model a more rapid increase in adsorbed glucose at low
concentrations than the single-site Langmuir model. The R2 values for the best-fit
glucose adsorption curves in Fig. 4.6 are 0.973, 0.885, 0.975 and 0.975 for samples 1-4,
respectively (Table 4.2). When a one-site model was used for all adsorbents, the
corresponding R2 values were significantly less: 0.791, 0.753, 0.968 and 0.836,
respectively (see Appenix B Figure B.4). Attempting to use the two-site model for

98
xylose adsorption led to one best-fit adsorption capacity (CS or CNS) being estimated as
zero, which suggests that a one-site model was sufficient. Using a two-site model for
glucose adsorption on the samples prepared without surfactant and with CTAB (1 and 2)
led to the same conclusion. Also, fitting individual adsorption isotherms by linear or
nonlinear regression was explored but the global nonlinear regression procedure
employed here led to much smaller uncertainties in the optimized parameters.
Comparison of the coefficients in Table 4.2 helps to interpret the differences among
isotherms in Fig. 4.3. First, we note that the capacity for non-specific binding (CNS)
changes only slightly upon going from no surfactant (0.000593±5.5% mol/m2) to C8G1
(0.000554±6.4% mol/m2) and the 1:1 mixture of C8G1 and CTAB (0.000595±8.2%
mol/m2). At the same time, the capacity for specific binding of glucose increases to a
maximum of 0.000330±4.5% mol/m2 for the 1:1 C8G1/CTAB mixture. This is
consistent with C8G1 reorganizing some of the hydroxyl groups at the surface of the
Stöber particles to create sites specific towards glucose (perhaps at the expense of some
of the nonspecific surface). The total capacity of these adsorbents is on the order of
0.008 mol glucose/m2, which corresponds to roughly 0.21 Å
2/molecule. This molecular
area is much less than the molecular area that estimated from the structure of glucose (51
Å2)(245), from the monolayer capacity estimated by molecular dynamics simulations of
glucose adsorption in silica pores (44 Å2)(245), or from the monolayer capacity of
glucose dispersed on silica in the solid state (12 Å2)(246). The high levels of adsorption
found here indicate that glucose adsorbs to silica in multilayer fashion, or in clusters that
nucleate at the silica surface, as observed in molecular dynamics simulations of glucose
adsorption in silica channels(247). The amounts of glucose adsorbed during our

99
experiments, although high (some exceeding 1 g glucose / g particles), are consistent with
a previous report of Kuhn et al., who reported a linear isotherm up to 0.8 g glucose / g
celite at 30 °C over a concentration range up to 1 mol/L of glucose(248). CTAB
increases adsorption capacity (to 0.000861±5.2% mol/m2) but not adsorption specificity
in sample 2, which suggests that the effect of CTAB is to increase the density of
accessible hydroxyl groups on the silica surface (consistent with its large negative zeta
potential).
The nonspecific glucose adsorption equilibrium coefficient for unimprinted Stöber
silica (Table 4.2) is estimated to be KNS = 0.862±8.6% l/mol. This value compares
favorably with the order of magnitude estimated by molecular dynamics by Ziemys et al.
(0.67 l/mol(249)), and the product KNSCNS is equal to 6.4×10⁻³
l/g, which compares
favorably to the slope of the linear isotherm reported for glucose adsorption on celite at
30 °C by Kuhn et al., 3.75×10⁻³
l/g(248). The greatest advantage offered by the 1:1
mixture of CTAB and C8G1 (sample 4) is that it increases the equilibrium coefficient
(KS) for specific adsorption significantly compared to nonspecific adsorption (to KS =
42±57% l/mol). The material made with only C8G1 imprinting (3) shows a smaller, but
still significant increase in KS compared to KNS. The difference in affinity for glucose
between samples 3 and 4 is hypothesized to be due to the relatively strong electrostatic
interaction between CTAB and silica, which helps to more effectively draw C8G1 into a
mixed monolayer on the Stöber particle surface during synthesis compared to hydrogen
bonding interactions with C8G1 alone. The xylose adsorption parameters indicate less
affinity for silica (KNS = 0.56±14% l/mol) and capacities that remain near 0.0008 mol/m2
for all adsorbents. Overall, the Langmuir model parameters suggest that imprinting with
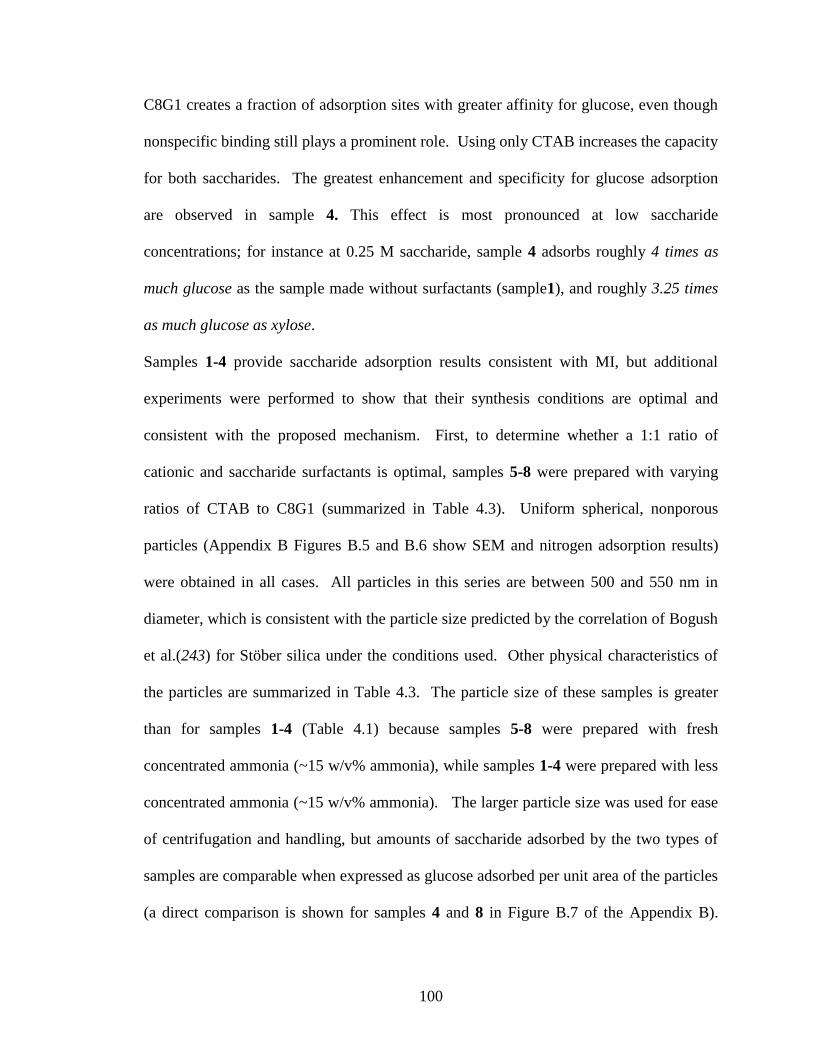
100
C8G1 creates a fraction of adsorption sites with greater affinity for glucose, even though
nonspecific binding still plays a prominent role. Using only CTAB increases the capacity
for both saccharides. The greatest enhancement and specificity for glucose adsorption
are observed in sample 4. This effect is most pronounced at low saccharide
concentrations; for instance at 0.25 M saccharide, sample 4 adsorbs roughly 4 times as
much glucose as the sample made without surfactants (sample1), and roughly 3.25 times
as much glucose as xylose.
Samples 1-4 provide saccharide adsorption results consistent with MI, but additional
experiments were performed to show that their synthesis conditions are optimal and
consistent with the proposed mechanism. First, to determine whether a 1:1 ratio of
cationic and saccharide surfactants is optimal, samples 5-8 were prepared with varying
ratios of CTAB to C8G1 (summarized in Table 4.3). Uniform spherical, nonporous
particles (Appendix B Figures B.5 and B.6 show SEM and nitrogen adsorption results)
were obtained in all cases. All particles in this series are between 500 and 550 nm in
diameter, which is consistent with the particle size predicted by the correlation of Bogush
et al.(243) for Stöber silica under the conditions used. Other physical characteristics of
the particles are summarized in Table 4.3. The particle size of these samples is greater
than for samples 1-4 (Table 4.1) because samples 5-8 were prepared with fresh
concentrated ammonia (~15 w/v% ammonia), while samples 1-4 were prepared with less
concentrated ammonia (~15 w/v% ammonia). The larger particle size was used for ease
of centrifugation and handling, but amounts of saccharide adsorbed by the two types of
samples are comparable when expressed as glucose adsorbed per unit area of the particles
(a direct comparison is shown for samples 4 and 8 in Figure B.7 of the Appendix B).
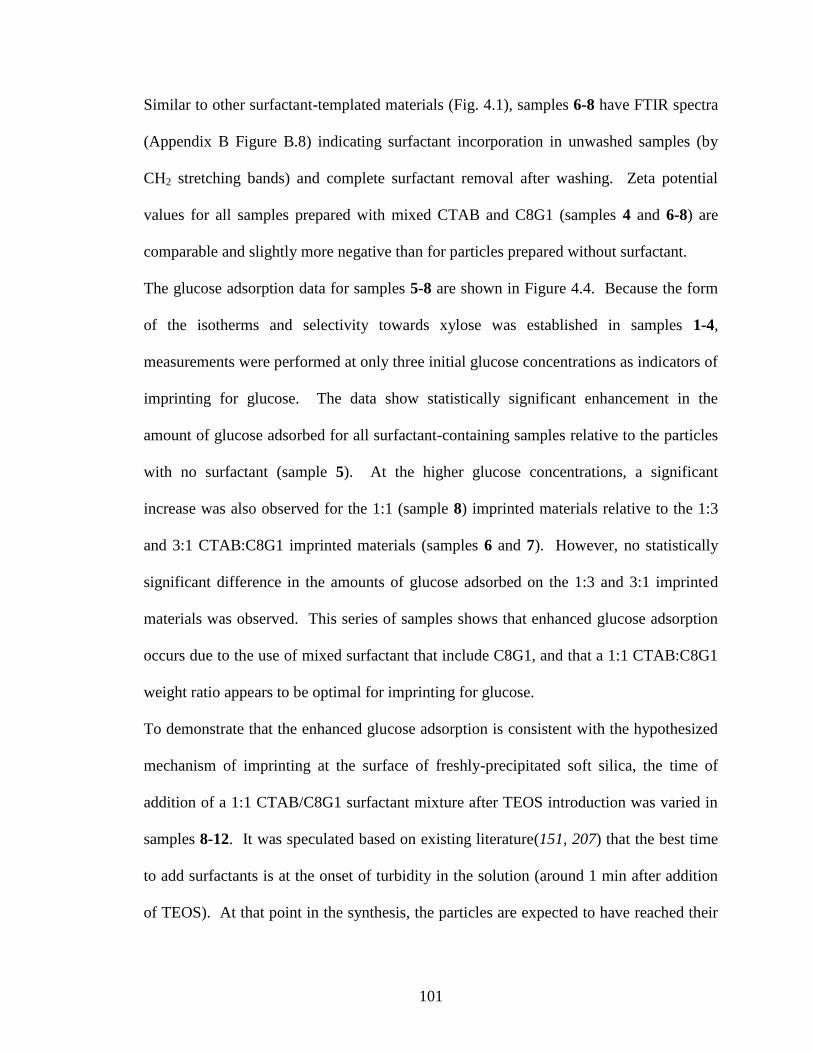
101
Similar to other surfactant-templated materials (Fig. 4.1), samples 6-8 have FTIR spectra
(Appendix B Figure B.8) indicating surfactant incorporation in unwashed samples (by
CH2 stretching bands) and complete surfactant removal after washing. Zeta potential
values for all samples prepared with mixed CTAB and C8G1 (samples 4 and 6-8) are
comparable and slightly more negative than for particles prepared without surfactant.
The glucose adsorption data for samples 5-8 are shown in Figure 4.4. Because the form
of the isotherms and selectivity towards xylose was established in samples 1-4,
measurements were performed at only three initial glucose concentrations as indicators of
imprinting for glucose. The data show statistically significant enhancement in the
amount of glucose adsorbed for all surfactant-containing samples relative to the particles
with no surfactant (sample 5). At the higher glucose concentrations, a significant
increase was also observed for the 1:1 (sample 8) imprinted materials relative to the 1:3
and 3:1 CTAB:C8G1 imprinted materials (samples 6 and 7). However, no statistically
significant difference in the amounts of glucose adsorbed on the 1:3 and 3:1 imprinted
materials was observed. This series of samples shows that enhanced glucose adsorption
occurs due to the use of mixed surfactant that include C8G1, and that a 1:1 CTAB:C8G1
weight ratio appears to be optimal for imprinting for glucose.
To demonstrate that the enhanced glucose adsorption is consistent with the hypothesized
mechanism of imprinting at the surface of freshly-precipitated soft silica, the time of
addition of a 1:1 CTAB/C8G1 surfactant mixture after TEOS introduction was varied in
samples 8-12. It was speculated based on existing literature(151, 207) that the best time
to add surfactants is at the onset of turbidity in the solution (around 1 min after addition
of TEOS). At that point in the synthesis, the particles are expected to have reached their

102
final size, but to be soft enough to allow interactions with surfactant head groups to
imprint the particle surface.(151, 207) Polycondensation of the silica would be expected
to reduce the efficacy of imprinting over time by reducing the ability of headgroups to
form complementary binding sites at the particle surface.
All particles in samples 8-12 were uniformly spherical, with diameters in the range of
500-550 nm (Appendix B Figure B.9, nitrogen adsorption results in Figure B.6). No
noticeable effect of surfactant addition time on particle size was detected, consistent with
the concept that the particle formation process is mostly finished by the earliest time we
selected for surfactant addition (1 min). FTIR spectra are reported in Figure 4.5 for as-
prepared (unwashed) particles with surfactant addition times of 1 min (8), 2.5 min (9), 5
min (10), 1 h (11) and 4 h (12). The intensity of the CH2 stretching bands near 2900 cm-1
reduces as the time surfactant addition increases, suggesting weaker interactions of
surfactants with the Stöber particles. When the surfactants were added 4 h after TEOS
addition (sample 12), no evidence of surfactant incorporation in the unwashed particles
could be seen. These observations are consistent with decreasing potential for imprinting
as the silica particles solidify while aging. Zeta potentials (Table 4.3) for samples with
early surfactant addition (8-10) are similar and more negative than for samples 11 and 12,
which have zeta potentials similar to the particles prepared with no surfactants (sample
5). This is consistent with the surfactants added early in the Stöber process interacting
more strongly with the soft particle surface to give a higher density of hydroxyl groups.
Direct evidence for improved imprinting with early surfactant addition is found in the
enhancement of glucose adsorption, which is shown in Figure 4.6. Prior to conducting
these adsorption experiments, the particles were washed and the complete surfactant
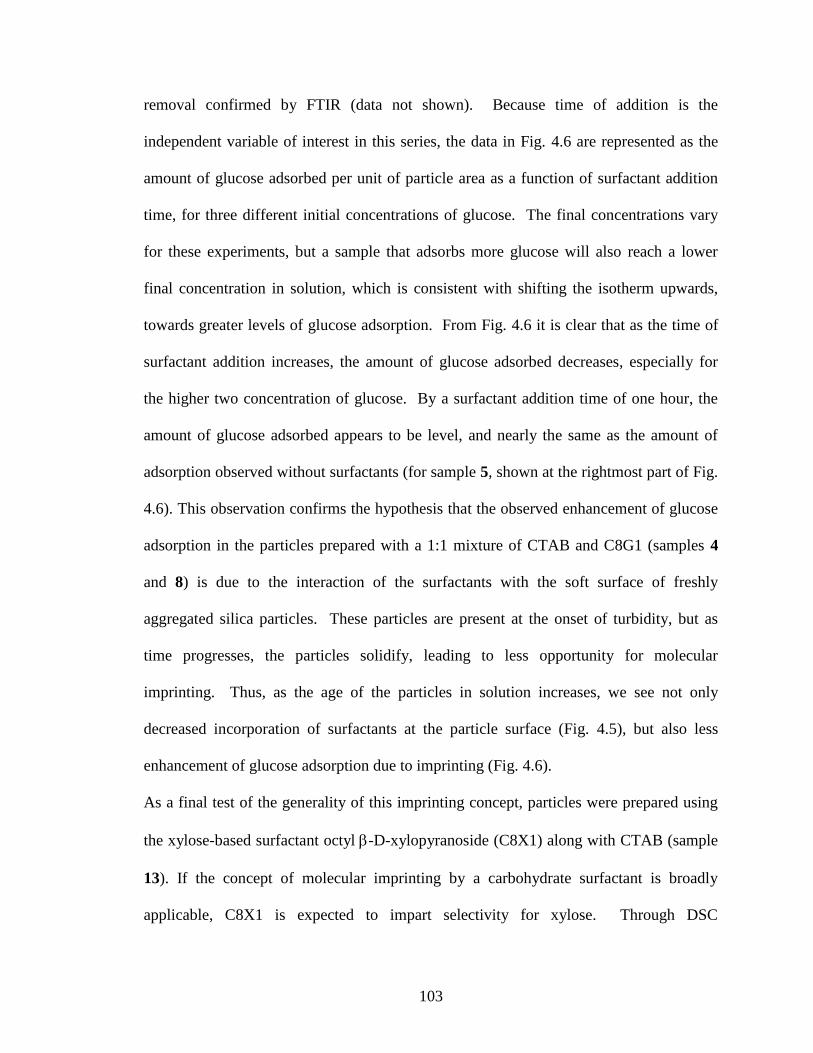
103
removal confirmed by FTIR (data not shown). Because time of addition is the
independent variable of interest in this series, the data in Fig. 4.6 are represented as the
amount of glucose adsorbed per unit of particle area as a function of surfactant addition
time, for three different initial concentrations of glucose. The final concentrations vary
for these experiments, but a sample that adsorbs more glucose will also reach a lower
final concentration in solution, which is consistent with shifting the isotherm upwards,
towards greater levels of glucose adsorption. From Fig. 4.6 it is clear that as the time of
surfactant addition increases, the amount of glucose adsorbed decreases, especially for
the higher two concentration of glucose. By a surfactant addition time of one hour, the
amount of glucose adsorbed appears to be level, and nearly the same as the amount of
adsorption observed without surfactants (for sample 5, shown at the rightmost part of Fig.
4.6). This observation confirms the hypothesis that the observed enhancement of glucose
adsorption in the particles prepared with a 1:1 mixture of CTAB and C8G1 (samples 4
and 8) is due to the interaction of the surfactants with the soft surface of freshly
aggregated silica particles. These particles are present at the onset of turbidity, but as
time progresses, the particles solidify, leading to less opportunity for molecular
imprinting. Thus, as the age of the particles in solution increases, we see not only
decreased incorporation of surfactants at the particle surface (Fig. 4.5), but also less
enhancement of glucose adsorption due to imprinting (Fig. 4.6).
As a final test of the generality of this imprinting concept, particles were prepared using
the xylose-based surfactant octyl-D-xylopyranoside (C8X1) along with CTAB (sample
13). If the concept of molecular imprinting by a carbohydrate surfactant is broadly
applicable, C8X1 is expected to impart selectivity for xylose. Through DSC

104
experiments, the Krafft temperature of C8X1 was determined to be 46.3 ˚C (Figure B.10
in Appendix B). Therefore, to ensure that the surfactant was soluble during synthesis, the
synthesis was carried out at an initial temperature of 50 ˚C. To minimize the impact of
high temperature synthesis the particles were stirred at 50 ˚C for only 50 sec after
surfactant addition, by which time the particle formation (indicated by the onset of
turbidity) is thought to be complete. As in other surfactant-templated particles, FTIR
spectra of sample 13 prepared using a 1:1 mixture of C8X1 and CTAB (Figure 4.7) show
CH2 stretching bands associated with surfactants before washing and elimination of these
bands after washing, with no change in the siloxane stretching bands near 1200 cm-1
.
SEM images of particles synthesized at 50 °C with and without CTAB/C8X1 surfactants
(samples 13 and 14) are shown in Appendix B Figure B.11. No drastic effect is seen on
particle size (330-360 nm) or particle shape due to use of higher temperature. The
nitrogen adsorption isotherm (Appendix B Figure B.12) shows no evidence for porosity.
However, the zeta potentials of both samples prepared at 50 °C are significantly less
negative than for samples prepared at room temperature (Table 4.3).
The adsorption of glucose and xylose (initial concentrations of 0.15, 0.75 and 1.5 M) on
the particles synthesized from 1:1 CTAB:C8X1 and non-imprinted particles are
compared in Figure 4.8. The imprinted particles (sample 13) adsorb significantly more
xylose than the non-imprinted particles (sample 14). The greatest enhancement is
observed at the lowest initial saccharide concentration, where the xylose adsorption is
increases by 5.5 times. Glucose adsorption on the sample made with 1:1 CTAB and
C8X1 (13) is only slightly greater than for the comparable sample made without
surfactants (14), which exhibits the same amount of non-specific adsorption of both

105
glucose and xylose. These results demonstrate that the enhancement of adsorption is
specific to the target molecule that is present in the headgroup of the surfactant used for
particle preparation. Particles with affinity for either glucose or xylose can be prepared
by simply using a saccharide surfactant whose headgroup is the saccharide of interest.
Closely related saccharides (such as glucose in Fig. 4.8) show similar levels of adsorption
on both non-imprinted particles and particles imprinted to target a different saccharide
(xylose in Fig. 4.8).
Overall, the xylose imprinting by C8X1 appears to be somewhat more effective than
glucose imprinting by C8G1. Imprinting with a 1:1 CTAB/C8G1 mixture gives at most
a 4-fold increase in glucose adsorption (at 0.25 M saccharide, Fig. 4.3) compared with a
5.5-fold increase in xylose adsorption for imprinting with a 1:1 CTAB/C8X1 mixture (at
~0.15 M saccharide, Fig. 4.8). The effect of particle synthesis temperature (room
temperature for glucose imprinted materials and 50 °C for xylose imprinted materials),
necessitated by differences in the solubility of C8G1 and C8X1, may accentuate the
imprinting effect of C8X1. Non-specific adsorption of both glucose and xylose to these
non-imprinted materials was significantly reduced for particles synthesized at 50 °C
relative to room temperature synthesis. For instance, the sample prepared without
surfactants at room temperature (5) adsorbs 0.00034 mol glucose/m2 at 1.3 mol glucose/L
in solution, while the sample precipitated without surfactants at 50 °C (sample 14)
adsorbs 0.0001 mol glucose/m2 at 1.5 mol glucose/L in solution. We speculate that this
may be because the higher synthesis temperature leads to a lower hydroxyl density on the
final particle surface (consistent with the reduced magnitude of zeta potential of these
particles), and hence less functional groups for saccharide interactions. Regardless of the

106
source of reduced nonspecific binding, however, the increased hydrophobicity of the
xylopyranoside headgroup of C8X1 relative to C8G1 would be expected to help to drive
the surfactant to the particle surface during synthesis, thus leading to the improved
efficacy of imprinting. This observation suggests that tuning the surface forces that drive
surfactant templates to the surface of freshly precipitated Stöber silica particles should be
a way to further improve molecular imprinting by this approach.
4.5. Conclusions
In conclusion, evidence was presented consistent with molecular imprinting of freshly
precipitated Stöber silica particles by headgroups of saccharide surfactants to impart
selective enhancement in adsorption of the corresponding target saccharide. Cationic
surfactant CTAB was added to improve imprinting by providing strong electrostatic
interactions in the mixed surfactant adlayers.(79, 235) Of the surfactant compositions
tested, a 1:1 mixture of CTAB and the saccharide surfactant was found to give the
greatest enhancement in saccharide adsorption. Detailed analysis of saccharide
adsorption isotherms showed that the glucose-based surfactant C8G1 imprints the silica
with sites that have a significantly greater affinity for glucose than non-imprinted silica.
The effect was greatest for the sample prepared with a 1:1 mixture of CTAB and C8G1
(sample 12), which showed roughly 4 times more glucose adsorption than non-imprinted
particles and 3.25 times more glucose adsorption than xylose, both at saccharide
concentrations in solution of 0.25 M. The time of surfactant addition was also varied,
and FTIR showed that the greatest amount of surfactant was incorporated for the earliest
surfactant addition time tested, at the onset of turbidity of the solution 1 min after silica
precursor addition. Consistent with molecular imprinting of freshly precipitated silica
107
particle surfaces, glucose adsorption was also most strongly enhanced for the earliest
surfactant addition.
This approach to molecular imprinting is novel but simple, and can be generalized to
other target molecules because no modification of the particle synthesis procedure is
required. This point was demonstrated by preparing imprinted particles with the xylose-
based surfactant C8X1 that selectively adsorb xylose compared to glucose. These results
suggest that a wide variety of target compounds can be used as long as surfactant
imprinting molecules are available, and further modification to add complementary
functionality or to block nonspecific binding are possible ways to further enhance the
effectiveness of this approach.

108
Figure 4.1. (A) High wavenumber and (B) low wavenumber regions of the FTIR spectra
of imprinted Stöber particles, showing the presence of surfactant on the particles before
washing and its removal upon washing. Spectra are shown for (a) sample 1, non-
imprinted silica, (b) sample 2, prepared with CTAB, (c) sample 3, prepared with C8G1,
(d) sample 4, prepared with a 1:1 CTAB / C8G1 mixture, (e) crystalline C8G1 and (f)
crystalline CTAB. Spectra labeled with primes (a’ through d’) are the spectra of washed
samples 1-4, respectively.
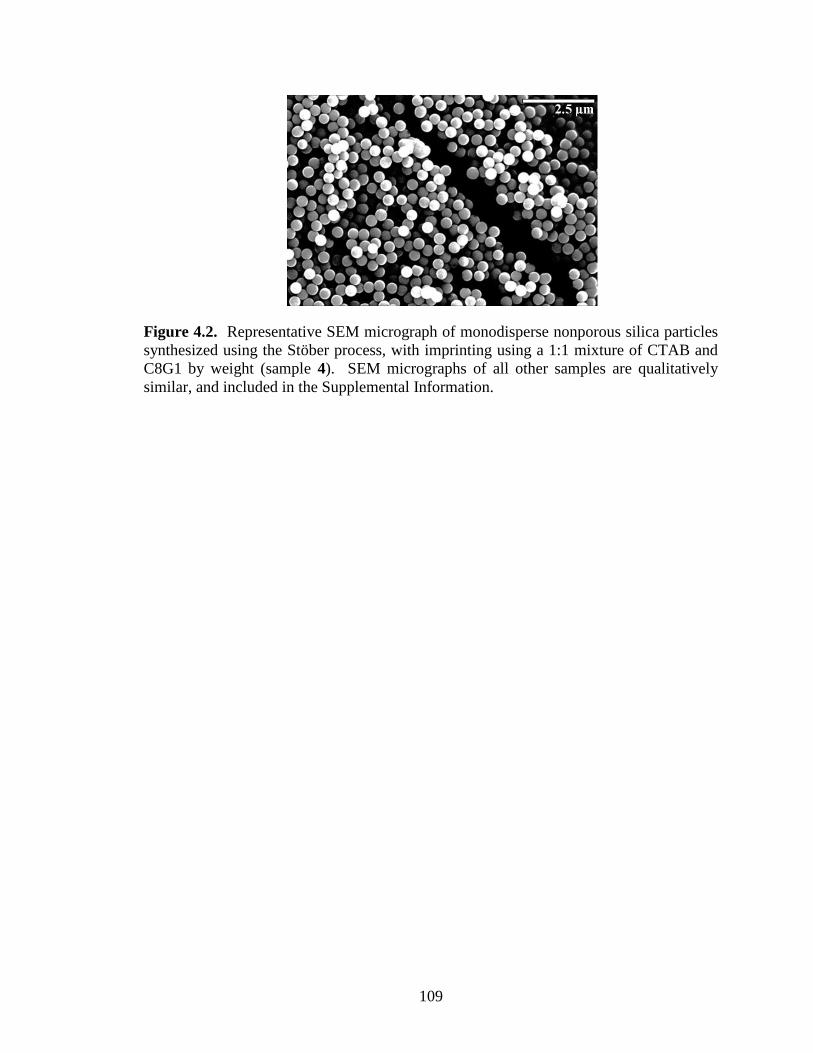
109
Figure 4.2. Representative SEM micrograph of monodisperse nonporous silica particles
synthesized using the Stöber process, with imprinting using a 1:1 mixture of CTAB and
C8G1 by weight (sample 4). SEM micrographs of all other samples are qualitatively
similar, and included in the Supplemental Information.

110
Figure 4.3. Comparison of adsorption isotherms for D-glucose and D-xylose adsorbing
from aqueous solution onto (a) sample 1, non-imprinted particles, (b) , sample 2,
prepared with CTAB, (c) sample 3, prepared with C8G1, and (d) sample 4, prepared with
a 1:1 mixture of CTAB and C8G1. The vertical axis represents moles of saccharide
adsorbed per m2 of silica particle area, and the horizontal axis represents the final moles
of sugar per liter of solution. Curves are best-fit Langmuir isotherms found by globally
optimizing adsorption parameters for all adsorbents (see text for further explanation).
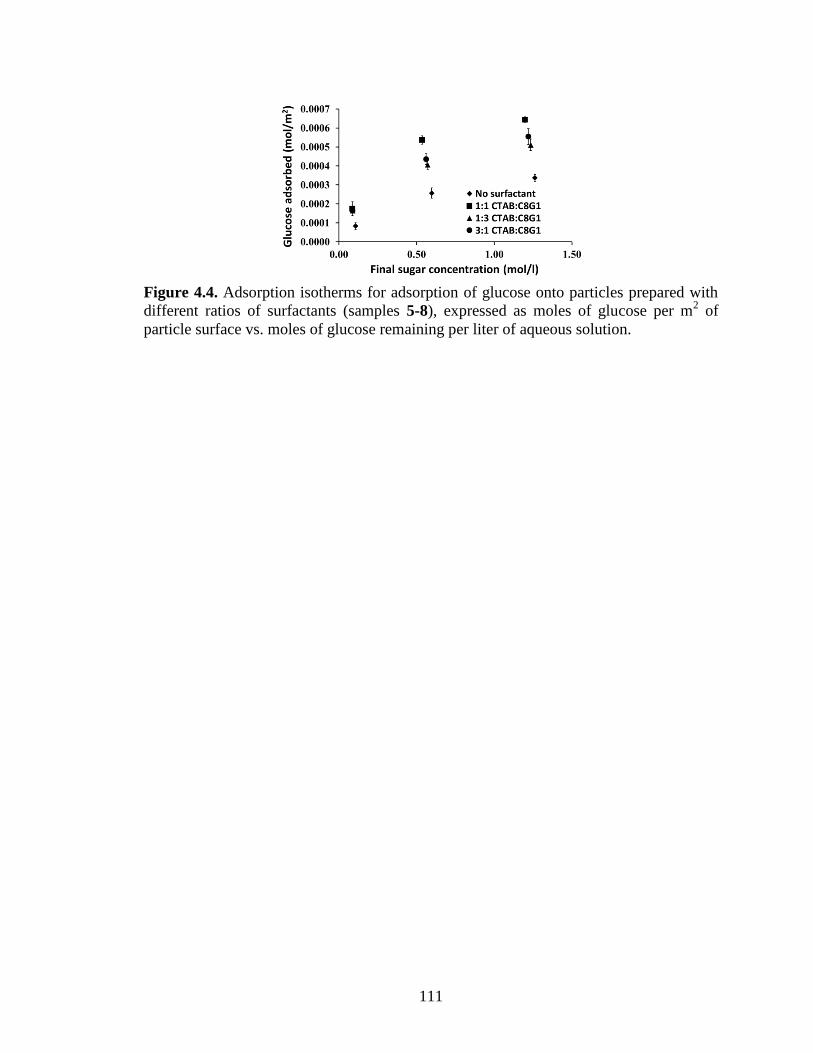
111
Figure 4.4. Adsorption isotherms for adsorption of glucose onto particles prepared with
different ratios of surfactants (samples 5-8), expressed as moles of glucose per m2 of
particle surface vs. moles of glucose remaining per liter of aqueous solution.

112
Figure 4.5. FTIR absorbance curves for unwashed Stöber particles in KBr pellets. All
samples (numbers 8-12) were imprinted with a 1:1 mixture of CTAB and C8G1 by
addition of the surfactant at the indicated times after addition of TEOS. The CH2
stretching bands between 2800 and 3000 cm-1
indicate surfactant incorporation in the
particles.

113
Figure 4.6. Moles of sugar adsorbed per area as a function of the time of addition of
surfactant during the particle synthesis (for samples 8-12). Results are shown for three
different initial glucose concentrations, indicated in the legend. The rightmost set of
points is for sample 5, prepared without any surfactant added.
0.139 mol/L 0.694 mol/L 1.39 mol/L

114
Figure 4.7 FTIR absorbance spectra for 1:1 CTAB / C8X1 imprinted Stöber particles
(sample 13) before and after washing to remove the template. The siloxane stretching
band is visible between 1000 and 1300 cm-1
, and the CH2 stretching band (indicating the
presence of surfactants) is visible between 2800 and 3000 cm-1
in the unwashed sample.

115
Figure 4.8. Adsorption isotherms for xylose and glucose on comparable particles
imprinted with a 1:1 mixture of C8X1 and CTAB (sample 13) or prepared without
surfactant (non-imprinted, sample 14).

116
Scheme Error! No text of specified style in document.-1 . Synthesis procedure for Stöber
particles and schematic of the proposed surfactant-based molecular imprinting
mechanism.
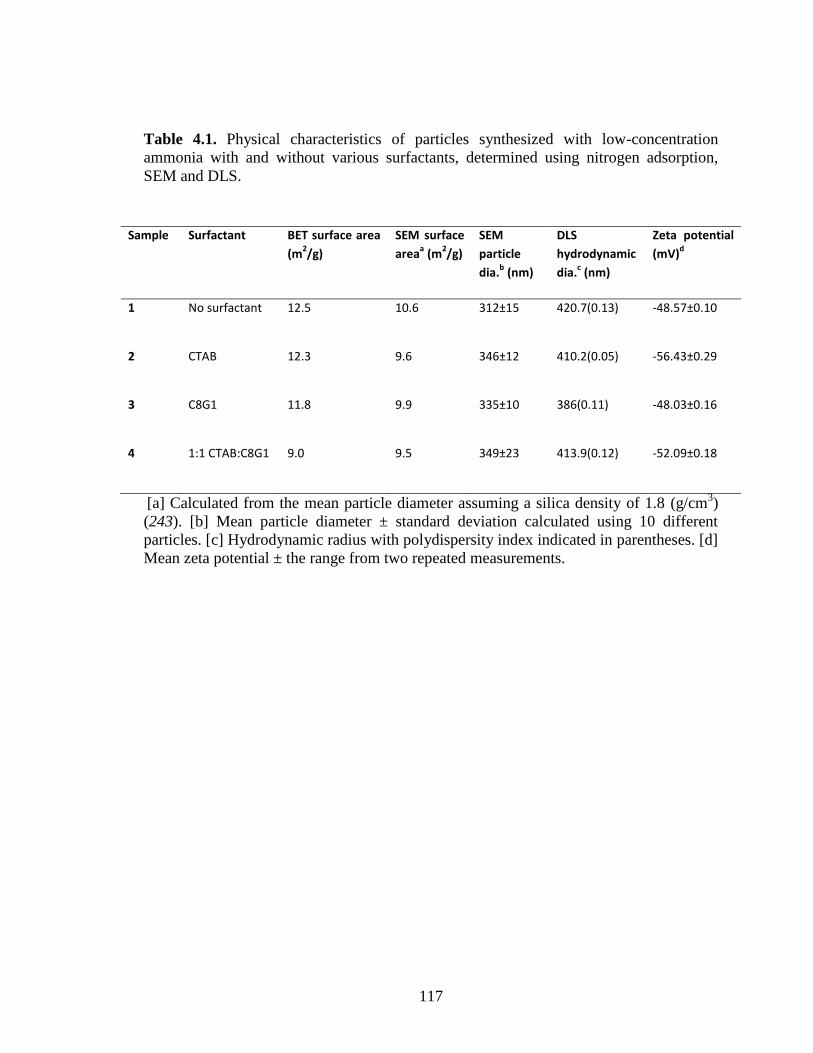
117
Table 4.1. Physical characteristics of particles synthesized with low-concentration
ammonia with and without various surfactants, determined using nitrogen adsorption,
SEM and DLS.
Sample Surfactant BET surface area
(m2/g)
SEM surface
areaa (m
2/g)
SEM
particle
dia.b (nm)
DLS
hydrodynamic
dia.c (nm)
Zeta potential
(mV)d
1 No surfactant 12.5 10.6 312±15 420.7(0.13) -48.57±0.10
2 CTAB 12.3 9.6 346±12 410.2(0.05) -56.43±0.29
3 C8G1 11.8 9.9 335±10 386(0.11) -48.03±0.16
4 1:1 CTAB:C8G1 9.0 9.5 349±23 413.9(0.12) -52.09±0.18
[a] Calculated from the mean particle diameter assuming a silica density of 1.8 (g/cm3)
(243). [b] Mean particle diameter ± standard deviation calculated using 10 different
particles. [c] Hydrodynamic radius with polydispersity index indicated in parentheses. [d]
Mean zeta potential ± the range from two repeated measurements.
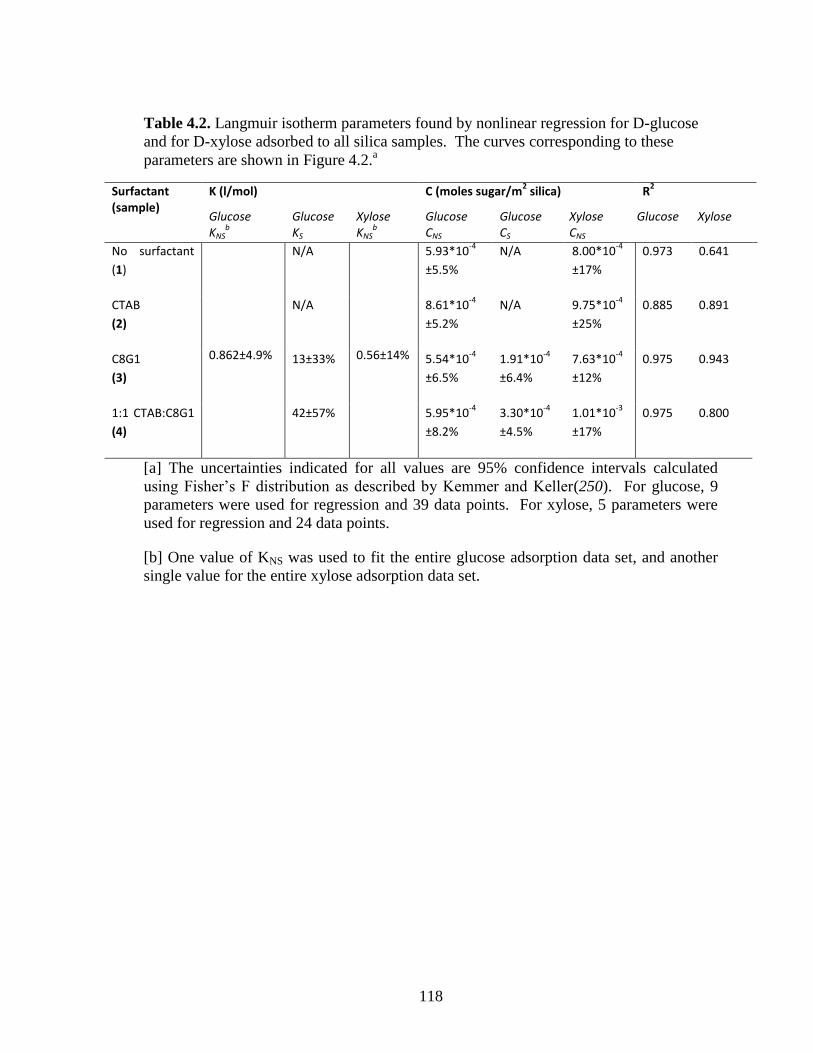
118
Table 4.2. Langmuir isotherm parameters found by nonlinear regression for D-glucose
and for D-xylose adsorbed to all silica samples. The curves corresponding to these
parameters are shown in Figure 4.2.a
Surfactant (sample)
K (l/mol) C (moles sugar/m2 silica) R
2
Glucose KNS
b
Glucose KS
Xylose KNS
b
Glucose CNS
Glucose CS
Xylose CNS
Glucose Xylose
No surfactant
(1)
0.862±4.9%
N/A
0.56±14%
5.93*10-4
±5.5%
N/A 8.00*10-4
±17%
0.973 0.641
CTAB
(2)
N/A 8.61*10-4
±5.2%
N/A 9.75*10-4
±25%
0.885 0.891
C8G1
(3)
13±33% 5.54*10-4
±6.5%
1.91*10-4
±6.4%
7.63*10-4
±12%
0.975 0.943
1:1 CTAB:C8G1
(4)
42±57% 5.95*10-4
±8.2%
3.30*10-4
±4.5%
1.01*10-3
±17%
0.975 0.800
[a] The uncertainties indicated for all values are 95% confidence intervals calculated
using Fisher’s F distribution as described by Kemmer and Keller(250). For glucose, 9
parameters were used for regression and 39 data points. For xylose, 5 parameters were
used for regression and 24 data points.
[b] One value of KNS was used to fit the entire glucose adsorption data set, and another
single value for the entire xylose adsorption data set.

119
Table 4.3. Synthesis conditions for particles prepared with fresh, saturated ammonia and
varying ratios of surfactants, time of surfactant addition and temperature, and their
physical characteristics determined using nitrogen adsorption, SEM and DLS.
Sample Surfactant Temperature Time of
addition
BET surface
area (m2/g)
SEM
surface
areaa (m
2/g)
Zeta potential
(mV)
5 No surfactant RT n/a 7.47 5.4 -47.49±0.39
6 5 mg CTAB,
15 mg C8G1 RT 1 min 5.97 6.2 -51.71±0.36
7
15 mg
CTAB, 5 mg
C8G1
RT 1 min 6.05 5.9 -55.83±0.48
8
10 mg
CTAB, 10
mg C8G1
RT 1 min 5.87 6.1 -51.87±0.36
9
10 mg
CTAB, 10
mg C8G1
RT 2.5 min 5.92 6.1 -54.50±0.53
10
10 mg
CTAB, 10
mg C8G1
RT 5 min 5.94 5.9 -50.26±0.75
11
10 mg
CTAB, 10
mg C8G1
RT 1 h 6.48 6.1 -47.42±0.81
12
10 mg
CTAB, 10
mg C8G1
RT 4 h 5.85 6.1 -48.00±0.30
13 No surfactant 50 ˚C 50 s 9.4 9.1 -37.57±0.47
14
10 mg
CTAB, 10
mg C8X1
50 ˚C 50 s 8.7 10.3 -41.81±0.98
[a] Calculated from the mean particle diameter assuming a silica density of (1.8 g/cm3) (243).
Copyright © Suvid Joshi 2014
120
CHAPTER FIVE
5. IMPRINTING OF STÖBER PARTICLES TO TARGET
MONOSACCHARIDES AND DISACCHARIDES FOR APPLICATION IN
CHIRAL SEPARATION
5.1 Summary
A simple, inexpensive and tunable imprinting technique to produce nonporous
particles for chiral adsorption of saccharides has been developed. It is based on adding
sugar-based surfactants early in the Stöber silica particle synthesis process (around 1
minute after silica precursor addition) to create molecularly imprinted sites on the surface
of silica particles which are sensitive to the chirality of carbohydrate adsorbates.
Mixtures of hexadecyltrimethylammonium bromide (CTAB) and n-octyl-β-D-
glucopyranoside (C8G1) or n-dodecyl-β-D-maltopyranoside (C12G2) are employed to
target adsorption of D-glucose or D-maltose, respectively. It is observed that the
adsorption of D-glucose on these imprinted materials is enhanced when compared to
adsorption of other hexoses like D-mannose and D-galactose which differ by a change at
only one chiral center (by approximately 1.5 times) and even more (>3 times) when
compared to the enantiomer L-glucose. Materials imprinted to target D-maltose showed
nearly 5 times enhancement in adsorption of D-maltose over cellobiose at the lowest
tested concentration. This is significant because both of these saccharides are dimers of
D-glucose that differ only in the linkage between the saccharides. Thus, this study shows
that a straightforward molecular imprinting approach of the surface of freshly prepared,
soft silica particles can yield particles that exhibit preferential adsorption for a chiral
target over similar molecules differing by one or more chiral centers, or by the anomeric
attachment between polysaccharides.
121
5.2 Introduction
Many examples are available in the literature reporting the synthesis of molecularly
imprinted silica materials for applications like catalysis, sensing and separations(18, 80,
251-254). Although such materials have been successfully synthesized for a long time,
the methods used for imprinting, such as covalent imprinting(81, 255, 256) and
microemulsion-based approaches(105, 107, 257, 258), are complex and sometimes
require extensive techniques for template removal. In this paper we utilize a simple
technique recently discovered in our group to non-covalently imprint silica particles. The
hypothesis underlying the approach is that adding a surfactant with a head group similar
to the target molecule early in the Stöber silica particle synthesis(22) (when the particles
have just precipitated) will imprint the silica surface with sites selective towards the
target molecule.
The Stöber process is a well-known method to synthesize monodisperse spherical
silica particles by precipitation in basic medium(22). Several mechanisms have been
proposed for the synthesis process, initially based on nucleation and growth(204) and
later including controlled aggregation.(205),(206) TEM investigations of the formation
of Stöber particles and surfactant-templated mesoporous particles suggest that uniformly
sized, soft droplets / particles of silica precursors form by aggregation shortly after the
onset of turbidity in these solutions, and subsequently react to form solid
nanoparticles.(151, 207, 259) Primary particles < 10 nm in diameter have also been
observed by several techniques in Stöber particle and zeolite synthesis solutions(209-
211), and have properties consistent with either low-crosslink density polymers(207, 209)
or micellar aggregates(210, 212-215) rather than fully condensed particles. This suggests
that shortly after they form, the particles are susceptible to modification by non-covalent

122
interactions at their surface. As the particles age and become more rigid, they would be
expected to be less amenable to imprinting. In Chapter 4, imprinting of Stöber particles
has been demonstrated for selectivity towards targeted sugars with different molecular
weights, but selectivity towards sugars with the same molecular weights (chiral
separations) has not been demonstrated yet.
Chiral separations are of immense importance(260) in biochemistry and in the
pharmaceutical industry due to significant differences in activity of enantiomeric pairs of
active ingredients. This is especially important because there are multiple examples
where one enantiomer displays desired pharmacological activity while the other
enantiomer is toxic.(261) Chiral separations have broader applications in determining
food quality(262), and in determining enantiomeric excess in applications such as
archaeology(263) and astronomy(264). Several reviews have been published detailing
methods currently available for separation of enantiomers using techniques including
capillary electrophoresis, capillary chromatography, gas chromatography, and nano-
liquid chromatography.(261, 265-267) While all of these techniques have been
successfully utilized for separations, none of these techniques directly targets differences
in the 3D structure of the molecules to be separated. Molecular imprinting can potentially
be used to more directly target structural differences to bind specific chiral molecules.
Molecular imprinting is an established technique for targeting specific molecules in
applications requiring a high degree of specificity(18, 82, 268, 269). Molecular
imprinting has been demonstrated on various materials including carbon, molecular
sieves, polymers and silica surfaces(16-19, 80, 228, 270). Silica molecular imprinting
was one of the first systems explored for molecular imprinting by Dickey,(222, 223),

123
although Haldeman and Emmett(86) questioned whether incomplete template removal
was responsible for the enhanced adsorption of the target. Since then, both covalent and
non-covalent imprinting have been conclusively demonstrated on silica.(16, 80) While
covalent imprinting provides more control over the arrangement of functional groups
(since they are initially bound to the template), non-covalent imprinting is a viable
approach based on weak forces between a template and complementary materials
precursor, which is widely used due to its simplicity. A comparison of both approaches to
imprinting has been unable to conclusively prove if one of the techniques is better.(16,
271) For chiral recognition, molecular imprinting has been recognized for some time as a
potential low-cost, high selectivity method to create separation media,(260) although
heterogeneity of binding sites may provide some limitations(272).
Various reviews have summarized the use of molecular imprinting for chiral
separations(18, 82, 269, 270, 273). Most of the existing work on molecular imprinting
for chiral separation employs organic polymers; only a few reports on imprinting of
inorganic materials are available, and they focus on amino acid separations(274-277).
Paik et al(275) synthesized chiral mesoporous silica (CMS) using the approach of Che et
al.(278) with a chiral block copolymer (CBC) containing poly(L-glutamic acid). They
reported that CMS imprinted with L-CBC adsorbed 5 times as much L-valine compared
to D-valine. Yokoi et al(276) synthesized chiral mesoporous silica using molecular
imprinting and reported targeted asymmetric separation of L-N-trifluoroacetylalanine
ethyl ester (CF3CO-Ala-OEt) from a racemic mixture. Silica materials have also been
functionalized for chiral separations. Teicoplanin grafting(279) on the surface of
magnetic silica nanoparticles was used to separate five different racemates, and
124
functionalization with oligosaccharides was used to form mesoporous SBA-15 silica that
demonstrates enantioselective adsorption(280). Chiral catalysis on imprinted nonporous
silica particles was observed by Markowitz et al(105). They observed that particles
imprinted with N-α-decyl- L-phenylalanine-2-aminopyridine displayed a rate of
hydrolysis of D-BAPNA 39 times higher than L-BAPNA. It was suggested that
molecular structure of the substrates affected the packing at molecularly imprinted sites,
causing the difference in rates.
In carbohydrates, chiral variations play rich and complex roles in their structure and
function. Not only are there multiple chiral centers present in (poly)saccharides, but also
variation in the anomeric form of linkages that are utilized for signaling and molecular
recognition.(281) Separation of hexoses without imprinting has been demonstrated in the
past using both cation and anion exchange resins(282-285). Khym and Zill(284)
demonstrated enhanced separation of various hexoses and pentoses on borate modified
anion exchange resins. Hydrophilic interaction liquid chromatography, where a
hydrophilic stationary phase is used with organic mobile phase followed by elution with
water, has also been demonstrated to be successful in separation of monosaccharides,
disaccharides and oligosaccharides(286-288). These techniques succeed because of
differences in the arrangement of functional groups on the saccharides, but they are not
designed to target specific sugars. Non-covalent molecular imprinting is a viable
approach to molecular recognition of saccharides that has been demonstrated with several
organic polymer systems(289-301). Non-covalent imprinting of metal oxides for chiral
separation of saccharides is a newer approach.

125
Imprinting of metal oxide surfaces for saccharides has been reported rarely, but
should have advantages related to their chemical, thermal and mechanical
robustness.(252) Yang et al. reported the preparation of sol-gel titania imprinted with D-
glucose coatings on mercaptoethanol modified QCM electrode for sensing of D-
glucose(302). The imprinted thin films had higher adsorption of D-glucose over D-
fructose, D-galactose and D-mannose, and FTIR was used for qualitative assessment of
adsorption and desorption of D-glucose over multiple cycles. Despite the success of this
approach, the imprinting of oxides such as silica for chiral separation of monosaccharides
and disaccharides has not yet been reported. This work will demonstrate a flexible
technique to synthesize tunable molecularly imprinted nonporous silica particles with
uniform size and shape (advantageous for packing in columns) which are imprinted with
surfactant mixtures for chiral selectivity towards imprinted carbohydrate targets.
Here, a new direction is presented for direct molecular imprinting of Stöber particle
surfaces for chirally resolved adsorption of saccharides. It will be demonstrated that
adding the surfactant at the time of precipitation of Stöber particles from reaction mixture
leads to chirally selective adsorption sites. Specifically, D-glucose will be targeted using
the template n-octyl--D-glucopyranoside (C8G1), and adsorption of D-glucose onto
these materials will be compared to D-mannose, D-galactose (both of which differ by
only one chiral center) and L-glucose (which is the enantiomer of D-glucose). It will also
be shown that the imprinting technique used here is versatile by using the same approach
to imprint for D-maltose using n-dodecyl-β-D-maltopyranoside. The effect of the
chirality of the anomeric linkage in disaccharides of D-glucose is tested, by comparing
the adsorption of D-maltose (which has an -1,4-glycosidic linkage) and D-cellobiose

126
(which has a -1,4-glycosidic linkage). This work will not only provide further evidence
that molecular imprinting of soft Stöber particles can occur by the hypothesized
mechanism, but will also demonstrate that chirally preferential adsorption can be
achieved in the resulting materials.
5.3 Materials and methods
5.3.1 Materials
Cetyltrimethylammonium bromide (CTAB) (99.9%), D-maltose monohydrate
(>99%), cellobiose (>99%) and deionized ultrafiltered (DIUF) water were purchased
from Fisher Scientific; tetraethyl orthosilicate (TEOS), concentrated 29.8% w/v
ammonium hydroxide, D-mannose (99%), D-galactose(99%) and L-glucose(99%) from
Acros Organics; absolute ethanol from Deacon Labs; n-octyl-β-D-glucopyranoside
(C8G1, 99.9%) and n-dodecyl-β-D-maltopyranoside (C12G2, 99%) from Affymetrix;
and D-glucose (>99.5%) from Sigma. All chemicals were used as received without
further purification.
5.3.2. Particle synthesis
Particles were prepared by first mixing 58.2 g of ethanol, 9.8 ml of concentrated
ammonia and 10.8 g of DIUF water. The solution was stirred for fifteen minutes and 5.26
g of TEOS was added under vigorous stirring. All particle solutions were stirred for 24
hours to allow for solidification of the silica. Particles imprinted for D-glucose were
prepared by following the same particle synthesis procedure but adding a solid mixture of
10 mg CTAB and 10 mg C8G1 exactly one minute after the addition of TEOS (at which
point the solutions were already turbid due to particle precipitation). To imprint for D-
maltose, a solution containing 10 mg CTAB and 10 mg C12G2 was prepared in 2 ml
ethanol to compensate for slower dissolution of C12G2. This solution was then added 1

127
minute after addition of TEOS. The volume of ethanol used for synthesis sol preparation
was adjusted to account for this volume (i.e. 56.6 g of ethanol were used rather than 58.2
g). The surfactant amounts were calculated based on the surface area of the non-
imprinted particles and were sufficient to form a theoretical monolayer on the particle
surface. In all cases, the mixture was stirred at room temperature for 24 hours before the
particles were recovered by centrifugation and aged in an oven at 50 °C for 24 h to allow
for additional solidification and interactions with surfactants to occur. All particles were
subsequently washed with ethanol to remove the surfactant from the silica surface
through three cycles of sonication and centrifugation. The particles were subsequently
washed several times with DIUF water using sonication and centrifugation until the pH
of the supernatant was found to be neutral using pH paper. The particles were finally
dried at 50 °C for 24 h to obtain clean particles.
5.3.3. Particle characterization
Nitrogen adsorption was performed using a Micromeritics Tristar 3000 instrument.
The particles were degassed prior to analysis under flowing nitrogen for 5 hours at 140
°C. Surface areas were determined using the multilayer adsorption isotherm of Brunauer,
Emmett and Teller (BET)(164). A Beckman Coulter Delsa Nano C particle size analyzer
was used to determine particle size and zeta potential in solution. Particles were dispersed
in DIUF water for DLS using a sonication bath until a uniform colloidal suspension was
obtained. Before analysis, suspensions were allowed to sit in a microcentrifuge tube for
30 minutes to allow settling of any aggregates that were present. A Hitachi S-4300
scanning electron microscope (SEM) was used to visualize the particles. The samples
were prepared by dispersing a small amount of particles in ethanol by sonication and

128
placing few drops of suspension onto carbon tape placed on a sample holder. The
samples were dried in a fume hood and excess particles were blown off using pressurized
air. Particles were coated with a conductive layer before analysis. FTIR sspectra of the
solid samples were also recorded using a ThermoElectron Nexus 470 instrument for
samples pressed into KBr pellets at an approximate concentration of 1 wt%.
5.3.4. Saccharide Adsorption Measurements
The washed, dried particles were used to measure the adsorption of hexoses from
aqueous solutions onto particles imprinted for D-glucose and non-imprinted particles,
while adsorption of disaccharides from aqueous solution was measured on particles
imprinted for D-maltose. The initial concentrations of the saccharide solutions ranged
from 0.14 mol/L to 1.4 mol/L for hexoses while D-maltose solutions ranged from 0.073
mol/L to 0.73 mol/L and D-cellobiose solutions from 0.073 mol/L to 0.365 mol/L due to
limited solubility at room temperature. For each adsorption measurement, 50 mg of
particles was suspended in 1 mL of DIUF water and stirred for 24 h in a 5 mL vial to wet
the particles. The wetted particles were then centrifuged and the particles were
transferred to the original vials along with 1 ml of a saccharide solution of known
concentration. The solutions were stirred vigorously for 24 h at room temperature,
centrifuged, and the supernatant was analyzed to determine the final saccharide
concentration.
5.3.5. Saccharide Analysis
Calibration curves were prepared using standard saccharide solutions. Concentration
was quantified using attenuated total reflection (ATR) FTIR analysis of the solutions with
concentrations from 0.14 mol/L to 1.66 mol/L in a horizontal trough ATR accessory
129
(from Pike Technologies) with a ZnSe ATR element. The spectrum of pure DIUF water
was subtracted from each spectrum prior to analysis and the area under the curve from
900 to 1200 cm-1
was used to quantify the concentration of each saccharide. Linear
calibration curves (Appendix C Figures C.1 and C.2) were obtained for all hexoses used
in the study as well as the disaccharides. High R2 values (at least 0.994) were obtained
for all of the calibration curves. To determine the amount adsorbed, the concentrations of
saccharide in the supernatants after adsorption as measured by ATR-FTIR were
subtracted from the measured initial concentration and the amount of saccharide per mass
of adsorbent was determined by a material balance. Adsorption measurements were
performed in triplicate to determine the mean and standard deviation values for all
measurements.
5.4 Results and Discussion
The first set of experiments performed as part of this study were based on imprinting
using a 1:1 mixture of CTAB and C8G1. The objective is to determine whether
imprinting with the -D-glucopyranoside headgroup leads to enhanced adsorption of D-
glucose in comparison to related hexoses, whose 3-D structures are illustrated in Figure
5.1. As Fig. 5.1a illustrates, D-glucose has a relatively flat conformation, with all of the
hydroxyl groups arranged equatorially around the pyranose ring. Making one chiral
change, either at the 4-carbon (in D-galactose, Fig. 1b) or the 2-carbon (in D-mannose,
Fig. 1d) moves that hydroxyl group out of the equatorial position to point axially, which
is a subtle but potentially significant difference. Changing all of the chiral centers in the
enantiomer L-glucose (Fig. 1c) leads to a large change in the 3D structure, where the
hydroxyl groups are split axially between the two sides of the pyranose ring. These

130
differences in structure due to changes in chiral centers are hypothesized to lead to
preferential adsorption in the D-glucose imprinted silica materials.
Prior to saccharide adsorption measurements, nitrogen adsorption, SEM and dynamic
light scattering were performed on the imprinted (prepared with 1:1 CTAB/C8G1) and
non-imprinted (prepared without surfactant) samples used for hexose adsorption. The
surface areas of the non-imprinted and imprinted particles were comparable (7.9 m2/g and
8.1 m2/g, respectively). Nitrogen adsorption isotherms for both particles (Appendix C
Figure C.3) indicate no porosity. The average particle sizes in the SEM images (Figure
5.2) are also comparable (456 nm for non-imprinted and 464 nm for imprinted particles).
The surface areas estimated based on the SEM diameter of the particles averaged over at
least 20 particles and the density of silica (1.8 g/cm3) were similar to (but systematically
smaller than) the BET surface areas. The imprinted particles had a somewhat more
negative zeta potential (-51.7 mV) compared to materials which were prepared without
imprinting (-48.1 mV). This may be because of the presence of a larger density of
hydroxyl groups on the silica particle surface due to interaction with ionic surfactants
used for imprinting. The physical characteristics of the particles are summarized in Table
1. The overall similarity in characteristics of the particles is consistent with the
surfactants interacting only with the surface of the particles, without significantly
changing their physical characteristics or introducing porosity.
FTIR spectra (Figure 5.3) for imprinted and non-imprinted particles pressed in KBr
pellets were measured before washing to confirm the incorporation of surfactants, and
after washing to confirm their removal by the washing process. Complete removal of
templates after the imprinting process is essential to avoid their influence on subsequent

131
adsorption experiments. Before washing, CH2 stretching bands are clearly present
between 2800 and 3000 cm-1
, indicating that surfactants are incorporated at the particle
surface during synthesis. After washing, these peaks are completely absent, which shows
that the washing procedure effectively removes the adsorbed surfactant from the surface
of the particles. FTIR spectra in the range from 800 to 1600 cm-1
(the right-hand side of
Fig. 3) show mainly Si-O-Si stretching bands from 1000 to 1200 cm-1
and a Si-OH band
near 960 cm-1
. The peaks are similar before and after washing, suggesting that the
particles are stable during washing.
Liquid-phase adsorption experiments were performed to compare the preferential
adsorption of D-glucose (the target saccharide); D-mannose and D-galactose (both
differing by one chiral center); and L-glucose (the enantiomer of D-glucose). The
structural differences in the 3D structure of this series of molecules (Fig. 5.1) provides an
excellent opportunity to observe how preferential is the molecular imprinting by C8G1 at
the Stöber particle surface. The small structural differences of D-mannose and D-
galactose compared with D-glucose are expected to be a sensitive test of preferential
adsorption. Figure 5.4 presents adsorption results for each of the saccharides from
aqueous solution onto imprinted and non-imprinted particles. The D-glucose adsorption
results are included in each figure so that a consistent comparison can be made among the
saccharides. Fig. 5.4A compares the adsorption of D-glucose and L-glucose. The
adsorption of L-glucose on both imprinted and non-imprinted surfaces is less than the
adsorption of D-glucose on the non-imprinted silica surface. This is not surprising given
that all 5 hydroxyl groups of D-glucose are oriented equatorially (and thus might allow
for multiple interactions with the silica surface and with other D-glucose molecules)
132
while the hydroxyls are split on two sides of the molecule in L-glucose (see Fig. 5.1).
While the amount of L-glucose on the imprinted particles is identical to what was
observed on non-imprinted particles, significantly more D-glucose adsorption is observed
on imprinted particles (roughly twice the amount observed on non-imprinted particles at
high concentration). The results show that molecular imprinting using a surfactant
derived from D-glucose has a clear and significant effect on the adsorption of D-glucose,
but that the enhanced adsorption is highly preferential towards D-glucose compared to its
enantiomer. The largest enhancement of D-glucose adsorption compared to L-glucose
was roughly 5 times and it was observed at the lowest initial concentration of 0.14 mol/L.
The ratios of D-glucose adsorption over other hexose studied here are documented in
supplemental information Table C.1.
A comparison is made to sugars with smaller chiral differences from D-glucose in
Figs. 5.4B and 5.4C. Both D-galactose and D-mannose show a slight decrease in
adsorption to the non-imprinted silica surface compared with D-glucose, but not as
dramatic a difference as L-glucose (Fig. 5.4A). The slight decrease is most likely
because one hydroxyl group in each of the sugars is oriented axially (Figs. 5.1b and
5.1d), thus reducing the number of hydroxyl groups available for simultaneous hydrogen
bonding with silica. Also, because the structural differences are subtle, both D-galactose
(Fig. 5.4B) and D-mannose (Fig. 5.4C) show some enhancement in adsorption on the
imprinted particles. However, the amount adsorbed for the middle and highest saccharide
concentrations (0.69 and 1.4 mol/L) are roughly the same for D-galactose and D-
mannose, while adsorption continues to increase for D-glucose. Overall, the adsorption
results in Fig. 5.4 suggest that molecularly imprinted materials which target D-glucose

133
show preferential adsorption for D-glucose over the closely related hexose sugars D-
galactose and D-mannose. This suggests that the D-glucose imprinted particles may have
a larger adsorption capacity for D-glucose than for saccharides with one differing chiral
center. However, because the structural changes induced by changing one chiral center
are small, the preference is less pronounced than what was observed when comparing D-
glucose and L-glucose. It was observed that the enhancement in absorption of D-glucose
was close to 1.5 times when compared to D-galactose or D-mannose. No specific trend in
the enhanced selectivity was observed with increasing initial concentration of sugars in
the solution. This shows the potential power of this molecular imprinting strategy to
prepare materials selective towards one of several related chiral compounds.
As an additional test of the ability of this imprinting strategy to make chiral
distinctions in adsorption of saccharides, a pair of di-hexose sugars with identical
building blocks (D-glucose) and 1-4 linkages were selected, that differ in the chirality of
the point of attachment. These are -D-glucopyranosyl (1→4) D-glucopyranose
(maltose) and -D-glucopyranosyl (1→4) D-glucopyranose (cellobiose). Figure 5.5
highlights the 3D structural differences that the linker induces by showing structures
where the left D-glucopyranose units are aligned in roughly the same orientation. The
two D-glucopyranose units of cellobiose (Fig. 5.5b) are found in about the same plane,
but with one twisted relative to the other. In maltose (Fig. 5.5b), the D-glucopyranose
units are twisted in the opposite direction, and the (1→4) linkage causes a bend in the
molecule so that monomers do not lie in the same plane. These conformation are
consistent with recent molecular dynamics simulations that show that disaccharides,
while flexible, have a narrow range of configurations that they tend to explore(303).

134
Because of the structural differences between these two, it is hypothesized that molecular
imprinting with a surfactant with a D-maltose headgroup should lead to preferential
adsorption of only D-maltose.
Before discussing the disaccharide adsorption, we again discuss the characteristics of
the particles. Nitrogen adsorption (Appendix C Figure C.3) showed that the particles
imprinted with a 1:1 mixture of CTAB and C12G2 had a surface area (7.1 m2/g)
comparable to non-imprinted particles (Table 5.1). SEM images of the CTAB/C12G2
imprinted particles (Figure 5.6) shows that they are highly monodisperse and spherical in
nature and have particles averaging 510 nm in diameter (averaged for 21 particles),
comparable to the non-imprinted and CTAB/C8G1 imprinted particles. FTIR spectra for
CTAB/C12G2 imprinted particles (Figure 5.7) show that, like the CTAB/C8G1 imprinted
particles, CH2 stretching bands are present in the unwashed materials, and that the
surfactant is completely removed by washing. The region of the spectra from 800 to 1200
cm-1
shows no significant change upon washing, consistent with stable CTAB/C12G2
imprinted particles.
When conducting adsorption experiments, it was necessary to limit the concentration
range of cellobiose due to its limited solubility in water at room temperature (~0.36
mol/L)(304). The adsorption of D-maltose and cellobiose onto both CTAB/C12G2
imprinted and non-imprinted particles is presented in Figure 5.8. As anticipated based on
a molecular imprinting mechanism, the D-maltose imprinted particles show enhanced
adsorption of D-maltose relative to non-imprinted particles. The greatest enhancement
was roughly twice the amount of D-maltose adsorbed on non-imprinted particles at a
solution concentration of 0.277 mol/L. On the other hand, cellobiose adsorption is about
135
the same as D-maltose on the non-imprinted particles, and enhanced only slightly (by at
most ~50% at 0.277 mol/L in solution). Thus, a similar preferential adsorption caused by
molecular imprinting is observed for the maltose / cellobiose pair as was observed for the
hexose series. At the lowest initial concentration studied (0.069 mol/L), the greatest
difference in adsorption of maltose and cellobiose can be seen for imprinted particles,
where almost 5 times as much maltose (2.9x10⁻⁴
mol/g) as cellobiose (6x10⁻⁵
mol/g) is
adsorbed. However, the difference is not as great at higher concentrations, where at
0.138 mol/L initial sugar concentration maltose to cellobiose adsorption ratio was 1.6 and
at 0.277 mol/L initial sugar concentration the ratio was 1.4. This would be consistent with
C12G2 creating a small set of adsorption sites that are selective towards D-maltose (and
that are saturated at low concentration) while nonselective binding occurs across the
range of saccharide concentrations. The difference in adsorption of D-maltose and
cellobiose suggests that, just like for hexoses, imprinting Stöber particles using the D-
maltose based surfactant C12G2 creates specific adsorption sites which lead to enhanced
adsorption of D-maltose.
One interesting observation about Fig. 5.8 compared to Fig. 5.4 is that the amount of
disaccharides adsorbed is much smaller than for the monosaccharides. One of the reason
for this is the size of the disaccharides – if they lay flat on the surface, they are expected
to occupy roughly twice the area of a monosaccharide (so the capacity should be roughly
half of what was observed for monosaccharides). This does not completely explain the
difference. The molecular area occupied by D-maltose was calculated from the amount
adsorbed at the highest initial concentration to be 0.265 nm2/molecule. Based on
molecular dynamics the surface area of maltose has been reported to be 0.651

136
nm2/molecule(305). The area per molecule at saturation is smaller than the surface area
of maltose, which suggests that multilayer adsorption of maltose occurs. The adsorption
may take place in cluster form as has been shown through molecular dynamics for
adsorption of glucose on solid surfaces(247). The observed difference between
monolayer capacity and theoretical area is much smaller for D-maltose compared to that
observed for D-glucose (Chapter 4), which may be caused by the ability of D-maltose to
form more hydrogen bonds due to polymerization in head group.
At the lowest concentration the selectivity towards adsorption of target molecule was
close to 5 times for both D-maltose (compared to cellobiose) and D-glucose (compared to
L-glucose). However at higher initial concentrations studied, because of the large number
of hydroxyl groups available for interaction with silica, the enhancement is not as great as
the difference observed between D-glucose and L-glucose (the largest difference in
adsorption found in this study). The 3D arrangement of hydroxyl groups in L-glucose
compared to D-glucose may also play an important role in such a large difference in
enhancement of adsorption.
5.5 Conclusion
This study has shown that molecular imprinting by a simple modification of the
Stöber silica synthesis process leads to chirally resolved preferential adsorption of target
saccharides. Silica particles imprinted with a 1:1 mixture by weight of CTAB with n-
octyl- -D-glucopyranoside (C8G1) or n-dodecyl--D-maltoside (C12G2) were
prepared. It was shown for both types of imprinted particles that the surfactants are
incorporated at the surface of the particles without inducing significant changes in the
structure, size or surface area of the particles. As expected based on the principle of
molecular imprinting of the surface of soft, freshly precipitated particles, the particles

137
imprinted with a CTAB/C8G1 mixture showed enhanced, preferential adsorption of D-
glucose. Some, but significantly less (nearly 1.5 times enhancement), enhanced
adsorption of D-mannose and D-galactose (which differ from D-glucose by only one
chiral center each) was observed on the CTAB/C8G1 imprinted particles. The greatest
enhancement in the adsorption of D-glucose compared to D-glucose (greater than 3 times
at all concentrations) was found in the CTAB/C8G1 imprinted particles, which is
consistent with the greater structural difference between L-glucose and D-glucose.
The technique of imprinting with a mixture of cationic surfactant and saccharide
surfactant was extended to a mixture of CTAB and C12G2 with a slight change in
synthesis procedure. The resultant particles showed enhancement in adsorption of D-
maltose compared to non-imprinted particles. The imprinted particles were also found to
preferential adsorption of D-maltose over cellobiose (nearly 5 times enhancement at
0.0069 mol/L initial saccharide concentration). This preferential adsorption is significant
because both molecules are disaccharides of D-glucose, but they differ in the chirality of
the 1,4 glycosidic linkage. This small change is enough to allow molecular imprinting
and preferential adsorption to occur.
By showing that this imprinting strategy can target saccharides based on subtle chiral
structural differences, this study suggests that “soft imprinting” of freshly precipitated
particles may be a general strategy to preparing selective adsorbents and chromatography
packings. The technique is inexpensive, simple and tunable to a desired target molecule.
The particles are nonporous and uniformly sized, which gives them beneficial flow
characteristics as packing materials for separations. The developed technique serves as a
first example in chirally targeted adsorption of chirally differentiated sugars through
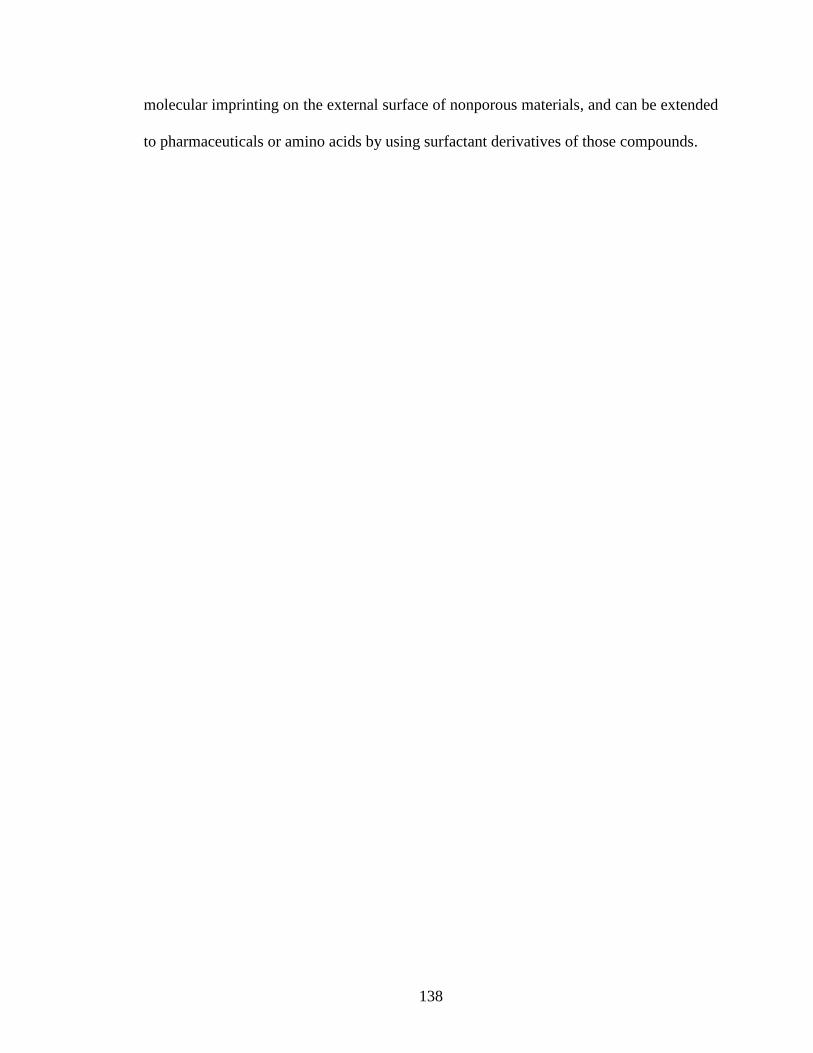
138
molecular imprinting on the external surface of nonporous materials, and can be extended
to pharmaceuticals or amino acids by using surfactant derivatives of those compounds.
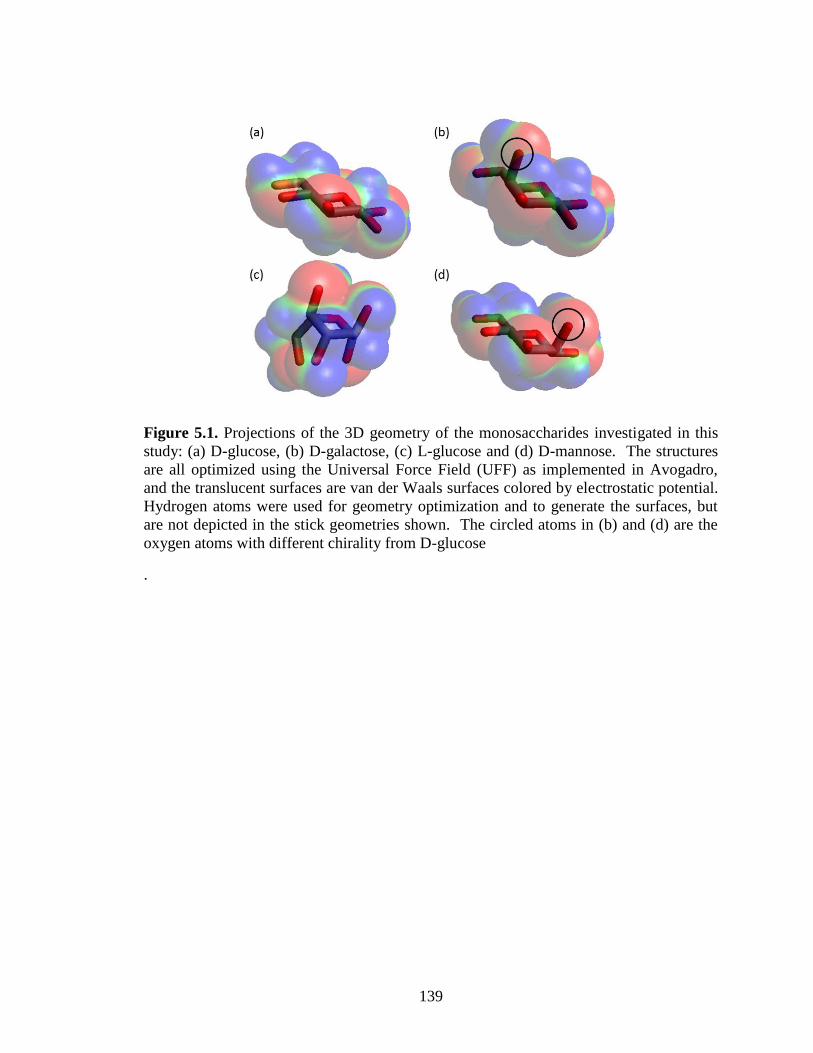
139
Figure 5.1. Projections of the 3D geometry of the monosaccharides investigated in this
study: (a) D-glucose, (b) D-galactose, (c) L-glucose and (d) D-mannose. The structures
are all optimized using the Universal Force Field (UFF) as implemented in Avogadro,
and the translucent surfaces are van der Waals surfaces colored by electrostatic potential.
Hydrogen atoms were used for geometry optimization and to generate the surfaces, but
are not depicted in the stick geometries shown. The circled atoms in (b) and (d) are the
oxygen atoms with different chirality from D-glucose
.

140
Figure 5.2. SEM images after washing and drying of particles made A) without addition
of surfactants and B) particles prepared with addition of 1:1 mixture of CTAB and C8G1.
Figure 5.3. FTIR spectra of Stöber particles in KBr pellets. (a) Washed non-imprinted
Stöber particles, (a’) As synthesized Stöber particles without surfactant addition, (b)
Washed Stöber particles imprinted with 1:1 CTAB/C8G1 mixture, (b’) As synthesized
Stöber particles imprinted with 1:1 CTAB/C8G1 mixture by adding surfactant at 1
minute after TEOS addition.
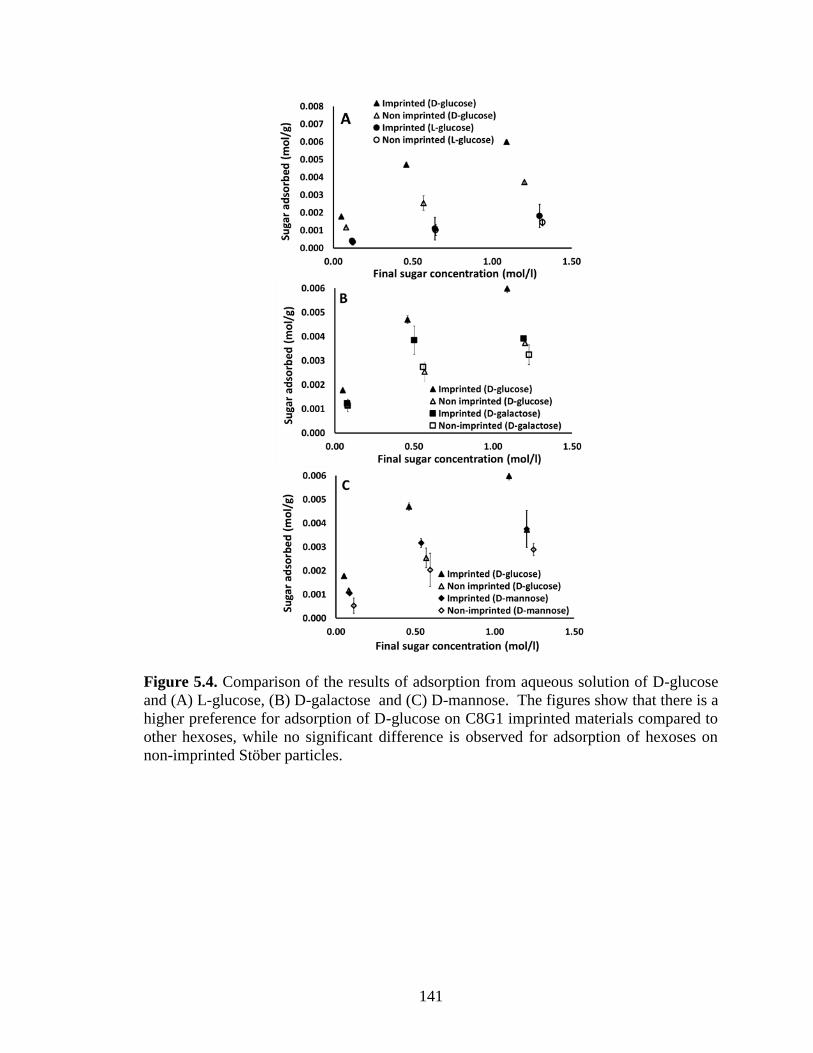
141
Figure 5.4. Comparison of the results of adsorption from aqueous solution of D-glucose
and (A) L-glucose, (B) D-galactose and (C) D-mannose. The figures show that there is a
higher preference for adsorption of D-glucose on C8G1 imprinted materials compared to
other hexoses, while no significant difference is observed for adsorption of hexoses on
non-imprinted Stöber particles.

142
Figure 5.5. 3D structures of (a) cellobiose and (b) maltose obtained by starting with the
experimental coordinates and performing geometry optimization with the UFF potential.
The translucent surfaces are van der Waals surfaces colored by electrostatic potential
using Avogadro. Note that the left glucopyranose units are oriented in roughly the same
way in both molecules.
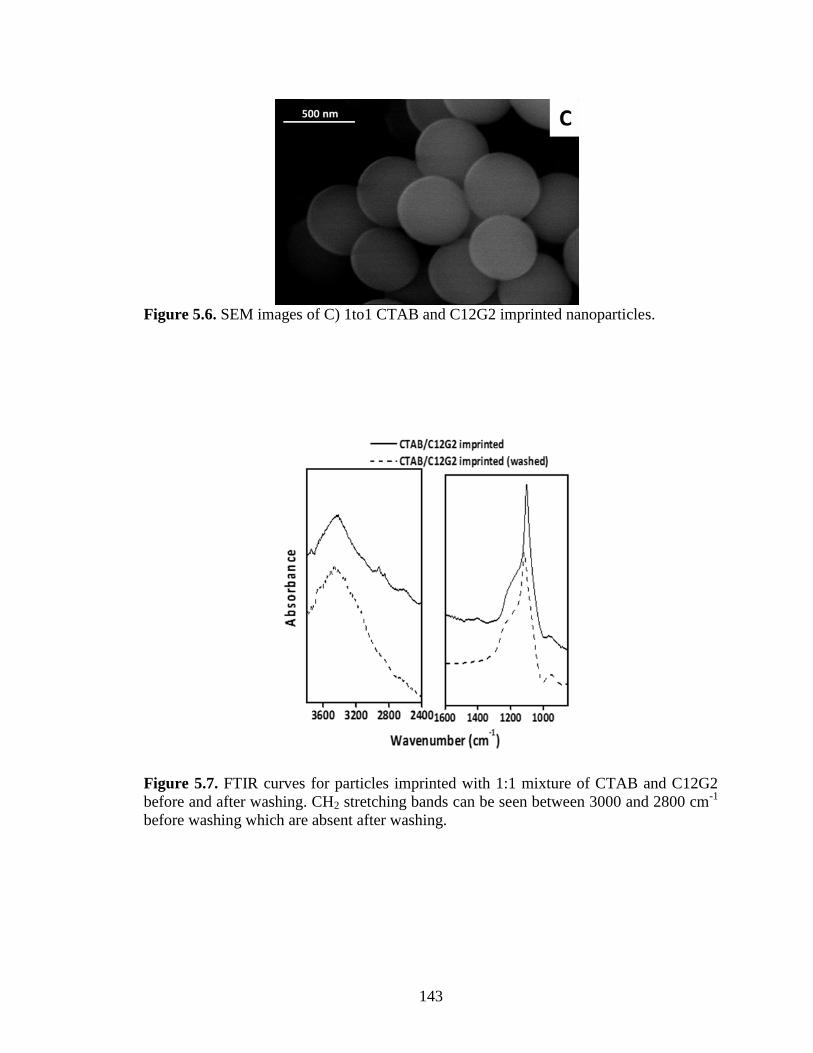
143
Figure 5.6. SEM images of C) 1to1 CTAB and C12G2 imprinted nanoparticles.
Figure 5.7. FTIR curves for particles imprinted with 1:1 mixture of CTAB and C12G2
before and after washing. CH2 stretching bands can be seen between 3000 and 2800 cm-1
before washing which are absent after washing.
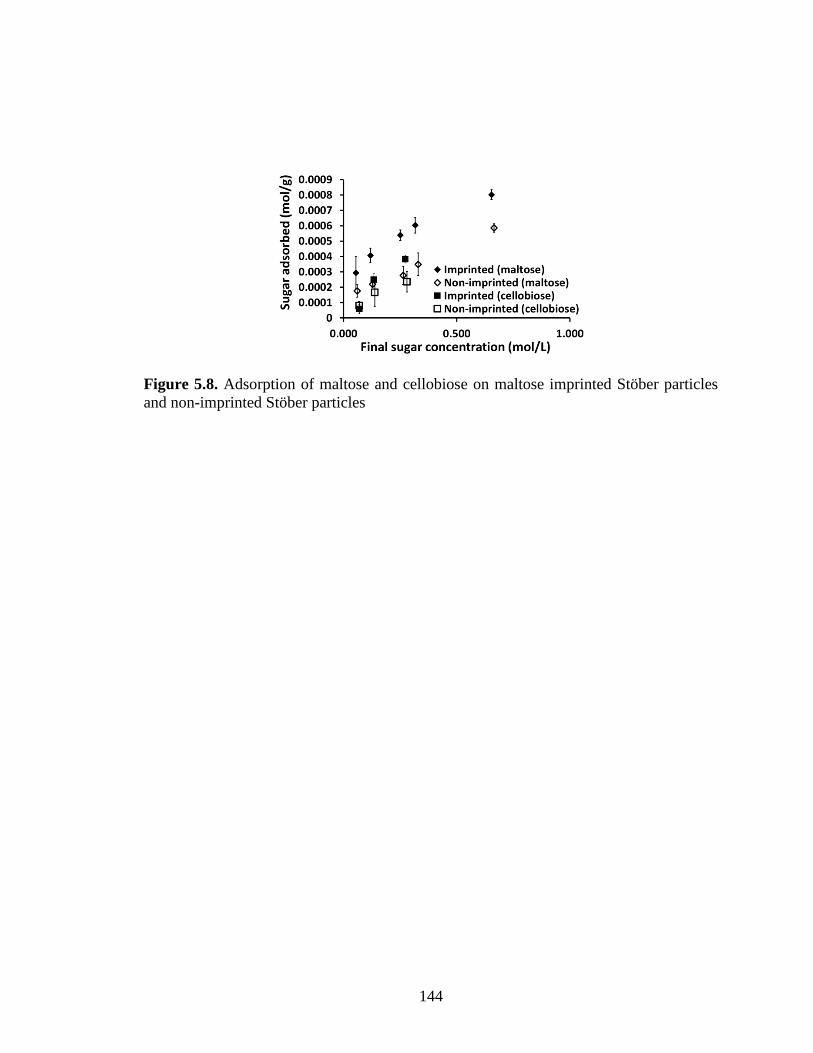
144
Figure 5.8. Adsorption of maltose and cellobiose on maltose imprinted Stöber particles
and non-imprinted Stöber particles
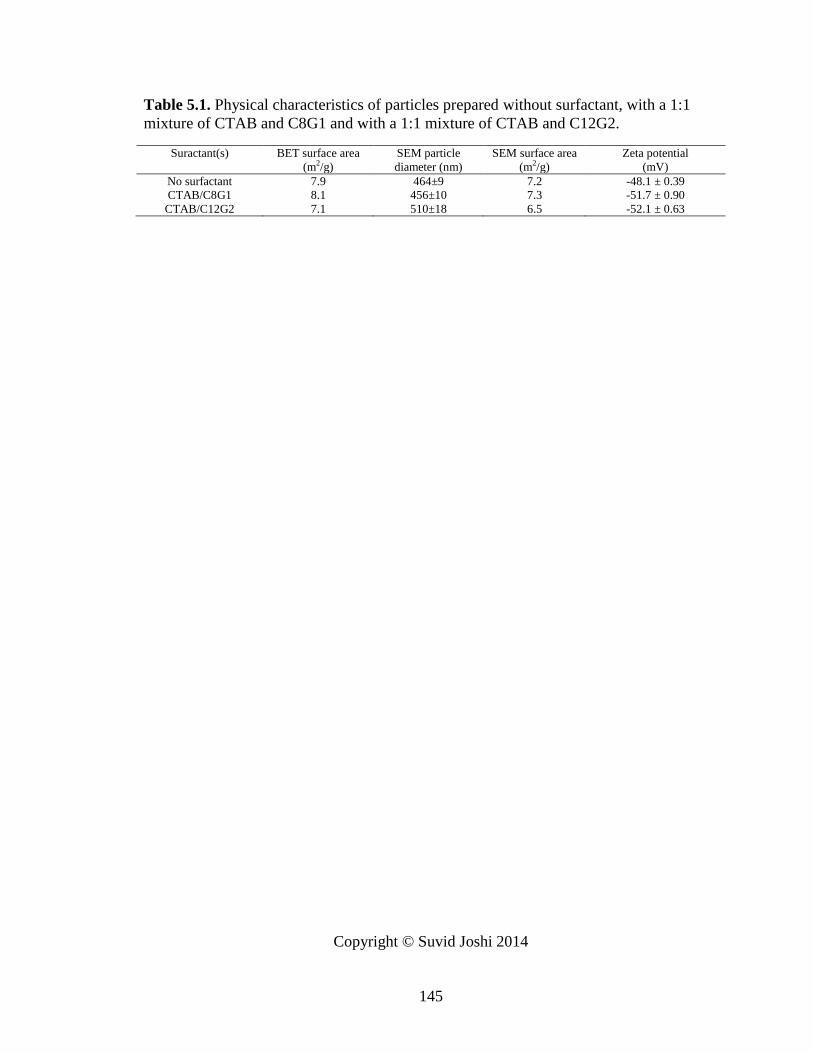
145
Table 5.1. Physical characteristics of particles prepared without surfactant, with a 1:1
mixture of CTAB and C8G1 and with a 1:1 mixture of CTAB and C12G2.
Suractant(s) BET surface area
(m2/g)
SEM particle
diameter (nm)
SEM surface area
(m2/g)
Zeta potential
(mV)
No surfactant 7.9 464±9 7.2 -48.1 ± 0.39
CTAB/C8G1 8.1 456±10 7.3 -51.7 ± 0.90
CTAB/C12G2 7.1 510±18 6.5 -52.1 ± 0.63
Copyright © Suvid Joshi 2014
146
CHAPTER SIX
6. INCORPORATION OF TITANIUM IN SILICA STRUCTURES USING
SACCHARIDE SURFACTANTS TO STABILIZE AND LOCALIZE TITANIUM
PRECURSORS
6.1. Summary
This chapter discusses work addressing the incorporation of titania in silica
frameworks. Titanium sites dispersed in silica frameworks provide opportunities for
oxidation catalysis and photocatalysis. Titanium is also known to bind strongly to
biomolecules and this property could be exploited to create highly selective materials for
adsorption. Ligand assisted stabilization of a titania precursor has been exploited in this
work using a sugar based surfactant to help stabilize and disperse titania in the
mesostructure. Titanosilicate mesoporous thin films have been synthesized to confirm the
prior study of Rahman that showed that it is possible to homogeneously incorporate
increasing amounts of titanium in the silica framework by increasing the amount of sugar
surfactant based on the ternary phase diagram of n-dodecyl-β-D-maltopyranoside
(C12G2), hexadecyltrimethylammonium bromide (CTAB) and water. The same
surfactant mixture was utilized to synthesize titanosilicate bulk materials containing
variable amounts of titania. The catalytic performance of the bulk materials was tested in
our group for epoxidation of styrene. The catalytic testing provided evidence that the
titania sites dispersed in silica structure were tetra-coordinated, which are known to be
responsible for epoxidation catalysis. Catalytic activity of titanosilicates was compared to
TS-1 and it was found that the catalytic activity for mesoporous titanosilicate with the
lowest titania content had higher turnover frequency compared to TS-1. Catalytic activity
and selectivity of mesoporous titanosilicates reduced with increasing titania content.
147
Synthesis of nonporous Stöber silica particles with titania incorporation by surfactant
complexation has also been demonstrated. Evidence was found that the sugar surfactant
binds very strongly with titania, and calcination at high temperatures was necessary to
remove the surfactant from the materials. Such nonporous titanosilicates could
potentially be used as stationary phases in adsorptive separations.
6.2. Introduction
Supported titania has been used over the past two decades for various catalytic
applications like photocatalysis, acid catalysis and oxidation catalysis. These applications
of the titanosilicates is a result of two main factors, generation of new acid sites and silica
being a strong support due to its thermal and mechanical stability(306). The other
advantages silica provides include photoinertness, high surface area and chemical
stability(307, 308).
Since the discovery of TS-1,(126) materials with titania substituted for silica have
been used for various oxidation catalysis in the presence of H2O2(309). Literature provides
many novel synthesis methods to prepare both crystalline and amorphous titananosilicate
materials for epoxidation catalysis(132, 310-313). For epoxidation, isolated titanium sites
which are tetracoordinated (Ti(IV)) have been shown to be the active sites(132). Many
examples of titanosilicate zeolites have been reported in the literature, including TS-1 and
TS-2, for use in epoxidation catalysis(314, 315), but due to the limited pore size (around
0.5 nm) the number of substrates that can undergo catalysis are limited. An alternative to
overcome the limitations of zeolites is the synthesis of mesoporous titanosilicates.
Multiple examples of mesoporous titanosilicates have been presented in the literature
with different types of pore geometry such as Ti MCM-41(129, 315), Ti MCM-48(128,
316), Ti SBA-1,(317, 318) and Ti SBA-15(319).
148
Various methods to synthesize titanosilicate mixed oxides have been mentioned in the
literature using grafting, sol-gel hydrolysis(320, 321), co-precipitation(322-325) and
flame hydrolysis(306, 326) out of which sol-gel hydrolysis and co-precipitation are the
most common. The sol-gel synthesis method has been used commonly to introduce
transition metals into silica structures. The sol-gel method provides a high degree of
control over the structural properties of the material like shape and size of the pores as
well as the distribution of transition metal sites in the structure(327-329). During nano-
casting, surfactant self-assembly occurs and interactions between the surfactants and
silica precursors in their hydrolyzed form leads to formation of ordered mesoporous
structure. The cooperative interaction between inorganic species and the hydrophilic
ends of the surfactant micelles leads to formation of metal oxide walls with ordered
arrays of micelles.
Two types of sol-gel methods have been used commonly to incorporate metal oxides
into silica structures: co-condensation and post-synthesis grafting. Co-condensation
provides better control over dispersion and composition of metals in the silica structure,
while pore blocking can be avoided by control of the reactions. Transition metal
precursors have higher reactivity compared to silica precursors(330) which may lead to
metal oxide rich domains in the materials and poor dispersion of metal atoms. In titania
silica mixed oxides, TiO2 could be present as isolated species or it could be part of the
mixed oxide structure through Ti-O-Si linkages. The ratio of these species in the material
is dependent on synthesis method and chemical composition(132, 331). Several ways
have been suggested to avoid formation of metal oxide rich domains in silica metal oxide
mixed structures including: prehydrolysis of the silica precursor with a substoichiometric
149
amount of water(133), synthesis of special precursors with both transition metal and
silicon(332, 333), ligand assisted methods to reduce reactivity of transition metal
precursors(134, 334) and nonhydrolytic sol-gel methods(135, 335, 336).
To develop well-defined ordered mesoporous mixed oxides, surfactants can be
simultaneously used both as structure directing agents and transition metal precursor
stabilizing agents. Work has been done on using various block copolymers to synthesize
ordered materials using ligand assisted templating. Celik and Dag reported the use of this
technique in synthesizing liquid crystals of cubic and hexagonal geometry by complexing
poly(ethylene oxide) with transition metal salts(337). Huesing(338) et al. used this
concept to synthesize Si-Ti mixed oxide thin films based on lyotropic liquid crystalline
phases of oligo(ethylene oxide) surfactants. The metal oxide complexed with the
surfactant, and the silica precursor was prehydrolyzed separately to prevent segregation
and formation of metal oxide rich domains(338, 339).
In this work, the use of a saccharide surfactant is demonstrated for stabilization of a
titania precursor. Transition metal complexes with have been well studied in the past in
carbohydrate chemistry and biology(340-342). Studies have also shown that naturally
occurring saccharides and saccharide derivatives act as ligands for transition metal
complexation(343, 344). Morosanova and co-workers have also studied interactions of
silica-titania xerogels with ascorbic acids and various phenolic compounds (which bear
some structural similarity to monosaccharides) and demonstrated the formation of silica-
titania complexes with these compounds(345, 346). In this work we will demonstrate
forming stable ordered titanosilicate films, based on work of Rahman(347), which are of
potential interest due to their photocatalytic activity(338, 339). Surfactants selected for
150
the purpose of this study are n-dodecyl-β-D-maltopyranoside (C12G2) and
hexadecyltrimethylammonium bromide (CTAB). C12G2 will serve in stabilizing the
titania precursor through bidentate binding and will also act as a structure directing agent.
C12G2 will also help in uniformly dispersing titania throughout silica structure due to its
complexation with the titania precursor. CTAB will be used to provide structural stability
during formation of the mixed oxide materials. The same concept has been extended to
synthesize titanosilicate bulk materials. Strong interaction of saccharide surfactants with
a titania precursor has also been exploited to synthesize nonporous, spherical
titanosilicate particles based on modification of Stöber(22) method.
In this chapter we verify the production of stable titanosilicate thin films to show that
it is possible to incorporate a greater amount of titania into silica mesostructures than
previously demonstrated(348) while maintaining the stability of structure using FTIR.
The same synthesis concept of ligand assisted templating method has been used to
synthesize bulk powders of titanosilicates according to the procedures of Rahman(347),
and the bulk materials have been characterized using nitrogen adsorption, X-ray
diffraction, UV-visible spectroscopy and FTIR. The bulk powders have been utilized to
catalyze the epoxidation of styrene in presence of hydrogen peroxide. Beck et al(131)
found that a mixture of tetracoordinated isolated titanium sites were responsible for
epoxidation. Beck et al(131) also reported that for epoxidation of of 2-cyclohexene-1-ol
in presence of titania silica mixed oxides, increasing the amount of incorporated titania
promoted side reactions like oligomerization and Brönstead acid sites led to dimerization
instead of epoxidation. Catalysis provides further proof that the synthesis method using a
mixture of cationic and nonionic surfactants generates tetracoordinated Ti(IV) sites.

151
Comparison between mesoporous titanosilicates and TS-1 shows that the mesoporous
materials with less titanium incorporation than TS-1 have higher selectivity for styrene
and nearly 2.5 times the activity per Ti site.
The property of transition metal complexation with saccharide and saccharide
derivatives(341, 343, 344) has also been used to synthesize modified Stöber particles(22)
incorporating titania. Synthesis of titania coated silica particles which are monodisperse
has been demonstrated previously(349). In this work, it will be demonstrated that it is
possible to incorporate titania into Stöber particles through minor process modifications
to the Stöber synthesis process. C8G1 will be used to stabilize titania precursor and
addition of complexed titania along with CTAB at the point of turbidity is expected to
incorporate titania sites into the particle structure. It is also hypothesized that
complexation will provide imprinted sites for specific saccharide adsorption. Tani et
al(350) previously studied retention of monosaccharides and disaccharides on titania
which clearly showed that sugars can be retained on the surface of titania. Through
molecular imprinting it may be possible to preserve sites selective for a particular
saccharide and may help in separation of the targeted saccharides from other molecules.
Such materials may also find utility in asymmetric oxidation catalysis if the sites are able
to differentiate between enantiomers as previously demonstrated for imprinted silica
Stöber particles in Chapter 5. The synthesis of such particles reduces the diffusion
resistance which would be encountered by porous materials and may prove advantageous
for catalysis of large molecules. FTIR characterization of these materials will show that
the titania is incorporated in to the structure but it is hard to remove the complexed
surfactant.

152
6.3 Experimental Section
6.3.1 Materials
All of the reagents utilized in this work were used as obtained without any further
purification. N-dodecyl-β-D-maltopyranoside (C12G2, >99%) and n-octyl-β-D-
glucopyranoside (C8G1, >99%) were obtained from Affymetrix. Ammonium hydroxide
(NH4OH, 30% V/V), tetraethyl orthosilicate (TEOS, > 98%) and titanium isopropoxide
(TIP, > 98%) were received from Acros organics. 1N hydrochloric acid, DIUF water,
hexadcyltrimethylammonium bromide (CTAB, > 99% pure), concentrated sulfuric acid
and NoChromix were purchased from Fisher scientific. 200 proof ethanol was obtained
from Deacon labs. 200 µm silicon wafers were obtained from University Wafers.
6.3.2 Synthesis
Synthesis of titanosilicate thin films
The synthesis described here is for a 41:5:54 ratio of CTAB:C12G2:H2O as described
by Rahman and Rankin(5). The synthesis was done on a 0.8 g total weight basis of water,
CTAB and C12G2 (the quantity of lyotropic liquid crystal hypothesized to have the same
structure as the surfactant / silica composite). To synthesize titanosilicate thin films,
C12G2 was initially dried overnight at 50 ˚C in a vacuum oven under high vacuum. 39.4
mg C12G2 was then dissolved in 1.83 g ethanol in a bottle which was pre-flushed with
nitrogen to keep the vial dry. The vial was placed in a nitrogen glove bag and 23 µL of
TIP was added to the vial under vigorous stirring such that the TIP:C12G2 molar ratio
was 1:1. The mixture was stirred vigorously for 3 hours in the glove bag to promote
complexation of TIP and C12G2. TEOS hydrolysis was carried out in a separate vial. The
amount of TEOS was calculated by replacing the amount of water from the ternary phase

153
diagram between CTAB, C12G2 and water by fully hydrolyzed equivalent amount of
silica precursor(5, 351). 1.38 g of TEOS was added to a vial along with 0.76 g of ethanol,
0.186 mL water and 0.292 mL 0.1 N HCl. The ratio of the TEOS, water and ethanol was
1:4:2.5 while the added HCl brought the pH of the mixture to 2. The silica was
prehydrolyzed for one hour. The prehydrolyzed silica sol was then added to the vial
containing mixture of TIP and C12G2, drop by drop under vigorous stirring. After
addition of sol 0.12 g of water was added along with 0.763 g of ethanol. An ethanolic
solution of CTAB containing 0.32 g of CTAB dissolved in 2.75 g of ethanol was added to
the mixture and it was stirred further for 1 hour under nitrogen atmosphere. To increase
titania incorporation the ratio of C12G2:CTAB was varied.
To prepare the dip coated samples, silicon wafers were immersed in NoChromix
solution for at least three hours. The wafers were then rinsed with DIUF water followed
by a rinse with acetone. The wafers were suspended in an oven at 50 ˚C for 5 minutes to
dry. The dried wafers were dip-coated at 12.5 cm/min. Wafers were aged at 50 ˚C for at
least 24 hours before further analysis.
Synthesis of titanosilicate bulk materials
To synthesize the bulk titanosilicate samples, C12G2 was dried under continuous
vacuum for 24 hours at 50 ⁰C. 100 mg of dried surfactant was then added to a vial which
was heated above 100 ⁰C to avoid moisture. C12G2 was dissolved in 4.7 g of 200 proof
ethanol. The vial was closed and immediately placed in a nitrogen glove bag to avoid
contact with moisture. The glove bag was purged with nitrogen and 59.4 µl TIP was
added under vigorous stirring to give a 1:1 molar ratio of TIP:C12G2. The mixture was
stirred for 3 hours under nitrogen. Tetraethyl orthosilicate (TEOS) was pre-hydrolyzed
154
for 1 hour by adding 1.57 g 200 proof ethanol, 0.7 ml of 0.1 N HCl and 0.53 ml of water
and stirring the mixture vigorously. The amount of TEOS was calculated based on
ternary phase diagram for C12G2, CTAB and water by replacing the volume of water in
the ternary phase diagram with volume of silica and water of hydrolysis based on work
by Alberius et al(351), while the HCl was added to bring the pH of the reaction mixture
to 2. Water was added to provide four moles of water per mole of TEOS necessary for
hydrolysis. The final molar ratio was TEOS: ethanol: (water + HCl) = 1:2:4. The pre-
hydrolyzed TEOS mixture was added drop by drop with a syringe to the reaction mixture
in a nitrogen filled glove bag under stirring, followed by addition of 0.82 g CTAB. The
mixture was then stirred for 60 minutes and spread thinly in 6 cm diameter petri dishes.
Alcohol was removed from the mixture in a desiccator under vacuum until a thick
viscous sol was obtained. The viscous sol was aged at 50 ⁰C in air for at least 2 days.
Transparent flakes obtained after aging were crushed and calcined in a tubular furnace.
The finely crushed material was spread thinly in a quartz calcination boat and the tubular
furnace was sealed to avoid air leakage. A temperature ramp of 1 ⁰C/min was used to
reach a final temperature of 550 ⁰C. Dried air was used at 1 L/min flow rate under back
pressure. The material was held at 550 ⁰C for 3 hours and then allowed to cool in the
furnace to room temperature. Calcined material was stored in a desiccator under vacuum.
Materials with higher titanium content were prepared by changing the amount of sugar
surfactant added while keeping the total surfactant content (CTAB+C12G2) constant
during synthesis. The materials with 1.14%, 2.9%, 5.35% and 7.4% titanium will be
referred to as S-1, S-2, S-3 and S-4 respectively for the purpose of this work. A silicate
155
was also synthesized using the same procedure and ratio of surfactants used for S-1, but
no titania precursor was added.
For comparison of catalytic activity, TS-1 was prepared using the method reported by
Thangaraj et al(352) and mesoporus titania was prepared using the method of Peng et
al(353). Both of these materials were prepared by Dr. Janet Mohandas, a postdoctoral
researcher at the University of Kentucky.
Synthesis of titania-containing Stöber particles
Titania-containing Stöber particles were prepared using a modification of the Stöber
process utilized previously to synthesize particles with imprinted silica surfaces (Chapters
4, 5). To synthesize the particles, C8G1 was dried at 50 ˚C for 24 hours under vacuum.
40 mg of C8G1 was then added to a vial which was heated at 100 ˚C for 2 hours to keep
the vial dry. The added C8G1 was then dissolved in 2 mL of 200 proof ethanol and the
vial was placed in a glove bag under nitrogen atmosphere. In the glove bag, 41 µL of TIP
was added to the vial under vigorous stirring. The molar ratio of C8G1 to TIP was 1:1.
Complexation of C8G1 and TIP was allowed to proceed for 3 hours. Based on the work
done by Bogush et al(136) a recipe to synthesize 200 nm particles was utilized. In a
separate conical flask, 67.8 g of 200 proof ethanol, 3.15 mL of 30% w/w ammonium
hydroxide and 4.32 g of water were mixed and stirred slowly for 5 minutes after which
6.32 g of TEOS was added to the synthesis mixture. 20 minutes after addition of TEOS,
at which point solution starts showing signs of turbidity, the complexed mixture of C8G1
and TIP was added to the synthesis mixture along with 40 mg of CTAB. The synthesis
solution was stirred for 24 hours and then centrifuged to recover the particles. The

156
particles were then aged at 50 ˚C for 24 hours to promote interaction of surfactant with
particles.
At the end of aging cycle the particles were put through three different cleaning
treatments to observe the effect of cleaning cycles on the stronger bond between titania
and saccharide surfactant. In the first method the particles were washed for three cycles
with ethanol, centrifuged to remove surfactant-containing solution and sonicated to
suspend particles for three cycles followed by the same treatment with DIUF water to
bring the pH of the synthesis mixture to neutral. The particles were then dried at 50 ˚C for
24 hours. In the second method the particles were calcined at 550 ˚C for 4 hours with a
ramp rate of 35 ˚C/min. In the third method, Soxhlet extraction was carried out in 200
proof ethanol before the particles were dried at 50 ˚C.
6.3.3 Catalytic testing
Catalytic activity measurements for the titanosilicate bulk materials was carried out
by Janet Mohandas. The reaction equipment consisted of 25 mL round bottom flask with
a magnetic stirrer, connected to a reflux condenser. Temperature was controlled using a
heated oil bath with a thermostat. A thermometer was also placed in the flask to measure
reaction temperature. The reaction was carried out on the basis of 0.5 mL styrene. A 1:5
ratio of catalyst to styrene by weight was used and a 2:1 ratio of styrene to hydrogen
peroxide by volume was used for oxidation. Sodium hydroxide (1 mL, 0.1 N) was used in
some reactions to neutralize the acidic surface of the catalysts. The epoxidation reaction
was carried out at 85 ˚C for 5 hours. Acetonitrile was used as the solvent and the analysis
of products was carried out using GC with a flame ionization detector and a capillary
column.

157
6.3.4 Material characterization
For FTIR analysis, thin films prepared by coating sol onto 200 µm silicon wafers
were analyzed. A background spectrum was collected for each silicon wafer before
coating with the titanosilicate sol. FTIR of thin films was performed using a
ThermoNicolet Nexus 470 with a liquid nitrogen-cooled MCT detector. FTIR analysis
was done in approximately the same region on the silicon wafer before and after coating
to avoid noise due to variation in thickness of the oxide layer on the wafer.
Analysis of bulk titanosilicates was carried out using a ThermoNicolet Nexus 470
with a DTGS detector. The pellets were prepared by mixing approximately 1% by weight
of titanosilicates with dried KBr and were pressed to give translucent to transparent
pellets. To analyze the presence of surfactant on titania-containing Stöber particles, the
same FTIR procedure as above was used, although in some cases instead of a DTGS
detector, a MCT detector was used to obtain better signal. Analysis of some of the Stöber
particle samples was also carried out using an attenuated total reflectance (ATR)
accessory on a Varian 700e FTIR instrument, where the samples were directly placed in
contact with the internal reflection element for analysis.
Nitrogen adsorption for the titanosilicate bulk materials was carried out using a
Micromeritics Tristar 3000 nitrogen adsorption instrument. Before nitrogen adsorption
measurements, the samples were degassed at 120 ˚C for 4 hours. XRD patterns for
titanosilicate bulk materials were collected using a Bruker D8 Advance diffractometer
using Ni-filtered Cu Kα radiation (λ = 1.5406 Å) at a scan rate of 0.2 ˚/min for 2 values
between 1.8 degrees and 6.5 degrees.
158
6.4. Results and discussion
6.4.1 Titanosilicate thin films
FTIR analysis of titanosilicate thin films was carried to support work previously
reported by Rahman(347) regarding the synthesis of ordered mesoporous titanosilicate
thin films. It was observed that with increasing amount of titania precursor used in the
synthesis, incorporation of tiania in the thin films increased. The FTIR spectra of the thin
films after processing are shown in Figure 6.1. The relative intensity of the peak
associated with Ti-O-Si bond vibrations(354) (960 cm-1
) increases with respect to the
peak associated with Si-O-Si bond vibration (1050 cm-1
), suggesting that titania is
actually incorporated in the structure of the thin films. The materials have been
characterized using XRD, UV-vis spectroscopy, STEM and nitrogen adsorption to show
that the thin films have hexagonal mesoporous structure with long range order(347). The
results were consistent with the observations of Rahman(347), which showed that in
films prepared by pre-complexing the TIP with C12G2, the titanium in the final material
is present mainly as isolated tetracoordinated sites, irrespective of the amount of titanium
incorporated. NMR experiments were also performed to show the binding sites of
C12G2 with titania precursor during complexation step are bidentate(355). The bidentate
interaction helps in stabilizing and dispersing Ti in the mesostructure of the silica. Further
work with titanosilicate powders has been shown below for styrene epoxidation which
demonstrates that the incorporated titania is tetracoordinated and works as an epoxidation
catalyst.
6.4.2 Titanosilicate bulk materials
Physical characteristics for all the bulk materials are presented in Table 6.1. Nitrogen
adsorption isotherms for mesoporous titanosilicates are shown in Figure 6.2. The BET

159
surface areas of the materials are presented in Table 6.1. All of the titanosilicates exhibit
Type-IV nitrogen adsorption isotherms although the capillary condensation step is not
well pronounced in the plot. Capillary condensation at low relative pressure is observed
when the pore sizes are close to transition region from the microporous to mesoporous
region(167, 356). No hysteresis was observed for the nitrogen adsorption isotherms,
which suggests that the pores are uniformly sized. The maximum volume of nitrogen
adsorbed also decreases as the amount of titanium incorporated is increased. This shows
that the pore volume decreases, which suggests that the stability of the ordered porous
titanosilicates decreases as we increase the amount of titanium incorporated. The
reduction in nitrogen volume adsorbed may correspond to collapse of pores due to
instability. However, a similar loss in pore volume has been observed upon increasing
the C12G2 content in mesoporous silica prepared using CTAB/C12G2 mixtures, so this
may simply be an effect of the surfactant templates(5). Sample S1, which incorporates
1% titanium has a comparable nitrogen adsorption isotherm to the silicate synthesized
using the same method. With increasing amount of titanium content the surface area
decreases. Negligible micropore volume is observed for S1 and the pure silica material,
while very small micropore volume was observed S2 and S3. S4 shows a large micropore
volume which is comparable to mesopore volume. The total pore volumes are
documented in Table 6.1.
Pore diameters were calculated using method of Barrett, Joyner and Halenda(166)
with corrections to the equation implemented by Kruk, Jaroniec and Sayari (KJS)(357).
Pore diameters for titanosilicates and silicate are shown in Figure 6.3. Pore diameters are
above 2 nm in diameter for mesoporous silica as well as S1 to S3 titanosilicates. For S4

160
the maximum pore size appears to lie below the capabilities of the pressure transducers to
accurately measure. This is consistent with shrinkage or collapse of mesopores as more
titania (and more C12G2) is employed.z With increasing amount of incorporated titanium
the pore diameter reduces slightly. The diameter for all the titanosilicates was larger than
TS-1. It was also observed that the pore volume increased from S1 to S2 but was
gradually lesser thereafter. The increase in pore volume may be a result of larger number
of pores in microporous region with increasing incorporation of titania, while for S4 the
high amount of titania may have led to collapse of pores due to structural instability and
hence very low pore volumes were obtained. Larger pore diameter provides smaller
diffusion resistance to substrate molecules, which may provide higher efficiency for
epoxidation reactions.
Low angle X-ray diffraction patterns were collected for titanosilicates between 1.8 to
6.5 degrees (Figure 6.4). Only one peak could be observed in XRD patterns for silicates
and titanosilicates suggesting that the materials are ordered but do not have long range
order. It can be observed that with an increase in titanium content the intensity of the
(100) reflection reduces, until S4 (containing 7.4 % titanium) which has no detectable
reflections. Increasing the amount of sugar surfactant during synthesis leads to a decrease
in structural stability. Replacing the tetra coordinated silicon with tetracoordinated
titanium ion while increasing titanium incorporation may also have led to loss of order in
materials(130). The d100 spacing calculated using Bragg’s law for silicate, S1, S2 and S3
were found to be similar and had values of 2.88 nm, 2.74 nm, 2.63 nm and 2.87 nm
respectively. For S4 no strong peak could be observed and hence d spacing could not be
calculated.

161
FTIR spectra collected for the titanosilicates are shown in Figure 6.5. The spectra
presented were normalized with respect to the Si-O-Si bond vibration intensity around
1050 cm-1
. A peak can also be observed at 960 cm-1
for silicate prepared without titania
incorporation (6.5b). This peak is associated with the silanol group bond stretching
vibration. A band in the same region is also observed for asymmetric Si-O-Ti bond
stretching vibration(354). The band increases in intensity with incorporation of higher
amount of titania in the materials. A band is also observed in all the materials for
symmetric Si-O stretching at 800 cm-1
. A ratio of intensity of peaks at 960 cm-1
and 800
cm-1
was plotted against the nominal percentage of incorporated titania (Figure 6.6) to
show an almost linear relationship, which is consistent with titanium incorporation into
the structure according to the amount provided in the synthesis mixture.
Diffuse reflectance UV-visible spectroscopy was performed to determine the
coordination state of titania in the materials. For the mesoporous titanosilicates a shoulder
was observed between 250 and 270 nm wavelengths suggesting a possible mixture of
tetra-coordinated and higher coordination (pentacoordinated or hexacoordinated) sites.
The UV visible spectrum is shown in Figure 6.7. The spectrum is also shown for TS-1
which is a microporous zeolite used for epoxidation, and it has a shoulder at 210 nm.
The results of catalytic testing for mesoporous titanosilicates (S1 to S4), TS-1, porous
titania and mesoporous silica are summarized in Table 6.2. Except for the titanium-free
mesoporous silica, all of the samples provided 100% conversion of H2O2, which suggests
that the isolated titania sites may be responsible for peroxide binding leading to
epoxidation. It was observed that for epoxidation of styrene carried out in the presence of
1 mL of 0.1 N NaOH, the conversion was similar for S1, S2 and S3 while a significant
162
drop was seen for S4. The highest turnover frequency per titania site was observed for S1
and it was seen under similar reaction conditions that the turnover frequency of S1 was
more than twice the turnover frequency of TS-1 for styrene epoxidation. The reduction in
turnover frequency for samples containing more titanium may be a result of smaller
surface area, and lower pore accessibility due to collapse of pores. It was observed that
the selectivity of titanosilicates towards styrene oxide formation reduced with increasing
titania content. Formation of titania clusters may have led to complete cleavage of the
carbon carbon double bond in styrene leading to formation of by-products like
benzaldehyde instead of the expected epoxide, thus leading to lower selectivity towards
styrene epoxide. Titanosilicates S1 and S2 showed appreciably higher selectivity towards
styrene epoxidation compared to other examples in the literature(312, 313). The
conversion and selectivity towards styrene oxide for different mole percentage of titania
in the materials has been plotted in Figure 6.8. It can be seen that with increasing titania
incorporation the selectivity towards styrene epoxide reduces, which may be a result of
formation of higher coordination titania sites catalyzing complete oxidation. The
conversion of styrene was observed to be similar from S1 to S3 but fell sharply for S4.
The sudden decrease in conversion results from collapse of mesopores which makes the
titania sites in the materials less accessible and thus shows low conversion.
6.4.3. Titania incorporated Stöber particles
FTIR was performed on the Stöber particles prepared with incorporated titania. Figure
6.9 shows unwashed titania-containing Stöber particles in comparison to calcined
titanosilicate Stöber particles. It can be observed from Fig. 6.9(A) that the uncalcined
particles showed a broad peak between 3400 and 3800 cm-1
which is associated with

163
hydroxyl stretching. The peak may have resulted from water retained on the particle
surface after aging or hydroxyl groups. For the calcined particles no such peaks were
obtained which may have resulted from high temperature used in calcination. Between
2900 and 3100 cm-1
, peaks associated with CH2 stretching were visible for uncalcined
particles. The presence of these peaks suggests surfactant incorporation on the particle
surface during synthesis. The peaks were not observed after the material was calcined at
550 ˚C. Figure 6.9(B) also shows FTIR spectra in the range from 700 to 1700 cm-1
. A
strong peak associated with siloxane stretching is observed with maximum absorbance at
1050 cm-1
. Peaks in the spectra are also observed for both calcined and uncalcined
materials at 960 cm-1
and 800 cm-1
. The peak at 960 cm-1
has been reported in literature
to be associated with Ti-O-Si stretching. Peaks associated with uncondensed hydroxyl
groups have also been reported near 960 cm-1
. The intensity of peak at 960 cm-1
was very
high for uncalcined materials, but reduced after calcination. Ratio of area under the curve
for peak at 960 cm-1 associated with Si-OH stretching and Ti-O-Si vibrations was
obtained with respect to silioxane stretching band. The ratio of the peaks was compared
for calcined and uncalcined Stöber particles as well as calcined and uncalcined titania
containing Stöber particles. It was observed that uncalcined silicate Stober particles and
titania containing Stöber particles had a ratio of 0.0584 and 0.0634 respectively. But, it
was observed that after calcination at 550 ˚C the ratio dropped to 0 for silicate Stöber
particles, as no intensity could be observed at 960 cm-1. Titania containing Stöber
particles on the other hand had a residual ratio of 0.0196 even after calcination.
Calcination at high temperature may have led to disappearance of intensity associated
164
with surface hydroxyl groups and the residual intensity associated with Ti incorporated
may have resulted in the weak peak observed at 960 cm-1
for calcined materials.
A comparison of titania-incorporated Stöber particles and silica Stöber particles has
been shown in Appendix D Figure D.1. After calcination at 300 ˚C the Si-OH stretching
bands for silica Stöber particles at 960 cm-1
were eliminated while a peak at 960 cm-1
could still be observed for titania incorporated Stöber particles which suggests
incorporation of titania in the synthesized particles. It was determined that none of the
techniques utilized for removal of surfactant complexed with titania worked except for
calcination of materials at 550 ˚C. FTIR spectra for titani- incorporated Stöber particles
which were washed with ethanol and water or that were Soxhlet extracted are shown in
Appendix D Figure D.2. The peaks associated with CH2 stretching between 2800 and
3000 cm-1
are present for both particles cleaned with Soxhlet extraction and which were
washed. This could have occurred due to two possibilities: 1) the complexed titania could
have been incorporated inside the structure of particles which would have resulted in
C12G2 being inaccessible to washing and unresponsive to calcination, or 2) the bond
between titania and C12G2 may have been strong enough to withstand all the treatments
used for surfactant removal. Calcination was the only technique which was demonstrated
to remove the surfactant. This was a problem that made it difficult to pursue the testing
of these materials as imprinted particles for saccharide adsorption, but in the future this
strong bonding may be useful for tuning the nonselective binding to the remainder of the
surface of the particles.
6.5. Conclusion Titanosilicate thin films and bulk materials were synthesized using ligand assisted titania
incorporation with C12G2 used to stabilize titania precursor and disperse titania in the
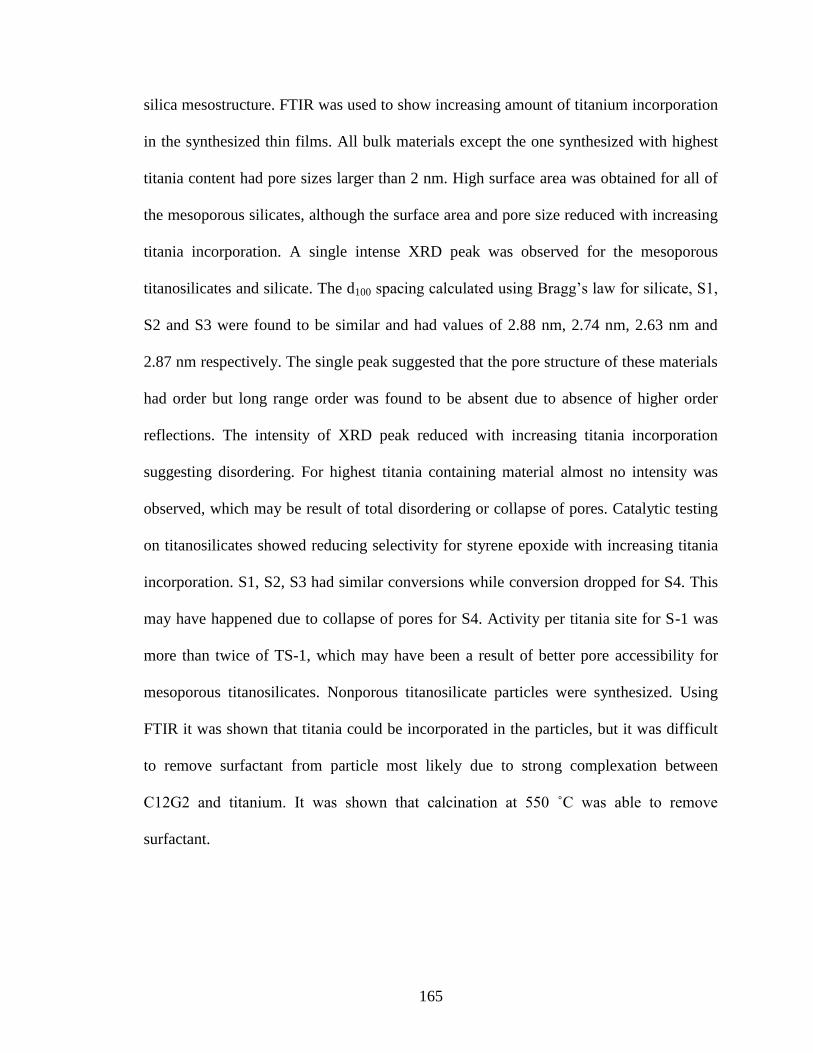
165
silica mesostructure. FTIR was used to show increasing amount of titanium incorporation
in the synthesized thin films. All bulk materials except the one synthesized with highest
titania content had pore sizes larger than 2 nm. High surface area was obtained for all of
the mesoporous silicates, although the surface area and pore size reduced with increasing
titania incorporation. A single intense XRD peak was observed for the mesoporous
titanosilicates and silicate. The d100 spacing calculated using Bragg’s law for silicate, S1,
S2 and S3 were found to be similar and had values of 2.88 nm, 2.74 nm, 2.63 nm and
2.87 nm respectively. The single peak suggested that the pore structure of these materials
had order but long range order was found to be absent due to absence of higher order
reflections. The intensity of XRD peak reduced with increasing titania incorporation
suggesting disordering. For highest titania containing material almost no intensity was
observed, which may be result of total disordering or collapse of pores. Catalytic testing
on titanosilicates showed reducing selectivity for styrene epoxide with increasing titania
incorporation. S1, S2, S3 had similar conversions while conversion dropped for S4. This
may have happened due to collapse of pores for S4. Activity per titania site for S-1 was
more than twice of TS-1, which may have been a result of better pore accessibility for
mesoporous titanosilicates. Nonporous titanosilicate particles were synthesized. Using
FTIR it was shown that titania could be incorporated in the particles, but it was difficult
to remove surfactant from particle most likely due to strong complexation between
C12G2 and titanium. It was shown that calcination at 550 ˚C was able to remove
surfactant.
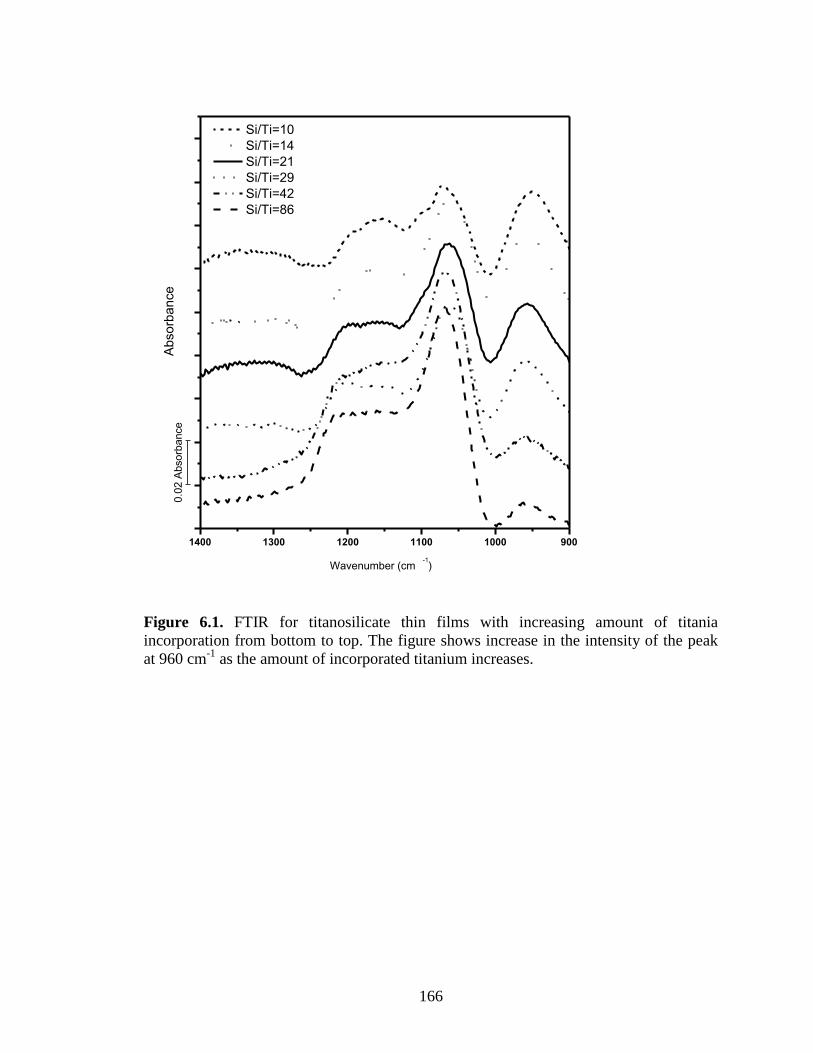
166
1400 1300 1200 1100 1000 900
Abso
rba
nce
Wavenumber (cm-1)
Si/Ti=10
Si/Ti=14
Si/Ti=21
Si/Ti=29
Si/Ti=42
Si/Ti=86
0.0
2 A
bsorb
ance
Figure 6.1. FTIR for titanosilicate thin films with increasing amount of titania
incorporation from bottom to top. The figure shows increase in the intensity of the peak
at 960 cm-1
as the amount of incorporated titanium increases.
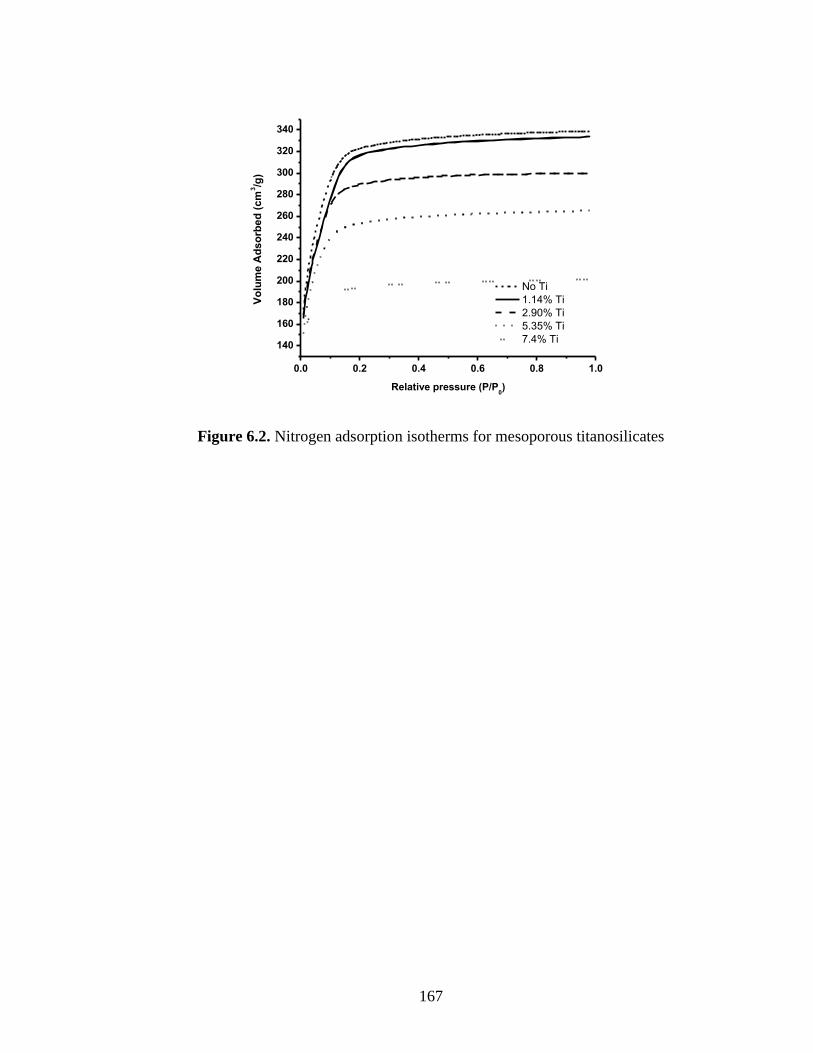
167
0.0 0.2 0.4 0.6 0.8 1.0
140
160
180
200
220
240
260
280
300
320
340
Vo
lum
e A
ds
orb
ed
(c
m3/g
)
Relative pressure (P/P0)
No Ti
1.14% Ti
2.90% Ti
5.35% Ti
7.4% Ti
Figure 6.2. Nitrogen adsorption isotherms for mesoporous titanosilicates
168
1 2 3 4 5 6 7 8 9 10
0.0
0.2
0.4
0.6
0.8
1.0
Vp
/rP
rP (nm)
No Ti
1.14% Ti
2.90% Ti
5.35% Ti
Figure 6.3. Pore size distribution for mesoporous titanosilicates estimated using the KJS
method
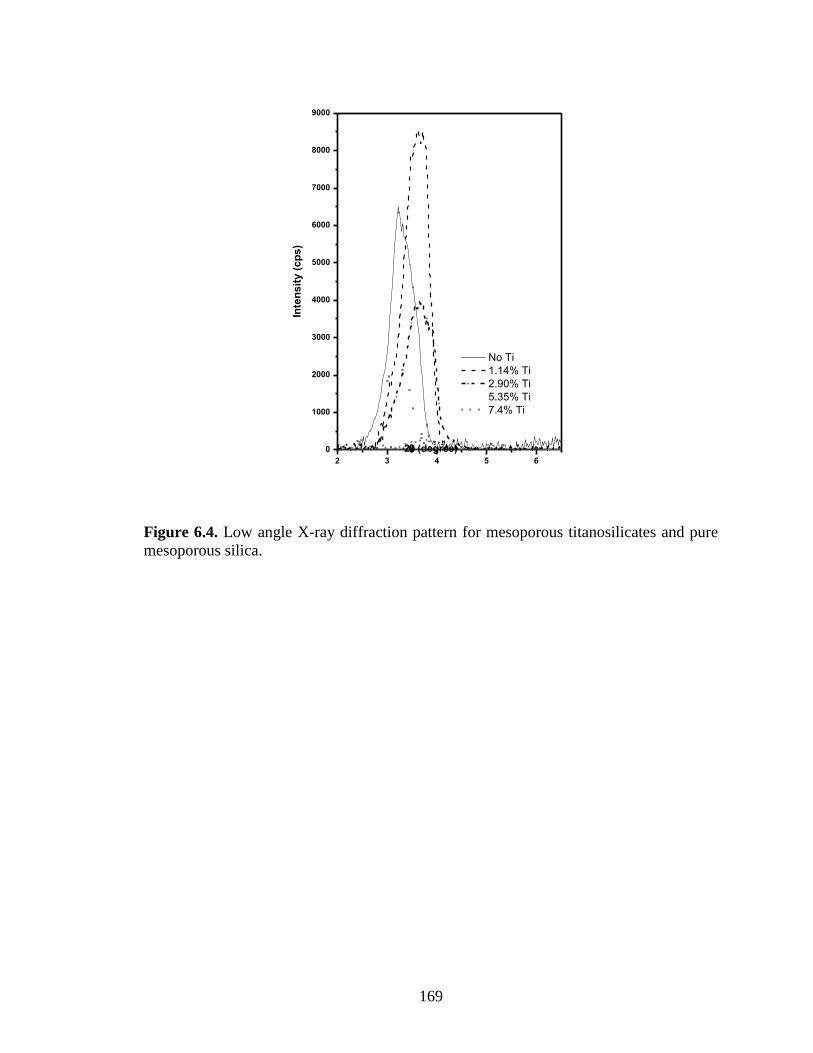
169
2 3 4 5 6
0
1000
2000
3000
4000
5000
6000
7000
8000
9000
2(degree)
Inte
ns
ity
(c
ps
)
No Ti
1.14% Ti
2.90% Ti
5.35% Ti
7.4% Ti
Figure 6.4. Low angle X-ray diffraction pattern for mesoporous titanosilicates and pure
mesoporous silica.
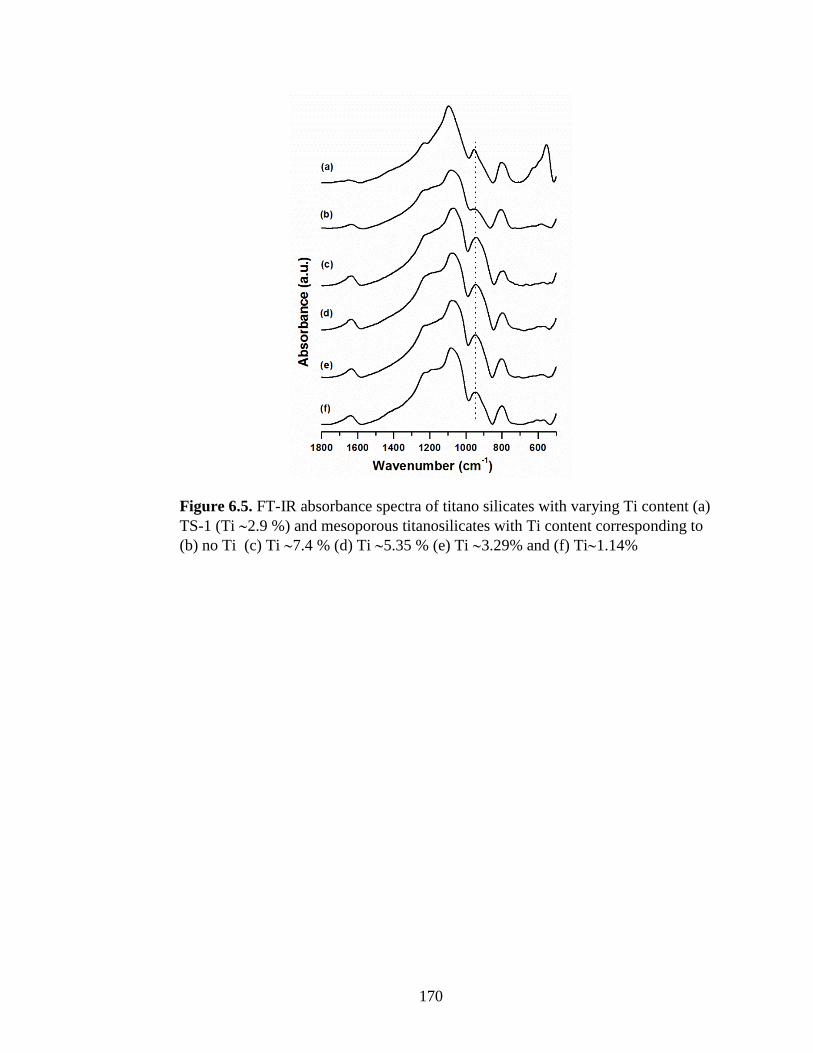
170
Figure 6.5. FT-IR absorbance spectra of titano silicates with varying Ti content (a)
TS-1 (Ti 2.9 %) and mesoporous titanosilicates with Ti content corresponding to
(b) no Ti (c) Ti 7.4 % (d) Ti 5.35 % (e) Ti 3.29% and (f) Ti1.14%

171
Figure 6.6. Ratio of the integrated areas of the 960 and 800 cm-1
IR bands with respect to
the framework titanium content in different bulk titanosilicate powders.
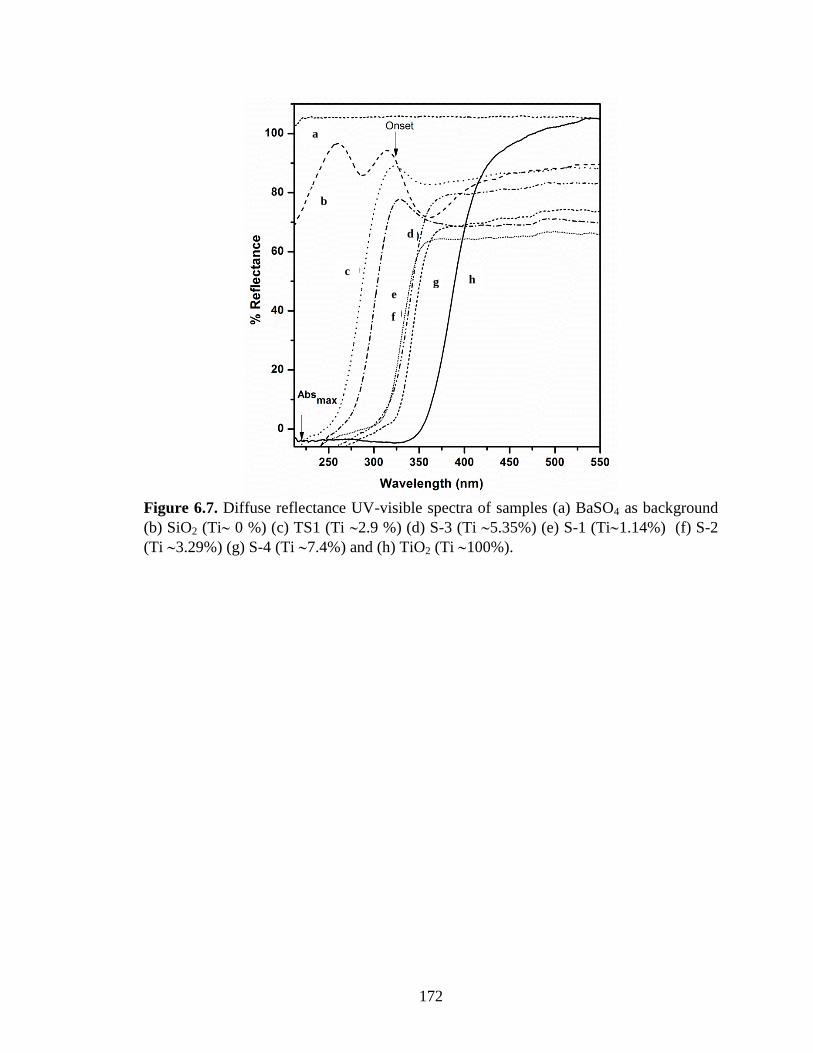
172
Figure 6.7. Diffuse reflectance UV-visible spectra of samples (a) BaSO4 as background
(b) SiO2 (Ti 0 %) (c) TS1 (Ti 2.9 %) (d) S-3 (Ti 5.35%) (e) S-1 (Ti1.14%) (f) S-2
(Ti 3.29%) (g) S-4 (Ti 7.4%) and (h) TiO2 (Ti 100%).
b
c
a
d
h
f
e g

173
Figure 6.8. Conversion and selectivity of various titanosilicate samples with respect to Ti
content. With increasing mol percentage the samples go from S1 (1.29% titanium) to S4
(7.1 % titanium).

174
Figure 6.9. Reflectance spectra of calcined and uncalcined titanosilicate Stöber particles
collected using ATR. A) Spectra between 2600 and 3000 cm-1
wavenumber, showing
peaks between 2900 cm-1
and 3000 cm-1
associated with CH2 stretching before
calcination and disappearance of such peaks after calcination. B) Spectra between 700
and 1700 cm-1 shows siloxane stretching band with peak at 1050 cm-1 and a peak at at
960 cm-1 due to Si-O-Ti vibrations and Si-OH bond vibrations. After calcination the
intensity at 960 cm-1 reduces due to removal of surface hydroxyl groups and residual
intensity as a result of Si-O-Ti vibrations is observed.

175
Table 6.1. Textural and surface properties of titanosilicates
Sample
ID
Si/Ti
ratio
Nominal
Ti content
(mol %)
Acidity
(mmol/
g)
Surface
area
(m2/g)
Porevolume
(cm3/g)
Pore diametera
(nm)
S1 86 1.14 0.246 947 0.678 2.4
S2 28 3.29 0.458 856 0.790 2.3
S3 16 5.35 0.515 745 0.730 2.1
S4 10 7.4 0.620 556 0.513 ---
TS-1 33 2.9 0.241 360 0.117 0.5b
SiO2 -- 0 0.147 960 0.664 2.3
TiO2 -- 100 0.011 125 0.191 3.9
a: Maximum in pore size distribution obtained using KJS method.
b: This could not be accurately measured using the Tristar 3000 but this is a typical pore diameter for TS-
1(352).
Table 6.2. Catalytic activity of titanosilicates with varying titanium content
Sample
ID
Ti
content
(mol %)
Acidity
(mmol/g)
H2O2
Conversion
(%)
Conversion
(%)
Selectivity (%) Turn over
frequency (h-1) Styrene oxide Benzaldehyde
S1 1.14 0.246 100 18 96 4 10.14
S2 3.29 0.458 100 19 93 7 3.72
S3 5.35 0.515 100 19 82 18 2.29
S4 7.4 0.620 100 13 80 20 1.08
TS-1 2.9 0.241 100 19 93 7 4.23
*SiO2 0 0.147 40 28 2 < 1 ---
*TiO2 100 0.011 100 12 4 0 0.09
Styrene: 0.5 ml; H2O2: 0.25 ml; Solvent: Acetonitrile = 4.8 ml; Internal standard: 1, 2- Dichlorobenzene = 0.4 ml
NaOH: 1 ml, 0.1 N; Sample wt.:20 wt% of the substrate (Styrene); Temperature: 85 C; Reaction time: 5 h.
*Resulted in polymerization
Copyright © Suvid Joshi 2014

176
CHAPTER 7
7. CONCLUSIONS AND FUTURE WORK
7.1. Conclusions
Sugar based surfactants are important in the industry due to their biodegradability and
possibility of production from renewable resources. Sugar surfactants can be produced at
industrial scale and direct applications of surfactants are as detergents, as anti-foaming
agents, in cosmetics, for biochemical separations, in biomimetic science and in synthesis
of templated materials. In this dissertation, various mixtures of saccharide surfactants
with a cationic surfactant (cetyltrimethylammonium bromide, CTAB) have been explored
from a thermodynamic point of view and applications of such mixtures for synthesis of
catalysts and adsorbents has been explored.
In chapter 3, the thermodynamics of demicellization of a mixture of CTAB and C8G1
were studied. Isothermal titration calorimetry (ITC) was employed as a relatively novel
approach to measuring micellar thermodynamics in this type of mixed system. ITC
provides the opportunity to directly study thermodynamic behavior of a surfactant
mixture by introducing surfactants in solution in small steps to generate heat vs.
concentration diagrams. Rubingh’s model(12) of nonideal surfactant micellization is
typically used to determine thermodynamics of surfactant mixtures from measurements
that do not provide direct thermodynamic information, (e.g. critical micelle concentration
(cmc) values from surface tension measurements). However, this model is based on a
regular solution theory activity coefficient model, and this approach was used to develop
a model for heat vs. concentration data obtained using ITC. Two models were developed
and the models were fit to a set of ITC curves for systems with varying surfactant
composition to estimate the enthalpy of demicellization of each surfactant, cmc values of

177
each surfactant, the thermodynamic interaction parameter (β) and a set of dilution
parameters used to improve the match to the data before and after the cmc. It was
observed that Model 1 in Chapter 3 matched the demicellization curves very well, but a
large uncertainty was observed in parameters associated with first order terms in enthalpy
of dilution (equation 3.13) and enthalpy of demicellization of pure surfactants was
observed. The value of was found to be very close to the values commonly reported in
the literature for mixtures of n-octyl--D-glucopyranoside (C8G1) and CTAB. Model 2
was also used to fit the data and it differed from Model 1 based on the enthalpy of
dilution equation. The enthalpy of dilution equation for Model 2 eliminated first order
terms associated with enthalpy of dilution. Very small uncertainties were observed for all
the parameters in Model 2, but the value of β was different than the value of β commonly
reported in literature. It was also observed that Model 2 could not fit the data below cmc
for high concentration of surfactants in mixed system. Model 1 and Model 2 predicted
mixed surfactant cmcs which matched well with cmc taken as point of departure from
low concentration plateau. The models extend the work of Tsamaloukas et al(74) (which
was applicable only to ideal mixtures of surfactants) to ITC of non-ideal surfactant
mixtures.
The remainder of the dissertation was focused on the use of saccharide surfactants to
create imprinted sites on metal oxide surface for specific adsorption and catalysis. In
Chapter 4 a modification to the Stöber silica particle synthesis process is described to
synthesize imprinted nonporous particles for selective adsorption of D-glucose or D-
xylose in comparison to the other sugar. Early addition of surfactant around the time at
which Stöber particles start precipitating was demonstrated to be the best point for
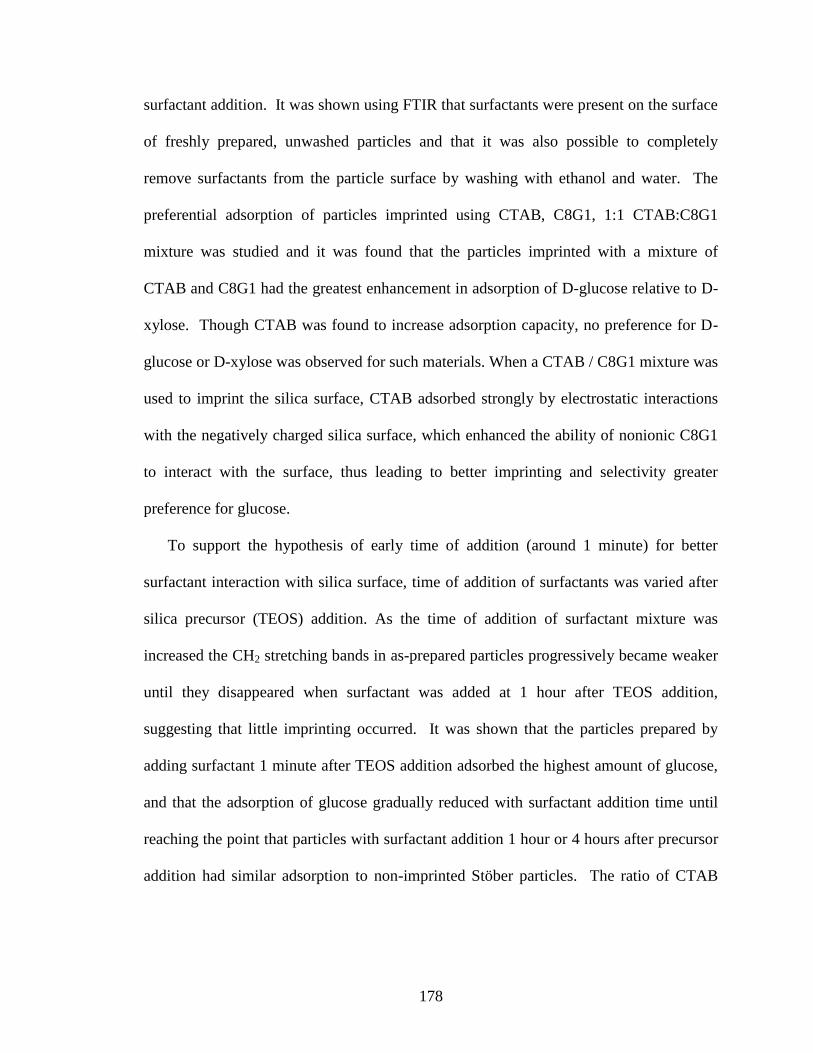
178
surfactant addition. It was shown using FTIR that surfactants were present on the surface
of freshly prepared, unwashed particles and that it was also possible to completely
remove surfactants from the particle surface by washing with ethanol and water. The
preferential adsorption of particles imprinted using CTAB, C8G1, 1:1 CTAB:C8G1
mixture was studied and it was found that the particles imprinted with a mixture of
CTAB and C8G1 had the greatest enhancement in adsorption of D-glucose relative to D-
xylose. Though CTAB was found to increase adsorption capacity, no preference for D-
glucose or D-xylose was observed for such materials. When a CTAB / C8G1 mixture was
used to imprint the silica surface, CTAB adsorbed strongly by electrostatic interactions
with the negatively charged silica surface, which enhanced the ability of nonionic C8G1
to interact with the surface, thus leading to better imprinting and selectivity greater
preference for glucose.
To support the hypothesis of early time of addition (around 1 minute) for better
surfactant interaction with silica surface, time of addition of surfactants was varied after
silica precursor (TEOS) addition. As the time of addition of surfactant mixture was
increased the CH2 stretching bands in as-prepared particles progressively became weaker
until they disappeared when surfactant was added at 1 hour after TEOS addition,
suggesting that little imprinting occurred. It was shown that the particles prepared by
adding surfactant 1 minute after TEOS addition adsorbed the highest amount of glucose,
and that the adsorption of glucose gradually reduced with surfactant addition time until
reaching the point that particles with surfactant addition 1 hour or 4 hours after precursor
addition had similar adsorption to non-imprinted Stöber particles. The ratio of CTAB

179
and C8G1 was also varied and the best ratio of surfactants for glucose adsorption was
found to be a 1:1 ratio by weight of CTAB and C8G1.
A two-site Langmuir adsorption isotherm with specific and non-specific adsorption
sites was applied to model the adsorption of glucose and xylose on particles imprinted for
glucose. It was assumed that sites which were non-specific had the same adsorption
equilibrium constant for all particles. The model was able to fit the adsorption behavior
of both glucose and xylose on non-imprinted and CTAB imprinted particles with only
non-specific adsorption sites. A one-site, non-specific Langmuir model was also able to
fit xylose adsorption isotherms on C8G1 and CTAB/C8G1 imprinted particles. However,
the full two site model was needed to fit the experimental adsorption isotherm of glucose
on C8G1 and CTAB/C8G1imprinted particles. In addition to separate adsorption
measurements for glucose and xylose, mixed sugar adsorption from biomass hydrolyzates
on the CTAB/C8G1 imprinted particles was measured by a collaborator, Alcia
Modenbach, which showed selective adsorption of glucose from a mixture(358).
Flexibility of the imprinting technique was demonstrated by modifying the method to
imprint the silica particles for xylose using a mixture of CTAB and n-octyl-b-D-
xylopyranoside (C8X1). Although minor modifications to the synthesis were required to
dissolve C8X1, it was possible to obtain imprinted silica particles which showed a
preference for adsorption of xylose compared to glucose. These nonporous particles,
which were synthesized at 50 ˚C to ensure that all surfactants were soluble, had less non-
specific adsorption than particles synthesized at room temperature. Thus, the imprinting
approach based on adding surfactants to freshly precipitated Stöber particles could be

180
tuned to tuned to target different molecules with minor changes in the synthetic
procedure.
In chapter 5, the concept of preference of D-glucose imprinted Stöber particle
surfaces was tested in comparison to chiral homologues of D-glucose. Adsorption of
particles imprinted with a CTAB/C8G1 mixture for D-glucose was compared with
adsorption of D-mannose, D-galactose and L-glucose. It was observed that the largest
difference in adsorption was observed between D-glcuose and L-glucose. L-glucose is the
enantiomer of D-glucose (so all chiral centers are opposite in L-glucose), and therefore a
large difference in structure may have resulted in very low adsorption of L-glucose.
Structure of L-glucose obtained after free energy minimization also showed that the
hydroxyl group on L-glucose responsible for hydrogen bonding with hydroxyl groups on
silica, are out of the plane of the ring, which may explain the reduced adsorption of L-
glucose on both imprinted and non-imprinted particles. D-glucose adsorption was as large
as three times greater than L-glucose adsorption on particles imprinted for D-glucose. It
was found that D-mannose and D-galactose, which differed from D-glucose at just one
chiral center, also showed significant differences in adsorption on particles imprinted for
D-glucose. D-glucose adsorption was nearly 1.5 times the adsorption of either D-
galactose or D-mannose. The difference in selectivity supports the molecular imprinting
mechanism and shows that technique developed in chapter 4 also provides an opportunity
for developing chirally selective materials. The molecular imprinting technique was also
extended to synthesize materials selective towards a disaccharide, D-maltose, using a
mixture of CTAB and n-dodecyl--D-maltoside (C12G2) for imprinting. The imprinted
materials demonstrated higher adsorption of D-maltose when compared with D-

181
cellobiose. D-maltose and D-cellobiose differ from each other only in the anomeric form
of the linkage between two D-glucose units. Despite this seemingly subtle difference, the
materials imprinted for D-maltose showed more than 5 times as much adsorption (at low
concentration) of D-maltose compared with D-cellobiose. The ability to create
preferential adsorption sites for D-maltose supported the molecular imprinting
mechanism and also showed the possibility of imprinting the surface for selective
adsorption of larger molecules.
As a final demonstration of the use of sugar surfactants in materials synthesis,
saccharide surfactant complexation with transition metal oxide precursors was explored
to incorporate titania in mesoporous silica structure and on the surface of nonporous
silica particles. The mesoporous materials were processed in both thin film and bulk
material forms. Thin films were synthesized based on the ternary diagram of CTAB,
C12G2 and water developed by Rahman and Rankin(5). The thin films confirmed the
procedure of Rahman(347) to create isolated tetracoordinated titanium sites by stabilizing
the titania precursor by complexation with the headgroup of C12G2 during synthesis of
the materials. The same concept of use of saccharide surfactants to stabilize titania
precursor while simultaneously acting as a structure directing agent was used to
synthesize bulk mesoporous titanosilicates using the process developed by Rahman(347).
High surface areas were obtained for all the titanosilicates synthesized, although it
decreased with increasing titania content due to a loss in long-range order in the
materials. The bulk materials had pore sizes above 2 nm, but the pore size decreased with
increasing titania content, as observed by Rahman(347). Diffuse reflectance UV-visible
spectroscopy showed that a mixture consisting of primarily tetra-coordinated titania sites

182
and some higher coordination sites was present in the titanosilicates. The tetra-
coordinated sites are known to be responsible for catalyzing the epoxidation reactions of
alkenes. The catalytic activity of the titanosilicates synthesized was measured by a
collaborator, Dr. Janet Mohandas, and compared with the titania-containing zeolite TS-1
for styrene epoxidation. It was found that the titanosilicates showed decreasing selectivity
towards the epoxidized product with increasing titania content. This may have occurred
due to formation of titania sites with higher coordinated states, which catalyze complete
oxidation or polymerization. The conversion after 5 hours of reaction dropped
significantly for the highest amount of titania (~7.4 mol%) while remaining almost the
same at lower titania contents. The sudden drop may have resulted from collapse of
mesostructure leading to smaller accessibility of the titania sites. It was found that
titanosilicate containing the least (1.14 mol%) titania had more than twice the turnover
number per titania site compared to TS-1 containing 2.9 mol% titanium. The higher
turnover number may have resulted from highly accessible large pores in mesoporous
materials as well as the larger surface area (nearly three times) of the mesoporous
materials compared with TS-1. The selectivity for styrene epoxide was found to be
similar to TS-1, with the mesoporous titanosilicate with the lowest titanium content
showing 3% higher selectivity.
The concept of sugar surfactant complexation with titania precursor was extended
further with an aim to synthesize nonporous spherical, uniformly sized particles with
titania incorporation at their surface. It was found that through surfactant complexation,
titania could be incorporated in the particle structure in a one pot synthesis procedure.
However, the titania/C8G1 complex formed during synthesis appeared to be very strong,
183
and calcination at 550 ˚C was necessary to remove the surfactant from the titania sites.
Such nonporous particles could potentially serve as adsorbents for sugar separations, or
as highly accessible catalysts. Some of the potential applications of the work
demonstrated in the dissertation are discussed in the next section.
7.2. Future work
Chapter 3 discussed a thermodynamic model for non-ideal mixing of surfactants
which could be applied to ITC data of mixed surfactants. The applicability of such a
model lies in the prediction of mixed cmcs and thermodynamic mixing behavior based on
calorimetric data. It is possible to refine the model further by developing a better model
for enthalpy of dilution. It may be possible to develop and test a model for micellar
surfactant dilution that is better parameterized and better understood. It is also necessary
to study the universal applicability of the model by collecting more data on various
binary surfactant mixtures and utilizing the model to fit the data. The model could also
be used in the future to develop new ITC protocols to most efficiently measure nonideal
mixing in surfactant mixtures. The model should be applicable to both ideal and non-
ideal systems.
In chapter 4 a new and versatile method to imprint Stöber particle surfaces using
surfactants was discussed. It was observed during the study that adding surfactants just
around the time when silica particles start precipitating gives the best imprinting
effectiveness. Various saccharide surfactants were used to imprint the Stöber particles to
demonstrate versatility of the process. Non-specific adsorption of molecules which were
not targeted was also observed. A future project to determine the possibility of blocking

184
non-specific adsorption sites may be necessary and useful to enhance the selectivity of
the materials towards the target compound, for instance for sensing applications.
In chapter 5 it was shown that the imprinted particles also demonstrate chiral
selectivity. The materials were imprinted for a monosaccharide (D-glucose) and
disaccharide (D-maltose). Through imprinting of Stöber particles not only chiral
selectivity was demonstrated, but also the versatility of the process to use bulkier
molecules for imprinting was seen. Use of still bulkier molecules (such as
polysaccharides and polypeptides) could be explored using this molecular imprinting
approach, and it may be possible to imprint Stöber particles for proteins. Chiral
selectivity may also help in separation of amino acids and peptides with small structural
differences for use in the pharmaceutical separations industry. The effectiveness of such
materials could also be improved by blocking non-specific adsorption sites.
In chapter 6, the use of saccharide surfactants was demonstrated for stabilizing and
dispersing titania at the surface of a mesoporous silica framework. It was shown that
ligand assisted titania stabilization could be utilized to synthesize porous thin films,
porous bulk materials and titania incorporated Stöber particles. As suggested by
Rahman(347) there is possibility of utilizing the ligand assisted stabilization to
incorporate other transition metals incluing vanadium, zirconium etc. for applications in
catalysis and electronics. It was also shown in chapter 6 that it was possible to
incorporate titania on the surface of Stöber particles by adding surfactant complexed
titania precursor around the time of precipitation of the particles. It was observed that it
was difficult to remove complexed surfactant through washing and Soxhlet extraction.
Difficulty in surfactant removal may prove advantageous in this case, where the non-

185
specific hydroxyl groups on silica surface could be blocked. Harsher extraction methods
then could be utilized to remove complexed surfactant. It was also observed that when
calcined, FTIR peak associated with hydroxyl groups on silica surface reduced in
intensity leaving behind some residual intensity associated with Ti-O-Si vibrations. A
study on the effects of titania incorporation in particles on adsorption and selectivity of
saccharides could be conducted and the results could be compared with imprinted Stöber
particles. A study on chiral selectivity of titania sites also needs to be conducted. Titania
sites if found to be chirally selective could be used for asymmetric catalysis. The titania
incorporated particles are nonporous and hence low diffusion resistance encountered
could be useful in catalysis of large molecules.

186
Copyright © Suvid Joshi 2014
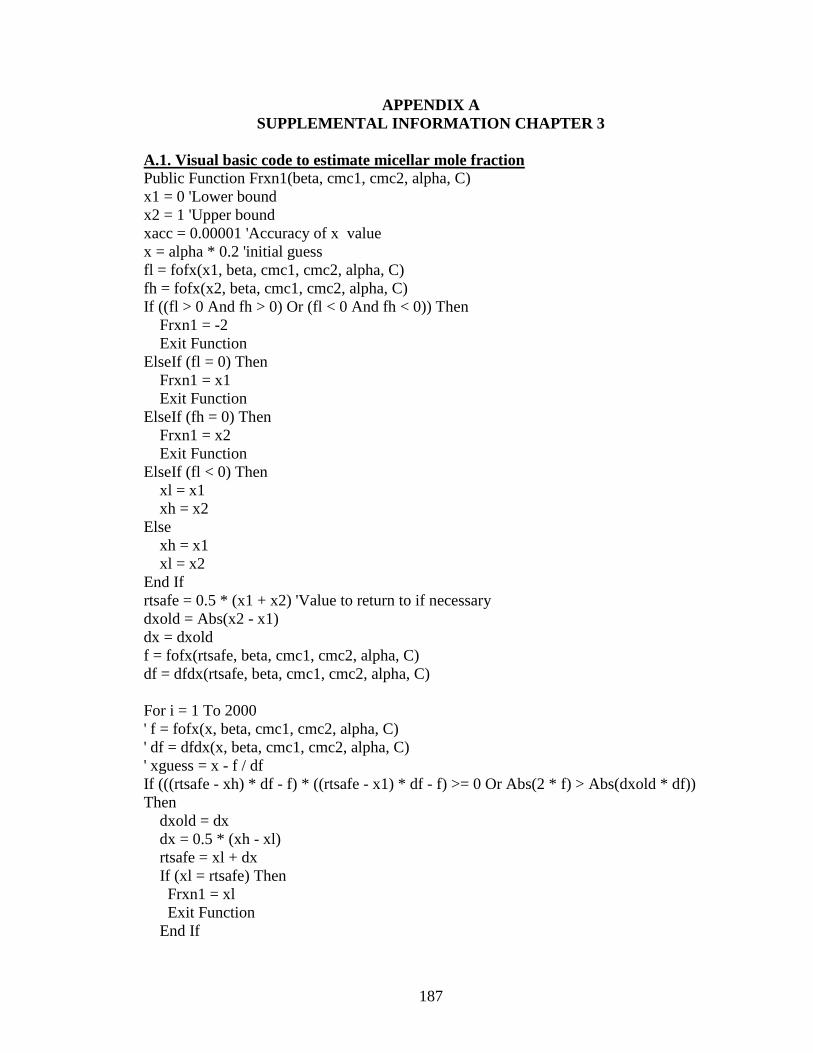
187
APPENDIX A
SUPPLEMENTAL INFORMATION CHAPTER 3
A.1. Visual basic code to estimate micellar mole fraction
Public Function Frxn1(beta, cmc1, cmc2, alpha, C)
x1 = 0 'Lower bound
x2 = 1 'Upper bound
xacc = 0.00001 'Accuracy of x value
x = alpha * 0.2 'initial guess
fl = fofx(x1, beta, cmc1, cmc2, alpha, C)
fh = fofx(x2, beta, cmc1, cmc2, alpha, C)
If ((fl > 0 And fh > 0) Or (fl < 0 And fh < 0)) Then
Frxn1 = -2
Exit Function
ElseIf (fl = 0) Then
Frxn1 = x1
Exit Function
ElseIf (fh = 0) Then
Frxn1 = x2
Exit Function
ElseIf (fl < 0) Then
xl = x1
xh = x2
Else
xh = x1
xl = x2
End If
rtsafe = 0.5 * (x1 + x2) 'Value to return to if necessary
dxold = Abs(x2 - x1)
dx = dxold
f = fofx(rtsafe, beta, cmc1, cmc2, alpha, C)
df = dfdx(rtsafe, beta, cmc1, cmc2, alpha, C)
For i = 1 To 2000
' f = fofx(x, beta, cmc1, cmc2, alpha, C)
' df = dfdx(x, beta, cmc1, cmc2, alpha, C)
' xguess = x - f / df
If (((rtsafe - xh) * df - f) * ((rtsafe - x1) * df - f) >= 0 Or Abs(2 * f) > Abs(dxold * df))
Then
dxold = dx
dx = 0.5 * (xh - xl)
rtsafe = xl + dx
If (xl = rtsafe) Then
Frxn1 = xl
Exit Function
End If
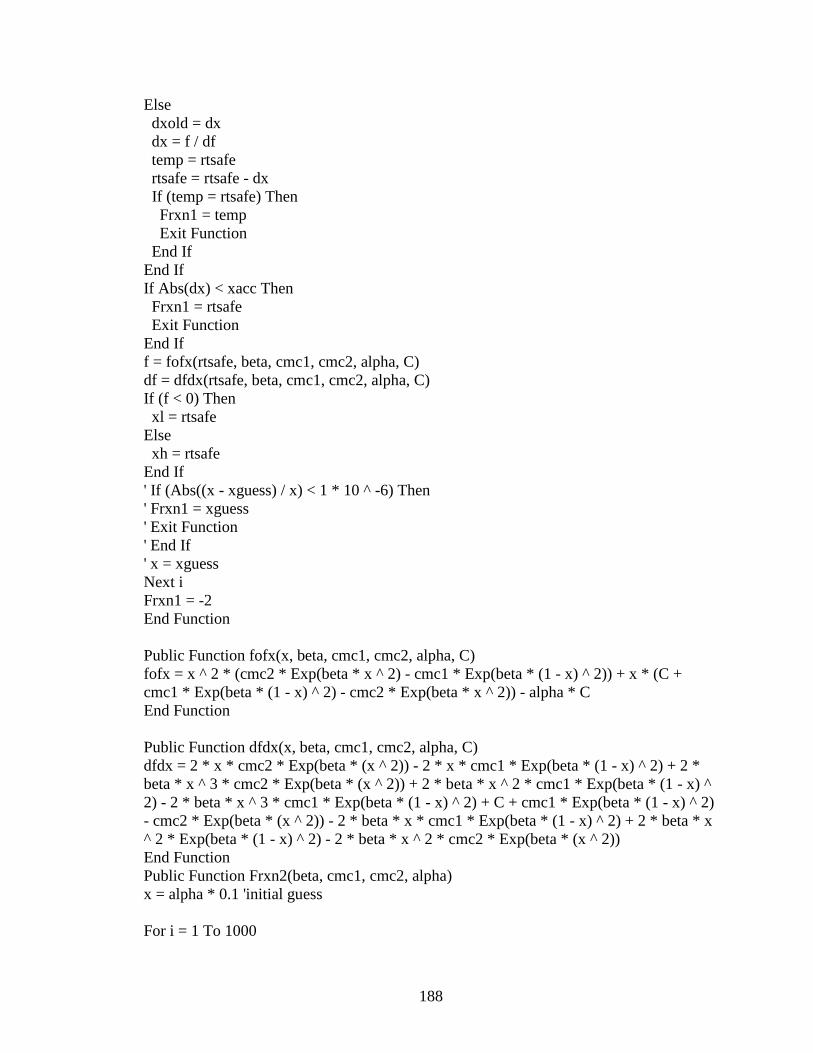
188
Else
dxold = dx
dx = f / df
temp = rtsafe
rtsafe = rtsafe - dx
If (temp = rtsafe) Then
Frxn1 = temp
Exit Function
End If
End If
If Abs(dx) < xacc Then
Frxn1 = rtsafe
Exit Function
End If
f = fofx(rtsafe, beta, cmc1, cmc2, alpha, C)
df = dfdx(rtsafe, beta, cmc1, cmc2, alpha, C)
If (f < 0) Then
xl = rtsafe
Else
xh = rtsafe
End If
' If (Abs((x - xguess) / x) < 1 * 10 ^ -6) Then
' Frxn1 = xguess
' Exit Function
' End If
' x = xguess
Next i
Frxn1 = -2
End Function
Public Function fofx(x, beta, cmc1, cmc2, alpha, C)
fofx = x ^ 2 * (cmc2 * Exp(beta * x ^ 2) - cmc1 * Exp(beta * (1 - x) ^ 2)) + x * (C +
cmc1 * Exp(beta * (1 - x) ^ 2) - cmc2 * Exp(beta * x ^ 2)) - alpha * C
End Function
Public Function dfdx(x, beta, cmc1, cmc2, alpha, C)
dfdx = 2 * x * cmc2 * Exp(beta * (x ^ 2)) - 2 * x * cmc1 * Exp(beta * (1 - x) ^ 2) + 2 *
beta * x ^ 3 * cmc2 * Exp(beta * (x ^ 2)) + 2 * beta * x ^ 2 * cmc1 * Exp(beta * (1 - x) ^
2) - 2 * beta * x ^ 3 * cmc1 * Exp(beta * (1 - x) ^ 2) + C + cmc1 * Exp(beta * (1 - x) ^ 2)
- cmc2 * Exp(beta * (x ^ 2)) - 2 * beta * x * cmc1 * Exp(beta * (1 - x) ^ 2) + 2 * beta * x
^ 2 * Exp(beta * (1 - x) ^ 2) - 2 * beta * x ^ 2 * cmc2 * Exp(beta * (x ^ 2))
End Function
Public Function Frxn2(beta, cmc1, cmc2, alpha)
x = alpha * 0.1 'initial guess
For i = 1 To 1000

189
f = -(beta * (x ^ 2) * ((1 - x) ^ 2)) + (((1 - x) ^ 2) * Log(((1 - alpha) * x * cmc1 *
Exp(beta * ((1 - x) ^ 2))) / (alpha * (1 - x) * cmc2)))
df = -((2 * beta * x * ((1 - x) ^ 2)) - (2 * (1 - x) * beta * (x ^ 2))) - 2 * (1 - x) * Log((1 -
alpha) * x * cmc1 * Exp(beta * (1 - x) ^ 2)) + (((1 - x) ^ 3 * alpha * cmc2) / ((1 - alpha) *
x * cmc1 * Exp(beta * (1 - x) ^ 2))) * ((((1 - alpha) * cmc1 * Exp(beta * (1 - x) ^ 2) -
Exp(beta * (1 - x) ^ 2) * 2 * (1 - x)) / (alpha * (1 - x) * cmc2)) + ((1 - alpha) * x * cmc1 *
Exp(beta * (1 - x) ^ 2)) / (alpha * (1 - x) ^ 2 * cmc2))
xguess = x - f / df
If (Abs((x - xguess) / x) < 1 * 10 ^ -6) Then
Frxn2 = xguess
Exit Function
End If
x = xguess
Next i
End Function

190
A.2 Supplemental information
Due to coupling effect observed between enthalpy of demicellization and first order terms
in enthalpy of dilution, a third model (Model 3) was tried which had fixed values of
enthalpy of demicellization for the pure surfactants CTAB and C8G1. The obtained
figures for fitting are shown below in Figure A.2. While it was observed that the obtained
fit matched the data well, large variability was seen for first order parameters associated
with enthalpy of dilution. A regression value higher than Model 1 and comparable to
Model 2 for the curves was obtained, β was found to deviate even more from literature
reported values compared to β obtained from Model 2. The obtained parameters for
enthalpy of dilution, cmcs and enthalpies of demicellization for pure surfactants along
with their variability are shown in Table A.1.
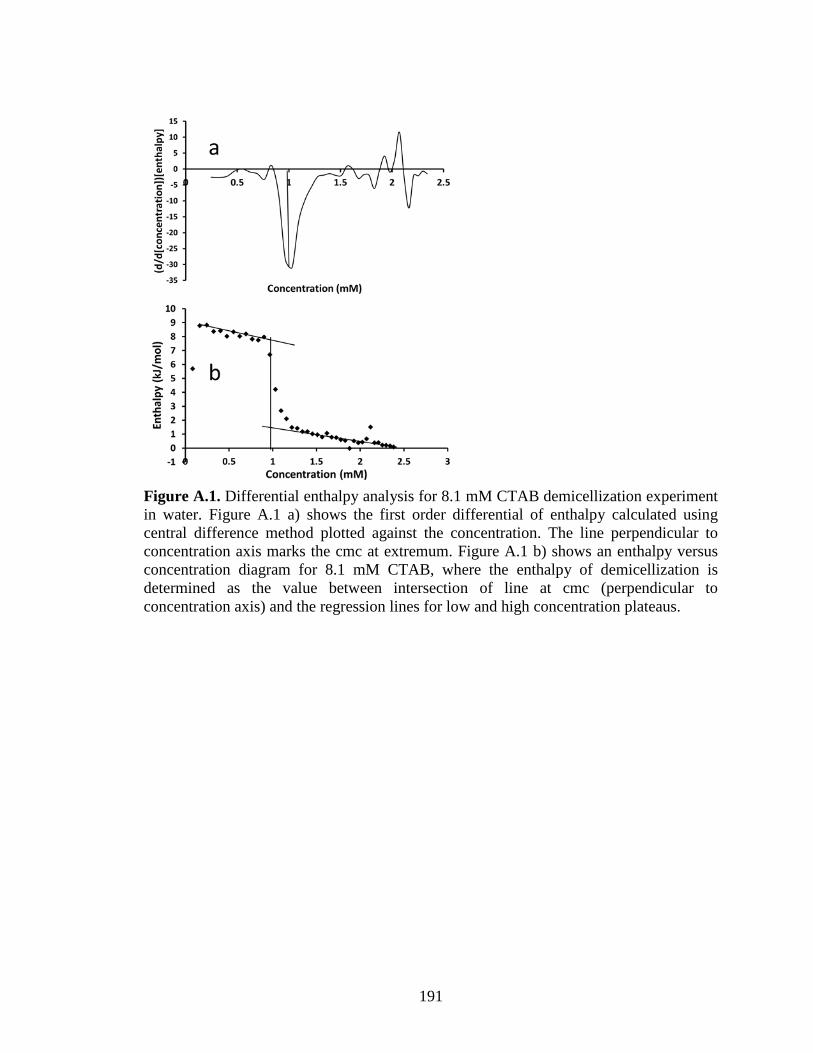
191
Figure A.1. Differential enthalpy analysis for 8.1 mM CTAB demicellization experiment
in water. Figure A.1 a) shows the first order differential of enthalpy calculated using
central difference method plotted against the concentration. The line perpendicular to
concentration axis marks the cmc at extremum. Figure A.1 b) shows an enthalpy versus
concentration diagram for 8.1 mM CTAB, where the enthalpy of demicellization is
determined as the value between intersection of line at cmc (perpendicular to
concentration axis) and the regression lines for low and high concentration plateaus.
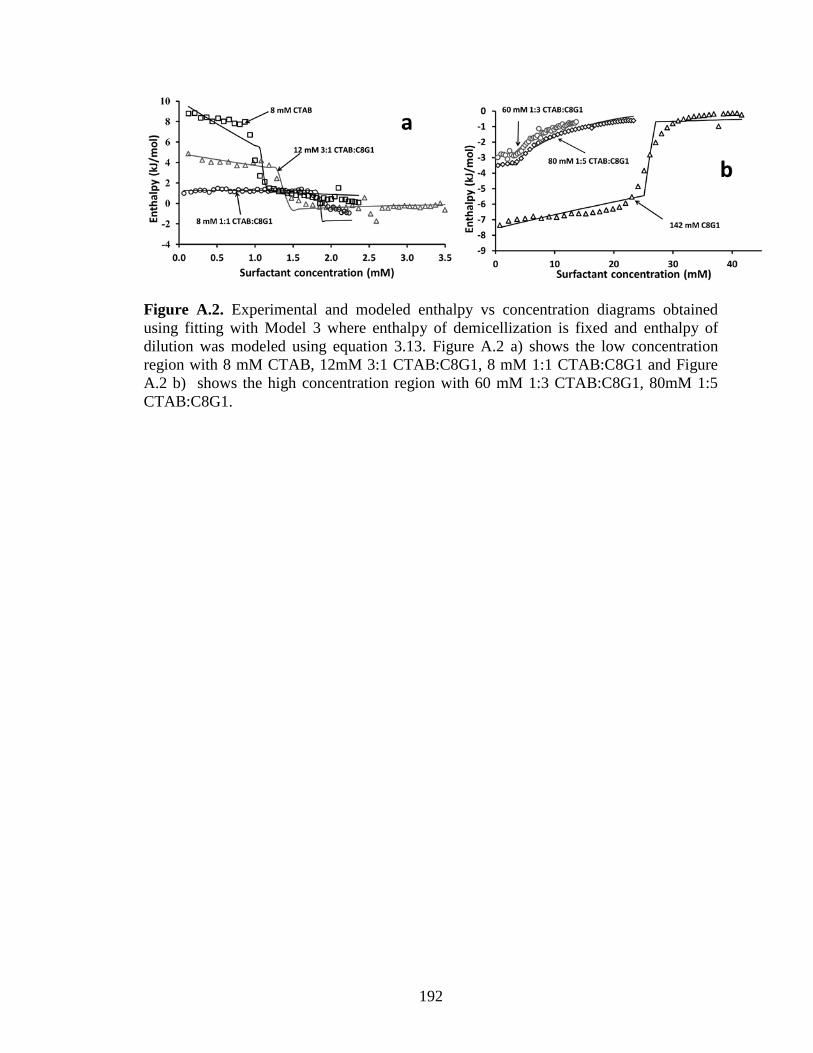
192
Figure A.2. Experimental and modeled enthalpy vs concentration diagrams obtained
using fitting with Model 3 where enthalpy of demicellization is fixed and enthalpy of
dilution was modeled using equation 3.13. Figure A.2 a) shows the low concentration
region with 8 mM CTAB, 12mM 3:1 CTAB:C8G1, 8 mM 1:1 CTAB:C8G1 and Figure
A.2 b) shows the high concentration region with 60 mM 1:3 CTAB:C8G1, 80mM 1:5
CTAB:C8G1.
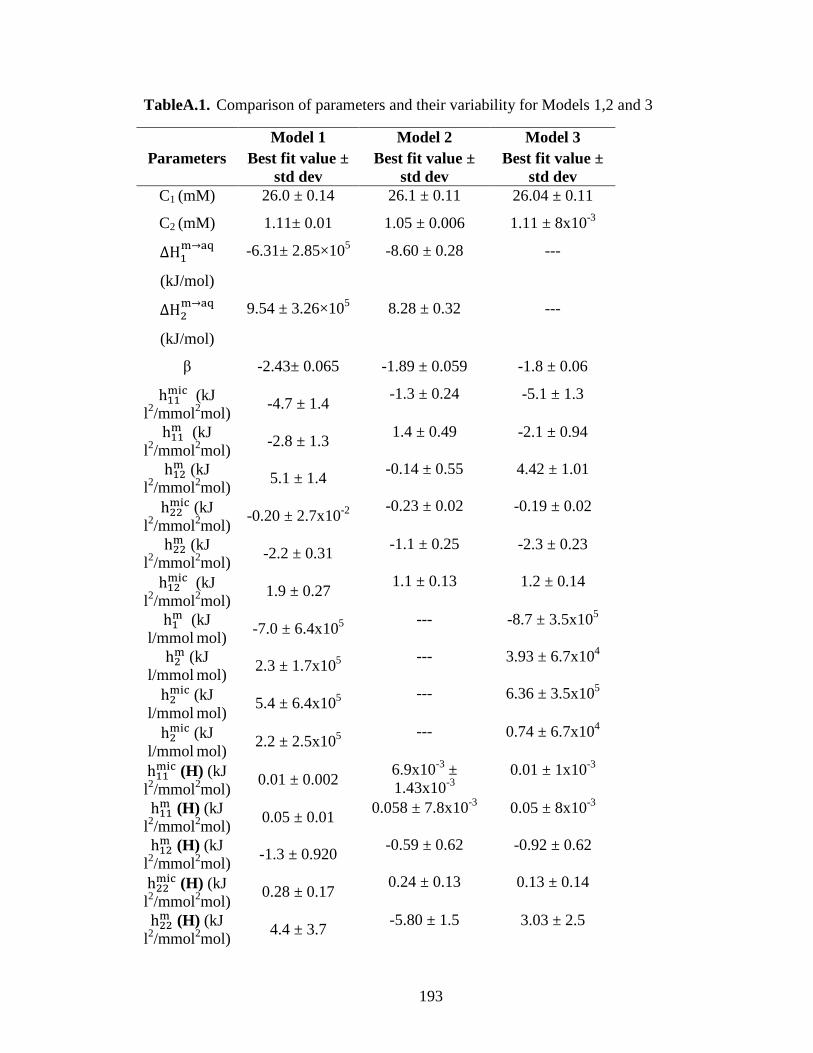
193
TableA.1. Comparison of parameters and their variability for Models 1,2 and 3
Model 1 Model 2 Model 3
Parameters Best fit value ±
std dev
Best fit value ±
std dev
Best fit value ±
std dev
C1 (mM) 26.0 ± 0.14 26.1 ± 0.11 26.04 ± 0.11
C2 (mM) 1.11± 0.01 1.05 ± 0.006 1.11 ± 8x10⁻³
(kJ/mol)
-6.31± 2.85×10⁵ -8.60 ± 0.28 ---
(kJ/mol)
9.54 ± 3.26×10⁵ 8.28 ± 0.32 ---
β -2.43± 0.065 -1.89 ± 0.059 -1.8 ± 0.06
(kJ
l2/mmol
2mol)
-4.7 ± 1.4 -1.3 ± 0.24 -5.1 ± 1.3
(kJ
l2/mmol
2mol)
-2.8 ± 1.3 1.4 ± 0.49 -2.1 ± 0.94
(kJ
l2/mmol
2mol)
5.1 ± 1.4 -0.14 ± 0.55 4.42 ± 1.01
(kJ
l2/mmol
2mol)
-0.20 ± 2.7x10⁻²
-0.23 ± 0.02 -0.19 ± 0.02
(kJ
l2/mmol
2mol)
-2.2 ± 0.31 -1.1 ± 0.25 -2.3 ± 0.23
(kJ
l2/mmol
2mol)
1.9 ± 0.27 1.1 ± 0.13 1.2 ± 0.14
(kJ
l/mmol mol)
-7.0 ± 6.4x10⁵
--- -8.7 ± 3.5x10⁵
(kJ
l/mmol mol)
2.3 ± 1.7x10⁵
--- 3.93 ± 6.7x10⁴
(kJ
l/mmol mol)
5.4 ± 6.4x10⁵
--- 6.36 ± 3.5x10⁵
(kJ
l/mmol mol)
2.2 ± 2.5x10⁵
--- 0.74 ± 6.7x10⁴
(H) (kJ
l2/mmol
2mol)
0.01 ± 0.002 6.9x10
-3 ±
1.43x10⁻³
0.01 ± 1x10⁻³
(H) (kJ
l2/mmol
2mol)
0.05 ± 0.01 0.058 ± 7.8x10
-3 0.05 ± 8x10
-3
(H) (kJ
l2/mmol
2mol)
-1.3 ± 0.920 -0.59 ± 0.62 -0.92 ± 0.62
(H) (kJ
l2/mmol
2mol)
0.28 ± 0.17 0.24 ± 0.13 0.13 ± 0.14
(H) (kJ
l2/mmol
2mol)
4.4 ± 3.7 -5.80 ± 1.5 3.03 ± 2.5
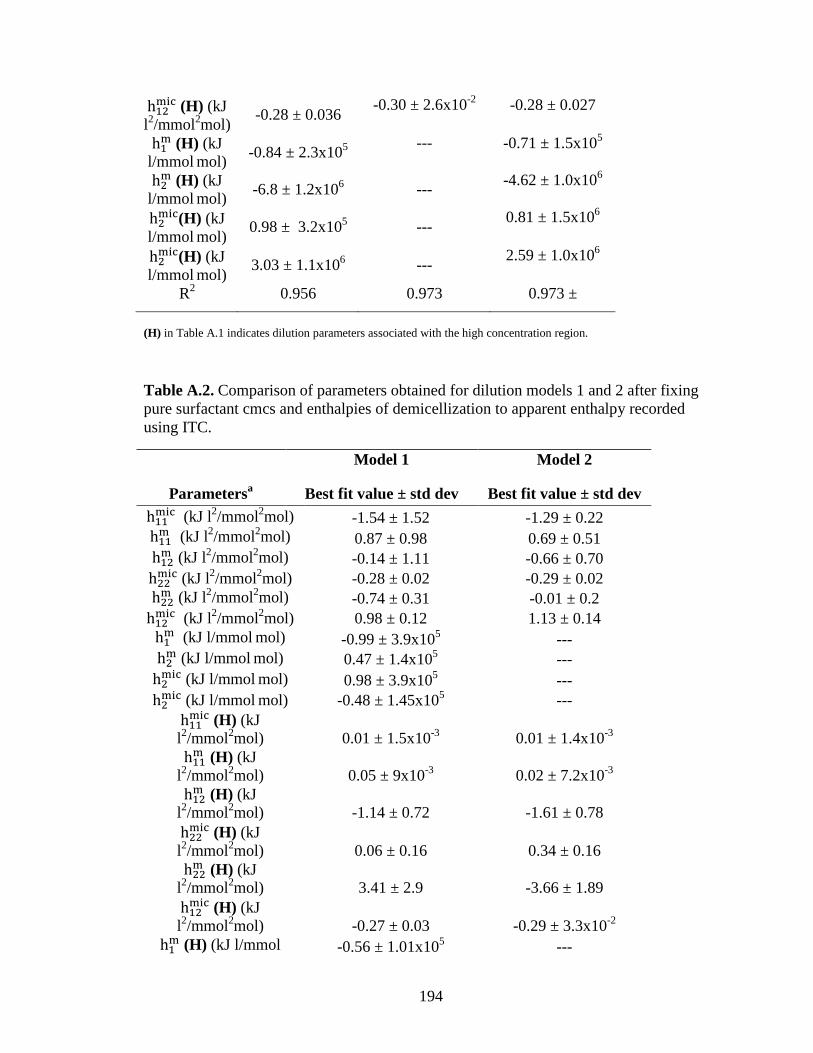
194
(H) (kJ
l2/mmol
2mol)
-0.28 ± 0.036 -0.30 ± 2.6x10
-2 -0.28 ± 0.027
(H) (kJ
l/mmol mol)
-0.84 ± 2.3x10⁵
--- -0.71 ± 1.5x10⁵
(H) (kJ
l/mmol mol)
-6.8 ± 1.2x10⁶ ---
-4.62 ± 1.0x10⁶
(H) (kJ
l/mmol mol)
0.98 ± 3.2x10⁵ ---
0.81 ± 1.5x10⁶
(H) (kJ
l/mmol mol)
3.03 ± 1.1x10⁶ ---
2.59 ± 1.0x10⁶
R2 0.956 0.973 0.973 ±
(H) in Table A.1 indicates dilution parameters associated with the high concentration region.
Table A.2. Comparison of parameters obtained for dilution models 1 and 2 after fixing
pure surfactant cmcs and enthalpies of demicellization to apparent enthalpy recorded
using ITC.
Model 1 Model 2
Parametersa Best fit value ± std dev Best fit value ± std dev
(kJ l
2/mmol
2mol) -1.54 ± 1.52 -1.29 ± 0.22
(kJ l
2/mmol
2mol) 0.87 ± 0.98 0.69 ± 0.51
(kJ l
2/mmol
2mol) -0.14 ± 1.11 -0.66 ± 0.70
(kJ l
2/mmol
2mol) -0.28 ± 0.02 -0.29 ± 0.02
(kJ l
2/mmol
2mol) -0.74 ± 0.31 -0.01 ± 0.2
(kJ l
2/mmol
2mol) 0.98 ± 0.12 1.13 ± 0.14
(kJ l/mmol
mol) -0.99 ± 3.9x10
5 ---
(kJ l/mmol
mol) 0.47 ± 1.4x10
5 ---
(kJ l/mmol
mol) 0.98 ± 3.9x10
5 ---
(kJ l/mmol
mol) -0.48 ± 1.45x10
5 ---
(H) (kJ
l2/mmol
2mol) 0.01 ± 1.5x10
-3 0.01 ± 1.4x10
-3
(H) (kJ
l2/mmol
2mol) 0.05 ± 9x10
-3 0.02 ± 7.2x10
-3
(H) (kJ
l2/mmol
2mol) -1.14 ± 0.72 -1.61 ± 0.78
(H) (kJ
l2/mmol
2mol) 0.06 ± 0.16 0.34 ± 0.16
(H) (kJ
l2/mmol
2mol) 3.41 ± 2.9 -3.66 ± 1.89
(H) (kJ
l2/mmol
2mol) -0.27 ± 0.03 -0.29 ± 3.3x10
-2
(H) (kJ l/mmol
-0.56 ± 1.01x10
5 ---
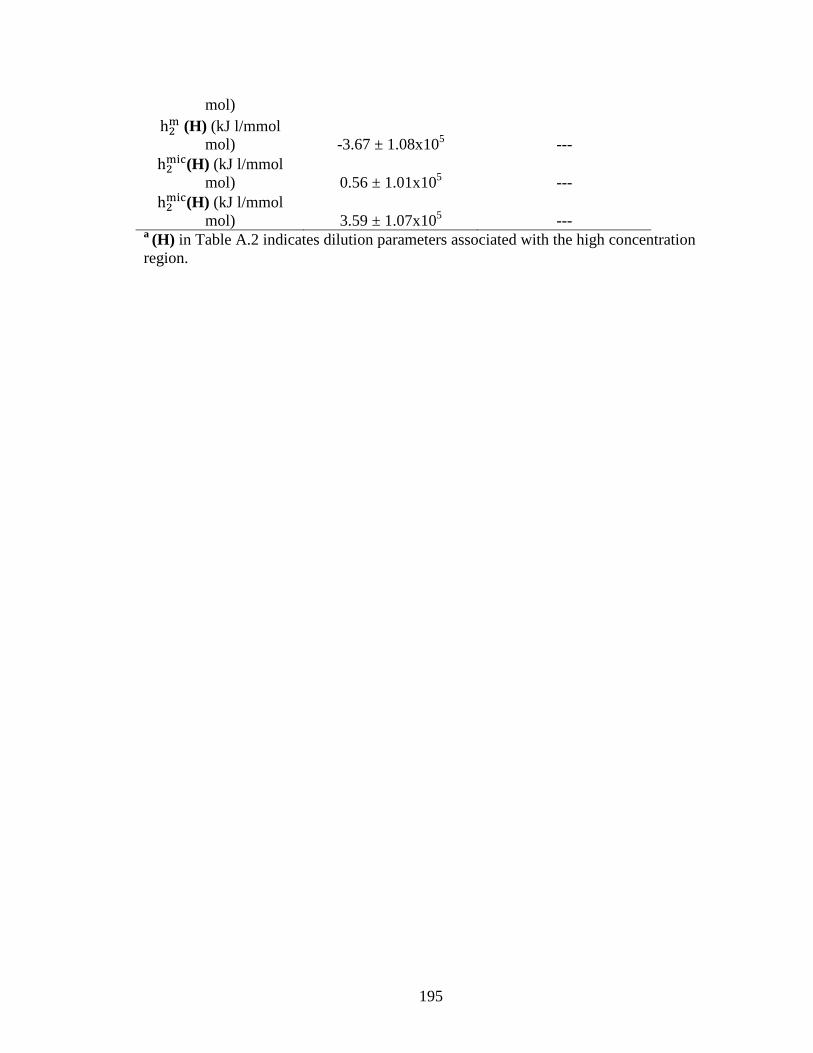
195
mol)
(H) (kJ l/mmol
mol) -3.67 ± 1.08x10⁵ ---
(H) (kJ l/mmol
mol) 0.56 ± 1.01x10⁵ ---
(H) (kJ l/mmol
mol) 3.59 ± 1.07x10⁵ ---
a (H) in Table A.2 indicates dilution parameters associated with the high concentration
region.
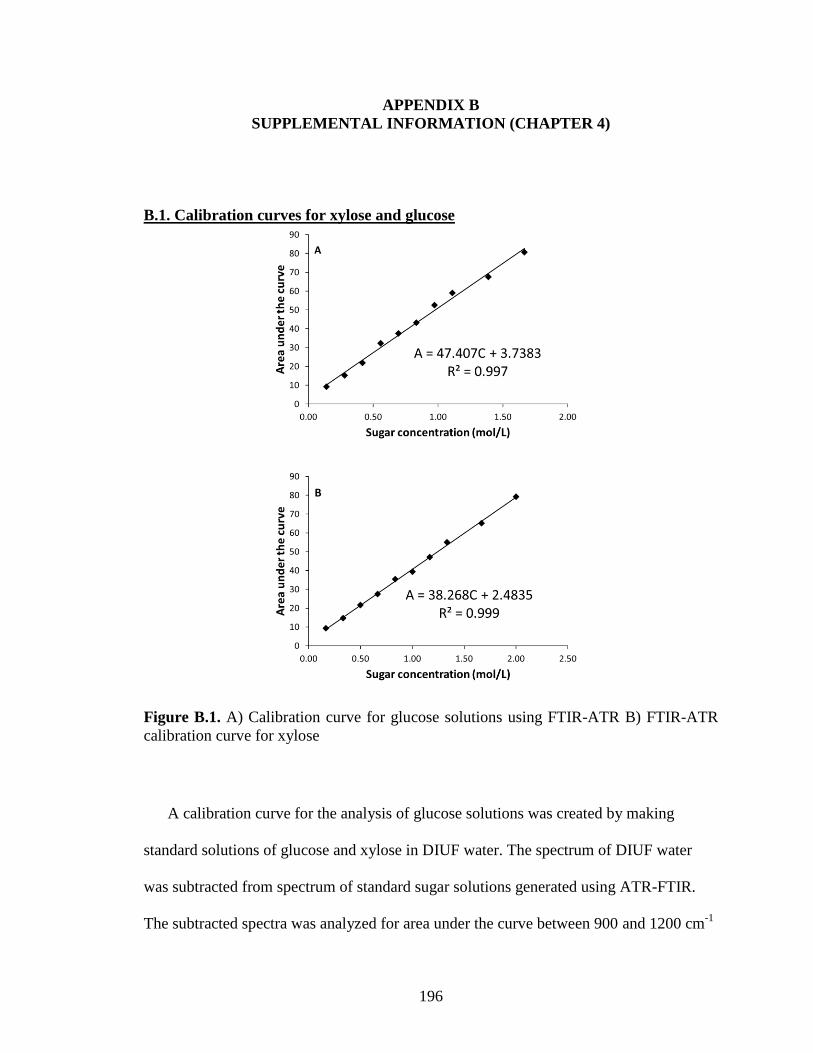
196
APPENDIX B
SUPPLEMENTAL INFORMATION (CHAPTER 4)
B.1. Calibration curves for xylose and glucose
Figure B.1. A) Calibration curve for glucose solutions using FTIR-ATR B) FTIR-ATR
calibration curve for xylose
A calibration curve for the analysis of glucose solutions was created by making
standard solutions of glucose and xylose in DIUF water. The spectrum of DIUF water
was subtracted from spectrum of standard sugar solutions generated using ATR-FTIR.
The subtracted spectra was analyzed for area under the curve between 900 and 1200 cm-1

197
was measured for each substrates spectrum. Linear regression was used to generate
calibration curves shown for each sugar. The supernatant sugar solutions collected after
adsorption were analyzed using the same ATR-FTIR technique. Sugar solutions were
transferred to the ATR accessory until the surface of the zinc selenide crystal was
covered completely with the solution. The solutions were then analyzed from 700 cm-1
to
4000 cm-1
. The FTIR spectrum of DIUF water was collected and subtracted from each
sugar solution absorption data in the same wave number region. The area under the curve
from 900 to 1200 cm-1
was used to determine the concentration of the sugar from the
calibration curves in Figure S-1.
Figure B.2. SEM micrograph of Stöber particles with dilute ammonia and no surfactant
(1), prepared with only CTAB (2), prepared with only C8G1 (3). All the micrographs
displayed here show uniformly sized particles with spherical shape. The particles are
homogenous. All the micrographs have been obtained at a magnification of 45000x.
1 2 3
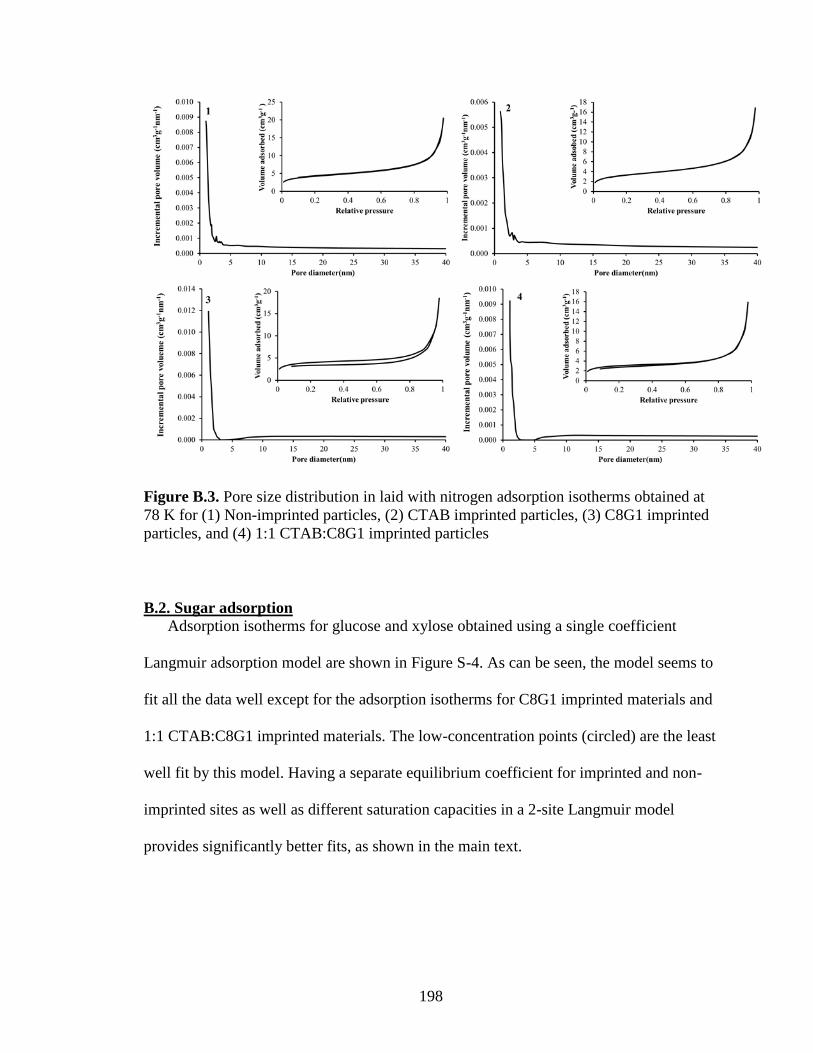
198
Figure B.3. Pore size distribution in laid with nitrogen adsorption isotherms obtained at
78 K for (1) Non-imprinted particles, (2) CTAB imprinted particles, (3) C8G1 imprinted
particles, and (4) 1:1 CTAB:C8G1 imprinted particles
B.2. Sugar adsorption
Adsorption isotherms for glucose and xylose obtained using a single coefficient
Langmuir adsorption model are shown in Figure S-4. As can be seen, the model seems to
fit all the data well except for the adsorption isotherms for C8G1 imprinted materials and
1:1 CTAB:C8G1 imprinted materials. The low-concentration points (circled) are the least
well fit by this model. Having a separate equilibrium coefficient for imprinted and non-
imprinted sites as well as different saturation capacities in a 2-site Langmuir model
provides significantly better fits, as shown in the main text.

199
Figure B.4. Comparison of adsorption isotherms for D-glucose and D-xylose adsorbing
from aqueous solution onto (1) non-imprinted particles, (2) particles prepared with
CTAB, (3) particles prepared with C8G1, and (4) particles prepared with a 1:1 mixture of
CTAB:C8G1. The points which do not fit using a one-site Langmuir isotherm are circled.
1
3
4
2

200
Figure B.5. SEM micrographs of washed samples prepared by addition of different ratios
of surfactants 1 minute after TEOS addition. The sample numbers are indicated on the
micrograph: 6) 1:3 CTAB:C8G1, 7) 3:1 CTAB:C8G1 and 8) 1:1 CTAB:C8G1.

201
Figure B.6. Nitrogen adsorption isotherms and pore size distribution curves for samples
synthesized to study effects of ratio and time of addition of surfactants. 5) Sample
prepared with no surfactant. 6) 1:3 CTAB:C8G1 added at 1 minute after TEOS addition.
7) 3:1 CTAB:C8G1 added 1 minute after TEOS addition. 8) 1:1 CTAB:C8G1 added 1
minute after TEOS addition. 9) 1:1 CTAB:C8G1 added 2.5 minute after TEOS addition.

202
10) 1:1 CTAB:C8G1 added 5 minute after TEOS addition. 11) 1:1 CTAB:C8G1 added 1
hour after TEOS addition. 12) 1:1 CTAB:C8G1 added 4 hours after TEOS addition.
Figure B.7. Comparison of glucose adsorption on the silica surface as a function of the
concentration in solution for samples with different surface area. LSA stands for low
surface area (samples 5 and 8) while HSA stands for high surface area (samples 1 and 4)
sample. Comparison of both 1:1 CTAB:C8G1 imprinted and non-imprinted materials has
been presented. It is observed that when the glucose adsorption is normalized with
respect to particle surface area similar amounts of glucose adsorption are observed.
Figure B.8. FTIR spectra for samples prepared with 1:3 CTAB:C8G1 (6) and 3:1
CTAB:C8G1 (7) showing the presence of CH2 stretching bands between 2800 and 3000
cm-1
. The spectra are shown before and after washing the particles. The spectra suggest
that it is possible to completely remove surfactant on the surface by washing the particles.
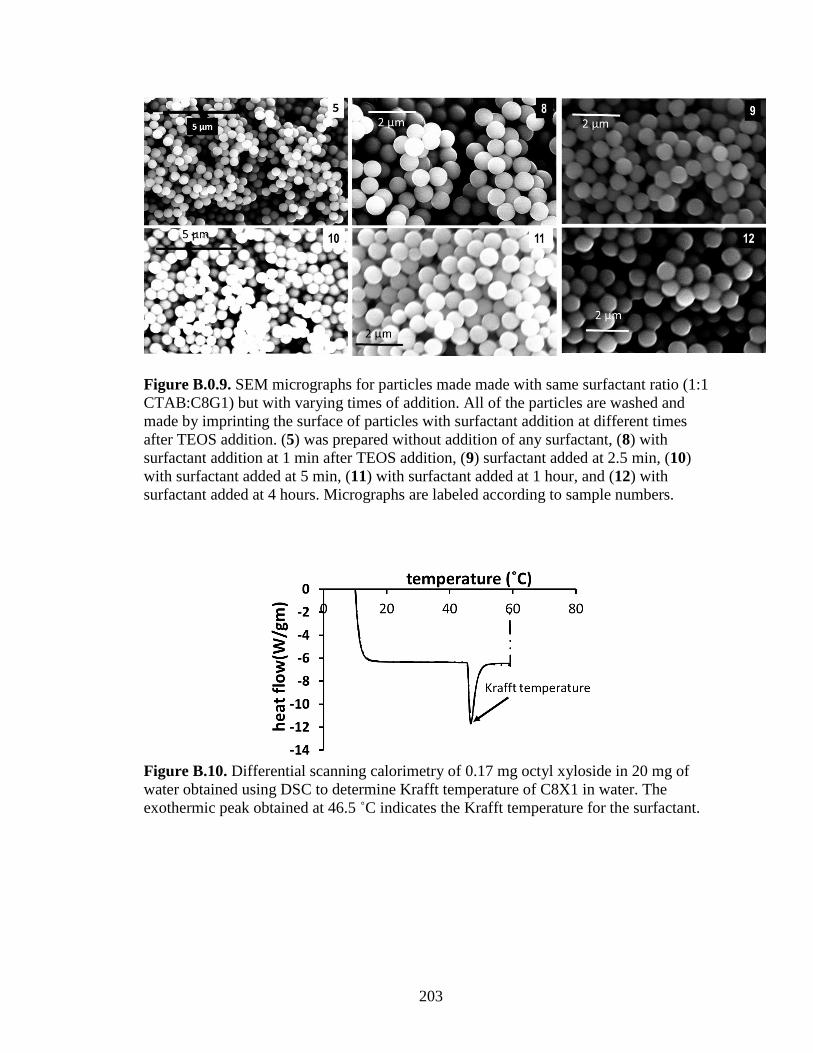
203
Figure B.0.9. SEM micrographs for particles made made with same surfactant ratio (1:1
CTAB:C8G1) but with varying times of addition. All of the particles are washed and
made by imprinting the surface of particles with surfactant addition at different times
after TEOS addition. (5) was prepared without addition of any surfactant, (8) with
surfactant addition at 1 min after TEOS addition, (9) surfactant added at 2.5 min, (10)
with surfactant added at 5 min, (11) with surfactant added at 1 hour, and (12) with
surfactant added at 4 hours. Micrographs are labeled according to sample numbers.
Figure B.10. Differential scanning calorimetry of 0.17 mg octyl xyloside in 20 mg of
water obtained using DSC to determine Krafft temperature of C8X1 in water. The
exothermic peak obtained at 46.5 ˚C indicates the Krafft temperature for the surfactant.
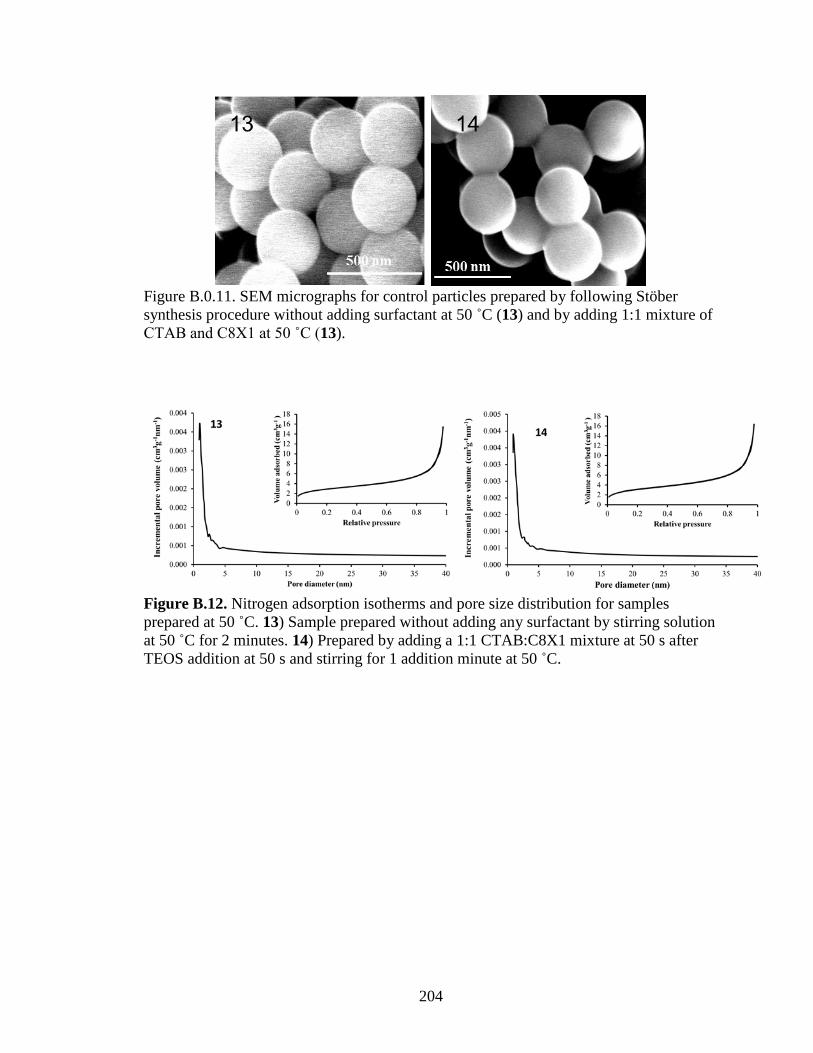
204
Figure B.0.11. SEM micrographs for control particles prepared by following Stöber
synthesis procedure without adding surfactant at 50 ˚C (13) and by adding 1:1 mixture of
CTAB and C8X1 at 50 ˚C (13).
Figure B.12. Nitrogen adsorption isotherms and pore size distribution for samples
prepared at 50 ˚C. 13) Sample prepared without adding any surfactant by stirring solution
at 50 ˚C for 2 minutes. 14) Prepared by adding a 1:1 CTAB:C8X1 mixture at 50 s after
TEOS addition at 50 s and stirring for 1 addition minute at 50 ˚C.

205
APPENDIX C
SUPPLEMENTAL INFORMATION (CHAPTER FIVE)
Figure C.1. Calibration curves obtained for hexose’s using FTIR-ATR by plotting area
under the curve between 900 and 1200 cm-1
against the concentration of sugars in mol/L.
A) D-Glucose, B) L-Glucose, C) D-Mannose, D) D-Galactose. The plotted points
represent average value of two measurements.

206
Figure C.2. Calibration curves for disaccharides using FTIR-ATR by plotting the area
under the curve between 900 and 1200 cm-1 against the concentration of disaccharides in
mol/L. E) D-Maltose, F) D-cellobiose. The plotted points in each case represent average
value of two measurements.
Figure C.3. Nitrogen adsorption isotherms and pore size distribution for Stöber particles
with A) no surfactant added and B) particles imprinted with 1:1 mixture of CTAB and
C8G1.

207
Figure C.4. Nitrogen adsorption isotherm and pore size distribution for Stöber particles
synthesized by adding 1:1 mixture of CTAB and C12G2.
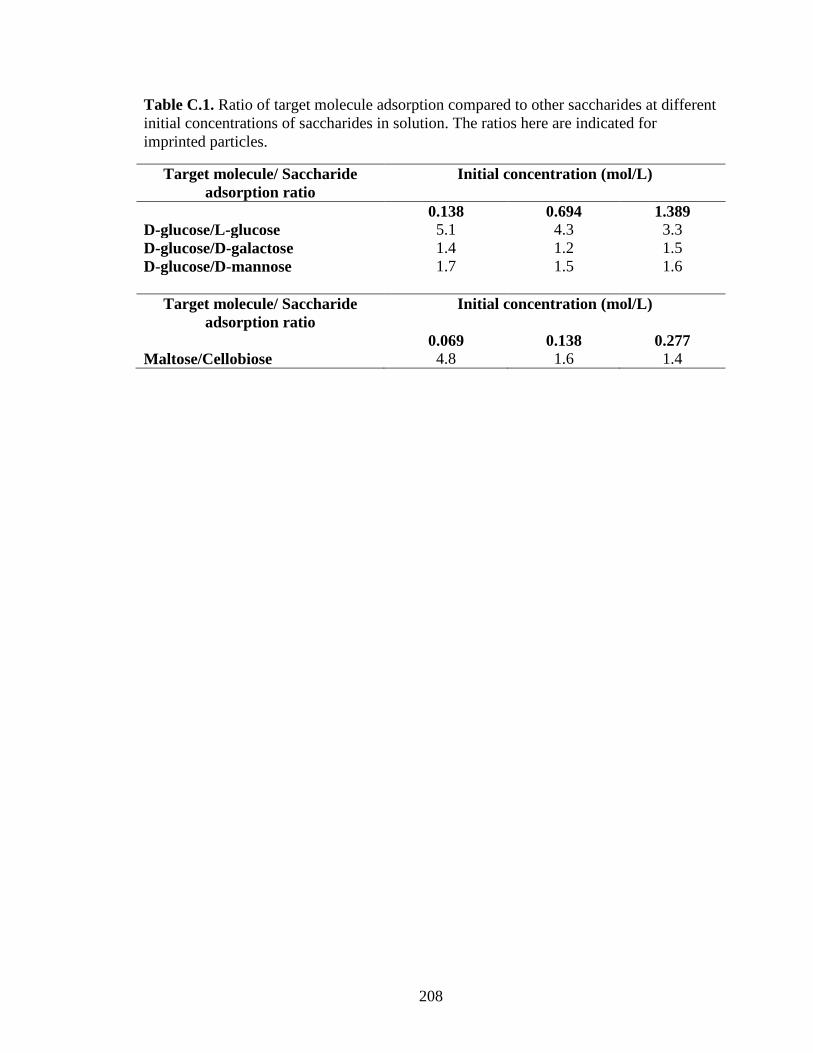
208
Table C.1. Ratio of target molecule adsorption compared to other saccharides at different
initial concentrations of saccharides in solution. The ratios here are indicated for
imprinted particles.
Target molecule/ Saccharide
adsorption ratio
Initial concentration (mol/L)
0.138 0.694 1.389
D-glucose/L-glucose 5.1 4.3 3.3
D-glucose/D-galactose 1.4 1.2 1.5
D-glucose/D-mannose 1.7 1.5 1.6
Target molecule/ Saccharide
adsorption ratio
Initial concentration (mol/L)
0.069 0.138 0.277
Maltose/Cellobiose 4.8 1.6 1.4

209
APPENDIX D
SUPPLEMENTAL INFORMATION (CHAPTER SIX)
Figure D.1. Stöber silica particles and titanosilicate Stöber particles calcined at 300 ˚C.
Band at 960 cm-1
is visible after calcination for titanosilicates but is absent in case of
silicates. CH2 stretching bands are clearly visible for titanosilicate particles between 2800
and 3000 cm-1
while are absent for calcined silica particles.

210
Figure D.2. Spectra of soxhlet ‘extracted’ titanosilicate particles and titanosilicate
particles ‘washed’ with three cycles with ethanol and three cycles with water till the pH
was 7. The spectra shows CH2 stretching bands between 2800 and 3000 cm-1
.

211
REFERENCES
(1) Desai, T. R., and Dixit, S. G. (1996) Interaction and viscous properties of aqueous
solutions of mixed cationic and nonionic surfactants. Journal of Colloid and
Interface Science 177, 471-477.
(2) Carnero Ruiz, C. (2008) Micellar properties and molecular interactions in binary
surfactant systems containing a sugar-based surfactant, in Sugar-based
surfactants pp 413-467, CRC Press, New-york.
(3) Kronberg, B. (1997) Surfactant mixtures. Current Opinion in Colloid & Interface
Science 2, 456-463.
(4) Shiloach, A., and Blankschtein, D. (1998) Predicting micellar solution properties
of binary surfactant mixtures. Langmuir 14, 1618-1636.
(5) Rahman, M. S., and Rankin, S. E. (2010) Predictive synthesis of ordered
mesoporous silica with maltoside and cationic surfactants based on aqueous
lyotropic phase behavior. Journal of Colloid and Interface Science 342, 33-42.
(6) Xing, R., and Rankin, S. E. (2007) Use of the ternary phase diagram of a mixed
cationic/glucopyranoside surfactant system to predict mesostructured silica
synthesis. Journal of Colloid and Interface Science 316, 930-938.
(7) Hines, J. D. (2001) Theoretical aspects of micellisation in surfactant mixtures.
Current opinion in colloid & interface science 6, 350-356.
(8) Carale, T. R., and Blankschtein, D. (1992) Theoretical and experimental
determinations of the crossover from dilute to semidilute regimes of micellar
solutions. Journal of Physical Chemistry 96, 459-467.

212
(9) Puvvada, S., and Blankschtein, D. (1990) Molecular thermodynamic approach to
predict micellization, phase behavior and phase separation of micellar solutions. I.
Application to nonionic surfactants. The Journal of chemical physics 92, 3710.
(10) Puvvada, S., and Blankschtein, D. (1992) Theoretical and experimental
investigations of micellar properties of aqueous-solutions containing binary-
mixtures of nonionic surfactants. Journal of Physical Chemistry 96, 5579-5592.
(11) Nagarajan, R. (1985) Molecular theory for mixed micelles. Langmuir 1, 331-341.
(12) Holland, P. M., and Rubingh, D. N. (1983) Nonideal Multicomponent Mixed
Micelle Model. Journal of Physical Chemistry 87, 1984-1990.
(13) Hoffmann, H., and Poessnecker, G. (1994) The Mixing Behavior of Surfactants.
Langmuir 10, 381-389.
(14) Dickey, F. H. (1949) The preparation of specific adsorbents. Proceedings of the
National Academy of Sciences of the United States of America 35, 227.
(15) Mosbach, K. (1994) Molecular imprinting. Trends in biochemical sciences 19, 9-
14.
(16) Alexander, C., Andersson, H. S., Andersson, L. I., Ansell, R. J., Kirsch, N.,
Nicholls, I. A., O'Mahony, J., and Whitcombe, M. J. (2006) Molecular imprinting
science and technology: a survey of the literature for the years up to and including
2003. Journal of Molecular Recognition 19, 106-180.
(17) Wulff, G. (1995) Molecular Imprinting in Cross-Linked Materials with the Aid of
Molecular Templates— A Way towards Artificial Antibodies. Angewandte
Chemie International Edition in English 34, 1812-1832.
213
(18) Wulff, G. (2001) Enzyme-like Catalysis by Molecularly Imprinted Polymers.
Chemical Reviews 102, 1-28.
(19) Díaz-García, M. E., and Laínño, R. B. (2005) Molecular Imprinting in Sol-Gel
Materials: Recent Developments and Applications. Microchimica Acta 149, 19-
36.
(20) Tanev, P. T., Chibwe, M., and Pinnavaia, T. J. (1994) Titanium-containing
mesoporous molecular sieves for catalytic oxidation of aromatic compounds.
Nature 368, 321-323.
(21) Corma, A., Navarro, M. T., and Pariente, J. P. (1994) Synthesis of an ultralarge
pore titanium silicate isomorphous to MCM-41 and its application as a catalyst for
selective oxidation of hydrocarbons. Journal of the Chemical Society, Chemical
Communications, 147-148.
(22) Stöber, W., Fink, A., and Bohn, E. (1968) Controlled growth of monodisperse
silica spheres in the micron size range. Journal of Colloid and Interface Science
26, 62-69.
(23) Ruiz, C. C. (2008) Sugar-based surfactants: fundamentals and applications, Vol.
143, CRC.
(24) Fischer, E. (1893) Ueber die Glucoside der Alkohole. Berichte der deutschen
chemischen Gesellschaft 26, 2400-2412.
(25) Nieendick, C., and Schmid, K.-H. (1995) Alkyl polyglycosides: a new generation
of surfactants for the use in manual dishwashing agents. Chimica oggi 13, 42-45.

214
(26) Marinova, K. G., and Denkov, N. D. (2001) Foam destruction by mixed solid-
liquid antifoams in solutions of alkyl glucoside: Electrostatic interactions and
dynamic effects. Langmuir 17, 2426-2436.
(27) Štangar, U. L., and Hüsing, N. (2003) Alkyl-glycoside surfactants in the synthesis
of mesoporous silica films. Silicon Chemistry 2, 157-165.
(28) Suzuki, K., Ando, T., Susaki, H., Mimori, K., Nakabayashi, S., and Sugiyama, Y.
(1999) Structural requirements for alkylglycoside-type renal targeting vector.
Pharmaceutical research 16, 1026-1034.
(29) Okada, T., Takeda, K., and Kouyama, T. (1998) Highly selective separation of
rhodopsin from bovine rod outer segment membranes using combination of
divalent cation and alkyl (thio) glucoside. Photochemistry and photobiology 67,
495-499.
(30) Shinoda, K., and Hutchinson, E. (1962) Pseudo-phase separation model for
thermodynamic calculations on micellar solutions. The Journal of Physical
Chemistry 66, 577-582.
(31) Mukerjee, P., Mysels, K., and Kapauan, P. (1967) Counterion specificity in the
formation of ionic micelles-size, hydration, and hydrophobic bonding effects. The
Journal of Physical Chemistry 71, 4166-4175.
(32) Boyd, B. J., Drummond, C. J., Krodkiewska, I., Weerawardena, A., Furlong, D.
N., and Grieser, F. (2001) Alkyl chain positional isomers of dodecyl β-D-
glucoside: Thermotropic and lyotropic phase behavior and detergency. Langmuir
17, 6100-6107.
215
(33) Bocker, T., and Thiem, J. (1989) Synthesis and properties for nonionic
surfactants. Tenside Surf Det 26, 318-323.
(34) Thiem, J., and Böcker, T. (1992) pp 123, Royal Society of Chemistry:
Cambridge.
(35) Fukada, K., Kawasaki, M., Seimiya, T., Abe, Y., Fujiwara, M., and Ohbu, K.
(2000) Stereochemical aspects of micellar properties of esterified glucoside
surfactants in water: apparent molar volume, adiabatic compressibility, and
aggregation number. Colloid and Polymer Science 278, 576-580.
(36) Garofalakis, G., Murray, B. S., and Sarney, D. B. (2000) Surface activity and
critical aggregation concentration of pure sugar esters with different sugar
headgroups. Journal of colloid and interface science 229, 391-398.
(37) Aveyard, R., Binks, B., Chen, J., Esquena, J., Fletcher, P., Buscall, R., and
Davies, S. (1998) Surface and colloid chemistry of systems containing pure sugar
surfactant. Langmuir 14, 4699-4709.
(38) Nilsson, F., Söderman, O., and Johansson, I. (1998) Four Different
C8G1Alkylglucosides. Anomeric Effects and the Influence of Straight vs
Branched Hydrocarbon Chains. Journal of colloid and interface science 203, 131-
139.
(39) Focher, B., Savelli, G., Torri, G., Vecchio, G., McKenzie, D., Nicoli, D., and
Bunton, C. (1989) Micelles of 1-alkyl glucoside and maltoside: Anomeric effects
on structure and induced chirality. Chemical Physics Letters 158, 491-494.
(40) Hoffmann, B., and Platz, G. (2001) Phase and aggregation behaviour of
alkylglycosides. Current opinion in colloid & interface science 6, 171-177.
216
(41) Holtzer, A., and Holtzer, M. F. (1974) Use of the van't Hoff relation in
determination of the enthalpy of micelle formation. The Journal of Physical
Chemistry 78, 1442-1443.
(42) Emerson, M. F., and Holtzer, A. (1967) Hydrophobic bond in micellar systems.
Effects of various additives on the stability of micelles of sodium dodecyl sulfate
and of n-dodecyltrimethylammonium bromide. The Journal of Physical
Chemistry 71, 3320-3330.
(43) Nilsson, F., Söderman, O., Hansson, P., and Johansson, I. (1998)
Physical−Chemical Properties of C9G1 and C10G1 β-Alkylglucosides. Phase
Diagrams and Aggregate Size/Structure. Langmuir 14, 4050-4058.
(44) Nilsson, F., Söderman, O., and Johansson, I. (1996) Physical−Chemical
Properties of the n-Octyl β-d-Glucoside/Water System. A Phase Diagram, Self-
Diffusion NMR, and SAXS Study. Langmuir 12, 902-908.
(45) Boyd, B. J., Drummond, C. J., Krodkiewska, I., and Grieser, F. (2000) How Chain
Length, Headgroup Polymerization, and Anomeric Configuration Govern the
Thermotropic and Lyotropic Liquid Crystalline Phase Behavior and the
Air−Water Interfacial Adsorption of Glucose-Based Surfactants. Langmuir 16,
7359-7367.
(46) Platz, G., Poelike, J., Thunig, C., Hofmann, R., Nickel, D., and von Rybinski, W.
(1995) Phase Behavior, Lyotropic Phases, and Flow Properties of Alkyl
Glycosides in Aqueous Solution. Langmuir 11, 4250-4255.

217
(47) Zhang, L., Somasundaran, P., and Maltesh, C. (1997) Adsorption of< i> n</i>-
Dodecyl-β-d-maltoside on Solids. Journal of colloid and interface science 191,
202-208.
(48) Giles, C. H., Smith, D., and Huitson, A. (1974) A general treatment and
classification of the solute adsorption isotherm. I. Theoretical. Journal of Colloid
and Interface Science 47, 755-765.
(49) Somasundaran, P., and Fuerstenau, D. W. (1966) Mechanisms of Alkyl Sulfonate
Adsorption at the Alumina-Water Interface1. The Journal of Physical Chemistry
70, 90-96.
(50) Lu, S., Bian, Y., Zhang, L., and Somasundaran, P. (2007) pH dependence of
adsorption of n-dodecyl-β-d-maltoside on solids. Journal of Colloid and Interface
Science 316, 310-316.
(51) Jakobs, B., Sottmann, T., Strey, R., Allgaier, J., Willner, L., and Richter, D.
(1999) Amphiphilic block copolymers as efficiency boosters for microemulsions.
Langmuir 15, 6707-6711.
(52) Kjellin, M., and Johansson, I. (2010) Surfactants from renewable resources, John
Wiley & Sons.
(53) Urbanski, R., Draye, M., Cote, G., and Szymanowski, J. (2000) Removal of
bisphenol A from aqueous streams by micellar extraction and ultrafiltration.
Solvent Extraction and Ion Exchange 18, 533-550.
(54) Stubenrauch, C. (2001) Sugar surfactants—aggregation, interfacial, and
adsorption phenomena. Current opinion in colloid & interface science 6, 160-170.
(55) Ogino, K., and Abe, M. (1993) Mixed surfactant systems, Vol. 46, CRC Press.

218
(56) Holmberg, K. (2004) Surfactant-templated nanomaterials synthesis. Journal of
Colloid and Interface Science 274, 355-364.
(57) Antonietti, M. (2001) Surfactants for novel templating applications. Current
opinion in colloid & interface science 6, 244-248.
(58) Nishikido, N. (1993) Thermodynamic models for mixed micellization, in Mixed
surfactant systems (Ogino, K., and Abe, M., Eds.), CRC Press, New York.
(59) Puvvada, S., and Blankschtein, D. (1992) Thermodynamic description of
micellization, phase-behavior, and phase-separation of aqueous-solutions of
surfactant mixtures. Journal of Physical Chemistry 96, 5567-5579.
(60) Maeda, H. (2005) A thermodynamic analysis of charged mixed micelles in water.
Journal of Physical Chemistry B 109, 15933-15940.
(61) Motomura, K., Yamanaka, M., and Aratono, M. (1984) Thermodynamic
consideration of the mixed micelle of surfactants. Colloid and Polymer Science
262, 948-955.
(62) Clint, J. H. (1975) Micellization of Mixed Nonionic Surface-Active Agents.
Journal of the Chemical Society-Faraday Transactions I 71, 1327-1334.
(63) Liljekvist, P., and Kronberg, B. (2000) Comparing Decyl-β-maltoside and
Octaethyleneglycol Mono< i> n</i>-Decyl Ether in Mixed Micelles with Dodecyl
Benzenesulfonate: 1. Formation of Mixed Micelles. Journal of colloid and
interface science 222, 159-164.
(64) Bergström, M., Jonsson, P., Persson, M., and Eriksson, J. C. (2003) A model-
independent evaluation of experimental data, and comparison with theory, of

219
synergistic effects in mixtures of an ionic and a nonionic surfactant. Langmuir 19,
10719-10725.
(65) Hierrezuelo, J., Aguiar, J., and Carnero Ruiz, C. (2005) Micellar properties of a
mixed surfactant system constituted by< i> n</i>-octyl-β-d-thioglucopyranoside
and sodium dodecyl sulphate. Colloids and Surfaces A: Physicochemical and
Engineering Aspects 264, 29-36.
(66) Kameyama, K., Muroya, A., and Takagi, T. (1997) Properties of a mixed micellar
system of sodium dodecyl sulfate and octylglucoside. Journal of colloid and
interface science 196, 48-52.
(67) Sierra, M., and Svensson, M. (1999) Mixed micelles containing alkylglycosides:
effect of the chain length and the polar head group. Langmuir 15, 2301-2306.
(68) Lainez, A., del Burgo, P., Junquera, E., and Aicart, E. (2004) Mixed micelles
formed by n-octyl-beta-D-glucopyranoside and tetradecyltrimethylammonium
bromide in aqueous media. Langmuir 20, 5745-5752.
(69) del Burgo, P., Junquera, E., and Aicart, E. (2004) Mixed micellization of a
nonionic-cationic surfactant system constituted by n-octyl-β-D-
glucopyranoside/dodecyltrimethylammonium bromide/H2O. An electrochemical,
thermodynamic, and spectroscopic study. Langmuir 20, 1587-1596.
(70) Kakehashi, R., Shizuma, M., Yamamura, S., and Takeda, T. (2004) Mixed
micelles containing sodium oleate: the effect of the chain length and the polar
head group. Journal of Colloid and Interface Science 279, 253-258.
220
(71) Wydro, P. (2007) The influence of the size of the hydrophilic group on the
miscibility of zwitterionic and nonionic surfactants in mixed monolayers and
micelles. Journal of colloid and interface science 316, 107-113.
(72) Jarek, E., Wydro, P., Warszyński, P., and Paluch, M. (2006) Surface properties of
mixtures of surface-active sugar derivatives with ionic surfactants: Theoretical
and experimental investigations. Journal of colloid and interface science 293,
194-202.
(73) Zhang, R., and Somasundaran, P. (2006) Advances in adsorption of surfactants
and their mixtures at solid/solution interfaces. Advances in colloid and interface
science 123, 213-229.
(74) Tsamaloukas, A. D., Beck, A., and Heerklotz, H. (2009) Modeling the
Micellization Behavior of Mixed and Pure n-Alkyl-Maltosides. Langmuir 25,
4393-4401.
(75) Xu, Q., Vasudevan, T., and Somasundaran, P. (1991) Adsorption of anionic—
nonionic and cationic—nonionic surfactant mixtures on kaolinite. Journal of
colloid and interface science 142, 528-534.
(76) Huang, L., Maltesh, C., and Somasundaran, P. (1996) Adsorption behavior of
cationic and nonionic surfactant mixtures at the alumina–water interface. Journal
of colloid and interface science 177, 222-228.
(77) Matsson, M. K., Kronberg, B., and Claesson, P. M. (2005) Enhanced adsorption
of alkyl glucosides on the silica/water interface by addition of amine oxides.
Langmuir 21, 2766-2772.

221
(78) Somasundaran, P., Fu, E., and Xu, Q. (1992) Coadsorption of anionic and
nonionic surfactant mixtures at the alumina-water interface. Langmuir 8, 1065-
1069.
(79) Zhang, L., Zhang, R., and Somasundaran, P. (2006) Adsorption of mixtures of
nonionic sugar-based surfactants with other surfactants at solid/liquid interfaces:
II. Adsorption of n-dodecyl-β-d-maltoside with a cationic surfactant and a
nonionic ethoxylated surfactant on solids. J. Colloid Interface Sci. 302, 25-31.
(80) Collinson, M. M. (2010) Imprinted Functionalized Silica, in The Supramolecular
Chemistry of Organic-Inorganic Hybrid Materials pp 581-598, John Wiley &
Sons, Inc.
(81) Katz, A., and Davis, M. E. (2000) Molecular imprinting of bulk, microporous
silica. Nature 403, 286-289.
(82) Kempe, M., and Mosbach, K. (1995) Molecular imprinting used for chiral
separations. J Chromatogr A 694, 3-13.
(83) Sellergren, B. (2000) Molecularly imprinted polymers: man-made mimics of
antibodies and their application in analytical chemistry, Vol. 23, Access Online
via Elsevier.
(84) Sellergren, B., and Allender, C. J. (2005) Molecularly imprinted polymers: A
bridge to advanced drug delivery. Advanced drug delivery reviews 57, 1733-1741.
(85) Polyakov, M. (1931) Adsorption properties and structure of silica gel. Zhur Fiz
Khim 2, 799-805.
(86) Haldeman, R., and Emmett, P. (1955) Specific Adsorption of Alkyl Orange Dyes
on Silica Gel. The Journal of Physical Chemistry 59, 1039-1043.
222
(87) Curti, R., and Colombo, U. (1952) Chromatography of stereoisomers with “tailor
made” compounds. J. Am. Chem. Soc. 74, 3961-3961.
(88) Takagishi, T., and Klotz, I. M. (1972) Macromolecule small molecule
interactions; introduction of additional binding sites in polyethyleneimine by
disulfide cross–linkages. Biopolymers 11, 483-491.
(89) Wulff, G., and Sarhan, A. (1972) Use of polymers with enzyme-analogous
structures for the resolution of racemates. Angew. Chem. Int. Ed. Engl 11, 341-
342.
(90) Damen, J., and Neckers, D. C. (1980) Memory of synthesized vinyl polymers for
their origins. The Journal of Organic Chemistry 45, 1382-1387.
(91) Wulff, G., Sarhan, A., and Zabrocki, K. (1973) Enzyme-analogue built polymers
and their use for the resolution of racemates. Tetrahedron Letters 14, 4329-4332.
(92) Shea, K. J., Stoddard, G., Shavelle, D., Wakui, F., and Choate, R. (1990)
Synthesis and characterization of highly crosslinked poly (acrylamides) and poly
(methacrylamides). A new class of macroporous polyamides. Macromolecules 23,
4497-4507.
(93) Marty, J.-D., Tizra, M., Mauzac, M., Rico-Lattes, I., and Lattes, A. (1999) New
molecular imprinting materials: liquid crystalline networks. Macromolecules 32,
8674-8677.
(94) Wulff, G., and Haarer, J. (1991) Enzyme analogue built polymers, 29. The
preparation of defined chiral cavities for the racemic resolution of free sugars. Die
Makromolekulare Chemie 192, 1329-1338.
223
(95) Wulff, G., and Poll, H. G. (1987) Enzyme analogue built polymers, 23. Influence
of the structure of the binding sites on the selectivity for racemic resolution. Die
Makromolekulare Chemie 188, 741-748.
(96) Wulff, G., and Schauhoff, S. (1991) Racemic resolution of free sugars with
macroporous polymers prepared by molecular imprinting. Selectivity dependence
on the arrangement of functional groups versus spatial requirements. Journal of
organic chemistry 56, 395-400.
(97) Arshady, R., and Mosbach, K. (1981) Synthesis of substrate selective polymers
by host guest polymerization. Die Makromolekulare Chemie 182, 687-692.
(98) Makote, R., and Collinson, M. M. (1998) Template recognition in inorganic-
organic hybrid films prepared by the sol-gel process. Chemistry of materials 10,
2440-2445.
(99) Makote, R., and M Collinson, M. (1999) Organically modified silicate films for
stable pH sensors. Analytica chimica acta 394, 195-200.
(100) Wulff, G., and Biffis, A. (2000) Molecular imprinting with covalent or
stoichiometric non-covalent interactions. Techniques and Instrumentation in
Analytical Chemistry 23, 71-111.
(101) Whitcombe, M. J., Rodriguez, M. E., Villar, P., and Vulfson, E. N. (1995) A new
method for the introduction of recognition site functionality into polymers
prepared by molecular imprinting: synthesis and characterization of polymeric
receptors for cholesterol. J. Am. Chem. Soc. 117, 7105-7111.
(102) Komiyama, M., Takeuchi, T., Mukawa, T., and Asanuma, H. (2003) Front
Matter, Wiley Online Library.
224
(103) Dai, S., Shin, Y., Barnes, C., and Toth, L. (1997) Enhancement of uranyl
adsorption capacity and selectivity on silica sol-gel glasses via molecular
imprinting. Chemistry of materials 9, 2521-2525.
(104) Morihara, K., Kurokawa, M., Kamata, Y., and Shimada, T. (1992) Enzyme-like
enantioselective catalysis over chiral ‘molecular footprint’cavities on a silica
(alumina) gel surface. J. Chem. Soc., Chem. Commun., 358-360.
(105) Markowitz, M. A., Deng, G., and Gaber, B. P. (2000) Effects of added
organosilanes on the formation and adsorption properties of silicates surface-
imprinted with an organophosphonate. Langmuir 16, 6148-6155.
(106) Markowitz, M. A., Kust, P. R., Deng, G., Schoen, P. E., Dordick, J. S., Clark, D.
S., and Gaber, B. P. (1999) Catalytic Silica Particles via Template-Directed
Molecular Imprinting. Langmuir 16, 1759-1765.
(107) Markowitz, M. A., Kust, P. R., Klaehn, J., Deng, G., and Gaber, B. P. (2001)
Surface-imprinted silica particles: the effects of added organosilanes on catalytic
activity. Analytica Chimica Acta 435, 177-185.
(108) Xie, C., Liu, B., Wang, Z., Gao, D., Guan, G., and Zhang, Z. (2008) Molecular
imprinting at walls of silica nanotubes for TNT recognition. Analytical chemistry
80, 437-443.
(109) Dickert, F., and Hayden, O. (2002) Bioimprinting of polymers and sol-gel phases.
Selective detection of yeasts with imprinted polymers. Analytical chemistry 74,
1302-1306.
(110) Lulka, M. F., Iqbal, S. S., Chambers, J. P., Valdes, E. R., Thompson, R. G.,
Goode, M. T., and Valdes, J. J. (2000) Molecular imprinting of Ricin and its A

225
and B chains to organic silanes: fluorescence detection. Materials Science and
Engineering: C 11, 101-105.
(111) Iqbal, S. S., Lulka, M. F., Chambers, J. P., Thompson, R. G., and Valdes, J. J.
(2000) Artificial receptors: molecular imprints discern closely related toxins.
Materials Science and Engineering: C 7, 77-81.
(112) Hench, L. L., and West, J. K. (1990) The sol-gel process. Chemical Reviews 90,
33-72.
(113) Reed, J. S. (1995) Principles of ceramics processing, Wiley New York.
(114) Inagaki, S., Guan, S., Fukushima, Y., Ohsuna, T., and Terasaki, O. (1999) Novel
mesoporous materials with a uniform distribution of organic groups and inorganic
oxide in their frameworks. J. Am. Chem. Soc. 121, 9611-9614.
(115) Yanagisawa, T., Shimizu, T., Kuroda, K., and Kato, C. (1990) The preparation of
alkyltrimethylammonium-kanemite complexes and their conversion to
microporous materials. Bull. Chem. Soc. Jpn 63, 988-992.
(116) Chen, C.-Y., Xiao, S.-Q., and Davis, M. E. (1995) Studies on ordered mesoporous
materials III. Comparison of MCM-41 to mesoporous materials derived from
kanemite. Microporous Mater 4, 1-20.
(117) Huo, Q., Margolese, D. I., Ciesla, U., Demuth, D. G., Feng, P., Gier, T. E., Sieger,
P., Firouzi, A., and Chmelka, B. F. (1994) Organization of organic molecules with
inorganic molecular species into nanocomposite biphase arrays. Chemistry of
Materials 6, 1176-1191.
226
(118) Firouzi, A., Kumar, D., Bull, L., Besier, T., Sieger, P., Huo, Q., Walker, S.,
Zasadzinski, J., Glinka, C., and Nicol, J. (1995) Cooperative organization of
inorganic-surfactant and biomimetic assemblies. Science 267, 1138-1143.
(119) Firouzi, A., Schaefer, D. J., Tolbert, S. H., Stucky, G. D., and Chmelka, B. F.
(1997) Magnetic-Field-Induced Orientational Ordering of Alkaline Lyotropic
Silicate−Surfactant Liquid Crystals. J. Am. Chem. Soc. 119, 9466-9477.
(120) Bagshaw, S. A., Prouzet, E., and Pinnavaia, T. J. (1995) Templating of
mesoporous molecular sieves by nonionic polyethylene oxide surfactants. Science
269, 1242-1244.
(121) Tanev, P. T., and Pinnavaia, T. J. (1995) A neutral templating route to
mesoporous molecular sieves. Science 267, 865-867.
(122) Wan, Y., and Zhao, D. (2007) On the controllable soft-templating approach to
mesoporous silicates. Chemical reviews 107, 2821-2860.
(123) Attard, G. S., Glyde, J. C., and Göltner, C. G. (1995) Liquid-crystalline phases as
templates for the synthesis of mesoporous silica. Nature 378, 366-368.
(124) Ogawa, M. (1994) Formation of novel oriented transparent films of layered silica-
surfactant nanocomposites. J. Am. Chem. Soc. 116, 7941-7942.
(125) He, X., and Antonelli, D. (2002) Recent advances in synthesis and applications of
transition metal containing mesoporous molecular sieves. Angewandte Chemie
International Edition 41, 214-229.
(126) Taramasso, M., Perego, G., and Notari, B. (1983), Google Patents.

227
(127) Sudhakar Reddy, J., and Kumar, R. (1991) Synthesis, characterization, and
catalytic properties of a titanium silicate, TS-2, with MEL structure. Journal of
Catalysis 130, 440-446.
(128) Corma, A., and Kan, Q. (1998) Synthesis of Si and Ti-Si-MCM-48 mesoporous
materials with controlled pore sizes in the absence of polar organic additives and
alkali metal ions. Chem. Commun., 579-580.
(129) Zhang, W., Fröba, M., Wang, J., Tanev, P. T., Wong, J., and Pinnavaia, T. J.
(1996) Mesoporous Titanosilicate Molecular Sieves Prepared at Ambient
Temperature by Electrostatic (S+ I-, S+ X-I+) and Neutral (S° I°) Assembly
Pathways: A Comparison of Physical Properties and Catalytic Activity for
Peroxide Oxidations. J. Am. Chem. Soc. 118, 9164-9171.
(130) Alba, M. D., Luan, Z., and Klinowski, J. (1996) Titanosilicate mesoporous
molecular sieve MCM-41: synthesis and characterization. The Journal of Physical
Chemistry 100, 2178-2182.
(131) Beck, C., Mallat, T., Bürgi, T., and Baiker, A. (2001) Nature of Active Sites in
Sol–Gel TiO2–SiO2 Epoxidation Catalysts. Journal of Catalysis 204, 428-439.
(132) Hutter, R., Mallat, T., and Baiker, A. (1995) Titania Silica Mixed Oxides: II.
Catalytic Behavior in Olefin Epoxidation. Journal of Catalysis 153, 177-189.
(133) Holland, M. A., Pickup, D. M., Mountjoy, G., Tsang, E. S., Wallidge, G. W.,
Newport, R. J., and Smith, M. E. (2000) Synthesis, characterisation and
performance of (TiO2) 0.18 (SiO2) 0.82 xerogel catalysts. J Mater Chem 10,
2495-2501.

228
(134) Doeuff, S., Henry, M., Sanchez, C., and Livage, J. (1987) Hydrolysis of titanium
alkoxides: Modification of the molecular precursor by acetic acid. Journal of
Non-crystalline solids 89, 206-216.
(135) Lafond, V., Mutin, P., and Vioux, A. (2004) Control of the texture of titania-silica
mixed oxides prepared by nonhydrolytic sol-gel. Chemistry of materials 16, 5380-
5386.
(136) Bogush, G., Tracy, M., and Zukoski, C. (1988) Preparation of monodisperse silica
particles: control of size and mass fraction. Journal of Non-Crystalline Solids 104,
95-106.
(137) Wang, X.-D., Shen, Z.-X., Sang, T., Cheng, X.-B., Li, M.-F., Chen, L.-Y., and
Wang, Z.-S. (2010) Preparation of spherical silica particles by Stöber process with
high concentration of tetra-ethyl-orthosilicate. Journal of Colloid and Interface
Science 341, 23-29.
(138) Branda, F., Silvestri, B., Luciani, G., and Costantini, A. (2007) The effect of
mixing alkoxides on the Stöber particles size. Colloids and Surfaces A:
Physicochemical and Engineering Aspects 299, 252-255.
(139) Li, J. H., Zheng, Z. J., Fu, S. P., and Zhu, J. B. (2012) Preparation and
Characterization of Paclitaxel Imprinted Silica Nanoparticles. Advanced Materials
Research 399, 1894-1897.
(140) Wu, X., You, L., Di, B., Hao, W., Su, M., Gu, Y., and Shen, L. (2013) Novel
chiral core–shell silica microspheres with trans-(1R,2R)-diaminocyclohexane
bridged in the mesoporous shell: Synthesis, characterization and application in
high performance liquid chromatography. J Chromatogr A 1299, 78-84.
229
(141) Gao, D., Zhang, Z., Wu, M., Xie, C., Guan, G., and Wang, D. (2007) A Surface
Functional Monomer-Directing Strategy for Highly Dense Imprinting of TNT at
Surface of Silica Nanoparticles. J. Am. Chem. Soc. 129, 7859-7866.
(142) Ow, H., Larson, D. R., Srivastava, M., Baird, B. A., Webb, W. W., and Wiesner,
U. (2004) Bright and Stable Core−Shell Fluorescent Silica Nanoparticles. Nano
Letters 5, 113-117.
(143) Luckarift, H. R., Dickerson, M. B., Sandhage, K. H., and Spain, J. C. (2006)
Rapid, Room-Temperature Synthesis of Antibacterial Bionanocomposites of
Lysozyme with Amorphous Silica or Titania. Small 2, 640-643.
(144) LaMer, V. K., and Dinegar, R. H. (1950) Theory, production and mechanism of
formation of monodispersed hydrosols. J. Am. Chem. Soc. 72, 4847-4854.
(145) Matsoukas, T., and Gulari, E. (1988) Dynamics of growth of silica particles from
ammonia-catalyzed hydrolysis of tetra-ethyl-orthosilicate. Journal of colloid and
interface science 124, 252-261.
(146) Matsoukas, T., and Gulari, E. (1989) Monomer-addition growth with a slow
initiation step: A growth model for silica particles from alkoxides. Journal of
Colloid and Interface Science 132, 13-21.
(147) Feeney, P. J., Napper, D. H., and Gilbert, R. G. (1984) Coagulative nucleation and
particle size distributions in emulsion polymerization. Macromolecules 17, 2520-
2529.
(148) Hochberg, A., Tanaka, T., and Nicoli, D. (1979) Spinodal line and critical point of
an acrylamide gel. Physical Review Letters 43, 217.
230
(149) Bogush, G., and Zukoski, C. (1991) Studies of the kinetics of the precipitation of
uniform silica particles through the hydrolysis and condensation of silicon
alkoxides. Journal of Colloid and Interface Science 142, 1-18.
(150) Kim, S., and Zukoski, C. F. (1990) A model of growth by hetero-coagulation in
seeded colloidal dispersions. Journal of Colloid and Interface Science 139, 198-
212.
(151) Tan, B., and Rankin, S. E. (2004) Interfacial Alignment Mechanism of Forming
Spherical Silica with Radially Oriented Nanopores. The Journal of Physical
Chemistry B 108, 20122-20129.
(152) Bailey, J., and Mecartney, M. (1992) Formation of colloidal silica particles from
alkoxides. Colloids and Surfaces 63, 151-161.
(153) Freyer, M. W., and Lewis, E. A. (2008) Isothermal titration calorimetry:
experimental design, data analysis, and probing macromolecule/ligand binding
and kinetic interactions. Methods in cell biology 84, 79-113.
(154) Grime, J. K. (1985) Chemical Analysis: A Series of Monographs on Analytical
Chemistry and Its Applications, Vol. 79, John Wiley & Sons.
(155) Robinson, J. W., Frame, E. M. S., and Frame II, G. M. (2004) Undergraduate
instrumental analysis, CRC Press.
(156) Guidotti, M., Ravasio, N., Psaro, R., Ferraris, G., and Moretti, G. (2003)
Epoxidation on titanium-containing silicates: do structural features really affect
the catalytic performance? Journal of catalysis 214, 242-250.
(157) Hind, A., Bhargava, S., and Grocott, S. (1997) Attenuated total reflection fourier
transform infrared spectroscopic investigation of the solid/aqueous interface of
231
low surface area, water-soluble solids in high ionic strength, highly alkaline,
aqueous media. Langmuir 13, 3483-3487.
(158) Smith, F. (1999) Industrial applications of X-ray diffraction, CRC Press.
(159) Heiney, P. A.
(160) Goldstein, J., Newbury, D. E., Joy, D. C., Lyman, C. E., Echlin, P., Lifshin, E.,
Sawyer, L., and Michael, J. R. (2003) Scanning electron microscopy and X-ray
microanalysis, Springer.
(161) Everhart, T., and Thornley, R. (1960) Wide-band detector for micro-microampere
low-energy electron currents. Journal of scientific instruments 37, 246.
(162) Sing, K., Sing, K., Everett, D., Haul, R., Moscou, L., Pierotti, R., Rouquerol, J.,
and Siemieniewska, T. (1982) Reporting physisorption data for gas/solid systems.
Pure and Appl Chem 54, 2201.
(163) Manocha, S. M. (2003) Porous carbons. Sadhana 28, 335-348.
(164) Brunauer, S., Emmett, P. H., and Teller, E. (1938) Adsorption of gases in
multimolecular layers. J. Am. Chem. Soc. 60, 309-319.
(165) Sing, K. (2001) The use of nitrogen adsorption for the characterisation of porous
materials. Colloids and Surfaces A: Physicochemical and Engineering Aspects
187, 3-9.
(166) Barrett, E. P., Joyner, L. G., and Halenda, P. P. (1951) The determination of pore
volume and area distributions in porous substances. I. Computations from
nitrogen isotherms. J. Am. Chem. Soc. 73, 373-380.

232
(167) Kruk, M., Jaroniec, M., and Sayari, A. (1997) Adsorption study of surface and
structural properties of MCM-41 materials of different pore sizes. The Journal of
Physical Chemistry B 101, 583-589.
(168) Kruk, M., and Jaroniec, M. (2001) Gas adsorption characterization of ordered
organic-inorganic nanocomposite materials. Chemistry of Materials 13, 3169-
3183.
(169) Schártl, W. (2007) Light scattering from polymer solutions and nanoparticle
dispersions, Springer.
(170) Manual, Z. N. S. U. (2003) Malvern Instruments Ltd. Manual Version IM 100,
1.23-1.26.
(171) Sing, K. S. W., Everett, D. H., Haul, R. A. W., Moscou, L., Pierotti, R. A.,
Rouquerol, J., and Siemieniewska, T. (1985) Reporting physisorption data for gas
solid systems with special reference to the determination of surface-area and
porosity (recommendations 1984). Pure Appl. Chem. 57, 603-619.
(172) Paula, S., Sues, W., Tuchtenhagen, J., and Blume, A. (1995) Thermodynamics of
micelle formation as a function of temperature: a high sensitivity titration
calorimetry study. The Journal of Physical Chemistry 99, 11742-11751.
(173) Holmberg, K., Jönsson, B., Kronberg, B., and Lindman, B. (2003) Surfactants
and polymers in aqueous solution, Vol. 2, John Wiley & Sons Chichester.
(174) Opatowski, E., Kozlov, M. M., Pinchuk, I., and Lichtenberg, D. (2002) Heat
Evolution of Micelle Formation, Dependence of Enthalpy, and Heat Capacity on
the Surfactant Chain Length and Head Group. Journal of Colloid and Interface
Science 246, 380-386.

233
(175) Dupuy, C., Auvray, X., Petipas, C., Rico-Lattes, I., and Lattes, A. (1997)
Anomeric effects on the structure of micelles of alkyl maltosides in water.
Langmuir 13, 3965-3967.
(176) Rosen, M. J., and Dahanayake, M., AOCS Press.
(177) Zhao, X., Su, F., Yan, Q., Guo, W., Bao, X. Y., Lv, L., and Zhou, Z. (2006)
Templating methods for preparation of porous structures. J Mater Chem 16, 637-
648.
(178) Berggren, A., Palmqvist, A. E., and Holmberg, K. (2005) Surfactant-templated
mesostructured materials from inorganic silica. Soft Matter 1, 219-226.
(179) Wan, Y., and Zhao. (2007) On the Controllable Soft-Templating Approach to
Mesoporous Silicates. Chemical Reviews 107, 2821-2860.
(180) Moulik, S. P., Haque, M. E., Jana, P. K., and Das, A. R. (1996) Micellar
properties of cationic surfactants in pure and mixed states. Journal of Physical
Chemistry 100, 701-708.
(181) Udugamasooriya, D. G., and Spaller, M. R. (2008) Conformational constraint in
protein ligand design and the inconsistency of binding entropy. Biopolymers 89,
653-667.
(182) Fan, Y. R., Li, Y. J., Cao, M. W., Wang, J. B., Wang, Y. L., and Thomas, R. K.
(2007) Micellization of dissymmetric cationic gemini surfactants and their
interaction with Dimyristoylphosphatidylcholine vesicles. Langmuir 23, 11458-
11464.

234
(183) Ababou, A., and Ladbury, J. E. (2005) Survey of the year 2004: literature on
applications of isothermal titration calorimetry. Journal of Molecular Recognition
19, 79-89.
(184) Ababou, A., and Ladbury, J. E. (2006) Survey of the year 2005: literature on
applications of isothermal titration calorimetry. Journal of Molecular Recognition
20, 4-14.
(185) Cliff, M. J., and Ladbury, J. E. (2003) A survey of the year 2002 literature on
applications of isothermal titration calorimetry. Journal of Molecular Recognition
16, 383-391.
(186) Falconer, R. J., and Collins, B. M. (2011) Survey of the year 2009: applications of
isothermal titration calorimetry. Journal of Molecular Recognition 24, 1-16.
(187) Freiburger, L. A., Auclair, K., and Mittermaier, A. K. (2009) Elucidating Protein
Binding Mechanisms by Variable c ITC. ChemBioChem 10, 2871-2873.
(188) Norvai as, P., Petrauskas, ., and Matulis, D. (2012) Thermodynamics of
Cationic and Anionic Surfactant Interaction. The Journal of Physical Chemistry B
116, 2138-2144.
(189) Olofsson, G., and Loh, W. (2009) On the use of titration calorimetry to study the
association of surfactants in aqueous solutions. Journal of the Brazilian Chemical
Society 20, 577-593.
(190) Bouchemal, K., Agnely, F., Koffi, A., Djabourov, M., and Ponchel, G. (2010)
What can isothermal titration microcalorimetry experiments tell us about the self
organization of surfactants into micelles? Journal of Molecular Recognition 23,
335-342.

235
(191) Holland, P. M. (1992) Modeling Mixed Surfactant Systems - Basic Introduction.
Acs Symposium Series 501, 31-44.
(192) Bakshi, M. S., and Kaur, G. (2005) Mixed micelles of series of monomeric and
dimeric cationic, zwitterionic, and unequal twin-tail cationic surfactants with
sugar surfactants: A fluorescence study. Journal of Colloid and Interface Science
289, 551-559.
(193) Garidel, P., and Hildebrand, A. (2005) Thermodynamic properties of association
colloids. Journal of Thermal Analysis and Calorimetry 82, 483-489.
(194) Hill, K., and Catherine, L.-F. (2008) Sugar-based surfactants for consumer and
technical applications, in Sugar-Based Surfactants Fundamentals and
Applications (Carnero Ruiz, C., Ed.) pp 1-20, CRC Press.
(195) Heerklotz, H., and Seelig, J. (2000) Correlation of membrane/water partition
coefficients of detergents with the critical micelle concentration. Biophys J 78,
2435-40.
(196) Huang, L., and Somasundaran, P. (1997) Theoretical Model and Phase Behavior
for Binary Surfactant Mixtures. Langmuir 13, 6683-6688.
(197) Thibaut, A., Misselyn-Bauduin, A.-M., Grandjean, J., Broze, G., and Jérôme, R.
(2000) Adsorption of an aqueous mixture of surfactants on silica. Langmuir 16,
9192-9198.
(198) McMillan Jr, W. G., and Mayer, J. E. (1945) The statistical thermodynamics of
multicomponent systems. The Journal of Chemical Physics 13, 276.
(199) Franks, F., Pedley, M., and Reid, D. S. (1976) Solute interactions in dilute
aqueous solutions. Part 1.-Microcalorimetric study of the hydrophobic interaction.

236
Journal of the Chemical Society, Faraday Transactions 1: Physical Chemistry in
Condensed Phases 72, 359-367.
(200) Billo, E. J. (2007) Excel for Scientists and Engineers: Numerical Methods, Wiley.
com.
(201) Blandamer, M. J., Cullis, P. M., and Engberts, J. B. F. N. (1998) Titration
microcalorimetry. Journal of the Chemical Society-Faraday Transactions 94,
2261-2267.
(202) Blandamer, M. J., Cullis, P. M., and Engberts, J. B. F. N. (1995) Differential
scanning and titration calorimetric studies of macromolecules in aqueous solution.
Journal of Thermal Analysis 45, 599-613.
(203) Xie, C., Li, H., Li, S., and Gao, S. (2011) Surface molecular imprinting for
chemiluminescence detection of the organophosphate pesticide chlorpyrifos.
Microchimica Acta 174, 311-320.
(204) Mer, V. K. L. (1952) Nucleation in Phase Transitions. Industrial & Engineering
Chemistry 44, 1270-1277.
(205) Lee, K., Look, J.-L., Harris, M. T., and McCormick, A. V. (1997) Assessing
Extreme Models of the Stöber Synthesis Using Transients under a Range of Initial
Composition. Journal of Colloid and Interface Science 194, 78-88.
(206) Harris, M. T., Brunson, R. R., and Byers, C. H. (1990) The base-catalyzed
hydrolysis and condensation reactions of dilute and concentrated TEOS solutions.
Journal of Non-Crystalline Solids 121, 397-403.
(207) Bailey, J. K., and Mecartney, M. L. (1992) Formation of colloidal silica particles
from alkoxides. Colloids and Surfaces 63, 151-161.
237
(208) Burneau, A., and Humbert, B. (1993) AGGREGATIVE GROWTH OF SILICA
FROM AN ALKOXYSILANE IN A CONCENTRATED-SOLUTION OF
AMMONIA. Colloid Surf. A-Physicochem. Eng. Asp. 75, 111-121.
(209) Green, D. L., Lin, J. S., Lam, Y. F., Hu, M. Z. C., Schaefer, D. W., and Harris, M.
T. (2003) Size, volume fraction, and nucleation of Stober silica nanoparticles.
Journal of Colloid and Interface Science 266, 346-358.
(210) Tleugabulova, D., Duft, A. M., Zhang, Z., Chen, Y., Brook, M. A., and Brennan,
J. D. (2004) Evaluating formation and growth mechanisms of silica particles
using fluorescence anisotropy decay analysis. Langmuir 20, 5924-5932.
(211) Schoeman, B. J., and Regev, O. (1996) A study of the initial stage in the
crystallization of TPA-silicalite-1. Zeolites 17, 447-456.
(212) Rimer, J. D., Fedeyko, J. M., Vlachos, D. G., and Lobo, R. F. (2006) Silica self-
assembly and the synthesis of microporous and mesoporous silicates. Chem.-Eur.
J. 12, 2926-2934.
(213) Rimer, J. D., Trofymluk, O., Navrotsky, A., Lobo, R. F., and Vlachos, D. G.
(2007) Kinetic and thermodynamic studies of silica nanoparticle dissolution.
Chemistry of Materials 19, 4189-4197.
(214) Rimer, J. D., Trofymluk, O., Lobo, R. F., Navrotsky, A., and Vlachos, D. G.
(2008) Thermodynamics of silica nanoparticle self-assembly in basic solutions of
monovalent cations. J Phys Chem C 112, 14754-14761.
(215) Rimer, J. D., Lobo, R. F., and Vlachos, D. G. (2005) Physical basis for the
formation and stability of silica nanoparticles in basic solutions of monovalent
cations. Langmuir 21, 8960-8971.

238
(216) van Blaaderen, A., and Vrij, A. (1993) Synthesis and Characterization of
Monodisperse Colloidal Organo-silica Spheres. Journal of Colloid and Interface
Science 156, 1-18.
(217) Kobayashi, Y., Yoshida, M., Nagao, D., Ando, Y., Miyazaki, T., and Konno, M.
(2006) Synthesis of SiO2-Coated Magnetite Nanoparticles and Immobilization of
Proteins on Them, in Characterization and Control of Interfaces for High Quality
Advanced Materials II pp 135-141, John Wiley & Sons, Inc.
(218) He, H., Fu, G., Wang, Y., Chai, Z., Jiang, Y., and Chen, Z. (2010) Imprinting of
protein over silica nanoparticles via surface graft copolymerization using low
monomer concentration. Biosensors and Bioelectronics 26, 760-765.
(219) Peng, Y., Xie, Y., Luo, J., Nie, L., Chen, Y., Chen, L., Du, S., and Zhang, Z.
(2010) Molecularly imprinted polymer layer-coated silica nanoparticles toward
dispersive solid-phase extraction of trace sulfonylurea herbicides from soil and
crop samples. Analytica Chimica Acta 674, 190-200.
(220) Zhao, W., Sheng, N., Zhu, R., Wei, F., Cai, Z., Zhai, M., Du, S., and Hu, Q.
(2010) Preparation of dummy template imprinted polymers at surface of silica
microparticles for the selective extraction of trace bisphenol A from water
samples. Journal of Hazardous Materials 179, 223-229.
(221) Gauczinski, J., Liu, Z., Zhang, X., and Schönhoff, M. (2012) Surface Molecular
Imprinting in Layer-by-Layer films on Silica Particles. Langmuir.
(222) Dickey, F. H. (1949) The Preparation of Specific Adsorbents. Proceedings of the
National Academy of Sciences of the United States of America 35, 227-229.

239
(223) Dickey, F. H. (1955) Specific adsorption. Journal of Physical Chemistry 59, 695-
707.
(224) Haldeman, R. G., and Emmett, P. H. (1955) Specific Adsorption of Alkyl Orange
Dyes on Silica Gel. Journal of Physical Chemistry 59, 1039-1043.
(225) Morrison, J. L., Worsley, M., Shaw, D. R., and Hodgson, G. W. (1959) The
nature of the specificity of adsorption of alkyl orange dyes on silica gel. Canadian
Journal of Chemistry-Revue Canadienne De Chimie 37, 1986-1995.
(226) Ye, L., and Mosbach, K. (2008) Molecular Imprinting: Synthetic Materials As
Substitutes for Biological Antibodies and Receptors†. Chemistry of Materials 20,
859-868.
(227) Hwang, C.-C., and Lee, W.-C. (2002) Chromatographic characteristics of
cholesterol-imprinted polymers prepared by covalent and non-covalent imprinting
methods. J Chromatogr A 962, 69-78.
(228) Chen, L., Xu, S., and Li, J. (2011) Recent advances in molecular imprinting
technology: current status, challenges and highlighted applications. Chemical
Society Reviews 40.
(229) Turner, N. W., Jeans, C. W., Brain, K. R., Allender, C. J., Hlady, V., and Britt, D.
W. (2006) From 3D to 2D: A Review of the Molecular Imprinting of Proteins.
Biotechnology Progress 22, 1474-1489.
(230) Hunnius, M., Rufinska, A., and Maier, W. F. (1999) Selective surface adsorption
versus imprinting in amorphous micoporous silicas. Micropor. Mesopor. Mater.
29, 389-403.
240
(231) Katz, A., and Davis, M. E. (2000) Molecular imprinting of bulk, microporous
silica. Nature 403, 286-289.
(232) Cummins, W., Duggan, P., and McLoughlin, P. (2005) A comparative study of
the potential of acrylic and sol-gel polymers for molecular imprinting. Anal.
Chim. Act. 542, 52-60.
(233) Marx, S., and Liron, Z. (2001) Molecular Imprinting in Thin Films of Organic-
Inorganic Hybrid Sol-Gel and Acrylic Polymers. Chem. Mater. 13, 3624-3630.
(234) Luderitz, L. A. C., and von Klitzing, R. (2013) Interaction forces between silica
surfaces in cationic surfactant solutions: An atomic force microscopy study. J.
Colloid Interface Sci. 402, 19-26.
(235) Zhou, Q., and Somasundaran, P. (2009) Synergistic adsorption of mixtures of
cationic gemini and nonionic sugar-based surfactant on silica. Journal of Colloid
and Interface Science 331, 288-294.
(236) Macakova, L., Blomberg, E., and Claesson, P. M. (2007) Effect of adsorbed layer
surface roughness on the QCM-D response: Focus on trapped water. Langmuir
23, 12436-12444.
(237) Gutig, C., Grady, B. P., and Striolo, A. (2008) Experimental studies on the
adsorption of two surfactants on solid-aqueous interfaces: Adsorption isotherms
and kinetics. Langmuir 24, 4806-4816.
(238) Ragauskas, A. J., Williams, C. K., Davison, B. H., Britovsek, G., Cairney, J.,
Eckert, C. A., Frederick, W. J., Hallett, J. P., Leak, D. J., Liotta, C. L., Mielenz, J.
R., Murphy, R., Templer, R., and Tschaplinski, T. (2006) The Path Forward for
Biofuels and Biomaterials. Science 311, 484-489.

241
(239) Giesche, H. (1994) SYNTHESIS OF MONODISPERSED SILICA POWDERS
.2. CONTROLLED GROWTH REACTION AND CONTINUOUS
PRODUCTION PROCESS. J. European Ceram. Soc. 14, 205-214.
(240) Netrabukkana, R., Lourvanij, K., and Rorrer, G. L. (1996) Diffusion of Glucose
and Glucitol in Microporous and Mesoporous Silicate/Aluminosilicate Catalysts.
Ind Eng Chem Res 35, 458-464.
(241) Xu, W., Osei-Prempeh, G., Lema, C., Davis Oldham, E., Aguilera, R. J., Parkin,
S., Rankin, S. E., Knutson, B. L., and Lehmler, H.-J. (2012) Synthesis, thermal
properties, and cytotoxicity evaluation of hydrocarbon and fluorocarbon alkyl β-
d-xylopyranoside surfactants. Carbohydrate Research 349, 12-23.
(242) Bartl, F., Delgadillo, I., Davies, A. N., Huvenne, J. P., Meurens, M., Volka, K.,
and Wilson, R. H. (1996) An interlaboratory comparison of sample presentation
methods for the analysis of aqueous solutions using fourier transform infrared
spectroscopy. Fresenius' Journal of Analytical Chemistry 354, 1-5.
(243) Bogush, G. H., Tracy, M. A., and Zukoski, C. F. (1988) PREPARATION OF
MONODISPERSE SILICA PARTICLES - CONTROL OF SIZE AND MASS
FRACTION. Journal of Non-Crystalline Solids 104, 95-106.
(244) Levenberg, K. (1944) A Method for the Solution of Certain Non-Linear Problems
in Least Squares. Quarterly of Applied Mathematics 2, 164-168.
(245) Ziemys, A., Grattoni, A., Fine, D., Hussain, F., and Ferrari, M. (2010)
Confinement effects on monosaccharide transport in nanochannels. The Journal
of Physical Chemistry B 114, 11117-11126.
242
(246) Wang, Y., Lin, L., Zhu, B. S., Zhu, Y. X., and Xie, Y. C. (2008) Different
dispersion behavior of glucose and sucrose on alumina and silica surfaces. Appl.
Surf. Sci. 254, 6560-6567.
(247) Lerbret, A., Lelong, G., Mason, P. E., Saboungi, M. L., and Brady, J. W. (2011)
Molecular Dynamics and Neutron Scattering Study of Glucose Solutions
Confined in MCM-41. Journal of Physical Chemistry B 115, 910-918.
(248) Kuhn, R. C., and Maugeri, F. (2010) Selection of Adsorbents and Determination
of Parameters for the Separation of Glucose, Fructose, Sucrose and
Fructooligosaccharides. International Journal of Food Engineering 6.
(249) Ziemys, A., Grattoni, A., Fine, D., Hussain, F., and Ferrari, M. (2010)
Confinement Effects on Monosaccharide Transport in Nanochannels. Journal of
Physical Chemistry B 114, 11117-11126.
(250) Kemmer, G., and Keller, S. (2010) Nonlinear least-squares data fitting in Excel
spreadsheets. Nature Protocols 5, 267-281.
(251) Kriz, D., Ramström, O., and Mosbach, K. (1997) Peer Reviewed: Molecular
Imprinting: New Possibilities for Sensor Technology. Analytical Chemistry 69,
345A-349A.
(252) Díaz-García, M. E., and Laíño, R. B. (2005) Molecular Imprinting in Sol-Gel
Materials: Recent Developments and Applications. Microchim. Acta 149, 19-36.
(253) Holthoff, E. L., and Bright, F. V. (2007) Molecularly imprinted xerogels as
platforms for sensing. Accounts Chem. Res. 40, 756-767.
(254) Mujahid, A., Lieberzeit, P. A., and Dickert, F. L. (2010) Chemical Sensors Based
on Molecularly Imprinted Sol-Gel Materials. Materials 3, 2196-2217.

243
(255) Bass, J. D., and Katz, A. (2006) Bifunctional surface imprinting of silica:
Thermolytic synthesis and characterization of discrete thiol-amine functional
group pairs. Chemistry of Materials 18, 1611-1620.
(256) Do Ki, C., Oh, C., Oh, S. G., and Chang, J. Y. (2002) The use of a thermally
reversible bond for molecular imprinting of silica spheres. J. Am. Chem. Soc. 124,
14838-14839.
(257) Jayasundera, S., Zeinali, M., Miller, J. B., Velea, L. M., Gaber, B. P., and
Markowitz, M. A. (2006) Investigation of surface interactions in molecular
recognition of phosphonate imprinted organosilicates and the role of water.
Journal of Physical Chemistry B 110, 18121-18125.
(258) Markowitz, M. A., Kust, P. R., Deng, G., Schoen, P. E., Dordick, J. S., Clark, D.
S., and Gaber, B. P. (2000) Catalytic silica particles via template-directed
molecular imprinting. Langmuir 16, 1759-1765.
(259) Burneau, A., and Humbert, B. (1993) Aggregative growth of silica from an
alkoxysilane in a concentrated solution of ammonia. Colloid Surf. A-
Physicochem. Eng. Asp. 75, 111-121.
(260) Maier, N. M., Franco, P., and Lindner, W. (2001) Separation of enantiomers:
needs, challenges, perspectives. J Chromatogr A 906, 3-33.
(261) Fanali, S. (1996) Identification of chiral drug isomers by capillary electrophoresis.
J Chromatogr A 735, 77-121.
(262) Blanch, G. P., Caja, M. d. M., Ruiz del Castillo, M. L., and Herraiz, M. (1998)
Comparison of different methods for the evaluation of the authenticity of olive oil
and hazelnut oil. Journal of agricultural and food chemistry 46, 3153-3157.

244
(263) Meyer, V., and Ahuja, S. (1991) in ACS Symposium Series, American Chemical
Society, Washington DC pp 217-227.
(264) Cronin, J. R., and Pizzarello, S. (1997) Enantiomeric excesses in meteoritic amino
acids. Science 275, 951-955.
(265) Fanali, S. (2000) Enantioselective determination by capillary electrophoresis with
cyclodextrins as chiral selectors. J Chromatogr A 875, 89-122.
(266) Rocco, A., Maru ka, A., and Fanali, S. (2013) Enantiomeric separations by means
of nano LC. Journal of separation science 36, 421-444.
(267) Ward, T. J., and Ward, K. D. (2010) Chiral separations: fundamental review 2010.
Analytical chemistry 82, 4712-4722.
(268) Maier, N. M., and Lindner, W. (2007) Chiral recognition applications of
molecularly imprinted polymers: a critical review. Analytical and bioanalytical
chemistry 389, 377-397.
(269) Ramström, O., and Ansell, R. J. (1998) Molecular imprinting technology:
challenges and prospects for the future. Chirality 10, 195-209.
(270) Maier, N., and Lindner, W. (2007) Chiral recognition applications of molecularly
imprinted polymers: a critical review. Analytical and Bioanalytical Chemistry
389, 377-397.
(271) Kugimiya, A., Matsui, J., Abe, H., Aburatani, M., and Takeuchi, T. (1998)
Synthesis of castasterone selective polymers prepared by molecular imprinting.
Analytica Chimica Acta 365, 75-79.
245
(272) Sellergren, B., and Shea, K. J. (1995) Origin of peak asymmetry and the effect of
temperature on solute retention in enantiomer separations on imprinted chiral
stationary phases. J Chromatogr A 690, 29-39.
(273) Zhang, H., Ye, L., and Mosbach, K. (2006) Non covalent molecular imprinting
with emphasis on its application in separation and drug development. Journal of
Molecular Recognition 19, 248-259.
(274) Di, B., Cheng, L., Jiang, Q., Su, M., and Hao, W. (2013) Anionic surfactant
templated chiral nanospheres and their enantioselective adsorption. New Journal
of Chemistry 37, 1603-1609.
(275) Paik, P., Mastai, Y., Kityk, I., Rakus, P., and Gedanken, A. (2012) Synthesis of
amino acid block-copolymer imprinted chiral mesoporous silica and its
acoustically-induced optical Kerr effects. Journal of Solid State Chemistry 192,
127-131.
(276) Yokoi, T., Sato, S., Ara, Y., Lu, D., Kubota, Y., and Tatsumi, T. (2010) Synthesis
of chiral mesoporous silica and its potential application to asymmetric separation.
Adsorption 16, 577-586.
(277) Paik, P., Gedanken, A., and Mastai, Y. (2010) Chiral separation abilities: Aspartic
acid block copolymer-imprinted mesoporous silica. Microporous and Mesoporous
Materials 129, 82-89.
(278) Che, S., Liu, Z., Ohsuna, T., Sakamoto, K., Terasaki, O., and Tatsumi, T. (2004)
Synthesis and characterization of chiral mesoporous silica. Nature 429, 281-284.
246
(279) Wu, J., Su, P., Huang, J., Wang, S., and Yang, Y. (2013) Synthesis of teicoplanin-
modified hybrid magnetic mesoporous silica nanoparticles and their application in
chiral separation of racemic compounds. Journal of colloid and interface science.
(280) Vega, E., Marzabadi, C., Kazakevich, Y., and Fadeev, A. Y. (2011) Synthesis of
chiral mesoporous silicas with oligo (saccharide) surfaces and their use in
separation of stereoisomers. Journal of colloid and interface science 359, 542-
544.
(281) Seeberger, P. H. (2009) Chemical glycobiology: why now? Nature Chemical
Biology 5, 368-72.
(282) Jandera, P., and Churáček, J. (1974) Gradient elution in liquid chromatography : I.
The influence of the composition of the mobile phase on the capacity ratio
(retention volume, band width, and resolution) in isocratic elution — theoretical
considerations. J Chromatogr A 91, 207-221.
(283) Goulding, R. W. (1975) Liquid chromatography of sugars and related polyhydric
alcohols on cation exchangers : The effect of cation variation. J Chromatogr A
103, 229-239.
(284) Khym, J. X., and Zill, L. P. (1951) THE SEPARATION OF
MONOSACCHARIDES BY ION EXCHANGE. J. Am. Chem. Soc. 73, 2399-
2400.
(285) Jones, J., and Wall, R. (1960) THE SEPARATION OF SUGARS ON ION-
EXCHANGE RESINS: PART II. SEPARATION OF MONOSACCHARIDES.
Canadian Journal of Chemistry 38, 2290-2294.
247
(286) Karlsson, G., Winge, S., and Sandberg, H. (2005) Separation of monosaccharides
by hydrophilic interaction chromatography with evaporative light scattering
detection. J Chromatogr A 1092, 246-249.
(287) Kakita, H., Kamishima, H., Komiya, K., and Kato, Y. (2002) Simultaneous
analysis of monosaccharides and oligosaccharides by high-performance liquid
chromatography with postcolumn fluorescence derivatization. J Chromatogr A
961, 77-82.
(288) Alpert, A. J., Shukla, M., Shukla, A. K., Zieske, L. R., Yuen, S. W., Ferguson, M.
A. J., Mehlert, A., Pauly, M., and Orlando, R. (1994) Hydrophilic-interaction
chromatography of complex carbohydrates. J Chromatogr A 676, 191-202.
(289) Schumacher, S., Gruneberger, F., Katterle, M., Hettrich, C., Hall, D. G., Scheller,
F. W., and Gajovic-Eichelmann, N. (2011) Molecular imprinting of fructose using
a polymerizable benzoboroxole: Effective complexation at pH 7.4. Polymer 52,
2485-2491.
(290) Hilt, J. Z., Byrne, M. E., and Peppas, N. A. (2006) Microfabrication of intelligent
biomimetic networks for recognition of D-glucose. Chemistry of Materials 18,
5869-5875.
(291) Mayes, A. G., Andersson, L. I., and Mosbach, K. (1994) Sugar binding polymers
showing high anomeric and epimeric discrimination obtained by noncovalent
molecular imprinting. Anal. Biochem. 222, 483-488.
(292) Chen, G., Guan, Z., Chen, C.-T., Fu, L., Sundaresan, V., and Arnold, F. H. (1997)
A glucose-sensing polymer. Nat Biotech 15, 354-357.

248
(293) Striegler, S. (2001) Investigation of disaccharide recognition by molecularly
imprinted polymers. Bioseparation 10, 307-314.
(294) Wizeman, W. J., and Kofinas, P. (2001) Molecularly imprinted polymer
hydrogels displaying isomerically resolved glucose binding. Biomaterials 22,
1485-1491.
(295) Parmpi, P., and Kofinas, P. (2004) Biomimetic glucose recognition using
molecularly imprinted polymer hydrogels. Biomaterials 25, 1969-1973.
(296) Striegler, S. (2003) Carbohydrate recognition in cross-linked sugar-templated
poly(acrylates). Macromolecules 36, 1310-1317.
(297) Rajkumar, R., Warsinke, A., Mohwald, H., Scheller, F. W., and Katterle, M.
(2008) Analysis of recognition of fructose by imprinted polymers. Talanta 76,
1119-1123.
(298) Sineriz, F., Ikeda, Y., Petit, E., Bultel, L., Haupt, K., Kovensky, J., and Papy-
Garcia, D. (2007) Toward an alternative for specific recognition of sulfated
sugars. Preparation of highly specific molecular imprinted polymers. Tetrahedron
63, 1857-1862.
(299) Curcio, P., Zandanel, C., Wagner, A., Mioskowski, C., and Baati, R. (2009) Semi-
Covalent Surface Molecular Imprinting of Polymers by One-Stage Mini-emulsion
Polymerization: Glucopyranoside as a Model Analyte. Macromol. Biosci. 9, 596-
604.
(300) Kirk, C., Jensen, M., Kjaer, C. N., Smedskjaer, M. M., Larsen, K. L., Wimmer,
R., and Yu, D. H. (2009) Aqueous batch rebinding and selectivity studies on
sucrose imprinted polymers. Biosens. Bioelectron. 25, 623-628.
249
(301) Okutucu, B., Onal, S., and Telefoncu, A. (2009) Noncovalently galactose
imprinted polymer for the recognition of different saccharides. Talanta 78, 1190-
1193.
(302) Yang, D.-H., Takahara, N., Lee, S.-W., and Kunitake, T. (2008) Fabrication of
glucose-sensitive TiO2 ultrathin films by molecular imprinting and selective
detection of monosaccharides. Sensors and Actuators B: Chemical 130, 379-385.
(303) Peric-Hassler, L., Hansen, H. S., Baron, R., and Hunenberger, P. H. (2010)
Conformational properties of glucose-based disaccharides investigated using
molecular dynamics simulations with local elevation umbrella sampling.
Carbohydrate Research 345, 1781-1801.
(304) Taylor, J. B. (1957) The water solubilities and heats of solution of short chain
cellulosic oligosaccharides. Transactions of the Faraday Society 53, 1198-1203.
(305) Abel, S. p., Dupradeau, F. o.-Y., Raman, E. P., MacKerell, A. D., and Marchi, M.
(2010) Molecular Simulations of Dodecyl-β-maltoside Micelles in Water:
Influence of the Headgroup Conformation and Force Field Parameters. The
Journal of Physical Chemistry B 115, 487-499.
(306) Gao, X., and Wachs, I. E. (1999) Titania–silica as catalysts: molecular structural
characteristics and physico-chemical properties. Catal. Today 51, 233-254.
(307) Feng, J., and Zhang, H. (2013) Hybrid materials based on lanthanide organic
complexes: a review. Chemical Society Reviews 42, 387-410.
(308) Pozzo, R. L., Baltanás, M. A., and Cassano, A. E. (1997) Supported titanium
oxide as photocatalyst in water decontamination: State of the art. Catal. Today 39,
219-231.
250
(309) Notari, B. (1993) Titanium silicalites. Catal. Today 18, 163-172.
(310) Morey, M. S., O'Brien, S., Schwarz, S., and Stucky, G. D. (2000) Hydrothermal
and postsynthesis surface modification of cubic, MCM-48, and ultralarge pore
SBA-15 mesoporous silica with titanium. Chemistry of materials 12, 898-911.
(311) Eimer, G. A., Casuscelli, S. G., Ghione, G. E., Crivello, M. E., and Herrero, E. R.
(2006) Synthesis, characterization and selective oxidation properties of Ti-
containing mesoporous catalysts. Applied Catalysis A: General 298, 232-242.
(312) Chandra, D., and Bhaumik, A. (2006) Highly Active 2D Hexagonal Mesoporous
Titanium Silicate Synthesized Using a Cationic−Anionic Mixed-Surfactant
Assembly. Ind Eng Chem Res 45, 4879-4883.
(313) Chandra, D., Kishor Mal, N., Mukherjee, M., and Bhaumik, A. (2006) Titanium-
rich highly ordered mesoporous silica synthesized by using a mixed surfactant
system. Journal of Solid State Chemistry 179, 1802-1807.
(314) Liu, Z., Crumbaugh, G. M., and Davis, R. J. (1996) Effect of Structure and
Composition on Epoxidation of HexeneCatalyzed by Microporous and
Mesoporous Ti–Si Mixed Oxides. Journal of Catalysis 159, 83-89.
(315) Blasco, T., Corma, A., Navarro, M., and Pariente, J. P. (1995) Synthesis,
characterization, and catalytic activity of Ti-MCM-41 structures. Journal of
Catalysis 156, 65-74.
(316) Pena, M., Dellarocca, V., Rey, F., Corma, A., Coluccia, S., and Marchese, L.
(2001) Elucidating the local environment of Ti (IV) active sites in Ti-MCM-48: a
comparison between silylated and calcined catalysts. Microporous and
mesoporous materials 44, 345-356.

251
(317) Ji, D., Zhao, R., Lv, G., Qian, G., Yan, L., and Suo, J. (2005) Direct synthesis,
characterization and catalytic performance of novel Ti-SBA-1 cubic mesoporous
molecular sieves. Applied Catalysis A: General 281, 39-45.
(318) Ji, D., Ren, T., Yan, L., and Suo, J. (2003) Synthesis of Ti-incorporated SBA-1
cubic mesoporous molecular sieves. Materials Letters 57, 4474-4477.
(319) Li, G., and Zhao, X. (2006) Characterization and photocatalytic properties of
titanium-containing mesoporous SBA-15. Ind Eng Chem Res 45, 3569-3573.
(320) Dagan, G., Sampath, S., and Lev, O. (1995) Preparation and utilization of
organically modified silica-titania photocatalysts for decontamination of aquatic
environments. Chemistry of materials 7, 446-453.
(321) Inoue, H., Matsuyama, T., Liu, B. J., Sakata, T., Mori, H., and Yoneyama, H.
(1994) Photocatalytic Activities of TiO, Microcrystals Prepared in Si02 Matrixes
Using a Sol-Gel Method for Carbon Dioxide Reduction. Chem. Lett, 653-6.
(322) Doolin, P., Alerasool, S., Zalewski, D., and Hoffman, J. (1994) Acidity studies of
titania-silica mixed oxides. Catalysis letters 25, 209-223.
(323) Fu, X., Clark, L. A., Yang, Q., and Anderson, M. A. (1996) Enhanced
photocatalytic performance of titania-based binary metal oxides: TiO2/SiO2 and
TiO2/ZrO2. Environmental science & technology 30, 647-653.
(324) Itoh, M., Hattori, H., and Tanabe, K. (1974) The acidic properties of TiO< sub>
2</sub>-SiO< sub> 2</sub> and its catalytic activities for the amination of
phenol, the hydration of ethylene and the isomerization of butene. Journal of
Catalysis 35, 225-231.
252
(325) Nakabayashi, H. (1992) Properties of Acid Sites on TiO 2–SiO 2 and TiO 2–Al 2
O 3 Mixed Oxides Measured by Infrared Spectroscopy. Bulletin of the Chemical
Society of Japan 65, 914-916.
(326) Mukhopadhayay, S. M., and Garofalini, S. H. (1990) Surface studies of
TiO2/SiO2 glasses by X-ray photoelectron spectroscopy. Journal of non-
crystalline solids 126, 202-208.
(327) Tanev, P. T., Chibwe, M., and Pinnavaia, T. J. (1994) Titanium-containing
mesoporous molecular sieves for catalytic oxidation of aromatic compounds.
(328) Solberg, S. M., Kumar, D., and Landry, C. C. (2005) Synthesis, structure, and
reactivity of a new Ti-containing microporous/mesoporous material. The Journal
of Physical Chemistry B 109, 24331-24337.
(329) Klein, S., Thorimbert, S., and Maier, W. (1996) Amorphous microporous titania–
silica mixed oxides: preparation, characterization, and catalytic redox properties.
Journal of Catalysis 163, 476-488.
(330) Livage, J., and Sanchez, C. (1992) Sol-gel chemistry. Journal of Non-Crystalline
Solids 145, 11-19.
(331) Liu, Z., and Davis, R. J. (1994) Investigation of the structure of microporous Ti-Si
mixed oxides by X-ray, UV reflectance, FT-Raman, and FT-IR spectroscopies.
The Journal of Physical Chemistry 98, 1253-1261.
(332) Choi, K.-M., Wakabayashi, R., Tatsumi, T., Yokoi, T., and Kuroda, K. (2011)
Usefulness of alkoxyltitanosiloxane for the preparation of mesoporous silica
containing a large amount of isolated titanium. Journal of colloid and interface
science 359, 240-247.

253
(333) Jarupatrakorn, J., and Tilley, T. D. (2002) Silica-supported, single-site titanium
catalysts for olefin epoxidation. A molecular precursor strategy for control of
catalyst structure. J. Am. Chem. Soc. 124, 8380-8388.
(334) Guglielmi, M., and Carturan, G. (1988) Precursors for sol-gel preparations.
Journal of Non-Crystalline Solids 100, 16-30.
(335) Andrianainarivelo, M., Corriu, R., Leclercq, D., Mutin, P. H., and Vioux, A.
(1996) Mixed oxides SiO2–ZrO2 and SiO2–TiO2 by a non-hydrolytic sol–gel
route. J Mater Chem 6, 1665-1671.
(336) Debecker, D. P., and Mutin, P. H. (2012) Non-hydrolytic sol–gel routes to
heterogeneous catalysts. Chemical Society Reviews 41, 3624-3650.
(337) Çelik, Ö., and Dag, Ö. (2001) A new lyotropic liquid crystalline system: oligo
(ethylene oxide) surfactants with [M (H2O) n] Xm transition metal complexes.
Angewandte Chemie 113, 3915-3919.
(338) Huesing, N., Launay, B., Kickelbick, G., Gross, S., Armelao, L., Bottaro, G.,
Feth, M. P., Bertagnolli, H., and Kothleitner, G. (2003) Transition metal oxide-
doped mesostructured silica films. Applied Catalysis A: General 254, 297-310.
(339) Hüsing, N., Launay, B., Doshi, D., and Kickelbick, G. (2002) Mesostructured
Silica−Titania Mixed Oxide Thin Films. Chemistry of Materials 14, 2429-2432.
(340) Gyurcsik, B., and Nagy, L. (2000) Carbohydrates as ligands: coordination
equilibria and structure of the metal complexes. Coordination chemistry reviews
203, 81-149.
(341) Saltman, P. (1965) The role of chelation in iron metabolism. Journal of Chemical
Education 42, 682.

254
(342) Mukhopadhyay, A., Karkamkar, A., Kolehmainen, E., and Rao, C. P. (1998)
Transition metal-saccharide chemistry: synthesis, characterization and solution
stability studies of cis-dioxomolybdenum saccharide complexes. Carbohydrate
research 311, 147-154.
(343) Bandwar, R. P., and Rao, C. P. (1997) Transition metal-saccharide chemistry and
biology: An emerging field of multidisciplinary interest. CURRENT SCIENCE-
BANGALORE- 72, 788-796.
(344) Rao, C. P., Geetha, K., Raghavan, M., Sreedhara, A., Tokunaga, K., Yamaguchi,
T., Jadhav, V., Ganesh, K., Krishnamoorthy, T., and VA Ramaiah, K. (2000)
Transition metal saccharide chemistry and biology: syntheses, characterization,
solution stability and putative bio-relevant studies of iron–saccharide complexes.
Inorganica Chimica Acta 297, 373-382.
(345) Morosanova, E., Belyakov, M., and Zolotov, Y. A. (2012) Silicon-titanium
xerogels: Synthesis and application to the determination of ascorbic acid and
polyphenoles. Journal of Analytical Chemistry 67, 14-20.
(346) Morosanova, E. I. (2012) Silica and silica-titania sol-gel materials: synthesis and
analytical application. Talanta.
(347) Rahman, M. S. (2009) Utilizing mixed surfactants for simultaneous pore
templating and active site formation in metal oxides.
(348) Hüsing, N., Launay, B., Kickelbick, G., and Hofer, F. (2003) Silica-titania
mesostructured films. Journal of sol-gel science and technology 26, 615-619.

255
(349) Fu, X., and Qutubuddin, S. (2001) Synthesis of titania-coated silica nanoparticles
using a nonionic water-in-oil microemulsion. Colloids and Surfaces A:
Physicochemical and Engineering Aspects 179, 65-70.
(350) Tani, K., Kitada, M., Tachibana, M., Koizumi, H., and Kiba, T. (2003) Retention
behavior of monosaccharides and disaccharides on titania. Chromatographia 57,
409-412.
(351) Alberius, P. C. A., Frindell, K. L., Hayward, R. C., Kramer, E. J., Stucky, G. D.,
and Chmelka, B. F. (2002) General predictive syntheses of cubic, hexagonal, and
lamellar silica and titania mesostructured thin films. Chemistry of Materials 14,
3284-3294.
(352) Thangaraj, A., Kumar, R., Mirajkar, S., and Ratnasamy, P. (1991) Catalytic
properties of crystalline titanium silicalites I. Synthesis and characterization of
titanium-rich zeolites with MFI structure. Journal of Catalysis 130, 1-8.
(353) Peng, T., Hasegawa, A., Qiu, J., and Hirao, K. (2003) Fabrication of titania
tubules with high surface area and well-developed mesostructural walls by
surfactant-mediated templating method. Chemistry of materials 15, 2011-2016.
(354) Zeleňák, ., Hornebecq, ., Mornet, S., Schäf, O., and Llewellyn, P. (2006)
Mesoporous Silica Modified with Titania: Structure and Thermal Stability.
Chemistry of Materials 18, 3184-3191.
(355) Ambati, J. (2011) Studies on Silicon NMR Characterization and Kinetic Modeling
of the Structural Evolution of Siloxane-based Materials and Their Applications in
Drug Delivery and Adsorption.
256
(356) Qiao, S., Bhatia, S., and Zhao, X. (2003) Prediction of multilayer adsorption and
capillary condensation phenomena in cylindrical mesopores. Microporous and
mesoporous materials 65, 287-298.
(357) Kruk, M., Jaroniec, M., and Sayari, A. (1997) Adsorption study of surface and
structural properties of MCM-41 materials of different pore sizes. Journal of
Physical Chemistry B 101, 583-589.
(358) Modenbach, A. (2013) Sodium hydroxide pretreatment of corn stover and
subsequent enzymatic hydrolysis: An investigation of yields, kinetic modeling
and glucose recovery.

257
VITA
Place of Birth:
Pune, India
Education:
B. Chem. Engg., Chemical Engineering, Mumbai University Institute of Chemical
Technology, Mumbai, India
Presentations:
Suvid Joshi, Dr Barbara Knutson, Dr Stephen Rankin. Surfactant imprinting of the
surface of silica nanoparticles for selective adsorption of sugars with subtle structural
differences. ACS Colloids and Surfaces 2013, Riverside, CA (Podium).
Suvid Joshi, Alex Rao, Dr Barbara Knutson, Dr Stephen Rankin. Imprinted Stöber
particles for application in saccharide and chiral separation. AIChE 2012, Pittsburgh, PA
(Podium).
Suvid Joshi, Alex Rao, Dr Barbara Knutson, Dr Stephen Rankin. Imprinted nonporous
silica nanoparticles for saccharide adsorption without diffusion resistance. ACS 2012,
San Diego, CA. (Poster)
Suvid Joshi, Dr Barbara Knutson, Dr Stephen Rankin. Thermodynamic framework based
on consistent application of Regular Solution Theory to model ITC data. AIChE 2010.
Salt Lake City, UT (Podium).
Suvid Joshi, Dr Chakkamadathil Janet Mohandas, Dr Stephen Rankin. Synthesis and
characterization of sugar-imprinted titano-silicate materials prepared by surfactant co-
templating. AIChE 2010. Salt Lake City, UT (Podium).
Publications:
Md Shahidur Rahman, Jyothirmai Ambati, Suvid Joshi, Dr Stephen Rankin.
Incorporation of Isolated Ti Sites into Mesoporous Silica Thin Films by Sugar Surfactant
Complexation. In Press. Microporous and Mesoporous Materials
Suvid Joshi, Alex Rao, Dr Hans Lehmler, Dr Barbara Knutson, Dr Stephen Rankin.
Interfacial Molecular Imprinting of Stöber Particle Surfaces: A Simple Approach to
Targeted Saccharide Adsorption. Under review J. Coll. and Int. Sci.
Suvid Joshi, Dr Barbara Knutson, Dr Stephen Rankin. Direct molecular imprinting of
Stöber particles for separation of sugars with subtle structural differences. Under
preparation.

258
Suvid Joshi, Dr Barbara Knutson, Dr Stephen Rankin. Modeling thermodynamics of non-
ideal mixtures of sugar based and cationic surfactants based on ITC data. Under
Preparation.
Dr Chakkamadathil Janet Mohandas, Suvid Joshi, Dr Stephen Rankin.Synthesis,
characterization and catalytic activity studies of mesoporous titano-silicates synthesized
by surfactant complexation. Under Preparation.


