
March 2013
Building C O N F I D E N C E
Together
Mike Poteshman, Executive VP and CFO
January 2015

We are making some forward looking statements today that use words like “outlook” or “target” or similar predictive words. Such forward looking statements involve risks and uncertainties detailed in our recent periodic reports as filed in accordance with the Securities and Exchange Act of 1934. These risks and uncertainties may cause actual results to differ materially from our statements today.
2
www.tupperwarebrands.com
Forward Looking Statements

3
Our Going Forward Objective
Sustain Tupperware Brands position as the premier, relationship-based global marketer of
quality innovative products and brands.
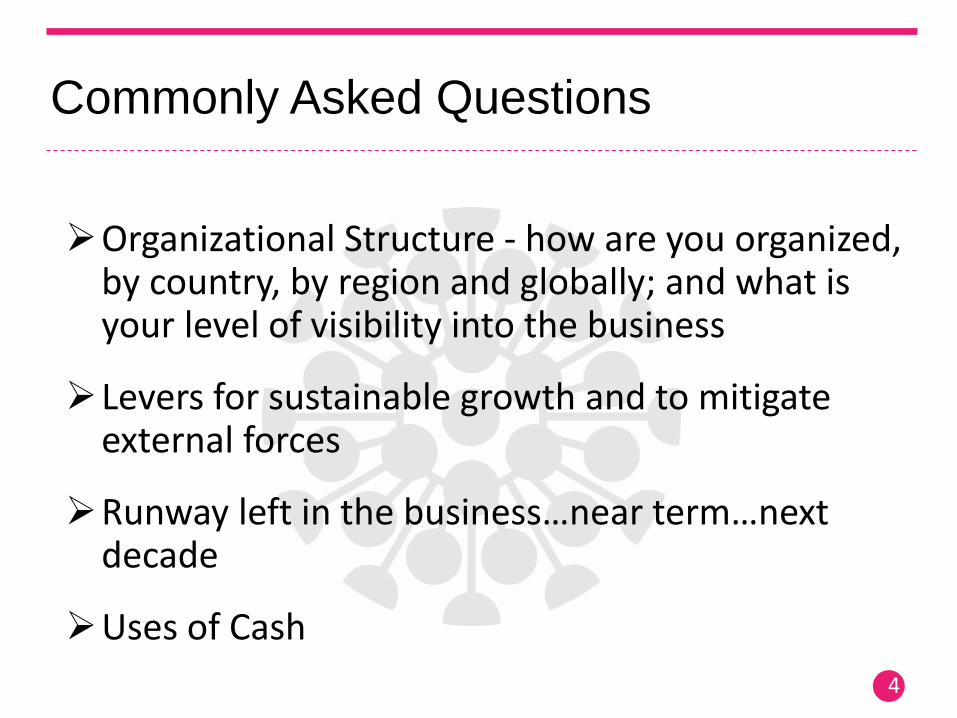
Commonly Asked Questions
4
Organizational Structure - how are you organized, by country, by region and globally; and what is your level of visibility into the business
Levers for sustainable growth and to mitigate external forces
Runway left in the business…near term…next decade
Uses of Cash
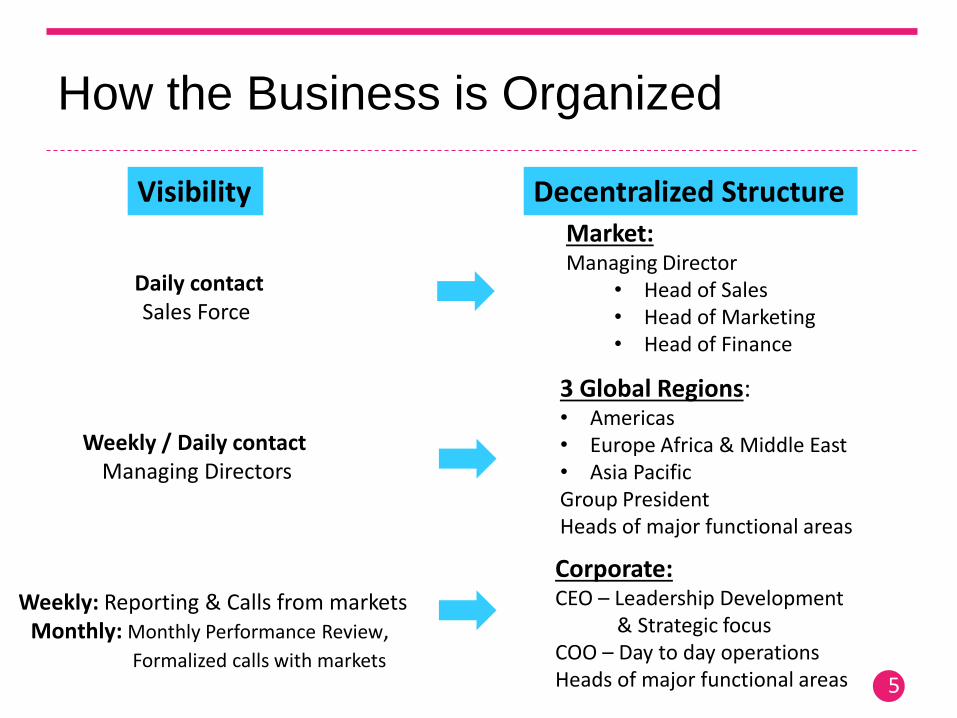
How the Business is Organized
5
Market: Managing Director
• Head of Sales • Head of Marketing • Head of Finance
3 Global Regions: • Americas • Europe Africa & Middle East • Asia Pacific Group President Heads of major functional areas
Corporate: CEO – Leadership Development & Strategic focus COO – Day to day operations Heads of major functional areas
Visibility
Weekly: Reporting & Calls from markets Monthly: Monthly Performance Review, Formalized calls with markets
Weekly / Daily contact Managing Directors
Daily contact Sales Force
Decentralized Structure

Germany Distributor Structure
6
2 Team Leaders
450 Demonstrators
Average German distributor has
30 Unit Managers
Sales per Distributor varies by market

Typical Country Structure
Distributor Model
7
TUPPERWARE GERMANY Est. 1962
Headquarters in Frankfurt/Main
Logistics center in Eppertshausen
Approx. 270 Team Leaders
130 Distributors Each controls a specific geography
Approx. 4,050 Unit Managers
Approx. 62,000 Demonstrators
Belgium Manufacturing & Warehouse
Tours Manufacturing
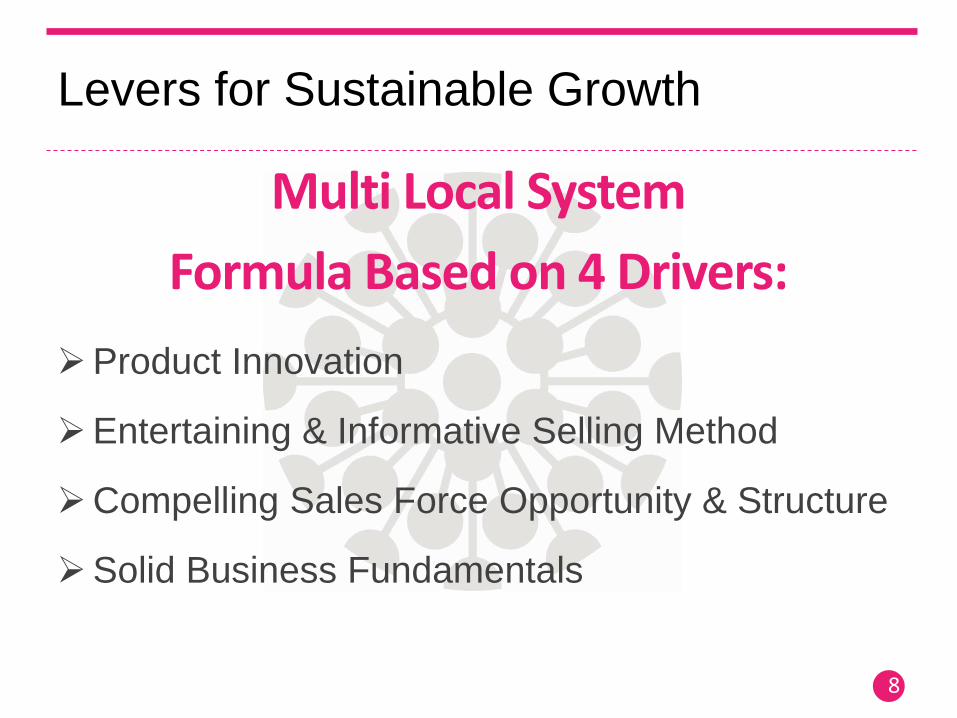
Levers for Sustainable Growth
8
Multi Local System
Formula Based on 4 Drivers:
Product Innovation
Entertaining & Informative Selling Method
Compelling Sales Force Opportunity & Structure
Solid Business Fundamentals
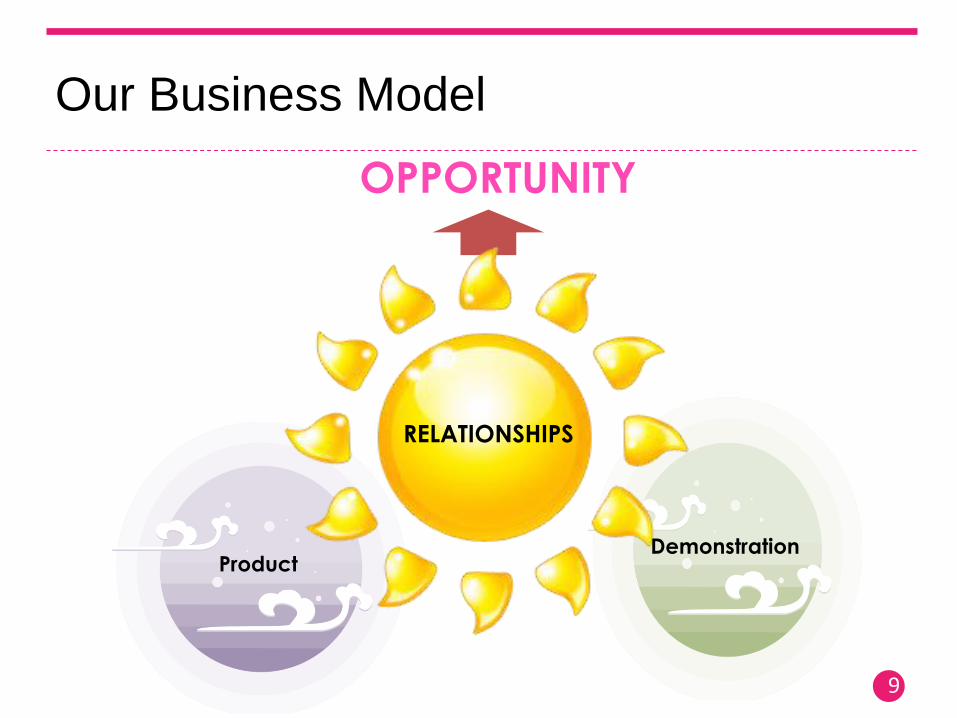
Our Business Model
9
OPPORTUNITY
RELATIONSHIPS
Demonstration Product

Product Innovation
10
ENGAGED LEADERSHIP
FAMILY BUSINESS
FOCUSED TERRITORY
10
BAKING & OVENWARE
KITCHEN TOOLS & GADGETS
FOOD STORAGE
Approximately 25% of Sales each year to come from new products (products introduced in the last 2 years)
MICROWAVE ON-THE-GO
& WATER
KITCHEN PREP
TABLE TOP & SERVING
CUTLERY & COOKWARE

Entertaining & Informative
Demonstration
11
Group Presentation = Party Party every 1.3 seconds
Advertising Retail Rent

Compelling Sales Force Opportunity
Earnings Opportunity Career Opportunity
12
Part-time
Supplemental
Income
Super
Seller
Demonstrator
Unit Manager
Team Leader
Distributor

Solid Channel Fundamentals
• Training
• Recognition
• Competition
• Motivation
13
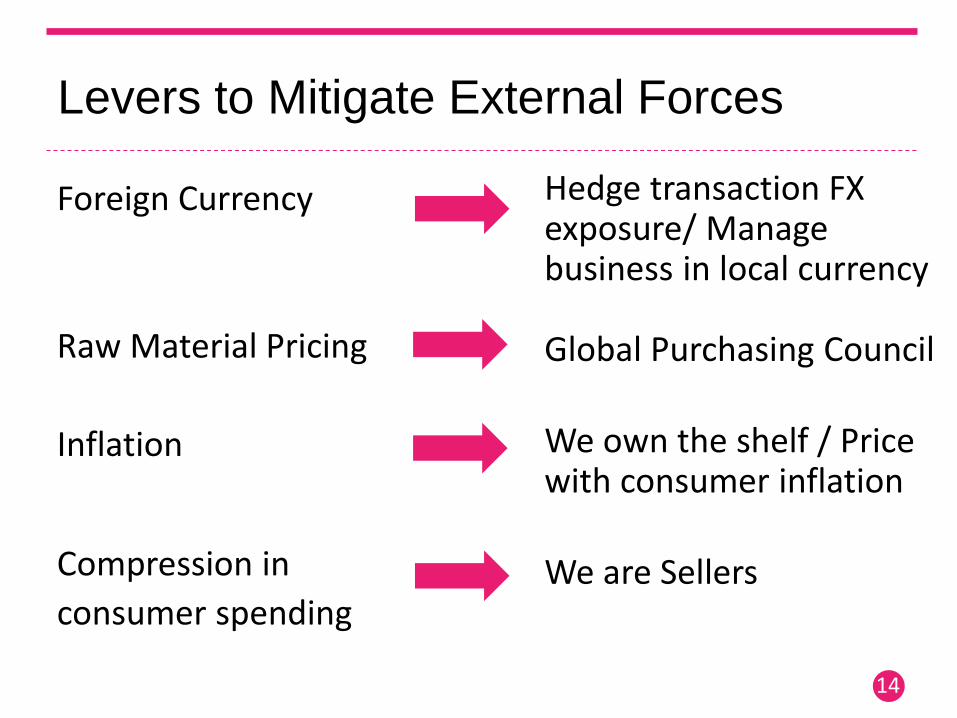
Levers to Mitigate External Forces
Foreign Currency
Raw Material Pricing
Inflation
Compression in
consumer spending
Hedge transaction FX exposure/ Manage business in local currency
Global Purchasing Council
We own the shelf / Price with consumer inflation
We are Sellers
14

Balanced Global Portfolio
15
Europe, 28%
Asia Pacific, 32%
TW North America, 14%
Beauty North America, 11%
South America, 15%
September 2014 YTD Segment Sales as % of Total
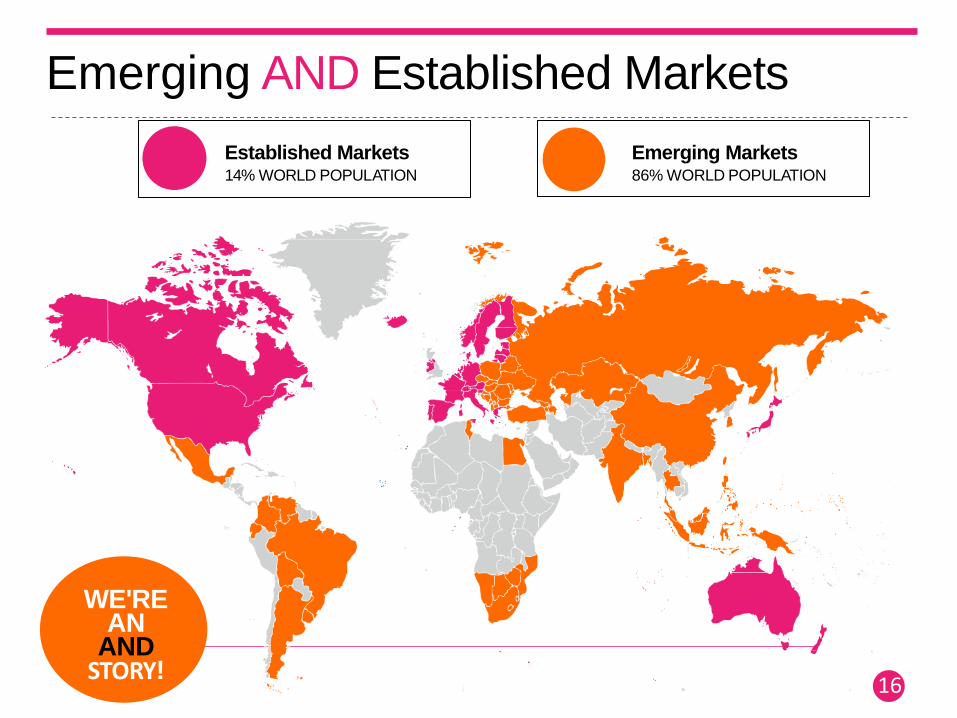
Emerging AND Established Markets
Established Markets 14% WORLD POPULATION
Emerging Markets 86% WORLD POPULATION
WE'RE AN
AND STORY!
16
17
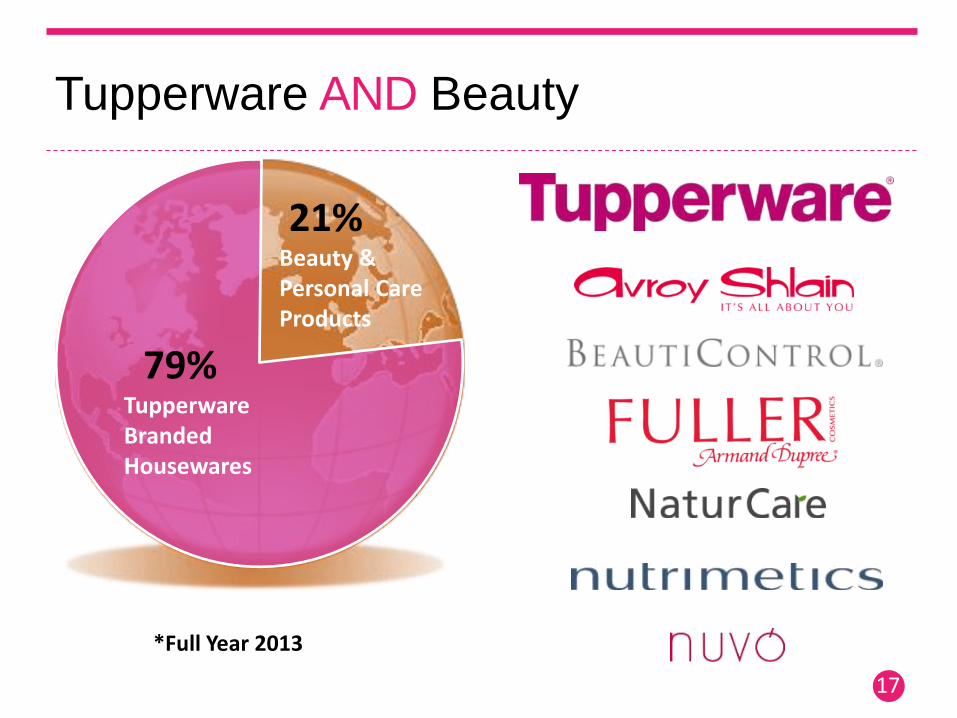
Tupperware AND Beauty
*Full Year 2013
79% Tupperware Branded Housewares
21% Beauty & Personal Care Products
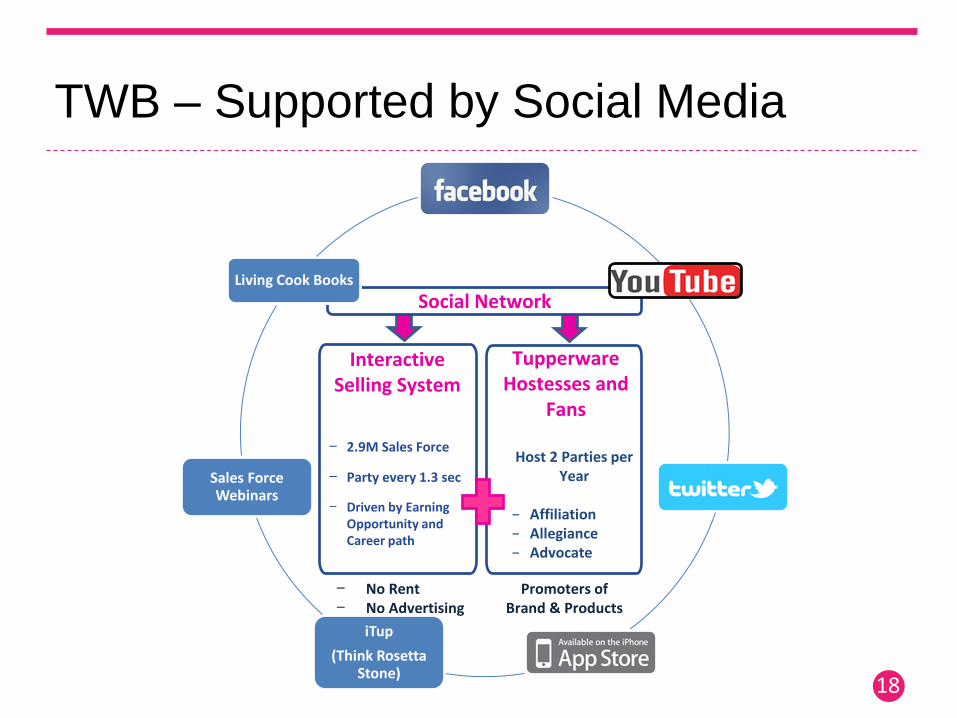
TWB – Supported by Social Media
18
Tupperware Hostesses and
Fans
Host 2 Parties per Year
− Affiliation − Allegiance − Advocate
Promoters of Brand & Products
− No Rent − No Advertising
Interactive Selling System
− 2.9M Sales Force
− Party every 1.3 sec
− Driven by Earning Opportunity and Career path
Social Network
iTup
(Think Rosetta Stone)
Sales Force Webinars
Living Cook Books
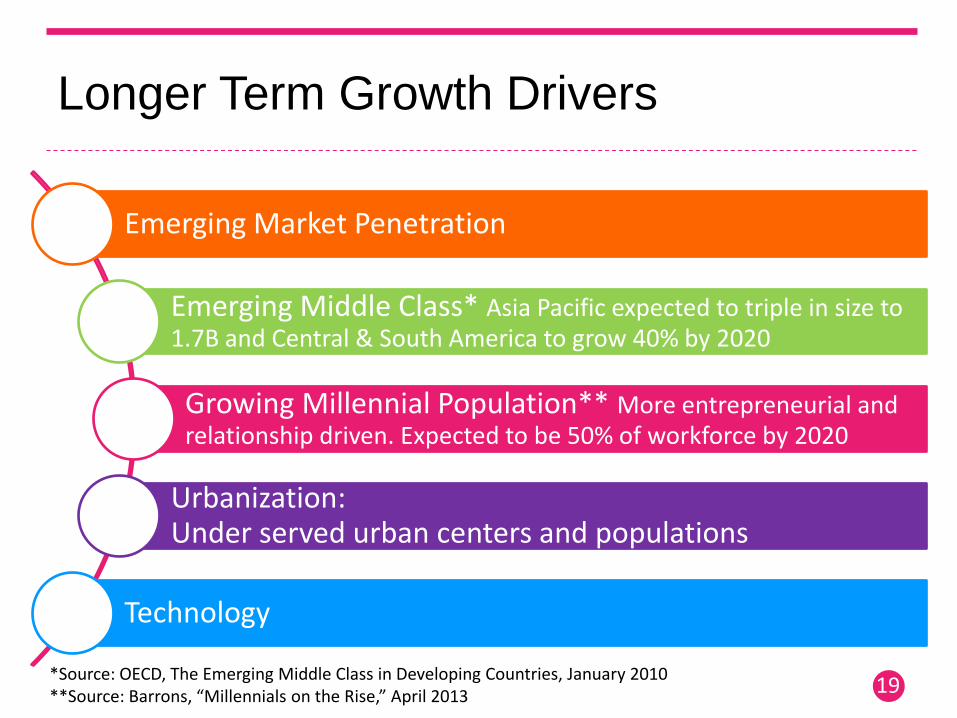
Longer Term Growth Drivers
19
Emerging Market Penetration
Emerging Middle Class* Asia Pacific expected to triple in size to 1.7B and Central & South America to grow 40% by 2020
Growing Millennial Population** More entrepreneurial and relationship driven. Expected to be 50% of workforce by 2020
Urbanization: Under served urban centers and populations
Technology
*Source: OECD, The Emerging Middle Class in Developing Countries, January 2010 **Source: Barrons, “Millennials on the Rise,” April 2013
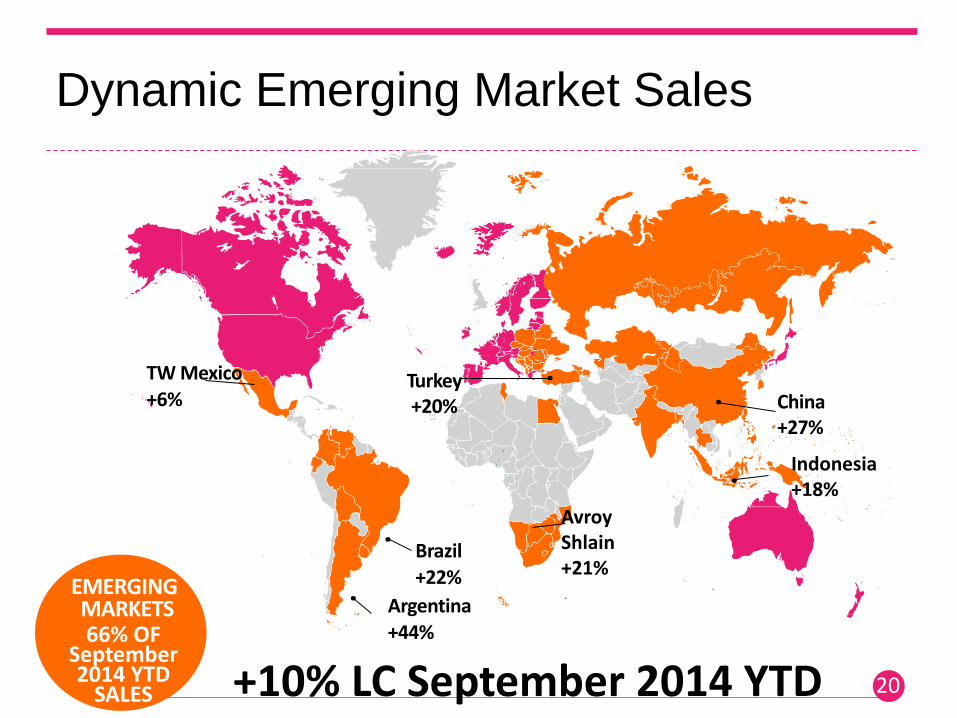
Dynamic Emerging Market Sales
EMERGING MARKETS 66% OF
September 2014 YTD
SALES
20
+10% LC September 2014 YTD
Argentina +44%
TW Mexico +6%
Brazil +22%
Turkey +20% China
+27%
Indonesia +18%
20
Avroy Shlain +21%

Basket of Global Currencies
21
Key Sales & Profit Currencies
• Euro
• Indonesian Rupiah
• Mexican Peso
• Brazilian Real
• Malaysian Ringgit
>90% of 2013 sales and profit from
outside the U.S.
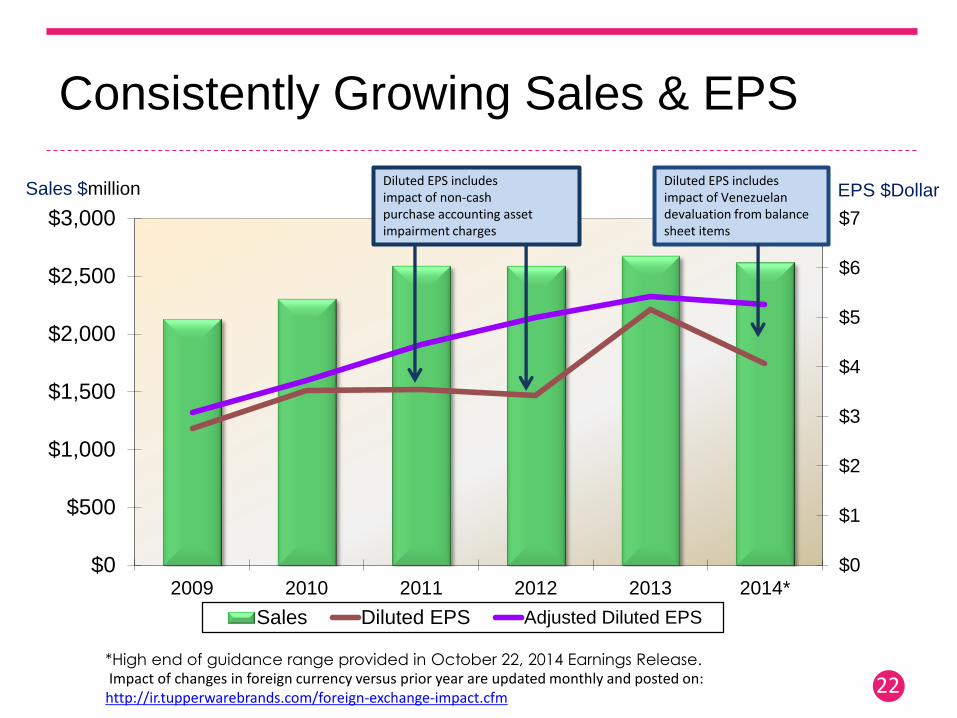
Consistently Growing Sales & EPS
$0
$1
$2
$3
$4
$5
$6
$7
$0
$500
$1,000
$1,500
$2,000
$2,500
$3,000
2009 2010 2011 2012 2013 2014*
Sales Diluted EPS Adjusted Diluted EPS
Sales $million Diluted EPS includes impact of non-cash purchase accounting asset impairment charges
22
EPS $Dollar
*High end of guidance range provided in October 22, 2014 Earnings Release. Impact of changes in foreign currency versus prior year are updated monthly and posted on: http://ir.tupperwarebrands.com/foreign-exchange-impact.cfm
Diluted EPS includes impact of Venezuelan devaluation from balance sheet items
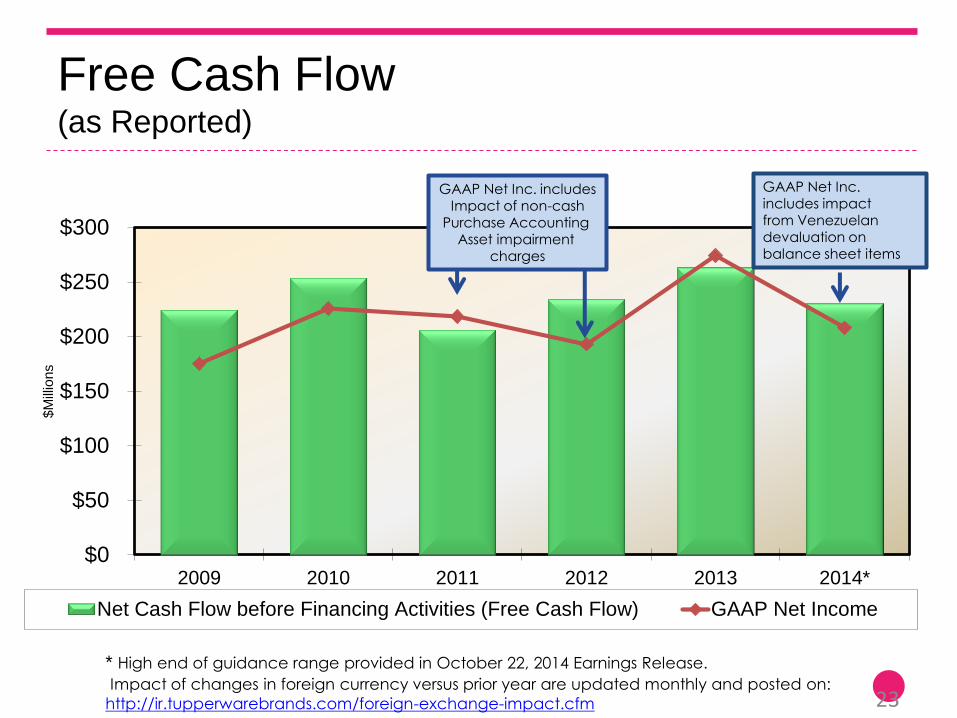
Free Cash Flow (as Reported)
$0
$50
$100
$150
$200
$250
$300
2009 2010 2011 2012 2013 2014*
$M
illio
ns
Net Cash Flow before Financing Activities (Free Cash Flow) GAAP Net Income
* High end of guidance range provided in October 22, 2014 Earnings Release.
Impact of changes in foreign currency versus prior year are updated monthly and posted on:
http://ir.tupperwarebrands.com/foreign-exchange-impact.cfm 23
GAAP Net Inc. includes Impact of non-cash
Purchase Accounting Asset impairment
charges
GAAP Net Inc. includes impact from Venezuelan devaluation on balance sheet items

Business Use of Cash
Quarterly Dividends Declared
72% increase
$2.48 per share annualized
$128M
Open Market Share
Repurchases
$375M in 2013
4.6 Million Shares
Quarterly Dividends Declared
10% increase
$2.72 per share annualized
$133M
Open Market Share
Repurchases
$105M in 2014
Invest in the Business Invest in the Business
Full Year 2013 Full Year 2014
Cash Returned to Shareholders $9.54* Cash Returned to Shareholders $4.66*
*Based on full year diluted shares and for 2014 guidance provided on October 22, 2014 24
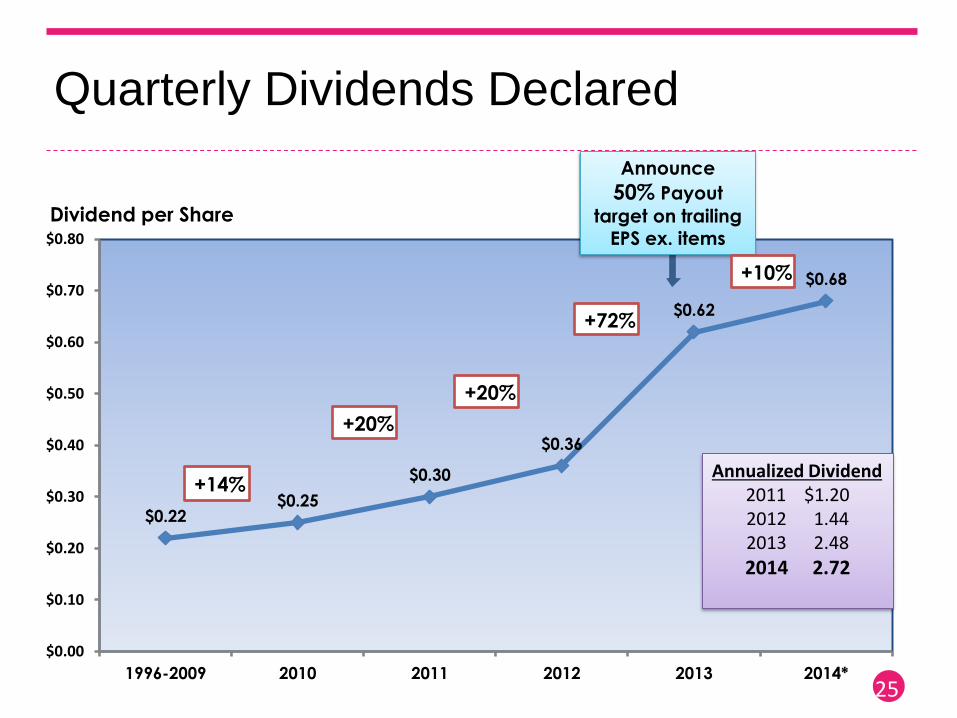
Quarterly Dividends Declared
25
$0.22 $0.25
$0.30
$0.36
$0.62
$0.68
$0.00
$0.10
$0.20
$0.30
$0.40
$0.50
$0.60
$0.70
$0.80
1996-2009 2010 2011 2012 2013 2014*
Dividend per Share
+14%
Announce
50% Payout
target on trailing EPS ex. items
+20%
+20%
+72%
+10%
Annualized Dividend 2011 $1.20 2012 1.44 2013 2.48
2014 2.72

Local Currency Sales: +4% to 5% • Emerging Markets: up high single-digit
• Established markets: down low single-digit
EPS Excluding Items: $5.21 - $5.26 • Up 8 to 9% LC, -4 to -3% USD, vs. $5.43 in 2013
• GAAP $4.02 to $4.07
• 60 cents negative FX on EPS excluding items
Pre-Tax ROS, excluding items: 13.6% • GAAP pre-tax ROS 11.1%
• Longer range ROS increase target: 50 bp • 2013 Pre-Tax ROS 14.1%
2014 vs. 2013 translation FX -65 bp
2014 LC Operating Margin Improvement +30 bp
Incremental 2014 interest -25 bp
2014 High end pretax ROS 13.6%
2014 Full Year Outlook*
26 *Guidance range provided in October 22, 2014 Earnings Release. ROS high end.
Impact of changes in foreign currency versus prior year are updated monthly and posted on:
http://ir.tupperwarebrands.com/foreign-exchange-impact.cfm
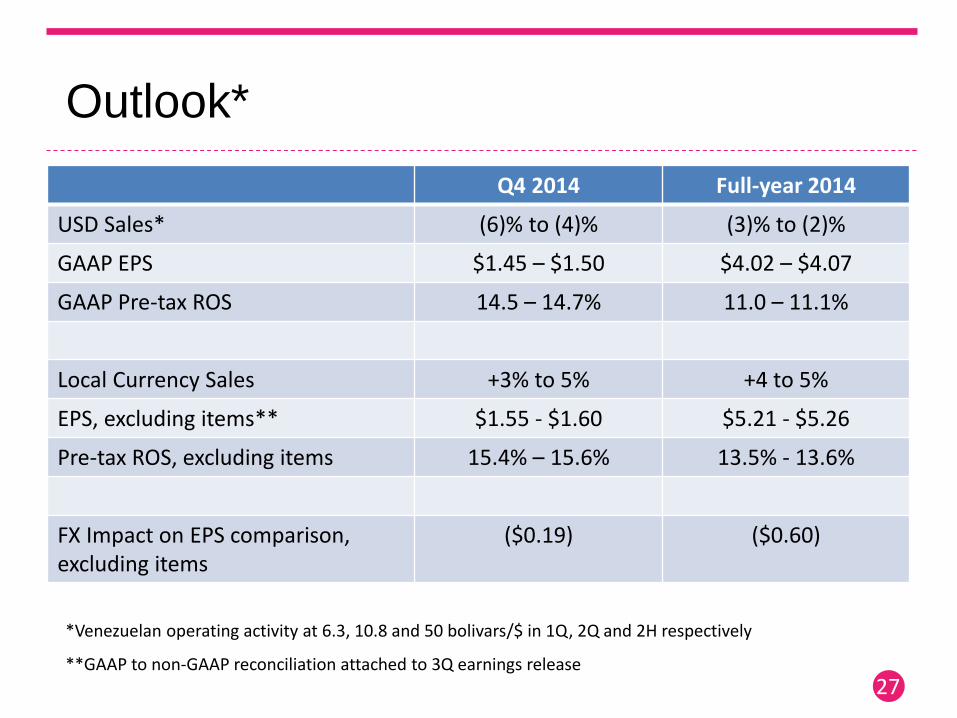
Outlook*
Q4 2014 Full-year 2014
USD Sales* (6)% to (4)% (3)% to (2)%
GAAP EPS $1.45 – $1.50 $4.02 – $4.07
GAAP Pre-tax ROS 14.5 – 14.7% 11.0 – 11.1%
Local Currency Sales +3% to 5% +4 to 5%
EPS, excluding items** $1.55 - $1.60 $5.21 - $5.26
Pre-tax ROS, excluding items 15.4% – 15.6% 13.5% - 13.6%
FX Impact on EPS comparison, excluding items
($0.19) ($0.60)
27
*Venezuelan operating activity at 6.3, 10.8 and 50 bolivars/$ in 1Q, 2Q and 2H respectively
**GAAP to non-GAAP reconciliation attached to 3Q earnings release
27
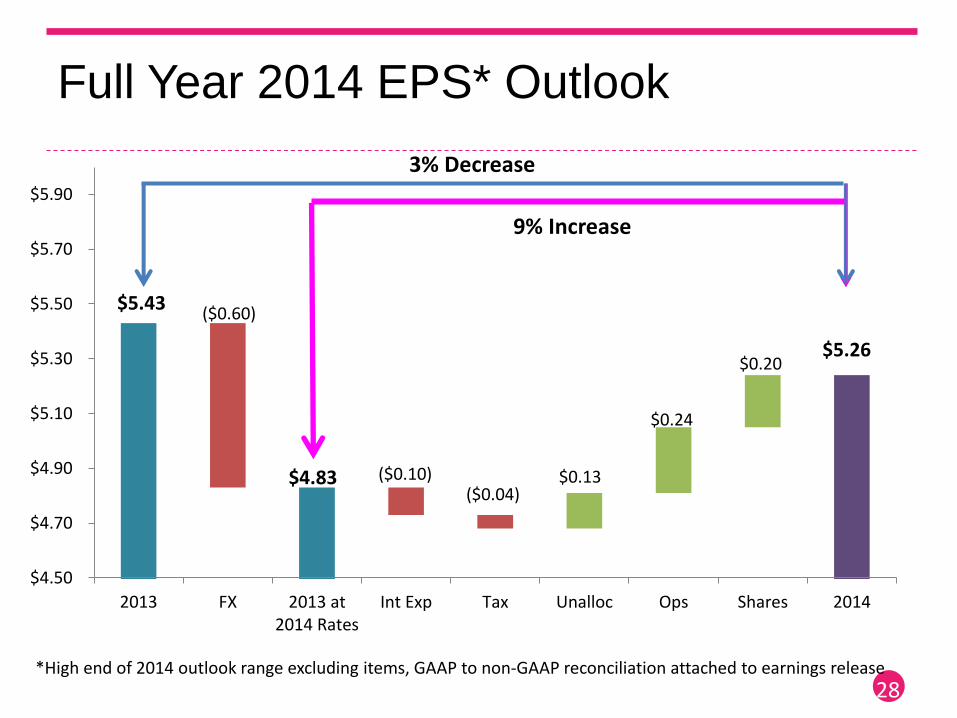
Full Year 2014 EPS* Outlook
28
$5.43 ($0.60)
($0.10) ($0.04)
$0.13
$0.24
$0.20 $5.26
$4.50
$4.70
$4.90
$5.10
$5.30
$5.50
$5.70
$5.90
2013 FX 2013 at2014 Rates
Int Exp Tax Unalloc Ops Shares 2014
*High end of 2014 outlook range excluding items, GAAP to non-GAAP reconciliation attached to earnings release
$4.83
3% Decrease
9% Increase

* As of October 22, 2014
2015 Sales Guidance
• Local Currency Sales: +4% to 6%
• FX impact (4.4)pp on Sales and negative 37 cents on EPS
• EPS guidance will be released with the Q4 2014 earnings
2016 and Beyond: Double Digit EPS Growth driven by:
• Local Currency Sales: +6% to 8%
• Emerging markets about 10%
• Established markets low single digit
• Pre-Tax ROS, excluding items: 50 bps improvement per year into the mid- to
high-teens
• Some offset from tax rate: going to 27-28% over time
• Share repurchases
Long Range Outlook*
29

Non-GAAP Financial Measures
Reconciliation
2011 2012 2013 Q1 2014 Q2 2014 Q3 2014 Q4 2014* 2014*
Net Income (GAAP) $218.3 $193.0 $274.2 $52.2 $47.6 $32.3 $76.0 $208.1
Adjustments:
Gains on disposal of assets including insurance recoveries (3.8) (7.9) (0.7) (1.8) (0.5) (2.3)
Re-engineering and other restructuring costs 9.6 22.1 9.3 3.9 4.2 2.6 2.7 14.8
Impact of Venezuelan bolivar devaluation from balance
sheet positions 4.2 13.4 22.2 6.5 40.6
Swap impairment and debt cost write-off 19.8
Acquired intangible asset amortization 2.9 2.1 4.8 2.9 3.0 3.1 2.9 11.9
Purchase accounting intangibles and goodwill impairment 36.1 76.9
Income tax impact of adjustments (9.6) (4.8) (3.5) (3.7) (1.4) 1.3 (0.7) (4.4)
Net Income (Adjusted) $273.3 $281.4 $288.3 $66.9 $75.1 $45.8 $80.9 $268.7
Adjusted ROS 13.9% 14.1% 14.1% 13.5% 14.7% 10.2% 15.6% 13.6 %
Average number of diluted shares (millions) 61.4 56.4 53.1 51.1 51.1 51.0 50.7 51.1
30
*High end of guidance range provided in October 22, 2014 Earnings Release.
Impact of changes in foreign currency versus prior year are updated monthly and posted on: http://ir.tupperwarebrands.com/foreign-exchange-impact.cfm
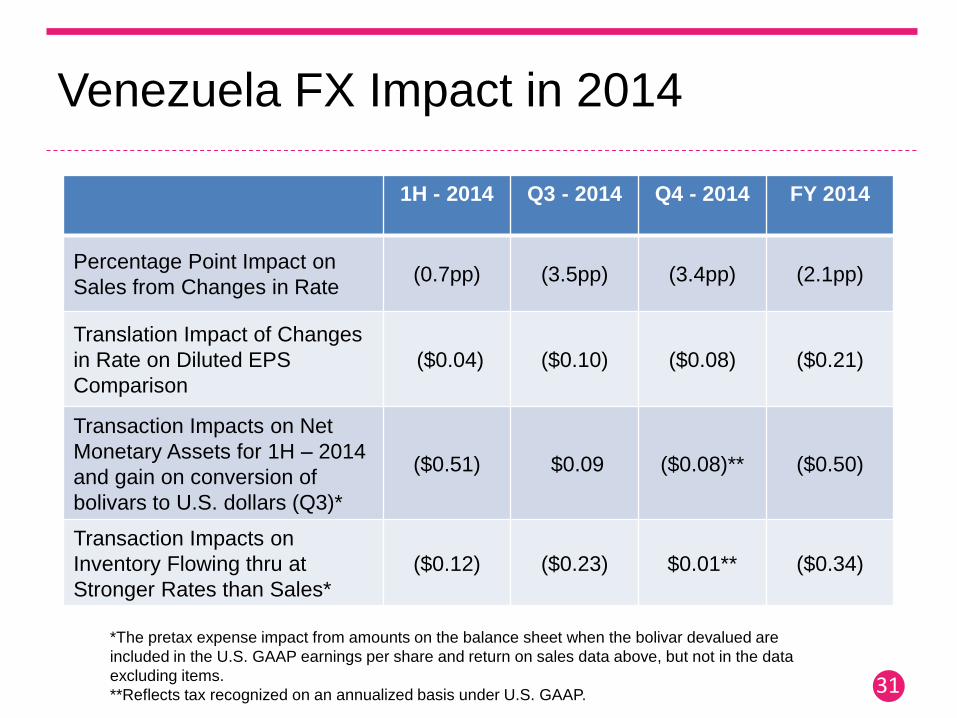
Venezuela FX Impact in 2014
31
1H - 2014 Q3 - 2014 Q4 - 2014 FY 2014
Percentage Point Impact on
Sales from Changes in Rate (0.7pp) (3.5pp) (3.4pp) (2.1pp)
Translation Impact of Changes
in Rate on Diluted EPS
Comparison
($0.04) ($0.10) ($0.08) ($0.21)
Transaction Impacts on Net
Monetary Assets for 1H – 2014
and gain on conversion of
bolivars to U.S. dollars (Q3)*
($0.51) $0.09 ($0.08)** ($0.50)
Transaction Impacts on
Inventory Flowing thru at
Stronger Rates than Sales*
($0.12) ($0.23) $0.01** ($0.34)
*The pretax expense impact from amounts on the balance sheet when the bolivar devalued are
included in the U.S. GAAP earnings per share and return on sales data above, but not in the data
excluding items.
**Reflects tax recognized on an annualized basis under U.S. GAAP.

March 2013
Building C O N F I D E N C E
Together
Mike Poteshman, Executive VP & CFO
January 2015


