
MiaMi-DaDe County Electricity
Master Plan:Establishing a Comprehensive Energy Management Program

MIAMI-DADE COUNTY
Carlos A. GimenezMayor
BOARD OF COUNTY COMMISSIONERSJoe A. Martínez
Chairman
Audrey M. Edmonson Vice Chairwoman
Barbara J. Jordan Lynda Bell
District 1 District 8
Jean Monestime Dennis C. Moss
District 2 District 9
Audrey M. Edmonson Sen. Javier D. Souto
District 3 District 10
Sally A. Heyman Joe A. Martínez
District 4 District 11
Bruno A. Barreiro José “Pepe” Díaz
District 5 District 12
Rebeca Sosa Esteban Bovo, Jr.
District 6 District 13
Xavier L. Suarez
District 7
Harvey RuvinClerk of Courts
Pedro J. GarcíaProperty Appraiser
Alina T. HudakCounty Manager
Robert A. Cuevas Jr.County Attorney

E l e c t r i c i t y P l a n 3
electricity Master Planning team:
Patricia Gomez, Sustainability Program Manager for Energy & Infrastructure, Office of Sustainability Angela Sager, Energy Management Specialist, Office of Sustainability Claudia Regojo, Energy Management Specialist, Office of Sustainability
With assistance From: Nichole Hefty, Manager, Office of Sustainability Margarita Fernandez, Sustainability Program Manager, Office of Sustainability Scott Perret, Former Program Assistant, Office of Sustainability
interdepartmental team (Sustainability Liaisons):
The following team of sustainability liaisons from capital departments has helped provide content and feedback for this Plan, and continuously coordinates energy saving initiatives within their departments. There are too many individuals to name who play a role in the day-to-day challenge of energy management and conservation and whose continuous efforts will be essential for implementation.
iSD Dan Coogan, Utilities Superintendent Tom Plummer, Assistant Physical Plant Manager
Libraries Jeffrey Rosenberg, Administrative Officer 3
MDFR Angel Lamela, Facilities & Construction Division Chief Armando Trelles, Mechanical Qualifier
MDPD Joseph Schweiger, Building Management Supervisor
MDaD Jorge Marin, Chief of Engineering
MDCR Simon Waterman, Commander, Facilities Management Bureau
MDt Akbar Sharifi, Senior Professional Engineer
PRoS Li Gurau, Section Head, Engineering, Capital Programs Division
PHCD Barry Cowvins, Purchasing Specialist
PWWM Sarah Hartfield, Special Project Administrator Gaspar Miranda, Assistant Director
Seaport Becky Hope, Engineer III
WaSD Bertha Goldenberg, Assistant Director
Graphic Design
Karla Echeverria, Graphic Designer, Community Information and Outreach
acknowlEdgEMEntsA C K N o W L E D G E M E N T S
Tables & Figures ......................................................................................................................................................................................... 5
Executive Summary .................................................................................................................................................................................. 7
Section 1: Introduction ................................................................................................................................................................................................8
Section 2: Challenges & Goals ...................................................................................................................................................................................9
Section 3: Understanding Energy Management ............................................................................................................................................. 11
Section 4: Organization-wide Energy Accounting .......................................................................................................................................... 12
Section 5: Department-Level Energy Management ....................................................................................................................................... 14
Section 6: Conclusion ................................................................................................................................................................................................ 21
Miami-Dade County Organization-Level Strategies ............................................................................................................................... 22
Department Energy Profiles
Miami-Dade Aviation Department (MDAD) ........................................................................................................................................... 26
Miami-Dade Water & Sewer Department (WASD) ................................................................................................................................ 28
Miami-Dade Internal Services Department (ISD; Formerly GSA) .................................................................................................... 30
Miami-Dade Transit (MDT) ............................................................................................................................................................................ 32
Miami-Dade Public Works Waste Management Department (PWWM; Formerly PWD and SWM) ..................................... 34
PortMiami (Seaport) ........................................................................................................................................................................................ 36
Miami-Dade Corrections & Rehabilitation (MDCR) .............................................................................................................................. 38
Appendices
Appendix 1: Electricity Reduction Ordinance ........................................................................................................................................ 40
Appendix 2: Report on Efforts to Develop an Electricity Reduction Plan .................................................................................... 42
Appendix 3: Energy Efficiency and Conservation Block Grant (EECBG) Project Summary .................................................... 45
Appendix 4: Resources for Low Cost/No Cost Energy Conservation Measures (ECMs) .......................................................... 46
Appendix 5: Behavior Change Programs ................................................................................................................................................. 47
Appendix 6: Economic Analysis and Financing Options .................................................................................................................... 49
References ..................................................................................................................................................................................................51
tablE of contEntsT A B L E o F C o N T E N T S
Table 1: Prioritizing Energy Conservation Measures ....................................................................................................................................... 18
Figure 1: County Electricity Consumption and Reduction Schedule ..........................................................................................................8
Figure 2: EnergyCap Software Screenshot ......................................................................................................................................................... 14
Figure 3: Miami-Dade County Government Electricity Consumption 2010 .......................................................................................... 15
Figure 4: Energy Management and Planning Cycle ........................................................................................................................................ 16
Figure 5: ESCO Project Savings ............................................................................................................................................................................... 19
tablEs & figurEsT A B L E S & F i G u R E S

M i a m i - D a d e C o u n t y6

E l e c t r i c i t y P l a n 7
The Miami-Dade County Electricity Master Plan: Establishing a Comprehensive Energy Management Program, provides a systemic approach to efficient energy use within Miami-Dade County government operations. Although this Plan focuses on electric power consumption, in the future it will be revised to include all forms of energy that are utilized throughout County operations, as energy should be managed holistically. It should be noted that certain efficiencies (e.g., PortMiami switching from diesel powered to electrified cranes) cannot be properly captured without accounting for all fuel sources. New initiatives being implemented organization-wide, which will be discussed throughout this Plan, also support the integration of all energy sources into one comprehensive energy management strategy. This Plan is designed to be a first step toward achieving a complete energy management objective for the County.
Woven throughout the Plan is the theme that energy management must be addressed both at the organization (macro) and at the department (micro) level. At the organization level, government-wide strategies are identified, including the implementation of energy accounting software, cross-departmental coordination, and multi-level stakeholder engagement. At the department level, a practical process for undertaking energy management is provided. This consists of a five step cycle: conducting a baseline inventory; benchmarking; setting goals and identifying opportunities; “making it happen;” and measuring performance.
At the end of the report, organization-wide strategies and current implementation projects are discussed, as well as future strategies identified. Lastly, the six largest electricity consuming departments (“big users”), which represent approximately 87 percent of County electricity use, are profiled. In addition, one department that accounts for a minor portion of total government electricity consumption is included for its exemplary energy performance. Each department’s self-assessed ability to manage energy is included, as are their electricity consumption data and recent energy performance improvement projects. The profiles are meant to provide a template that can be updated and expanded on annually to report on each department’s contribution toward the County’s electricity reduction target of 20 percent below 2007 consumption levels by 2014.
ExcEcutivE suMMaryE x E C u T i v E S u M M A R y
M i a m i - D a d e C o u n t y8
Section 1: IntroductionMiami-Dade County government is dependent on electricity for every facet of its operations. From powering its airport, seaport and railway, to treating and delivering drinking water, to operating landfills and hundreds of buildings, electricity is vital to the services the County provides to its 2.5 million residents.
Florida Power & Light (FPL) is Miami-Dade County’s main provider of electricity. The County is FPL’s tenth largest electricity purchaser, consuming more than one million megawatt hours of electricity per year. Miami-Dade County government’s electric energy footprint represents about 10 percent of electricity consumed community-wide and costs over $100 hundred million annually.
Miami-Dade government facilities present prime opportunities for reducing energy use and saving taxpayer dollars. According to the U.S. Department of Energy (DOE), nearly one-third of the energy used in a typical public building in the U.S. goes to waste. These buildings can be made up to 80 percent more efficient with new and existing technologies. An energy efficient government not only allows public entities to spend more on public services and less on utility bills; it also reduces operations and maintenance costs. In addition, investing in improved energy performance generates jobs and economic growth. It also lessens the need for new plants or expanded capacity, which in turn, reduces emissions from fossil-fuel-based energy sources as well as nuclear waste from nuclear power plants.
It is the government’s duty to use its financial resources to function as efficiently and as leanly as possible, as well as to practice good stewardship of natural resources, such as
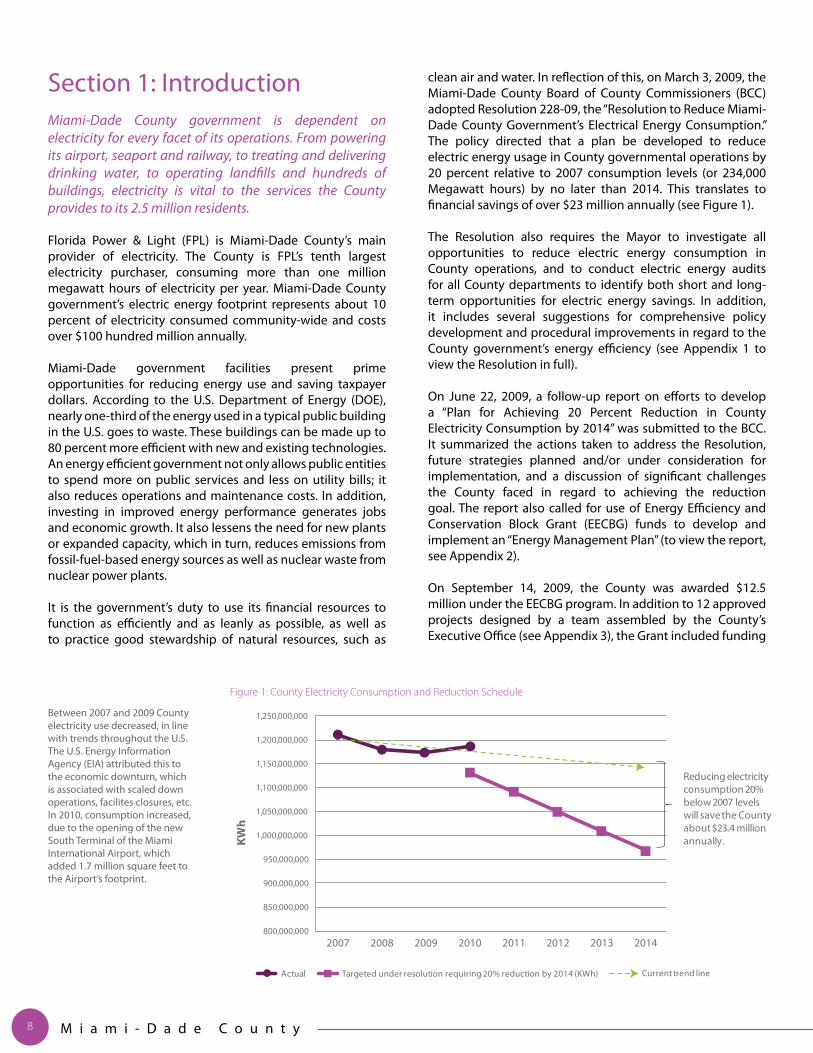
clean air and water. In reflection of this, on March 3, 2009, the Miami-Dade County Board of County Commissioners (BCC) adopted Resolution 228-09, the “Resolution to Reduce Miami-Dade County Government’s Electrical Energy Consumption.” The policy directed that a plan be developed to reduce electric energy usage in County governmental operations by 20 percent relative to 2007 consumption levels (or 234,000 Megawatt hours) by no later than 2014. This translates to financial savings of over $23 million annually (see Figure 1).
The Resolution also requires the Mayor to investigate all opportunities to reduce electric energy consumption in County operations, and to conduct electric energy audits for all County departments to identify both short and long-term opportunities for electric energy savings. In addition, it includes several suggestions for comprehensive policy development and procedural improvements in regard to the County government’s energy efficiency (see Appendix 1 to view the Resolution in full).
On June 22, 2009, a follow-up report on efforts to develop a “Plan for Achieving 20 Percent Reduction in County Electricity Consumption by 2014” was submitted to the BCC. It summarized the actions taken to address the Resolution, future strategies planned and/or under consideration for implementation, and a discussion of significant challenges the County faced in regard to achieving the reduction goal. The report also called for use of Energy Efficiency and Conservation Block Grant (EECBG) funds to develop and implement an “Energy Management Plan” (to view the report, see Appendix 2).
On September 14, 2009, the County was awarded $12.5 million under the EECBG program. In addition to 12 approved projects designed by a team assembled by the County’s Executive Office (see Appendix 3), the Grant included funding
Between 2007 and 2009 County electricity use decreased, in line with trends throughout the U.S. The U.S. Energy Information Agency (EIA) attributed this to the economic downturn, which is associated with scaled down operations, facilites closures, etc. In 2010, consumption increased, due to the opening of the new South Terminal of the Miami International Airport, which added 1.7 million square feet to the Airport’s footprint.
Figure 1: County Electricity Consumption and Reduction Schedule
800,000,000
850,000,000
900,000,000
950,000,000
1,000,000,000
1,050,000,000
1,100,000,000
1,150,000,000
1,200,000,000
1,250,000,000
2007 2008 2009 2010 2011 2012 2013 2014
KWh
Actual Targeted under resolution requiring 20% reduction by 2014 (KWh) Current trend line
Reducing electricity consumption 20% below 2007 levelswill save the County about $23.4 million annually.

E l e c t r i c i t y P l a n 9
for personnel to develop an “Energy Management Plan”. The Miami-Dade County Electricity Master Plan: Establishing a Comprehensive Energy Management Program was produced over the course of 2010-2012 by the Energy Team in Miami-Dade County’s Office of Sustainability. It should be noted that this Plan focuses solely on electricity consumption and does not encompass all energy sources. The reasons for this are:
1. Legislative direction is specific to electricity.
2. Geography and local fuel mix make electric power the primary form of energy consumed in Miami-Dade government facilities.
3. A system for tracking consumption of all other energy sources consumed by County government (i.e., natural gas, propane, diesel, etc.) is already in place as a result in the County’s membership in the Chicago Climate Exchange.
4. Tackling electricity consumption is being viewed as the first step toward establishing a comprehensive energy management program for Miami-Dade County operations.
The objective of this Plan is to lay the framework for coordinated interdepartmental energy management within the County. It consists of cross-departmental initiatives to streamline energy management, as well as five implementation steps for creating distinct, customized plans for each capital department. It is complementary with all other overlapping energy-related initiatives currently underway in the County, including but not limited to, GreenPrint, the Sustainable Buildings Program and departmental master plans.
Section 2: Challenges & GoalsEstablishing an energy management program is challenging, however these challenges are not unique to Miami-Dade County. If the challenges are not surmounted, the County will miss the opportunity to reduce waste, function more cost-efficiently, make better capital improvement decisions and decrease its environmental impact.
Challenge #1: Expanding County services to meet the needs of a growing population requires more electricity, not less.
Between 2000 and 2010 the population of Miami-Dade County grew 10 percent. Population growth places pressure on the County to provide utilities such as water and sewer and waste collection. In addition, expansion of the Airport and PortMiami are critical to the County’s economic vitality. All of these factors tend to increase electricity consumption.
Strategies:
1. Decrease energy intensity:
• Become less energy intensive (e.g., by reducing electricity consumption per square foot). In cases of inevitable growth, this is as important as striving toward absolute reductions in electricity consumption.
2. Maximize energy conservation and energy efficiency through operational and capital improvements:
• Starting with no/low cost measures (see Appendix 4), capture energy and cost savings opportunities.
• Engage operations and maintenance staff to institute energy savings policies.
• Follow green procurement policies and use life cycle analysis, ROI calculations and other analytic tools when making procurement decisions.
• Use slated capital improvement projects as opportunities to plan ahead for energy efficiency.
3. Reduce costs by shaving “peak” demand. Electricity is most expensive when demand is at its highest. While energy efficiency and conservation reduce electricity consumption, taking additional actions to use less electricity during peak times saves both energy and money:
• Analyze utility bills to identify dates and times when peaks occur, remembering to correlate with outdoor temperature, operating schedules and other relevant variables. This will provide an understanding of how to control loads in these situations. Adjust loads during peak demand times (e.g., reduce unneeded lighting, allow temperatures to rise for short periods, sequence variable-speed fans, add thermal storage) or supply them without using utility power (e.g., solar). When possible, automate building management systems (BMS) accordingly, or make system operators
Department Highlight: PortMiamiPortMiami is committed to promoting responsible growth and supporting innovative development throughout its operations. Its Green Sustainable Initiative Practices include energy efficient roof measures, such as reflective coatings and membranes with a minimum solar reflectance of 80 percent and a minimum roof insulation of R19. Port Miami is currently in the process of receiving a FPL Energy Program Rebate of $0.45/sq. ft. for its latest re-roofing projects. Pictured below on one of Port Miami’s new solar reflective roofs (left to right): Becky Hope, Elizabeth Ogden, Art Tillberg, Victoria Valdez, Kari Garland

M i a m i - D a d e C o u n t y10
responsible for making adjustments when demand approaches a pre-determined limit.
Challenge #2: Financing energy improvements is difficult under current economic constraints.
Budget and staff cutbacks and competing priorities make it difficult to justify energy efficiency and conservation projects.
Strategies:
1. When a comprehensive retrofit is not an option, harvest no cost/low cost savings opportunities:
• Find “low hanging fruit” (e.g., replace high wattage lighting with lower wattage lamps, turn off equipment that continues to run when it isn’t required, cut waste associated with simultaneous heating and cooling by employing reset strategies on chilled water temperature, find and repair leaks in compressed air systems).
• Provide energy consumption/waste information to occupants to promote a sense of ownership. Consumption data can be obtained by data loggers, which provide real-time data, or alternatively, simple estimates based on energy ratings, hours of operation, etc. Display the information via emails, on electronic dashboards, at building entrances, etc.
• Promote behavior change using methods such as “power down” policies (see pg. 15), training on efficient equipment operation and energy awareness workshops.
2. Create department “energy budgets” to properly allocate costs and incentivize savings (see pg. 19):
• Create a budget specific to energy, so that savings do not accrue to the general budget, but rather to individual departmental energy budgets. Being able to keep the “money not spent” is an incentive to departments to reduce electricity.
• Reinvest savings from energy efficiency projects into additional energy performance improvements, slowly increasing the size and scope of the projects.
3. Make the business case:
• Use economic analysis and life cycle costing to demonstrate cost-effectiveness (see Appendix 5). Unlike other public capital projects, the savings from energy efficiency projects provide financial returns. Once a project is completed the savings can be as great as 25-30 percent per year. What other capital projects can say the same?
4. Use creative financing:
• Take advantage of the County’s Energy Performance Contracting (EPC) program. Through EPC, projects are funded by third party financing and paid back over time with the money they save on utility bills. Energy service companies (ESCOs) provide turnkey services and guarantee project savings (see pg. 19 and Appendix 5).
Department Highlight: Miami-Dade Fire & RescueMDFR’s Armando Trelles conducted an inventory of air conditioning systems at 70 fire stations across the County to make sure the warranties were up to date. Realizing he had a useful inventory of information, he used the list to identify the oldest units and prioritize their replacements. MDFR now has an equipment replacement plan for its air conditioners. By proactively replacing the units as budgets permit, MDFR will move toward having efficient ENERGY STAR rated air conditioners in all fire stations and avoid outages caused by aging equipment. This also avoids the use of costly and dirty diesel generators.
Pictured left: Armando Trelles and Frank Morales
E l e c t r i c i t y P l a n 11
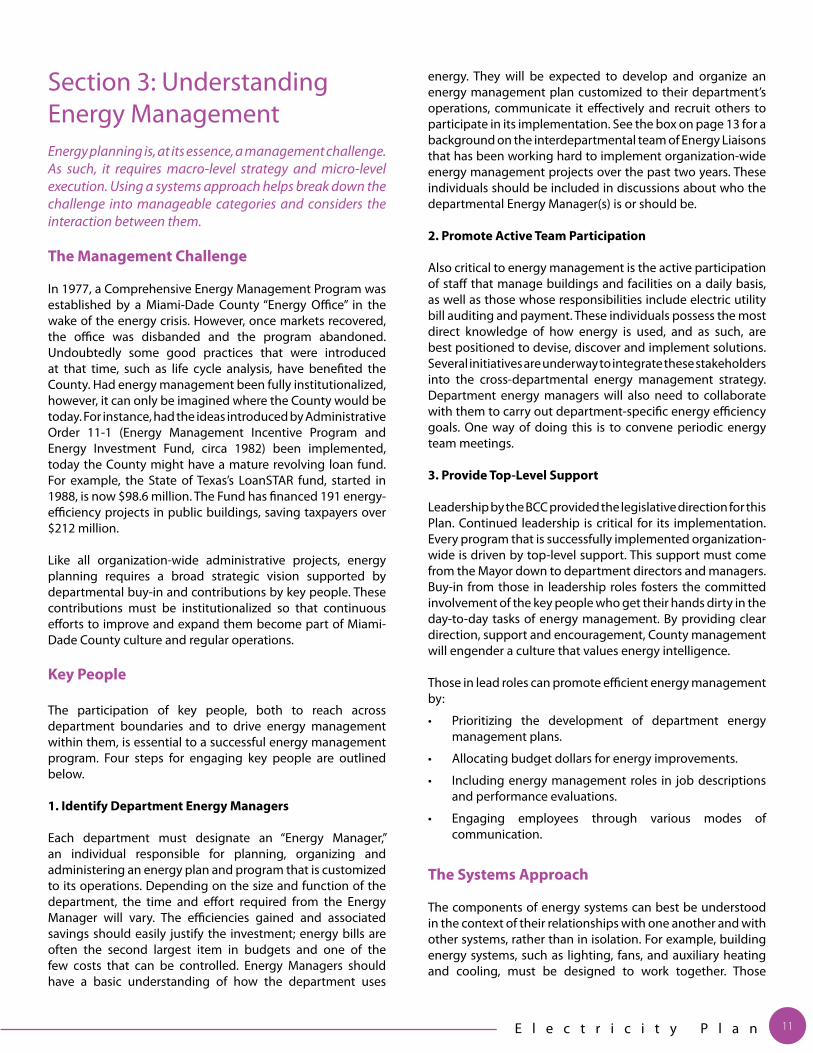
Section 3: Understanding Energy ManagementEnergy planning is, at its essence, a management challenge. As such, it requires macro-level strategy and micro-level execution. Using a systems approach helps break down the challenge into manageable categories and considers the interaction between them.
the Management Challenge
In 1977, a Comprehensive Energy Management Program was established by a Miami-Dade County “Energy Office” in the wake of the energy crisis. However, once markets recovered, the office was disbanded and the program abandoned. Undoubtedly some good practices that were introduced at that time, such as life cycle analysis, have benefited the County. Had energy management been fully institutionalized, however, it can only be imagined where the County would be today. For instance, had the ideas introduced by Administrative Order 11-1 (Energy Management Incentive Program and Energy Investment Fund, circa 1982) been implemented, today the County might have a mature revolving loan fund. For example, the State of Texas’s LoanSTAR fund, started in 1988, is now $98.6 million. The Fund has financed 191 energy-efficiency projects in public buildings, saving taxpayers over $212 million.
Like all organization-wide administrative projects, energy planning requires a broad strategic vision supported by departmental buy-in and contributions by key people. These contributions must be institutionalized so that continuous efforts to improve and expand them become part of Miami-Dade County culture and regular operations.
Key People
The participation of key people, both to reach across department boundaries and to drive energy management within them, is essential to a successful energy management program. Four steps for engaging key people are outlined below.
1. identify Department energy Managers
Each department must designate an “Energy Manager,” an individual responsible for planning, organizing and administering an energy plan and program that is customized to its operations. Depending on the size and function of the department, the time and effort required from the Energy Manager will vary. The efficiencies gained and associated savings should easily justify the investment; energy bills are often the second largest item in budgets and one of the few costs that can be controlled. Energy Managers should have a basic understanding of how the department uses
energy. They will be expected to develop and organize an energy management plan customized to their department’s operations, communicate it effectively and recruit others to participate in its implementation. See the box on page 13 for a background on the interdepartmental team of Energy Liaisons that has been working hard to implement organization-wide energy management projects over the past two years. These individuals should be included in discussions about who the departmental Energy Manager(s) is or should be.
2. Promote active team Participation
Also critical to energy management is the active participation of staff that manage buildings and facilities on a daily basis, as well as those whose responsibilities include electric utility bill auditing and payment. These individuals possess the most direct knowledge of how energy is used, and as such, are best positioned to devise, discover and implement solutions. Several initiatives are underway to integrate these stakeholders into the cross-departmental energy management strategy. Department energy managers will also need to collaborate with them to carry out department-specific energy efficiency goals. One way of doing this is to convene periodic energy team meetings.
3. Provide top-Level Support
Leadership by the BCC provided the legislative direction for this Plan. Continued leadership is critical for its implementation. Every program that is successfully implemented organization-wide is driven by top-level support. This support must come from the Mayor down to department directors and managers. Buy-in from those in leadership roles fosters the committed involvement of the key people who get their hands dirty in the day-to-day tasks of energy management. By providing clear direction, support and encouragement, County management will engender a culture that values energy intelligence.
Those in lead roles can promote efficient energy management by:
• Prioritizing the development of department energy management plans.
• Allocating budget dollars for energy improvements.
• Including energy management roles in job descriptions and performance evaluations.
• Engaging employees through various modes of communication.
the Systems approach
The components of energy systems can best be understood in the context of their relationships with one another and with other systems, rather than in isolation. For example, building energy systems, such as lighting, fans, and auxiliary heating and cooling, must be designed to work together. Those
M i a m i - D a d e C o u n t y12
systems are part of the larger built environment that includes buildings, neighborhoods and cities, which are in turn, part of the broader natural ecosystem. Carefully considering the interactions between systems, rather than thinking of them in silos, reveals trade-offs and opportunities for delivering multiple benefits across systems, and avoids unforeseen gains-cancelling consequences.
Analyzing energy at a more detailed level draws system boundaries around a facility or building. Breaking down energy systems into sub-systems is a way to “divide and conquer” energy management challenges. Each sub-system can be analyzed independently for opportunities for meaningful energy savings, but sub-systems should also be cross-examined to determine how they interact with and affect one another, as altering one will likely impact the others. There are three basic energy sub-systems that provide a jumping off point from which to approach energy management. 1. energized Systems
These are the systems that require energy to operate. In a building, energized systems might include heating, ventilation and air conditioning (HVAC); lighting; security systems; automated building management systems and plug loads. In a pipeline, pumps are the energized systems.
2. non-energized Systems
These are the material or physical systems that do not require energy inputs to function. Non-energized systems in a building are found primarily in the structure itself, for example, in the walls, insulation, windows or roof. A pipeline’s non-energized systems are the pipes.
3. the Human element
People make up the third sub-system affecting energy use. From office workers, to mechanical system operators, to facilities managers, to cleaning staff, people and their behaviors have substantial impacts on energy use.
The main difference between the first two “hard” systems (energized and non-energized) and the third “soft” system (the human element) is that the performance of the former can be predicted based on design. To an extent, energy modeling can calculate how a building will perform if those systems are designed and built to certain specifications. However, the human element is less predictable. There is a tendency to make assumptions about behavior, for example, that optimal operations and maintenance will be upheld. This can lead to the failure of even the best-laid plans. Thus, how an energy performance improvement project impacts people, how people react to those impacts, and how they interact with the project itself, must all be taken into account for the project to be successful.
Applying systems thinking will help planners, decision makers and staff to think holistically, and to see the interrelatedness between component parts. Systems thinking should be fostered across departments, among County staff, as well as with vendors bidding on projects.
Section 4: Organization-Wide Energy AccountingTo provide access to cost and consumption data and auditing abilities, comprehensive utility billing/energy management software is being implemented enterprise-wide in 2011 and 2012.
The ability to track, analyze and report the consumption and cost of electricity is essential to energy management. For several years Miami-Dade County struggled with the functionality of its outdated Energy Reporting System (ERS) software. Nearly 30 years old, ERS is obsolete and provides limited features compared with modern energy accounting software. ERS is unable to accept the industry standard data format (EDI), limiting the County’s ability to receive and analyze automated electricity consumption data from FPL and monitor electricity use in real time.
In addition, ERS does not communicate with the County’s billing systems; in fact, many of the County’s 4,500+ electricity bills are entered manually into the different financial systems used by County departments. This is not only highly inefficient, but prevents the County from systematically connecting the financial cost of electricity with consumption. ERS software also lacks analytical and auditing abilities. Billing audits are performed by hand, restricting the number of accounts that can be analyzed during each billing cycle. This limits the County’s ability to identify errors and overcharges, find refund opportunities and examine usage patterns to identify prospects for cost savings.
Defining energy Management
Energy management is the practice of using energy more efficiently by striving to eliminate energy waste. The three fundamental components are:
•Efficient purchasing – purchasing energy at the lowest availableunit cost.
•Efficient operation – operating the equipment that consumesenergy as efficiently as possible.
•Efficient equipment – upgrading or replacing equipment withmore energy efficient equipment when it is cost-effective to do so.

E l e c t r i c i t y P l a n 13
In September 2010, the Office of Sustainability assembled an interdepartmental team (“Energy Management Liaisons”) to help spearhead energy management County-wide. The Liaisons were appointed by their department directors to:
•Outlinedepartment-specificcontributionstothegovernment-wideelectricity reduction target.
•Communicatecross-departmentalinitiativesandprogramsforachieving energy reduction goals.
•Sharebestpracticeswithcolleaguesinotherdepartments.
•Trackelectricconsumptionandhelpempowertheirrespectivedepartments to achieve cost and environmental benefits.
•Leadeffortstobenchmarktheenergyperformanceofbuildingsmanaged by their departments in ENERGY STAR® Portfolio Manager.
The Liaisons team met periodically and began tackling these goals.However, it soon became apparent that achieving them would require a stronger commitment from departments and greater participation from key people.
Some Liaisons were actively engaged in energy management; others were not. Several individuals expressed that they needed better support from their managers and departments in order to properly assume the responsibility.
At the same time, the Energy Team in the Office of Sustainability was working to implement initiatives and gaining a better understanding of how energy and billing was managed within each department. It became clear that the most valuable contribution from the liaisons was tracking down key people, and using their established rapport with those individuals to deliver action items. Since energy projects can involve engineers, building managers, and even accountants, there isn’t just one person who can answer every question. But one person can track down the people who have the answers.
In December, 2011, the Office of Sustainability convened the original group to discuss the liaison role going forward. The outcome was a revision of group responsibilities to reflect the County’s evolving energy management strategy. In addition, qualifications for membership were added to ensure that the right people are filling the positions. The team will continue to liaise with the Office of Sustainability on energy and other issues related to the management of County resources. It is chaired by the Energy Management Specialist, and is comprised of 25 members (one per department and an alternate if desired).
Revised Responsibilities:
•Supportsustainabilitystaffintheimplementationofenergyreductionprograms and other conservation initiatives as projects arise.
•Implementaworkplanthatcanbeusedbyindividualdepartmentstooutline department-specific contributions to the government-wide electricity reduction goal.
•Come up with creative ideas to spur conservation in respectivedepartments, and communicate progress and successes with the Sustainability staff. Work with department directors, managers and staff to shepherd the implementation and institutionalization of resource conservation projects (i.e., energy, fuel, water, etc.).
•ServeasthelinkbetweenSustainabilityandCountydepartmentstocommunicate initiatives for achieving various sustainability goals as well as relay feedback from departments to the Office of Sustainability.
Qualifications for Membership:
•Effective,well-liked,well-respectedinfluencerwhocommunicateswell with different types of stakeholders within and outside individual departments.
•Strong,positiverelationshipwithdepartmentdirector.
•Results-orientedindividualwithdrivetoaccomplishgoalsandtasks.
•Curiouslearneropentonewinformationandideas.
•Committed,passionate,engagedadvocateforsustainability,withaclear understanding of the opportunities it provides for the County.
Meetings:
•Insteadofmeetingsemi-regularly,groupsor“task forces” that formto accomplish specific projects will meet on an as-needed basis when implementation of specific programs is taking place. The rest of the group will not be required to attend meetings unless their department is participating in a specific program.
•Communicationwilltakeplacethroughemail,gNetandSharePointon an ongoing basis.
As of May 2012, there are two task forces working on projects related to the Electricity Master Plan (EMP). They are: the implementation of the new utility billing software, and the inventory and management of data for ENERGY STAR Portfolio Manager. A third project will be the development of departmental electricity/energy management plans.
energy Management Liaisons
M i a m i - D a d e C o u n t y14
In the absence of centralized energy management since the early 1980s, the County has been operating without a way of analyzing electricity consumption in relation to monetary costs. Tying actual electricity consumption to billing is a prerequisite for nearly all data management and benchmarking efforts and only becomes more important as energy costs rise. Fortunately, procurement of a software solution for the County has been made possible by EECBG dollars.
EnergyCAP, the new utility billing/energy management software, interfaces with two out of three of the County’s financial systems, as well as with accounting, metering information from Enterprise Asset Management System (EAMS), and the U.S. Department of Energy’s ENERGY STAR Automated Benchmarking System. It generates expected retroactive reimbursements and provides ongoing energy billing, monitoring and verification.
A specified number of users will be able to access and address data, and each department will have the ability to assign various permission levels to its staff in accordance with their responsibilities. The software will allow designated staff to run and view detailed reports, conduct rate analyses, and eventually, to calculate the financial, energy and emissions costs of multiple sources in addition to electricity (e.g., fuel, water, solid waste).
Prior to the procurement of the new utility billing/energy management software, six departments collectively accounting for 87 percent of the County’s electricity consumption were consulted. Most of these departments are represented on the task force that is rolling out the software over the fiscal year 2011-2012. A conservative estimate of expected savings to result from the implementation of the
new software is two percent of County electricity use in the first year. This will also translate to significant cost savings, not only in reduced utility bills (an estimated $2 million in the first year alone), but in improved efficiency of the bill auditing and processing.
Section 5: Department-Level Energy ManagementTo embed efficiency in systems and operations, energy planning must be integrated into departmental master plans. Each department should have a customized departmental energy management plan that is updated regularly and used as a road map toward increasing efficiency. The Implementation Steps outlined in the following pages give departments a route to creating such a plan even as they work toward identifying and realizing a preliminary round of energy performance improvements.
energy Management: a Five Step Cycle
Increased pressure on limited resources will, over time, require the County to innovate toward energy efficiency on an ongoing basis. The current mandate of 20 percent reduction in electricity use from 2007 levels should therefore be viewed as the first stop on a journey rather than as a final target.
Thus, the five step implementation process introduced in this section is intended to be understood and followed as a
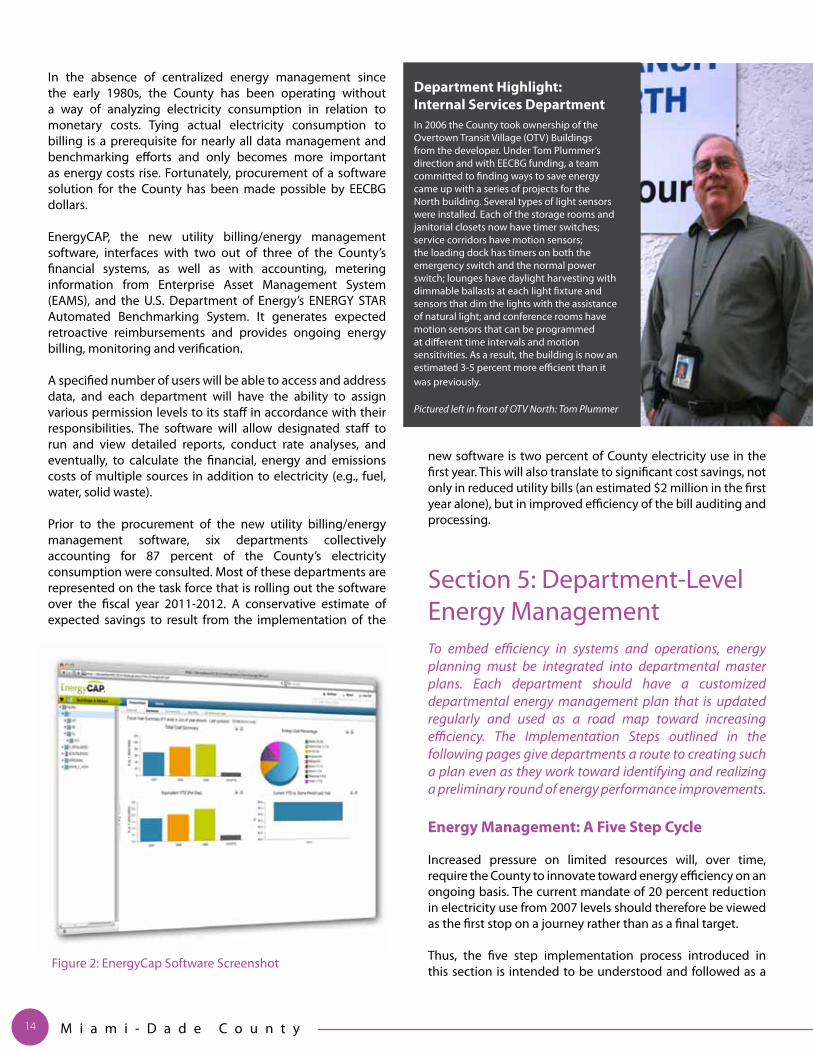
Figure 2: EnergyCap Software Screenshot
Department Highlight: internal Services DepartmentIn 2006 the County took ownership of the Overtown Transit Village (OTV) Buildings from the developer. Under Tom Plummer’s direction and with EECBG funding, a team committed to finding ways to save energy came up with a series of projects for the North building. Several types of light sensors were installed. Each of the storage rooms and janitorial closets now have timer switches; service corridors have motion sensors; the loading dock has timers on both the emergency switch and the normal power switch; lounges have daylight harvesting with dimmable ballasts at each light fixture and sensors that dim the lights with the assistance of natural light; and conference rooms have motion sensors that can be programmed at different time intervals and motion sensitivities. As a result, the building is now an estimated 3-5 percent more efficient than it was previously.
Pictured left in front of OTV North: Tom Plummer
E l e c t r i c i t y P l a n 15
continuous cycle, rather than as a linear route with a definitive endpoint. The outputs of the process are designed to inform and feed back into the next cycle, allowing for continuous improvement over time.
The first time a department follows the five steps, the process should result in a refining of the goals and framework initially identified, culminating in a customized departmental energy management plan. This should not be a plan that sits on a shelf; rather, it should be a living, working document. Over time it should be updated as staff moves toward more ambitious targets and identifies new projects to pursue as progress is measured, improvements are made and successes and failures are metabolized.
The implementation steps are primarily designed for the departments that manage buildings and pay electric bills directly, since having access to data and the ability to manage facilities is central to the energy management process. In 2010, 58 percent of the County’s electricity consumption was concentrated in two departments, Water and Sewer
Department (WASD), and Miami-Dade Aviation Department (MDAD). General Services Administration (GSA), Miami-Dade Transit (MDT), Public Works Department (PWD) and PortMiami accounted for an additional 29 percent (see Figure 3). These departments are therefore a critical area of focus for energy management, since combined, they account for 87 percent of the County government’s electricity consumption.
As of October 2011, Mayor Gimenez reorganized the County into 25 departments. The top five electricity consuming departments remain unchanged, with two exceptions. GSA was renamed “Internal Services Department,” (ISD) and PWD was combined with Solid Waste Management (SWM) to form PWWM. This increased PWD’s electricity footprint, requiring an adjustment to its electricity baseline (see Baselines Adjustment Guidelines, pg. 17). However, SWM brought with it a benefit – landfill gas, which isconverted to renewable electricity, not only supplies its own power needs but also generates revenue for the County. It’s important to note that not all departments are in direct control over their electricity bills. Many small or non-capital departments
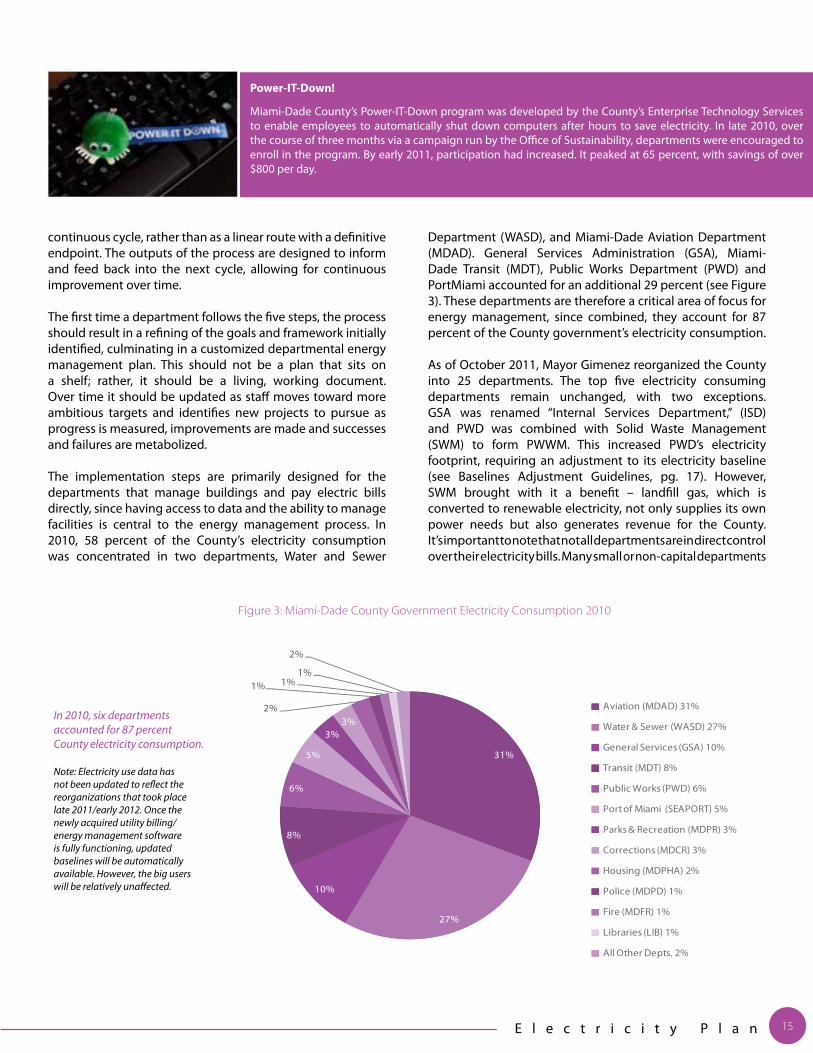
In 2010, six departments accounted for 87 percent County electricity consumption.
Note: Electricity use data has not been updated to reflect the reorganizations that took place late 2011/early 2012. Once the newly acquired utility billing/energy management software is fully functioning, updated baselines will be automatically available. However, the big users will be relatively unaffected.
31%
27%
10%
8%
6%
5%
3%3%
2%
1% 1%1%
2%
Aviation (MDAD) 31%
Water & Sewer (WASD) 27%
General Services (GSA) 10%
Transit (MDT) 8%
Public Works (PWD) 6%
Port of Miami (SEAPORT) 5%
Parks & Recreation (MDPR) 3%
Corrections (MDCR) 3%
Housing (MDPHA) 2%
Police (MDPD) 1%
Fire (MDFR) 1%
Libraries (LIB) 1%
All Other Depts. 2%
Figure 3: Miami-Dade County Government Electricity Consumption 2010
Power-it-Down!
Miami-Dade County’s Power-IT-Down program was developed by the County’s Enterprise Technology Services to enable employees to automatically shut down computers after hours to save electricity. In late 2010, over the course of three months via a campaign run by the Office of Sustainability, departments were encouraged to enroll in the program. By early 2011, participation had increased. It peaked at 65 percent, with savings of over $800 per day.
M i a m i - D a d e C o u n t y16
outsource their building management, which commonly includes utility bill payment to ISD. This does not, however, exclude smaller departments that outsource their building management from participating in energy reduction initiatives.
Despite their inability to manage buildings and electric bills directly, many of these departments are enthusiastically seizing opportunities to reduce energy consumption through behavioral changes, implementing initiatives such as Power-IT-Down and “lights out” policies for after hours (See Appendix 4 for a list of resources for low cost/no cost energy conservation measures that can be employed by all departments, including small users). Small departments are also encouraged to work collaboratively with ISD on energy management. In order for the County to achieve its initial reduction goal for electricity consumption - of 20 percent below 2007 consumption levels by 2014 - each department, director and staff member will need to participate. Every contribution is meaningful and brings the institution as a whole closer to its goal.
Step #1: Baseline inventory
Establishing a baseline is critical to energy management, since it provides a benchmark from which to measure progress and make decisions. It consists of two steps: first, inventorying facilities that fall under the department’s jurisdiction (those facilities for which the department manages the building and/or pays the electric bills); second, accounting for how much electricity those facilities consumed in the baseline year (2007, per the County mandate). Once the baseline inventory is complete, repeat the data collection process for every subsequent year (2008-present).
The data collection process alone often reveals opportunities to save energy and money because it illuminates details that otherwise go unnoticed. From the baseline and annual consumption data, usage patterns and statistical outliers become apparent. In addition, assembling consumption data answers many questions that are critical to developing departmental energy management plans, such as which facilities are using the most electricity, and when, so that better rates might be negotiated, or improvements made to avoid demand charges.
Baselines are also important at the project level. If a baseline is not measured prior to project implementation, it can be difficult to calculate the project’s impact on energy consumption. If existing data is unavailable at the level of detail needed, consider installing sub-meters or data loggers to obtain usage and consumption data. This is particularly useful for buildings and facilities that share FPL meters.
To enable continuous accurate accounting of government electricity consumption, baselines may also need to be revised from year to year. The baseline may need to be adjusted to include sites that were previously overlooked, or to improve data accuracy. The baseline can also be adjusted for changes in facility management that may result from department reorganizations. New building construction, additions, and renovations to existing facilities, however, are not grounds for baseline adjustments. If a department pays the energy bills for an asset that it does not own, it may elect to include that asset in its baseline so it can claim credit for energy reductions for that asset. In addition, tracking electricity use in leased facilities will prevent a perceived increase in electricity use due to a move from a leased to an owned facility. (See “Baseline Adjustment Guidelines” on pg. 17 for further details.)
Once energy performance improvements are instituted, the baseline will be continually used as the point of reference against which to show returns. These returns, valued for their financial, social, or environmental benefits, are the fruit of the energy management cycle that continually feed improvements. Step #2: Benchmarking
Using energy benchmarking to assess a facility or project’s energy performance is analogous to using fuel economy as a measure of vehicle performance. Benchmarking is one of the most useful tools for energy management, since it measures changes over time and reveals areas for improvement. Two types of benchmarks are used to evaluate energy performance: historical and peer (the following definitions explain these benchmarks as they apply to buildings; however, the same concept applies to special facilities and other energy projects).
Historical benchmarking compares a building’s performance from one point in time to another point in time. A historic benchmark relies on accurate baseline information. Historical
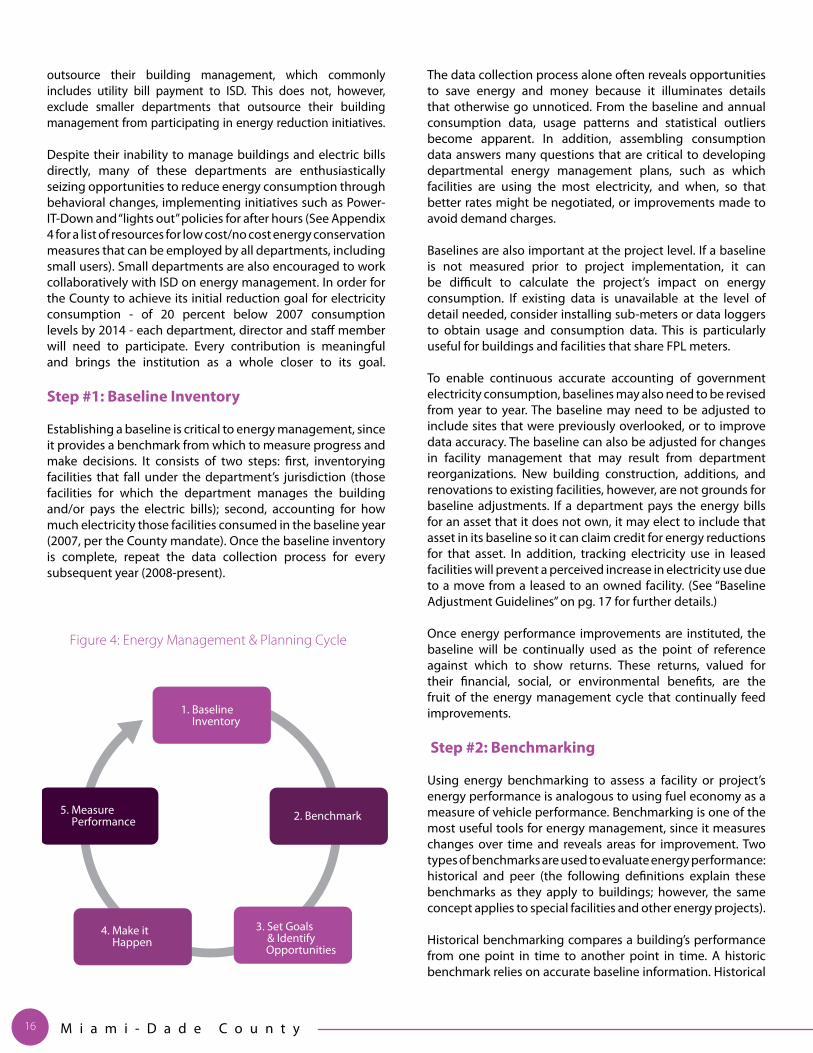
1. Baseline Inventory
2. Benchmark 5. Measure Performance
4. Make it Happen
3. Set Goals & Identify Opportunities
Figure 4: Energy Management & Planning Cycle
E l e c t r i c i t y P l a n 17
benchmarking is helpful for tracking energy efficiency improvements and trending performance. The County uses historic benchmarking to measure its enterprise-wide progress toward meeting the 20 percent electricity reduction target.
Peer benchmarking compares buildings with others in their class. The Environmental Protection Agency (EPA) ENERGY STAR® Portfolio Manager uses peer benchmarking to rate buildings on a scale of 1-100. The rating is an indicator of how well a building is performing relative to thousands of other comparable buildings in the U.S. A rating of 75, for example, indicates that a building is performing 75 percent better than all similar buildings nationwide.
The County’s Electricity Reduction Resolution requires that all building energy use be tracked, monitored and benchmarked annually at a minimum, through the use of EPA’s ENERGY STAR Portfolio Manager, along with other applicable building energy use tracking and management tools. In order to implement this directive, every County department must coordinate a benchmarking effort for the buildings and facilities under its management. This role can be part of the energy manager’s role, or fulfilled by several people. Depending on the building portfolio that is being benchmarked, the time required to collect data from multiple building/facility managers and to enter data in the online database will vary. The “big user departments” have designated individuals for this role; however, the effort to begin benchmarking all buildings has only just begun.
Benefits of energy benchmarking:
• Comply with Resolution R-228-09.• See how a certain building compares to a portfolio or
peer group.• Set targets for improved performance.• Identify opportunities for improved energy performance• Prioritize investments in energy efficiency.• Track current projects expected to save energy and
money.• Earn an ENERGY STAR rating (and prestigious ENERGY
STAR label with scores above 75).• Gain leadership recognition among peers, setting the bar
for best practice.• Assess a building’s performance before buying or leasing.• Facilitate assessment of property value and marketing
rental properties.
Step #3: Set Goals and identify opportunities
The third step is to set goals and identify opportunities. The goals can range from organizational changes that need to be made in order to improve energy management, to actual reduction of, or even elimination of, particular electrical loads.
In order to manage a department’s energy use, it’s important to understand where the most energy is being consumed, then set an energy reduction goal for each major source of electricity consumption, or “segments”. For example, WASD categorizes its electricity use in four segments (pumping
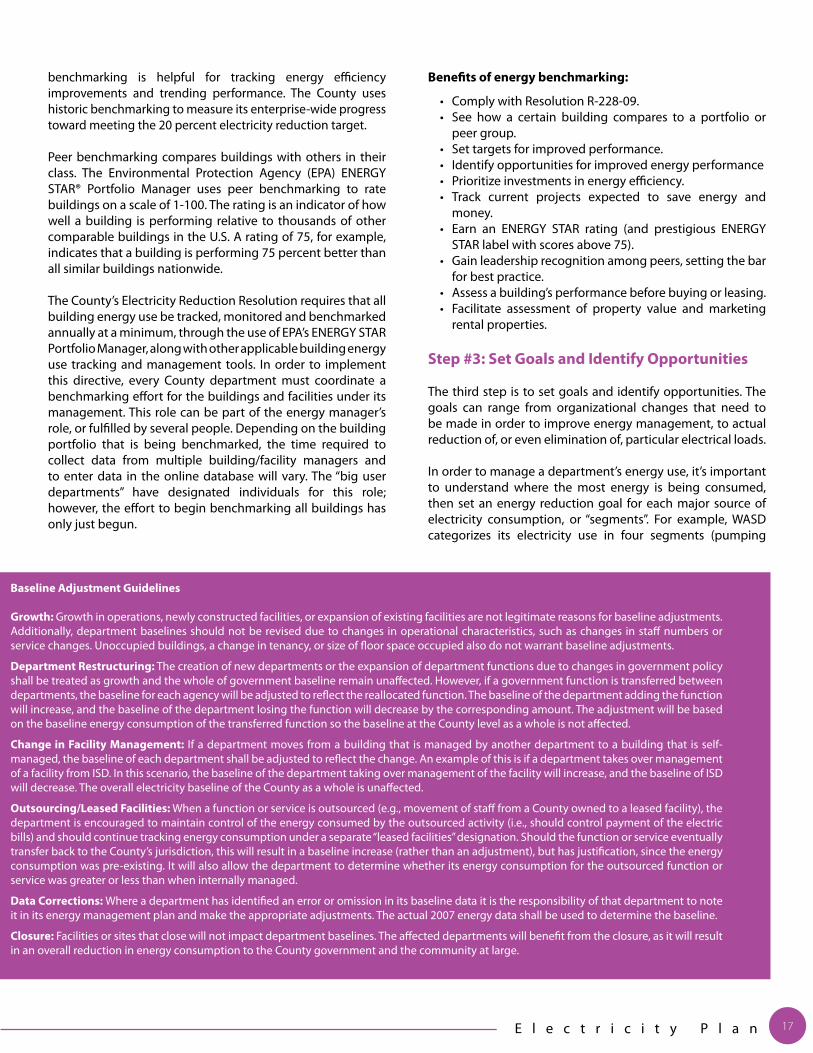
Baseline adjustment Guidelines
Growth: Growth in operations, newly constructed facilities, or expansion of existing facilities are not legitimate reasons for baseline adjustments. Additionally, department baselines should not be revised due to changes in operational characteristics, such as changes in staff numbers or service changes. Unoccupied buildings, a change in tenancy, or size of floor space occupied also do not warrant baseline adjustments.
Department Restructuring: The creation of new departments or the expansion of department functions due to changes in government policy shall be treated as growth and the whole of government baseline remain unaffected. However, if a government function is transferred between departments, the baseline for each agency will be adjusted to reflect the reallocated function. The baseline of the department adding the function will increase, and the baseline of the department losing the function will decrease by the corresponding amount. The adjustment will be based on the baseline energy consumption of the transferred function so the baseline at the County level as a whole is not affected.
Change in Facility Management: If a department moves from a building that is managed by another department to a building that is self-managed, the baseline of each department shall be adjusted to reflect the change. An example of this is if a department takes over management of a facility from ISD. In this scenario, the baseline of the department taking over management of the facility will increase, and the baseline of ISD will decrease. The overall electricity baseline of the County as a whole is unaffected.
outsourcing/Leased Facilities: When a function or service is outsourced (e.g., movement of staff from a County owned to a leased facility), the department is encouraged to maintain control of the energy consumed by the outsourced activity (i.e., should control payment of the electric bills) and should continue tracking energy consumption under a separate “leased facilities” designation. Should the function or service eventually transfer back to the County’s jurisdiction, this will result in a baseline increase (rather than an adjustment), but has justification, since the energy consumption was pre-existing. It will also allow the department to determine whether its energy consumption for the outsourced function or service was greater or less than when internally managed.
Data Corrections: Where a department has identified an error or omission in its baseline data it is the responsibility of that department to note it in its energy management plan and make the appropriate adjustments. The actual 2007 energy data shall be used to determine the baseline.
Closure: Facilities or sites that close will not impact department baselines. The affected departments will benefit from the closure, as it will result in an overall reduction in energy consumption to the County government and the community at large.
M i a m i - D a d e C o u n t y18
stations, water treatment, wastewater treatment and buildings) and has set a 20 percent reduction goal across each. MDAD’s segments are offices, terminals and airfields. This exercise helps managers to clearly align electricity consumption with operations.
It may become clear that there is “low hanging fruit” in one segment but not in another, or that reducing electricity use in one segment is cost-effective, while in another it is cost prohibitive. It is less important at this point to place an emphasis on the feasibility of achieving reductions than it is to understand the variables that affect electricity consumption within operations. Take note of barriers to achieving goals, but don’t allow them to hinder goal setting. The goals will be refined and revised in later steps of the implementation process.
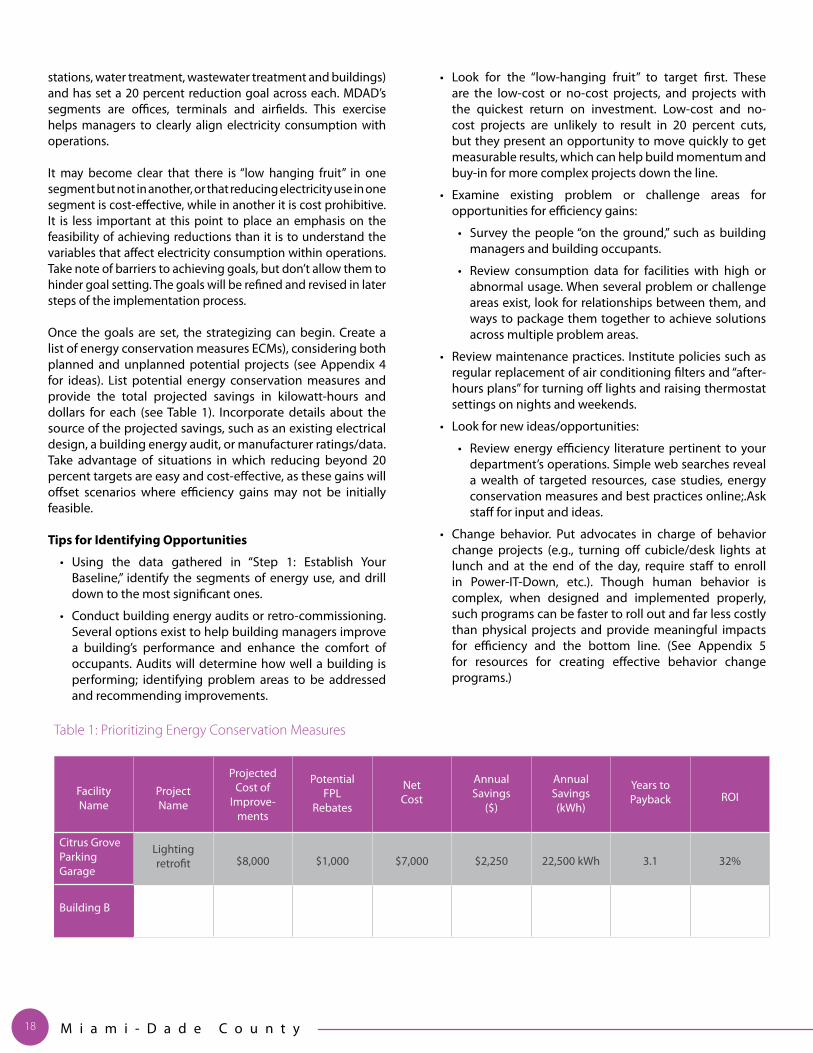
Once the goals are set, the strategizing can begin. Create a list of energy conservation measures ECMs), considering both planned and unplanned potential projects (see Appendix 4 for ideas). List potential energy conservation measures and provide the total projected savings in kilowatt-hours and dollars for each (see Table 1). Incorporate details about the source of the projected savings, such as an existing electrical design, a building energy audit, or manufacturer ratings/data. Take advantage of situations in which reducing beyond 20 percent targets are easy and cost-effective, as these gains will offset scenarios where efficiency gains may not be initially feasible.
tips for identifying opportunities
• Using the data gathered in “Step 1: Establish Your Baseline,” identify the segments of energy use, and drill down to the most significant ones.
• Conduct building energy audits or retro-commissioning. Several options exist to help building managers improve a building’s performance and enhance the comfort of occupants. Audits will determine how well a building is performing; identifying problem areas to be addressed and recommending improvements.
• Look for the “low-hanging fruit” to target first. These are the low-cost or no-cost projects, and projects with the quickest return on investment. Low-cost and no-cost projects are unlikely to result in 20 percent cuts, but they present an opportunity to move quickly to get measurable results, which can help build momentum and buy-in for more complex projects down the line.
• Examine existing problem or challenge areas for opportunities for efficiency gains:
• Survey the people “on the ground,” such as building managers and building occupants.
• Review consumption data for facilities with high or abnormal usage. When several problem or challenge areas exist, look for relationships between them, and ways to package them together to achieve solutions across multiple problem areas.
• Review maintenance practices. Institute policies such as regular replacement of air conditioning filters and “after-hours plans” for turning off lights and raising thermostat settings on nights and weekends.
• Look for new ideas/opportunities:
• Review energy efficiency literature pertinent to your department’s operations. Simple web searches reveal a wealth of targeted resources, case studies, energy conservation measures and best practices online;.Ask staff for input and ideas.
• Change behavior. Put advocates in charge of behavior change projects (e.g., turning off cubicle/desk lights at lunch and at the end of the day, require staff to enroll in Power-IT-Down, etc.). Though human behavior is complex, when designed and implemented properly, such programs can be faster to roll out and far less costly than physical projects and provide meaningful impacts for efficiency and the bottom line. (See Appendix 5 for resources for creating effective behavior change programs.)
table 1: Prioritizing Energy conservation Measures
Facility Name
Project Name
Projected Cost of
Improve-ments
Potential FPL
Rebates
Net Cost
Annual Savings
($)
Annual Savings (kWh)
Years to Payback ROI
Citrus Grove Parking Garage
Lighting retrofit $8,000 $1,000 $7,000 $2,250 22,500 kWh 3.1 32%
Building B
E l e c t r i c i t y P l a n 19
Step #4: Make it Happen: Prioritizing, Funding and executing Projects
Prioritizing Projects
After identifying potential projects, the next step is to evaluate and prioritize them. To begin, calculate projected cost and return on investment (ROI). In addition to financial returns, consider other benefits such as reduced maintenance costs, energy and other resource savings, decreased emissions and human benefits like increased worker productivity and improved comfort. Many tools are available for calculating ROIs for all sizes and types of projects, from small equipment upgrades to complex renovations (see Appendix 6 for resources). For larger, capital projects, apply life cycle analysis to potential projects and to the existing systems the new projects would replace. Evaluate the results of both analyses side-by-side, comparing the array of projected ROI benefits the new project would provide with those provided by the system in place.
Run projects through filters to flesh them out and prioritize them. Then, identify realistic timelines for each of the listed projects and rank them according to urgency. Consider whether they represent flexible platforms for future progress. In other words, do they provide a stepping stone to future actions or investments that will continue to move the department in the direction of ever-increasing efficiencies? Especially where larger investments are being considered, avoid committing substantial resources to programs that can’t be built upon, or are dead-end (avoid building a “bridge to nowhere”). To summarize, prioritize potential projects based on:
• Projected returns and benefits
• Timeline and urgency
• Expandability
• Funding availability (see next sub-section)
Funding Projects
After specific projects and their costs and benefits have been identified, it’s time to assess funding options. Energy performance improvements can be funded through department budgets, third party financing or grants. Costs can also be offset by incentives ranging from passed-on benefits from vendors that are eligible for tax deductions for energy efficient designs, to rebates from FPL. Unlike most investment projects in the public sector, energy efficiency projects have the ability to self-fund, since resultant savings pay back the cost of the project over time. The examples below discuss funding options available to County departments (see Appendix 6 for further information on financing projects).
Energy Performance Contracting Program
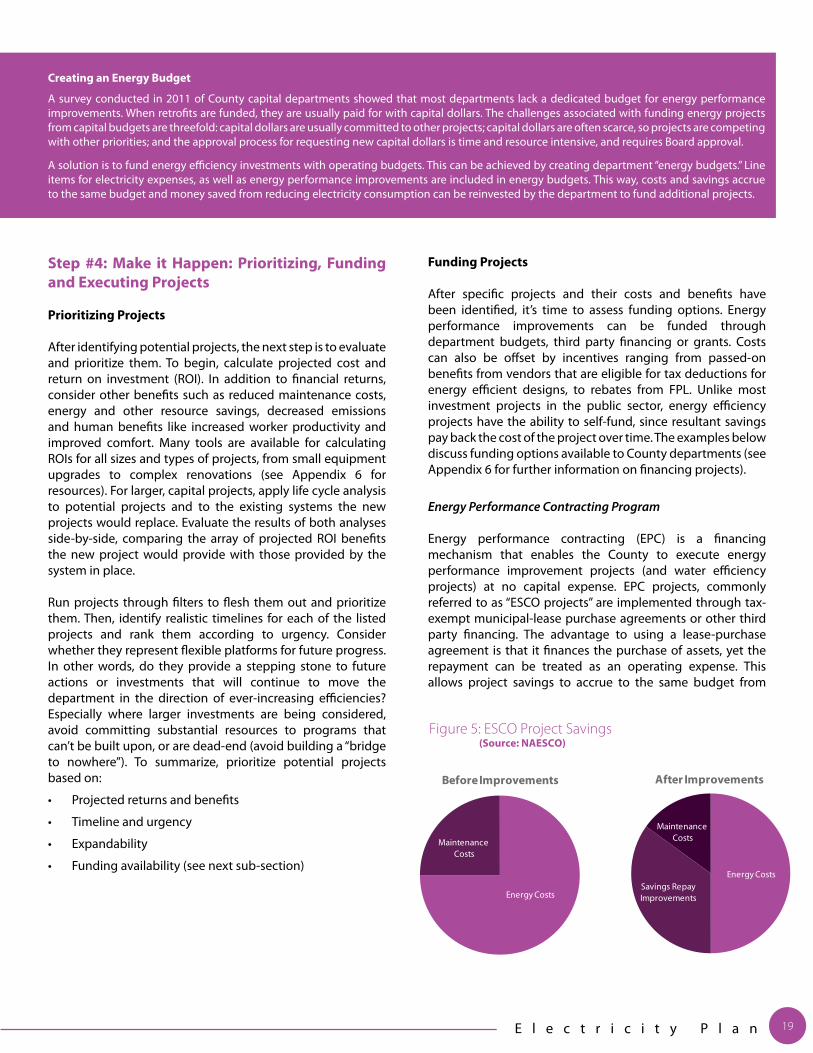
Energy performance contracting (EPC) is a financing mechanism that enables the County to execute energy performance improvement projects (and water efficiency projects) at no capital expense. EPC projects, commonly referred to as “ESCO projects” are implemented through tax-exempt municipal-lease purchase agreements or other third party financing. The advantage to using a lease-purchase agreement is that it finances the purchase of assets, yet the repayment can be treated as an operating expense. This allows project savings to accrue to the same budget from
Creating an energy Budget
A survey conducted in 2011 of County capital departments showed that most departments lack a dedicated budget for energy performance improvements. When retrofits are funded, they are usually paid for with capital dollars. The challenges associated with funding energy projects from capital budgets are threefold: capital dollars are usually committed to other projects; capital dollars are often scarce, so projects are competing with other priorities; and the approval process for requesting new capital dollars is time and resource intensive, and requires Board approval.
A solution is to fund energy efficiency investments with operating budgets. This can be achieved by creating department “energy budgets.” Line items for electricity expenses, as well as energy performance improvements are included in energy budgets. This way, costs and savings accrue to the same budget and money saved from reducing electricity consumption can be reinvested by the department to fund additional projects.
Figure 5: ESCO Project Savings (Source: NAESCO)
Energy Costs
Maintenance Costs
Before Improvements
Energy CostsSavings Repay Improvements
Maintenance Costs
After Improvements
M i a m i - D a d e C o u n t y20
which the payments are made. These savings free up dollars for further investments in energy efficiency, and feed the cycle of continuous energy management.
How EPC projects work:
• The contracted energy service company (ESCO) performs an investment grade audit.
• If sufficient opportunities for savings are found, the ESCO conducts turnkey energy performance improvement projects.
• Projects pay for themselves through increased operating efficiencies and reduced maintenance costs.
• The ESCO’s work is backed by a guarantee that project savings will be sufficient to cover the customer’s debt service or lease payments. Should project savings fall short of the guaranteed amount, the ESCO must pay the difference.
Miami-Dade County has operated a successful EPC program since 1998. In 2008, the EPC Services Resolution (R-740-08) established a $40 million “Energy Savings Program” for a five-year period and waived competitive bidding in favor of utilizing the State of Florida’s pre-qualified vendor pool. Contracts valued at less than $1 million do not require approval by the Board of County Commissioners.
Completed EPC projects save the County over 64,535,600 kWh of electricity and 71,729,250 gallons of water per year. In dollars, that’s the equivalent of $5 million in utility and maintenance costs annually. Projects currently underway are expected to reduce electrical usage by an additional 6,315,000 KWh and gross annual expenses by an additional $774,300.
(See Appendix 6 for more information.)
Save Energy and Money (SEAM) Revolving Loan Fund
In fiscal year 2011, a $500,000 revolving loan fund, “SEAM,” was set aside for use by County departments to finance small energy-efficiency projects. Rather than implementing energy performance improvements and simply decreasing annual operating expenditures, a revolving loan fund captures a portion of this energy savings and enables it to be dedicated to future retrofits. Once these projects have been completed, the loan is returned to the revolving fund from the cost savings on the department’s utility bill. After the loan has been repaid, the savings stop accruing to the revolving fund, allowing the departments to benefit from the lower utility costs while maintaining the revolving fund’s viability. For more information about SEAM, visit G-Net (the “green” resource for county employees, accessible through eNet).
executing Projects
In this phase, contracts are bid and awarded, construction begins, new equipment is installed, and energy efficiency measures are implemented. Behavior change projects might include campaign launches and interactive surveys. Regardless of the project, smooth execution relies on well-organized and designated project management. Department energy management plans should include a program management plan for monitoring and oversight of all projects, identifying the personnel responsible for the implementation of the department energy plan itself, as well as projects including retrofits and energy conservation measures in specific buildings or facilities.
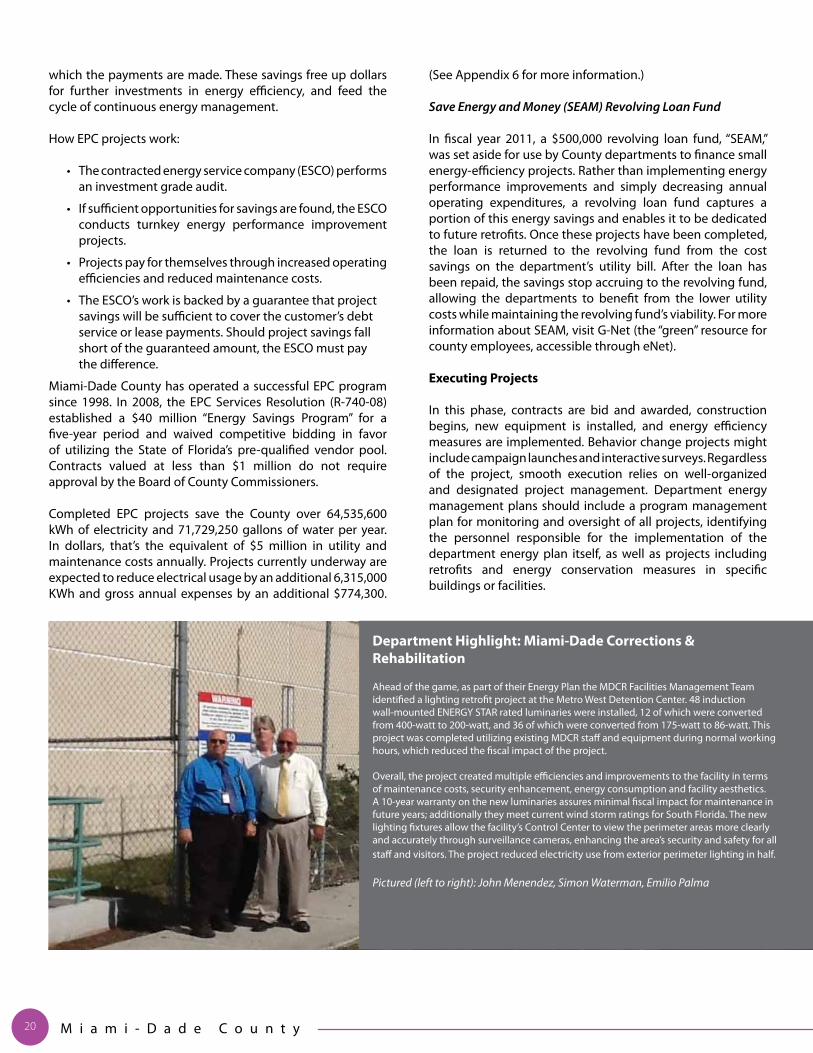
Department Highlight: Miami-Dade Corrections & Rehabilitation
Ahead of the game, as part of their Energy Plan the MDCR Facilities Management Team identified a lighting retrofit project at the Metro West Detention Center. 48 induction wall-mounted ENERGY STAR rated luminaries were installed, 12 of which were converted from 400-watt to 200-watt, and 36 of which were converted from 175-watt to 86-watt. This project was completed utilizing existing MDCR staff and equipment during normal working hours, which reduced the fiscal impact of the project.
Overall, the project created multiple efficiencies and improvements to the facility in terms of maintenance costs, security enhancement, energy consumption and facility aesthetics. A 10-year warranty on the new luminaries assures minimal fiscal impact for maintenance in future years; additionally they meet current wind storm ratings for South Florida. The new lighting fixtures allow the facility’s Control Center to view the perimeter areas more clearly and accurately through surveillance cameras, enhancing the area’s security and safety for all staff and visitors. The project reduced electricity use from exterior perimeter lighting in half.
Pictured (left to right): John Menendez, Simon Waterman, Emilio Palma
E l e c t r i c i t y P l a n 21
Step #5: Measure Performance
The fifth step is to monitor/measure the processes and projects that have been implemented against the goals that were initially set, and to report the results. This is an opportunity to showcase successes, highlighting savings, reduced maintenance and other benefits. This process will also provide insight into mistakes made, which should lead to corrections and improved project management in the future. Remember that energy management is more of an art than a science. The learning curve encountered at the outset will only result in improvements in the future.
Section 6: ConclusionData management, consistent use of performance metrics and making continuous improvement systemic are all keys to successfully managing the energy efficiency process on an ongoing basis.
Building and updating an energy Management Plan
After working through the previous implementation steps, all of the necessary elements of an energy management plan should be assembled. All that remains is pulling the pieces together, articulating the plan and seeing that the plan is understood, used and adhered to by departmental staff.
tips for Building and updating an energy Management Plan
• In developing a framework for a departmental energy management plan, use the implementation steps in this Energy Master Plan, as well as Implementing Order 8-8 and its associated Sustainable Building Program Guideline as guides.
• Build in the flexibility to update and improve the energy management plan on an ongoing or periodic basis. By adopting the five steps outlined here, the structure is already provided.
• Include policies that support continuous improvement on energy performance, such as regular energy audits and trigger policies for equipment replacement.
• Consider leased facilities, tenant improvements, human behavior, and new construction projects as areas to research and set goals, in addition to maintenance, upgrades, remodels and ongoing operations.
• When designing a plan, remember to encourage employees, stakeholders and vendors to see cross-group (and even inter-departmental) systems, rather than the silos in which they may be accustomed to working. This is critical for establishing a work culture that identifies solutions with multiple (often cross-boundary) benefits.
integrating energy Management with operations
One of the aspirations behind this plan is to institutionalize continuous energy efficiency improvement by embedding it into both the structures and culture of the County, across all departments. Only in this manner can energy efficiency move from an initiative perceived as a fad or political moment that will pass, to a permanent, integral and routine part of operations.
Because of this, and because, as previously noted, energy efficiency is primarily a management challenge; energy management must be integrated with operations. This is best accomplished on several fronts at once.
embedding energy efficiency into Maintenance operations
Not all projects require weighty budget calculations or financing; some are common sense. Implement any no-cost or low-cost maintenance changes identified in Step 3 “Identify Opportunities.” If effective, make the new procedures standard. Require stringent sustainability measures, including energy efficiency, as a matter of policy whenever maintenance operations call for replacements or upgrades of existing systems, whether they are energized (like lighting) or non-energized (like windows and roofs).
Evaluate existing procedures and policies for opportunities to eliminate inefficiencies. Train supervisors to value “best results” over strict adherence to procedures. For example, some resource intensive activities might be performed once per week rather than daily to save on labor, energy and water use, or reduce the quantity of chemicals released.
Lastly, don’t forget the people. Require decision-makers and bid-evaluators to consider the impact maintenance adjustments or new purchases will have on the third sub-system, humans. Many managers have had the experience of installing a system that people end up not using, actively circumvent or sabotage, resulting in a wasted investment. Instead, seek upgrade solutions that work well with and for the people they will impact, and ideally will provide multiple benefits.
M i a m i - D a d e C o u n t y22
Miami-Dade County Organization-Level StrategiesOrganization-level strategy is critical to this Plan’s vision of establishing a comprehensive energy management program for the County. In developing these strategies theEnergy Team in the Office of Sustainability (OOS) assessed the status of energy management at the County and created a clear direction for the future.
overview
The Office of Sustainability (OOS) was created in 2007 to coordinate and assist in organization-wide and department-level change towards a sustainable government culture, operations, and service delivery, in order to protect and enhance Miami-Dade County’s distinctive environmental quality and livability. OOS provides the basic framework needed to organize the County government’s energy usage and steer the organization toward energy management. OOS serves as the central hub for energy management and conservation efforts; tracking progress, communicating information and providing the necessary tools to achieve established goals.
approach
OOS manages several programs either directly or indirectly related to energy efficiency, including:
1. The development of this Plan and the departmental coordination required to create and implement individual department-level energy plans.
2. The Sustainable Buildings Program.
3. The development and implementation of GreenPrint, the County’s sustainability plan.
4. The Southeast Florida Regional Climate Compact.
5. The Green Business Certification Program.
6. The management of the Energy Efficiency and Conservation Block Grant (EECBG), which has enabled OOS to oversee 12 different energy-related projects (see appendix 3 for a complete description of each project).
Current Projects
Strategy: Establish a centralized method for quantifying County electricity consumption and its associated costs, and for benchmarking the energy performance of County facilities.
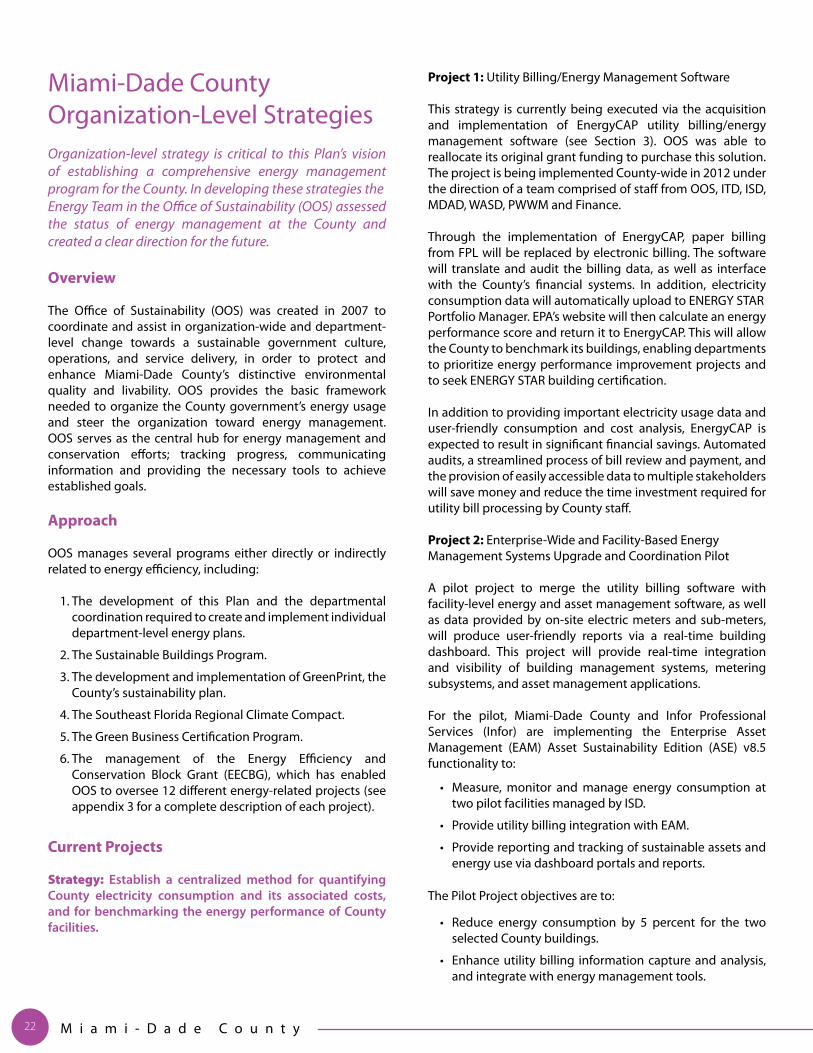
Project 1: Utility Billing/Energy Management Software
This strategy is currently being executed via the acquisition and implementation of EnergyCAP utility billing/energy management software (see Section 3). OOS was able to reallocate its original grant funding to purchase this solution. The project is being implemented County-wide in 2012 under the direction of a team comprised of staff from OOS, ITD, ISD, MDAD, WASD, PWWM and Finance.
Through the implementation of EnergyCAP, paper billing from FPL will be replaced by electronic billing. The software will translate and audit the billing data, as well as interface with the County’s financial systems. In addition, electricity consumption data will automatically upload to ENERGY STARPortfolio Manager. EPA’s website will then calculate an energy performance score and return it to EnergyCAP. This will allow the County to benchmark its buildings, enabling departments to prioritize energy performance improvement projects and to seek ENERGY STAR building certification.
In addition to providing important electricity usage data and user-friendly consumption and cost analysis, EnergyCAP is expected to result in significant financial savings. Automated audits, a streamlined process of bill review and payment, and the provision of easily accessible data to multiple stakeholders will save money and reduce the time investment required for utility bill processing by County staff.
Project 2: Enterprise-Wide and Facility-Based Energy Management Systems Upgrade and Coordination Pilot
A pilot project to merge the utility billing software with facility-level energy and asset management software, as well as data provided by on-site electric meters and sub-meters, will produce user-friendly reports via a real-time building dashboard. This project will provide real-time integration and visibility of building management systems, metering subsystems, and asset management applications.
For the pilot, Miami-Dade County and Infor Professional Services (Infor) are implementing the Enterprise Asset Management (EAM) Asset Sustainability Edition (ASE) v8.5 functionality to:
• Measure, monitor and manage energy consumption at two pilot facilities managed by ISD.
• Provide utility billing integration with EAM.
• Provide reporting and tracking of sustainable assets and energy use via dashboard portals and reports.
The Pilot Project objectives are to:
• Reduce energy consumption by 5 percent for the two selected County buildings.
• Enhance utility billing information capture and analysis, and integrate with energy management tools.

E l e c t r i c i t y P l a n 23
• Provide the tools to encourage behavior modification to reduce electricity consumption.
• Provide a method of reporting and tracking sustainable assets and energy use via dashboard portals and reports.
• Establish a replicable methodology for County-wide application of the energy conservation techniques proven with the pilot to continually expand energy conservation efforts and maintenance/ asset management improvements for further sustainable cost reductions.
Through this pilot process the County is also evaluating the potential role of energy performance contracts (EPCs) in financing the deployment of this process across all County facilities.
Strategy: Establish multi-level interdepartmental collaboration and support.
Project 1: Top Level Support
Engaging key people is an ongoing process that is critical to functional energy management. By coordinating educational opportunities for all stakeholders, the OOS Energy Team has attempted to engage stakeholders from every level of County government.
County executives have been briefed and kept up to speed on all organization-level strategies as well as this Plan. Education is the most effective way to make energy management a priority because it teaches stakeholders how to:
• Identify opportunities for energy savings.
• Make the business case for energy performance improvement projects.
• Use the energy management tools available (e.g., EnergyCAP).
Project 2: Department Liaisons
This strategy was carried out by setting up channels of communication across department lines. The involvement of liaisons ensures that the appropriate staff from each department participates as needed in energy project implementation. It also enables the OOS Energy Team to collect information needed to facilitate projects, coordinate project implementation and keep track of the status of the multiple programs it administers or monitors such as SEAM projects or EPC projects, respectively (see Department Liaisons box on page 11).
Strategy: Promote energy efficiency and renewable energy production through technology demonstration projects in a variety of County buildings.
Project 1: Solar Power Systems Demonstration Project
In order to promote the use of alternative sources of energy, OOS apportioned EECBG funds to install solar panels on the roofs of three recreational buildings in Country Village Park, Martin Luther King Memorial Park and Westwind Lakes Park. The project was completed in partnership with the Parks, Recreation and Open Space department (PROS) in December 2011.
Project 2: Daylight Harvesting Demonstration Project
To showcase energy saving technology, OOS apportioned EECBG funds to install programmable lighting controls that adjust the lighting output according to the amount of natural light penetrating the building throughout the day. These controls have been installed at the Naranja, Kendale Lakes, and International Mall library branches. This project was completed in collaboration with the Libraries Department in September 2011.
Project 3: Cool Roof Retrofit Demonstration Project
Completed in June 2010, this demonstration project replaced the roof at the Homestead Library with a high-reflectivity cool roof system. Data gathered from tracking energy at the Homestead Library before and after the installation of the cool roof will be used to show the energy reduction and payback period for cool roof systems. This project was completed in collaboration with the Libraries Department in June 2010.
Project 4: Green Roadway Demonstration Project
Construction is currently underway to create “Green Roadways” on North Royal Poinciana and North Miami avenues. This demonstration project will be completed in partnership with the Public Works and Waste Management Department to promote people-friendly movement by including high-efficiency lights and pedestrian-friendly access while reducing energy use and air pollution.
EnergyCAP training for County executives updates them on how the project will unfold as well as how it fits into the greater objective of sustainable energy management for the County.
M i a m i - D a d e C o u n t y24
Project 5: Sustainable Technologies Demonstration Program
In collaboration with OOS, ISD has identified and is in the process of testing equipment, technologies and services friendly to the South Florida climate that can improve energy performance at existing County facilities such as fan walls, motion and daylight sensors and LED lighting upgrades.
Strategy: Raise awareness among County employees about the importance of energy conservation, promoting behavior change and energy efficiency in government operations.
Project 1: Training Opportunities and Continuing Education
To empower County staff to effectively manage their departments’ energy consumption, OOS has also arranged several trainings administered by accredited organizations. As a result, staff has become more familiar with energy management even if their professional backgrounds are in other fields. Educational programming for energy management and the sustainable buildings program in 2011-2012 has been made possible by EECBG funding. However, budget allocations are necessary to continue these in the future.
Continuing education opportunities for 2011-2012 include:
• Association of Energy Engineers (AEE) Certified Energy Management (CEM) Training Early 2011
• Environmental Protection Agency (EPA) ENERGY STAR Training October 2011
• International Facility Managers Association Sustainability Module (IFMA) Facility Managers Sustainability Workshop April 2012
• Leadership in Energy and Environmental Design (LEED)
• Exam reimbursement
• Continuing education/accreditation maintenance
• Landscaping BMPs
• Sustainability for Construction Managers Fiscal Year 2012
• Pacific Northwest National Laboratories (PNNL) Building Re-tuning Training May 2012
• Sustainable Buildings Program Monthly Lecture Series Fiscal Year 2012
Project 2: Employee Green Pledge
In 2010, the Mayor urged all employees to join him in creating a more sustainable organization by taking the first ever organization-wide Employee Green Pledge. This is part of our on-going effort to educate employees about the environmental benefits of going “green,” as well as to change behavior patterns to save energy, fuel, water and ultimately reduce the organization’s costs. As of April 2012, 20,739 employees have made 254,445 pledges related to conserving energy and water, reducing waste and fuel emissions. The challenge was conceptualized and content developed in-house by the Office of Sustainability, while the infrastructure was created by the Miami-Dade Community Outreach and Information Department (CIAO).
Project 3: Power-IT-Down Initiative
In order to reduce energy consumption in County operations, OOS and ITD worked together to create a process for employees to turn off their computers at the end of the day. Since 2010, the County has saved nearly $250,000. That’s a daily average savings of $654.
Project 4: G-Net In 2011, the County launched G-Net, a one-stop, green online site for Miami-Dade County employees. G-Net serves as a “green” resource providing useful information in the following areas: Green at Work, Commuting to Work: Green Purchasing, Green Building, Green Savings Tools, and Green Training and Peer Groups. The intranet site was conceptualized and content developed in-house by OOS, while the infrastructure was created by CIAO.
Project 5: GTV (Miami-Dade Green TV)
GTV was developed as a behavior change program in two County facilities. GTV provides green tips, news and information to employees and visitors. GTV will also provide dashboards displaying consumption data for the facilities as part of the Enterprise Asset Management (EAM) pilot project discussed on page 20. The dashboards are meant to drive behavior changes among County employees by promoting healthy competition among the various floors and departments in order to reduce energy consumption. GTV was conceptualized and content developed in-house by OOS, ITD and CIAO.

E l e c t r i c i t y P l a n 25
Project 6: Mr. Green Deeds
Mr. GREEN DEEDS was introduced in early 2012 as a way to encourage and reward “green” behaviors. It is an easy, interactive way for employees to show that no green deed goes unnoticed. Employees submit their nominees every week, and the GREEN DEEDS story with the most votes wins a prize for both the submitter
and the DEED-doer. Mr. Green Deeds was conceptualized and content/infrastructure developed in-house by OOS and CIAO. It is one of the many energy initiatives established in GreenPrint. The program is managed by CIAO.
Future Goals
GreenPrint: Our Design for a Sustainable Future is Miami-Dade County’s first road map to achieve ambitious reductions in GHG emissions. GreenPrint was developed in-house under the leadership of the Sustainability Director in 2010 through a fully collaborative process that brought together staff from various departments as well as community groups, business experts, academics, and residents.
GreenPrint contains over 137 initiatives within 7 goal areas that include: Strong Leadership, Connections and Commitment; Water and Energy Efficiency; Environment; Responsible Land Use and Smart Transportation; Vibrant Economy; Healthy Communities; and Climate Change.
OOS will work with the many County departments on the execution of GreenPrint’s energy initiatives to achieve set targets by increasing energy efficiency in building operations, establishing strategic partnerships, creating energy conservation campaigns, expanding alternative fuel production and use, and exemplifying leadership in energy and fuel efficiency.
For more information about GreenPrint and the specific initiatives please visit www.miamidade.gov/greenprint/home.asp
Strategy: Coordinate implementation of energy initiatives in GreenPrint, the County’s Sustainability Plan, to achieve set energy efficiency goals.
Project 1: Implement next phase of the County’s energy management strategy (GreenPrint Initiatives #21 and #22)
• Update the Resolution to ensure that electricity management and reduction objectives continue beyond 2014.
• Make energy management comprehensive.
• Designate/ hire department energy managers.
• Revise job descriptions for facilities/building managers to include an energy management requirement and continuing education requirement.
• Find ways of rewarding staff for achieving energy and cost efficiencies to promote active energy management (GreenPrint Initiative #23).
Project 2: Increase Renewable Energy Produced from County Government Operations by 5 percent
• Explore partnerships with large public and private entities to implement alternative fuel/energy parks and incentivize public/private use (GreenPrint Initiative #19)
Project 3: Find creative ways of financing energy projects (GreenPrint Initiatives #16 and #24))
• Create Department Energy Budgets.
• Expand EPC Program.
• Grow the SEAM Fund.
• Seek additional grant funding.

Over the past ten years, MDAD
has saved over $12 million through
Energy Performance Contracting.
energy Snapshot
energy Management Liaison: Jorge MarinPortion of total County electricity consumption (2007): 29%Portion of total County electricity consumption (2010): 31%annual electricity expenditure (2010): $28,350,813
electricity consumption (2007): 354,761,604 kWhelectricity consumption (2010): 367,346,918 kWhelectricity consumption per sq. ft. (2007): Unknown electricity consumption per sq. ft. (2010): 45 kWh/sq. ft.

E l e c t r i c i t y P l a n 27
overview
MDAD is the County’s largest electricity consumer, as well as one of its primary economic engines. To meet the needs of over 100,000 travelers that pass through the Airport each day, the Airport has been undergoing an expansion. The South Terminal added 1.7 million square feet to the MDAD’s footprint; the North Terminal, still in progress, consists of 1.8 million square feet of new space and 1.7 million square feet of renovated space (over one mile long!). MDAD’s conditioned area will have increased significantly after the expansion. Electricity consumption at MDAD is primarily driven by air conditioning systems.
MDAD is continuously investigating opportunities for cost-efficient energy conservation measures. Due to budget limitations in the last few years, these measures have been implemented mainly through Energy Performance Contracts. However, when new construction or renovations are needed EMS has been implicitly implemented by compliance with MDAD’s Design Guidelines Manual.
While MDAD is increasing its energy footprint, it is also becoming more efficient. To capture these improvements in energy reporting, MDAD will track both its absolute electricity consumption in kWh and its energy intensity in kWh per square foot.
approach
Miami International Airport (MIA) has a clear approach to energy conservation and efficiency; Energy Performance Contracting (EPC). Since 2002, the Miami-Dade County Aviation Department (MDAD) has partnered with FPL Services, LLC (FPLS) to complete energy conservation analyses for millions of square feet of infrastructure (office, aircraft hangar, shop building and parking garages) and conduct comprehensive engineering feasibility studies of the existing equipment to improve MIA energy efficiency, while reducing greenhouse gas emissions and utility costs.
FPLS conducted energy conservation analyses which included: •Highefficiencylightingretrofits •Occupancysensors •HVACupgrades •Chillerupgrades •Waterconservationmeasures •Irrigationcontrols
Due to age, some systems were augmented with temporary equipment which addressed the problem on a short-term basis, but added to the overall operating expense. Despite the need for improvements, limited capital budgets make it difficult to replace aging equipment.
As a result of partnering with FPLS to implement turn-key energy and water conservation upgrades for its facilities, MDAD has been able to make more than $25 million worth of improvements with no up-front capital expense through performance contracting. Through performance contracting, MDAD has been able to fully finance all upgrades for energy-efficient equipment and FPLS guaranteed the savings.
Every kWh MDAD saves reduces carbon emissions and helps protect the environment. FPLS’ energy conservation measures have saved energy, as well as improved passenger and employee safety and comfort, while reducing MIA’s footprint.
ProjectsTo date FPLS has completed four energy savings performance contracting projects at MIA. In total FPLS retrofitted 40,000 light fixtures throughout the facility. The four projects have saved MIA more than $10 million (85,471,683 kilowatt-hours) and reduced around 17 million tons of greenhouse gas emissions thus far (as of 8/2011).
Buildings 25 & 100 and Parking Garages Annual Savings $ 716,366
•ECM1.Lightingretrofits •ECM2.Waterconservationmeasures •ECM3.HVACimprovements
Central Chiller Plant East (CCPE) Annual Savings $ 934,242
•ECM1.New4000tonchiller •ECM2.DecommissioningofCentralChillerPlantWest(CCPW)
Terminals Phase 1Annual Savings $ 1,605,563
•ECM1.Lightingretrofits •ECM2.HVACimprovements
Terminals Phase 2Annual Savings $ 809,351
•ECM1.Lightingretrofits
Miami-Dade Aviation Department (MDAD)
On a scale of 1 to 10, with 10 being highest, MDAD rates its ability to capture energy efficiencies at an 8. This is primarily attributed to its Design Guidelines Manual and the commissioning process. However, MDAD currently lacks the ability to influence the energy efficiency of its business partners such as retail stores. For example, jewelry stores have special lighting requirements that, while energy intensive, help increase their sales.

Integrated energy management is
important to WASD, as certain decisions will require tradeoffs.
energy Snapshot
energy Management Liaison: Bertha GoldenbergPortion of total County electricity consumption (2007): 27% Portion of total County electricity consumption (2010): 27%annual electricity expenditure (2010): $24,820,938
electricity Consumption (2007): 321,394,171 kWhelectricity Consumption (2010): 324,224,123 kWhefficiency of Water Supply treatment & Distribution (Fy 2010): 1,232 kWh/MGefficiency of Wastewater Collection, treatment & Disposal: (Fy 2010): 1,604 kWh/MG

E l e c t r i c i t y P l a n 29
overview
WASD is the County’s second largest consumer of electric power, which is used to provide high-quality drinking water and wastewater disposal services to over 2.3 million residents of Miami-Dade County. WASD divides its energy segments into four main categories: wastewater pump stations, water production, wastewater treatment, and buildings. Of these, pump stations account for the majority of WASD’s electricity consumption.
There is a strong connection between water and energy. Water is required for energy production, and energy is required for water production. Therefore, conserving one can usually help conserve the other. Nevertheless, integrated management is important, as certain decisions will require trade-offs. For example, WASD’s plans to expand its water reclamation program will likely increase electricity consumption. Reclaimed water is wastewater that is highly treated, filtered and disinfected, so it can be reused for aquifer recharge, irrigation, wetlands restoration, vehicle washing, etc. The high-level disinfection process, though energy intensive, has enough economic and environmental benefits to justify the extra energy expense. It also avoids the cost of having to develop alternative water plants (i.e., desalination plants).
approach
Because WASD is a utility, its energy management plan must cover both the demand side (programs targeted toward the end-user) and the supply side (programs that focus on what is under WASD’s operational control). WASD’s water conservation program exemplifies an effective demand-side management program. On the supply-side, WASD has identified several ideas to conserve electricity; these include the installation of motion, temperature and daylight sensors; installation of electronic display software; upgrading to high efficient insulation, establishing a proactive maintenance program for motors, pumps, and drives used in the treatment of water and wastewater, proper maintenance of existing linear infrastructure, installation of electric sub-metering system and the establishment of a close monitoring protocol of major electrical consumers and the efficiency of these units.
Projects
Pumps
•ECM 1. Specify, procure and install the highest efficiency equipment available that has a demonstrated reliable operation track record
•ECM 2. Increase the use of Variable Frequency Drives (VFDs) for both the water and wastewater systems where applicable
•ECM 3. Schedule pumps for off-peak electricity hour operation •ECM 4. Sequence pump operation so that multiple stations on a
single smaller diameter force main do not operate at the same time, saving energy
•ECM 5. Evaluate existing pumps for replacement with higher efficiency units based on actual “real time” operating conditions
existing infrastructure
•ECM 1. Retrofitted electrical equipment and lighting in various plants as part of the county’s ESCO program
•ECM 2. Develop field testing to measure the effect of reduced pressure on flow in the water system; which may affect flow projections (FUTURE)
•ECM 3. Look into the feasibility of implementing the Derceto system for water transmission (FUTURE)
•ECM 4. Use the same criteria for retrofits as for new infrastructure, provided that the return on the investment (ROI) is less than the expected life of the equipment
•ECM 5. Renovate existing buildings to reduce energy consumption (with certified energy audit as required)
•ECM 6. Use energy conservation through energy efficient lighting system for indoor lighting, outdoor lighting, landscaping
•ECM 7. Benchmark•ECM 8. Replace electrical equipment with energy efficiency
equipment
new infrastructure
•ECM 1. Specify high efficiency motors and variable frequency drives (VFDs)
•ECM 2. Design all new construction to meet all South Florida Building Code requirements and County green building ordinance
•ECM 3. Track energy use –provide procedures to meet energygoals to building designers/consultants
•ECM 4. Incorporate day lighting designs in new buildings•ECM 5. Use latest energy efficiency technology in all new designs,
including plant expansions and new facilities
Miami-Dade Water & Sewer Department (WASD)On a scale of 1 to 10, WASD rates its ability to capture energy efficiencies at a 4. In addition to weather conditions being the single most important variable that affects energy consumption in WASD operations, they must also produce water and treat wastewater maintaining the water pressure at all times for the protection of public health.

ISD’s long history of energy management in
County operations dates back to1982.
energy Snapshot
energy Management Liaison: Dan CooganPortion of total County electricity consumption (2007): 10%Portion of total County electricity consumption (2010): 10%annual electricity expenditure (2010): $9,595,247
electricity consumption (2007): 116,058,306 kWhelectricity consumption (2010): 119,185,037 kWh

E l e c t r i c i t y P l a n 31
overviewISD has a long history of managing electricity use in County operations. The department first implemented a centralized energy management system in 1982 to assist managers in monitoring and controlling their energy usage. This Building Management System (BMS) is a 24-hour monitored, enterprise-based control system that helps reduce energy usage through automated alarms, reports and follow-up. Today the department is playing a key role in implementing EnergyCAP, the newly acquired utility billing/energy management software.
approachISD coordinates activities with County agencies for over 4,500 FPL accounts, including connections, disconnects, account information, missing invoices, estimated readings, final billings, account modifications, and meter changes. ISD evaluates, reviews, and authorizes payment of 2,000 FPL accounts. In addition, ISD assesses rate modifications to reduce electrical utility expenses and maintains archives of account activities. ISD contacts user agencies on energy usage abnormalities, such as excessive energy usage, unused meters, etc. to identify energy waste and savings.
ISD has also been coordinating EPC projects since 2000, reducing energy usage throughout the county by updating equipment to energy efficient devices, and paying for the equipment through the reduced water and energy bills.
Projects Public Defender’s BuildingAnnual Savings $ 20,600
•ECM1.Lightingretrofits•ECM2.BMSupgrade
SDGC,West Flagler Building and AG Co-op ExtensionAnnual Savings $ 132,600
•ECM1.Lightingretrofits•ECM2.Chillersystem•ECM3.Airhandlerupgrade•ECM4.Plumbingupgrade
Carl Day Care Center, CSF, Courthouse, Courthouse Center, Cultural Center, Hickman Bldg, SPCCAnnual Savings $ 281,600
•ECM1.Lightingretrofit•ECM2.Plumbingupgrade
Gerstein Justice Building, Graham Building, Caleb Center, Medical Examiner’s Building, Juvenile Justice Facility, Records Center, CAA Building, “Old” Emergency Operations Center, North Dade Justice BuildingAnnual Savings $ 104,000
•ECM1.Lightingretrofit
Metro Annex BuildingAnnual Savings $ 23,000
•ECM1.Lightingretrofit•ECM2.Chillersystem•ECM3.BMSupgrade
Courthouse Building, West Flagler Building, Gerstein Justice Building, North Dade Justice Building, Coral Gables Courthouse, Graham BuildingAnnual Savings $ 103,000• ECM1.Chillersystem• ECM2.Lightingretrofit• ECM3.AHUsystemupgrade
Elections HQ, Hickman Garage 5, West Dade PIC, SDGCAnnual Savings $ 237,000• ECM1.Chillersystemupgrade• ECM2.BuildingManagementSystem(BMS)upgrade• ECM3.AirHandlingUnit(AHU)systemupgrade• ECM4.VariableFrequencyDrives(VFD)upgrade
Fleet Management FacilitiesAnnual Savings $ 18,900• ECM1.Lightingretrofit• ECM2.HVACupgrade• ECM3.Plumbingupgrade• ECM4.VFDupgrade
Stephen P. Clark CenterAnnual Savings $ 3,652,429• ECM1.Chillersystemupgrade• ECM2.LEDLightingProjectFoodCourtDownLights• ECM3.LEDLightingProjectPlanterLights-CrystalLighting• ECM4.LEDLightingProjectPlanterLights-SescoLighting• ECM5.LEDLightingProjectPlazaGlobeLights• ECM6.LEDLightingProjectLobbyDownLights• ECM7.LEDLightingProject3rdFloorHighHatLights• ECM8.LEDLightingProjectFlagPoleLight• ECM9.WirelessIntegrationofBMSwithSPCCPlaza&Bridge Lighting Controls
LibraryAnnual Savings $ 1,472 • ECM1.LEDLightingProjectLibrarySpotLights
GSA Fleet Motor PoolAnnual Savings $ 298 • ECM1.LEDLightingProjectDowntownFleetFillingStation
Canopy Lights
Overtown Transit Village North Annual Savings $ 9,040 • ECM1.EnergySavingDevice(s)Installations
Miami-Dade Internal Services Department (ISD; Formerly GSA)On a scale of 1 to 10, with 10 being highest, ISD rates its ability to capture energy savings at a 7. To capture opportunities, ISD needs funding for monitoring and verification equipment/services and energy control devices, human capital for project management, physical measurement and some installations or in-house improvements. Given proper funding and enough manpower current projects could be completed within three years.

MDT’s growing electricity footprint
is on one hand challenging, and
on the other hand, a positive indicator
of sustainable growth.
energy Snapshot
energy Management Liaison: Akbar SharifiPortion of total County electricity consumption (2007): 9%Portion of total County electricity consumption (2010): 8%
electricity consumption (2007): 104,720,749 kWhelectricity consumption (2010): 93,064,744 kWh
annual electricity expenditure: (2007) (2010)Bus: $901,773 $671,517Rail: $8,852,146 $6,719,157Mover: $415,920 $717,443.00
electricity Consumption per boarding (kWh): (2007) (2010)Bus: 0.01 0.01Rail: 3.42 3.26 Mover: 1.42 1.35

E l e c t r i c i t y P l a n 33
overview
MDT is the largest transit system in Florida and 14th largest in the nation. Its Metrobus, Metrorail, Metromover and Paratransit services are responsible for boarding over 326,000 passengers daily. The main drivers influencing electricity consumption in MDT are the Metrorail and Metromover Operations.
approach
It is challenging to reduce energy usage at MDT’s 43 Metrorail/Metromover stations, and eight Bus Operations/ Maintenance facilities, since they are directly impacted by the growing demand for public transportation throughout Miami-Dade County. This is a positive trend that promotes sustainable growth, since it reduces congestion and associated vehicle emissions. Therefore, MDT will track electricity consumption per boarding in addition to absolute electricity consumption. This will provide an indicator of how efficient MDT is becoming, even as it serves more riders.
Projects
Transit Administrative Facilities
•ECM1.InitiateEnergySurveyinconjunctionwithFPL(Future)
•ECM2.Establisheddepartment-wideemployeeparticipationinthe“GreenPledge”
Metromover Stations
Annual savings $ 4,477
•ECM1.Replaced53mercuryvaporlampswithnewLEDfixturesatBayfrontPark
•ECM2.ReplacemercuryvaporlampswithLEDfixturesattenadditionalstations(Future)
Bus Operations
•ECM1.Replacedolderbuseswith13Hybridbuses
•ECM2.Useupto5%bio-dieselinbuses
Miami-Dade Transit Department (MDT)On a scale of 1 to 10, with 10 being highest, MDT rates its ability to capture energy efficiencies at a 7 due to heavy power requirements by the Metrorail, Metromover and Metrobus Operations. With the above limitations taken into consideration, MDT has mainly focused on reducing its carbon footprint from mobile emissions sources.

M i a m i - D a d e C o u n t y34
PWWM owns a waste-to-energy facility
that recovers energy while safely disposing
the majority of the County’s waste .
energy Snapshot
energy Management Liaison: Sarah HartfieldPortion of total County electricity consumption (2007): 7%Portion of total County electricity consumption (2010): 6%annual electricity expenditure (2010): $12,199,794electricity consumption (2007): 91,570,320 kWhelectricity consumption (2010): 75,400,648 kWh

E l e c t r i c i t y P l a n 35
overviewThe Public Works and Waste Management Department (PWWM) operates sustainably to provide clean, attractive, safe, convenient, and accessible right-of-way and roadway systems throughout the County. In addition, the Department operates the largest government-owned and operated waste collection and disposal system in the southeastern United States. In addition to providing waste collection and recycling service to over 350,000 households in unincorporated Miami-Dade County and twelve municipalities, PWWM owns and operates a waste-to-energy facility that efficiently recovers energy while safely disposing of the majority of the County’s waste. The County has the authority, under various provisions of law, to provide for and regulate the disposal of solid waste generated in the incorporated and unincorporated areas of the County.
As stated above, the Department manages and operates all the County-maintained roadway infrastructures. These services and products include County-wide traffic management to provide safe and effective multi-modal options for efficient vehicular, bicyclist, and pedestrian traffic flow along over 3,200 miles of County-maintained roadways. The associated energy consuming infrastructure along these includes the Causeways toll plazas; eight (8) bascule bridges; storm-water pump stations; over 24,000 street lights, and over 2,800 traffic signalized intersections county-wide for which the Department has complete jurisdiction. The Department also utilizes various field offices and facilities for operational functions and service delivery. Efforts toward the reduction of energy consumption have been and continue to be addressed through several initiatives that include the evaluation, testing, and implementation of advanced lighting technologies.
approach
Efforts toward the reduction of energy consumption have been and continue to be addressed through several initiatives that include the evaluation, testing, and implementation of advanced lighting technologies.
ProjectsNorth East Transfer Station
• ECM1.Upgradeportionsofelectricalequipment
• ECM2.Re-lampasneededfor40-yearpermitrequirements
58th Street Collections Administration Building
• ECM 1. Rehabilitate building following all guidelines forenergy efficiency
South Dade Landfill
• ECM 1. Replacement of antiquated light fixtures at landfilltipping floor
• ECM2.Replacementofoldwiringasneeded
Various Waste Facilities
• ECM1.“SwitchOff”stickershavebeenapplied
• ECM2.Replacementandupgradeofthermostats
• ECM 3. Worked with Internal Services Department (ISD) for the replacement of T-12 fluorescent bulbs with T-8 bulbs and energy efficient ballasts
• ECM4.ISDmonitorselectricconsumptionatallwastefacilitiesand will issue advisories of increased usage for action
Various Roadways
• ECM 1. Spent $7M between 11/07 and 3/09 to convertapproximately 80,000 of MDC’s 12” 135-watt incandescent signal head bulbs to 10-watt LED modules. The average annual cost savings is $1.8 million with a 70% average monthly reduction in associated carbon emissions
• ECM 2. Installed approximately 24,000 energy-efficient high-pressure-sodium streetlights
• ECM3.Ongoingprojectfortheinstallationoftwolongstrandsofeven higher efficiency LED streetlights on two arterials, EECBG-funded demonstration corridors
• ECM4.Inthelate‘80sandearly‘90s,approximately8,000inefficient,100-watt, incandescent pedestrian heads were replaced with energy-efficient, 20-watt, neon, pedestrian signal heads
• ECM 5. Replacement of over 5,000 of those 20-watt neonpedestrian heads with even higher-energy-efficient, 8-watt, LED pedestrian signal heads
• ECM 6. Replacement of the remaining 20-watt neon trafficsignalized heads with the 8-watt LED heads
• ECM 7. Deployment of solar-powered LED pedestrian crosswalk flashers (Enhancers®) at about 12 un-signalized crosswalks
• ECM8.Whereandwhenfeasible,useoftrafficcirclesinlieuofsignalized intersections
• ECM9.Deploymentofnew solar-powered school speed zoneflashers at each end of about 50 elementary and middle school speed zones
• ECM 10. Deployment of new solar powered speed feedback signs at about a dozen locations near schools and on major arterials
Miami-Dade Public Works Waste Management Department (PWWM; Formerly PWD and SWM) On a scale of 1 to 10, PWWM rates its ability to capture energy efficiencies at an 8. This is due to the billing methodology for the roadway traffic signalization, which is the Department’s largest consumer of electricity. While the Department has implemented energy efficiency lighting in many of its facilities, the data is not singularly captured and therefore does allow for the determination of gross or net energy efficiencies.

PortMiami continously evaluates
and incorporates energy conservation
into day-to-day operations.
energy Snapshot
energy Management Liaisons: Becky Hope and Jesus ValidoPortion of total County electricity consumption (2007): 5%Portion of total County electricity consumption (2010): 5%annual electricity expenditure (2010): $4,720,961
electricity consumption (2007): 64,593,026 kWhelectricity consumption (2010): 55,092,676 kWhelectricity consumption per boarding (2007): Unknownelectricity consumption per boarding (2010): 13.43 kWh/boarding

E l e c t r i c i t y P l a n 37
overview
PortMiami is a world-class seaport. It has been recognized as the “Cruise Capital of the World” and the “Cargo Gateway of the Americas.” It is the largest container port in Florida and the eleventh largest in the nation. Over four million cruise passengers and 7.4 million tons of cargo move through the seaport per year. The combination of cruise and cargo activities supports approximately 180,000 jobs and has a strong economic impact in Miami-Dade County of over $18 billion per year.
The Port currently operates eight passenger terminals, six gantry cranes wharves, seven roll-on-roll-off docks, four refrigerated yards for containers, break bulk cargo warehouses and nine gantry container handling cranes. In addition, the Port tenants operate the cruise and cargo terminals, which include their cargo handling and support equipment. To retain its competitive rank as a world-class seaport, the Port is undergoing a $2 billion capital improvement infrastructure project to accommodate the changing demands of cruise vessel operators, passengers, shippers and carriers.
approach
The main source of electricity consumption at the Port is HVAC. The Port continuously evaluates and incorporates energy conservation measures into its day-to-day operations and maintenance activities, as well as its capital improvements program. The Port is in the process of incorporating energy efficiency standards into its design guideline standards, including steps such as purchasing ENERGY STAR rated equipment as older models are replaced, retrofitting of lights for energy savings and incorporating LEED elements into renovation projects. Currently energy efficiency is being incorporated at the Port on a project-by-project basis.
Projects
General
• ECM 1. Installed variable frequency drives on air handlers
• ECM 2. Installed electronic timers for lights and other energy uses in cruise terminals
• ECM 3. Installed new efficient chillers (received FPL rebate)
Port Administration Offices (Buildings 1001, 1007, and 1015), RCCL Office Building 1080
• ECM 1. White Roof
Cruise Terminal B
• ECM 1. Insulation improvements (reroofing)
• ECM 2. Installation of energy efficient A/C units
Cruise Terminal C
• ECM 1. Insulation improvements (reroofing)
• ECM 2. Installation of energy efficient A/C units
Cruise Terminal F
• ECM 1. Programmed A/C water chiller to make ice during off-peak hours
• ECM 2. White Roof
Cruise Terminal G
• ECM 1. Programmed A/C water chiller to make ice during off-peak hours
• ECM 2. Energy conservation by utilizing window screening
• ECM 3. White Roof
Cruise Terminal H
• ECM 1. White Roof
• ECM 2. Installation of energy efficient A/C units
Cruise Terminal J
• ECM 1. Installed building management system
PortMiami (Seaport)On a scale of 1 to 10, with 10 being highest, PortMiami rates its ability to capture energy efficiencies at an 8. This is primarily attributed to its newly created Design Guideline Standards and the focus on being a sustainable port. However, PortMiami currently lacks the ability to influence the energy efficiency of its business partners such as cruise and cargo tenants. For example, Homeland Security has special lighting requirements in the cargo yards that, while energy intensive, are security requirements for port operations.
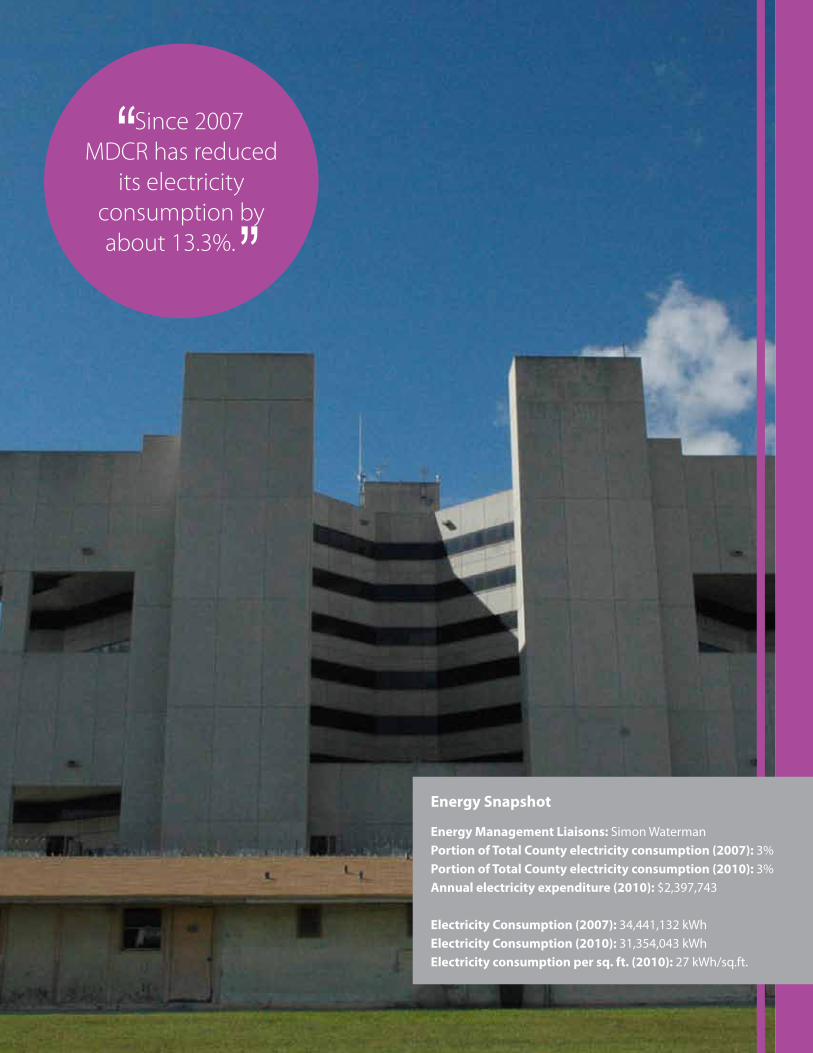
since 2007 Mdcr has reduced
its electricity consumption by about 13.3%.
energy Snapshot
energy Management Liaisons: Simon WatermanPortion of total County electricity consumption (2007): 3%Portion of total County electricity consumption (2010): 3%annual electricity expenditure (2010): $2,397,743
electricity Consumption (2007): 34,441,132 kWhelectricity Consumption (2010): 31,354,043 kWhelectricity consumption per sq. ft. (2010): 27 kWh/sq.ft.

E l e c t r i c i t y P l a n 39
overviewThe Miami-Dade Corrections and Rehabilitation Department (MDCR) operates the eighth largest jail system in the country with an average of 7,000 people awaiting trial or serving sentences of 364 days or less. MDCR currently operates six detention facilities. MDCR is affiliated with the American Correctional Association (ACA) and the Florida Corrections Association Commission, Inc. (FCAC) which administer accreditation programs for all components of correctional agencies, including the effective operation of detention centers and administrative offices.
approachThe Miami-Dade Corrections and Rehabilitation Department (MDCR) has been a frontrunner in the County’s quest for energy conservation and sustainability. The Facilities Management Bureau (FMB) has sponsored and managed a multitude of Energy Conservation Measures (ECM’s) that have reduced the overall utility costs and provided improvements to the infrastructure and physical plant. MDCR Facilities Management Bureau and Maintenance Unit employees are highly committed to innovating and maintaining sustainable building solutions. Through these efforts, MDCR has already reduced their electricity consumption by around 13.3 percent since 2007.
ProjectsTurner Guilford Knight Detention Center
Annual savings $226,128
• ECM 1. Comprehensive lighting retrofit: Change existing T12 fluorescent bulbs and ballast to high efficiency electronic ballast and T8 fluorescent lamps. Replace incandescent exit lights with LED lighting.
• ECM 2. Install premium efficient motors.
• ECM 3. Replace existing building control system with updated direct digital system; install electronic damper controls, valves, actuators, sensors, and variable frequency drives.
• ECM 4. Install hybrid fuel technology to existing generator.
• ECM 5. Replace all high flow sanitary fixtures.
• FUTURE: Replace brine tank to glycol-based ice builder, replace unit pendulum lighting, replace Cleaver Brooks boilers, replace kitchen steam boilers with precision high efficiency steam generators, upgrade existing BMS to WEB addressable system, link lighting control functions for non-occupied areas.
Women’s Detention Center
Annual savings $50,000
• ECM 1. Replace existing tower and chillers with high efficiency chiller and towers.
• ECM 2. Change existing T12 fluorescent bulbs and ballast to high efficiency electronic ballast and T8 fluorescents. Replace incandescent exit lights with LED lighting.
• ECM 3. Replace all high flow sanitary fixtures.
Pre-Trial Detention Center
Annual savings $299,551
• ECM 1. Replace all high flow sanitary fixtures and inefficient water heaters.
• ECM 2. Replace T12 fluorescent bulbs and ballast to high efficiency electronic ballast and T8 fluorescents. Replace incandescent exit lights with LED lighting. Replace (14) 1000 watt high intensity incandescent spotlights with (10) 400 watt metal-halide spotlights.
• ECM 3. Purchased new chiller.
• ECM 4. On call program with FPL allows to curtail rates.
• FUTURE: Replace existing roof with high value solar reflectance index (SRI) roof, install variable speed drives on tower motors, install chiller plant controllers, replace perimeter lighting with induction lighting, re-glaze existing building and/or windows, provide BMS for the air-conditioner.
Metro West Detention Center
Annual savings $286,279
• ECM 1. Replace all high flow sanitary fixtures and inefficient water heaters.
• ECM 2. Replace T12 fluorescent bulbs and ballast to high efficiency electronic ballast and T8 fluorescents.
• ECM 3. On call program with FPL allows to curtail rates.
• ECM 4. Cooling towers efficiency: reduction in water evaporation and addition of energy efficient variable drives and motors.
• ECM 5. Replace BMS to allow for greater control of chilled water usage, smoke exhaust, and air handlers.
• ECM 6. Replace exterior perimeter lighting to induction lighting.
• ECM 7. Replace existing roofing with high value solar reflectance index (SRI) roof.
• ECM 8. Window frame and glazing retrofits.
• FUTURE: Retrofit chiller plant to magnetic units.
Training and Treatment Center (TTC)
• ECM 1. Retrofit of unit showerhead to low flow showerhead.
• FUTURE: Replace roof, remove commercial dishwasher, continue plumbing retrofits, and upgrade perimeter lighting to more efficient lighting.
Miami-Dade Corrections & Rehabilitation (MDCR)On a scale of 1 to 10, with 10 being highest, MDCR rates its ability to capture energy savings at an 8. To capture further opportunities, MDCR requires funding for capital equipment/services, additional personnel funding and resources for projects which have been incorporated in current operational and capital budgets. Due to the age of the facilities and security requirements of the Department, implemented solutions are sometimes difficult to institute and maintain. Training of staff and inmates in green practices will further the Department’s sustainability goals.
M i a m i - D a d e C o u n t y40
Appendix 1: Electricity Reduction Ordinance
titLe
ReSoLution to ReDuCe MiaMi-DaDe County GoVeRnMent’S eLeCtRiCaL eneRGy ConSuMPtion
BoDy
WHeReaS, the cost of fuel for electricity generation has increased dramatically within the past year and the US Energy Information Administration has forecast that the price of oil and natural gas, the source of most of the fuel for electricity generation for Miami-Dade County government, will remain high for the foreseeable future; and
WHeReaS, Florida Power & Light Company, the primary electric utility in Miami Dade County, has received approval from the Florida Public Service Commission (PSC) to increase fuel charges by 8% starting in August 2008, and in 2009 will request an increase in base rate charges to compensate for rising costs; and WHeReaS, Florida Power & Light Company has also received approval from the PSC to begin collecting additional funds from customers for the initial cost of planning additional nuclear power facilities at the Turkey Point complex; and
WHeReaS, this rise in energy costs will directly affect the operating budget of Miami Dade County government, which used 1.17 million megawatt-hours of electricity in 2007 alone; and
WHeReaS, it is imperative that the County aggressively pursue energy conservation options wherever and whenever possible to contain electricity costs and to protect the environment through reduced emissions of pollution,
E l e c t r i c i t y P l a n 41
noW, tHeReFoRe, Be it ReSoLVeD By tHe BoaRD oF County CoMMiSSioneRS oF MiaMi-DaDe County, FLoRiDa, that:
Section 1. The Mayor is hereby directed to develop a plan to reduce electricity consumption in County governmental operations by 20% from 2007 County usage consumption levels not later than 2014 (234,000 Mwh).
Section 2. The Mayor is hereby directed to investigate all opportunities to reduce electric energy consumption in County operations and conduct electric energy audits for all County departments to identify both short and long-term opportunities for electric energy savings including, but not limited to:
a. Mandating that building energy use and carbon emissions be measured, tracked, managed and benchmarked, annually at a minimum, through the use of EPA’s Energy Star Portfolio Manager along with other applicable building energy use tracking and management tools that the Mayor or his designee deem necessary for effective facilities-based energy management;
b. Commissioning (a process designed to achieve, verify, and document improved energy efficiency, environmental health, indoor air quality) for existing energy consuming County buildings and facilities to maximize energy performance;
c. Establishing a mandate for the County to procure products qualified by the Energy Star program on date of purchase for all purchases for which the Energy Star program has established standards;
d. Deploying renewable energy generation where feasible and accelerating landfill gas energy projects;
e. Establishing policies for reducing electric energy demand in County computers by requiring that electric energy-saving features be activated on all desktop computer systems (excluding systems required for emergency safety systems) and in a fashion that does not allow employees to disable such features, and that the County utilize software upgrade tools recommended by the Energy Star program;
f. Evaluating the electric energy consumption of the County server farms and setting a goal for reducing electric power consumption by the County’s technology infrastructure;
g. Training qualified County building and plant maintenance staff to perform small scale energy efficiency retrofits;
h. Developing an energy efficiency educational campaign for County employees to complement investments in electric energy efficient equipment and other energy conservation investments.
Section 3. The Mayor shall prepare and submit the electricity consumption reduction plan described in Section 1 herein above to the Board of County Commissioners within ninety (90) days of the date of passage and adoption of this Resolution.
M i a m i - D a d e C o u n t y42
Appendix 2: Report on Efforts to Develop an Electricity Reduction Plan
On March 3, 2009, the Board of County Commissioners adopted Resolution No. R-228-09 directing the Mayor to develop a plan to reduce electricity consumption in County governmental operations by 20 percent from 2007 County usage consumption levels not later than 2014. This report provides an update on plan development, including a summary of actions already taken to reduce consumption, future strategies planned and/or under consideration for implementation, and a discussion of significant challenges the County will face in meeting the 20 percent goal.
overview
TheCounty’selectricityconsumption–notexpenditures,butkilowatthourusage–hasgrownontheaveragebytwopercentayearover the past five years. The County currently has over 4,500 separately metered electrical accounts; in 2007, these comprised 68 percent of County’s overall Greenhouse Gas Emissions (GGE). It is especially important to note that some 90 percent of the County’s total electrical usage is concentrated in less than 10 percent of these 4,500-plus accounts. The largest among these include a number of Miami-Dade Water and Sewer Department (WASD) water treatment and waste water treatment plants; terminal and garage buildings at Miami International Airport; General Services Administration’s (GSA) Downtown Government Center utility plant, Regional Data Processing & Communications Center, and other large multi-purpose and Court buildings; Turner Guilford Knight and other County correctional facilities; and district cooling plants operated by Aviation and GSA.
Certain basic assumptions need to be kept in mind in order to develop a sound plan and determine realistic expectations for that plan:
•Staffmust identifyand incorporate into the reductionplan (a)electricalenergyconsumptionsince2007,and (b)projectedfuture consumption from capital projects planned for development between now and 2014. Achieving the legislated 20 percent goal will require that any growth since 2007 and from future capital projects be absorbed without any increase to the 2007 baseline.
•Whereverfeasible,conservationandconsumptionreductionprogramsshouldtargetthehighestconsumingassetsoraccountsfirst, in order to maximize investments or “bang for the buck.”
•Aneffectivestrategicplanwillhavetobebroad-basedandflexible,inordertoaccommodate:
•Differingtypesofenergyend-usesorassets(e.g.buildings,industrialprocesses/facilities,lighting,HVAC,electrifiedraillines,electronic equipment, etc.),
•Therelativesharethattheseusesmakeupofthetotalelectricityfootprint,and •Thedifferingapproachestoconservation,e.g.operatingandmaintenancepractices,behavioraleducation,procurement
policy, incremental vs. lifecycle budgeting decisions, technology enhancements, “retrofit vs. replace,” etc.

E l e c t r i c i t y P l a n 43
•Ratherthanrelyingsolelyontotalelectricityconsumption,itisrecommendedthat“percapita”typeofenergyuseindicesbeconsidered in evaluating ongoing energy performance. Examples of measures are listed below. By doing so, we fold energy use into the suite of key performance indicators monitored through the County’s existing Active Strategies Enterprise (ASE) program, and create departmental accountability for energy management.
•Kilowatt-hourusagepersquarefootinofficeenvironments •KilowatthoursorBTUspergallonofdrinkingwaterproduced •Kilowatt-hourusageperMetrorailpassenger
enhanced energy Management & Coordination
The following initiatives are being undertaken to enhance and effectively coordinate the efforts of this government toward our various energy and climate change mitigation targets:
1. Give a strategic focus to the management of the County’s fuel and electric energy. Staff is integrating departmental and countywide performance indicators into ASE for fuel, electricity, paper, and other resource consumption activities, including procurement of certified “green” products. The ability to measure, monitor and, where applicable, actively manage resource efficiency is particularly key to avoiding and/or reducing the use of fossil fuels.
2. improve energy Management Planning. The combination of a Countywide Energy Management Plan with centralized energy management and coordination is crucial to the achievement of the 20 percent mandate by 2014. The planning effort itself will commence as part of the implementation of the America Recovery and Reinvestment Act (ARRA) funded energy project that is expected to be awarded this summer. The plan will include senior management commitment, centralized energy coordination, organization-wide representative energy committees (steering and technical), energy usage reporting and monitoring, and ongoing training.
3. utilize formula-based energy efficiency Conservation Block Grants (eeCBG) to implement:• Enterprise-wide and facility-based Energy Management System upgrades, including metering/sub-metering of assets, systems
integration, enhanced utility accounting software, energy management/coordination functionality, and relevant training• The development and implementation of an Energy Management Plan• An internal energy-efficiency campaign for employees• Demonstration and pilot projects for energy efficiency and renewable energy• An energy efficiency/sustainable construction evaluation of our capital improvement process including the development of
guidelines and procedures for capital departments, from the pre-design through construction, to ensure maximization of energy efficiency
4. Provide Certified energy Manager (CeM) based training support to energy managerial and technical staff; e.g., CEM training, web-based energy management training through established organizations like the Association of Engineers.
5. expand implementation of energy Star Portfolio Manager, which is Environmental Protection Agency’s facility energy performance benchmarking tool. To date, the data for 34 pilot facilities have been uploaded and scored (where applicable) against national averages for similar facilities.
6. expand use of Commissioning Contractor Pools. To aid the successful design, construction and operation of certified “green” County buildings, the Office of Capital Improvements has created a pool of contractors within its Equitable Distribution Pool program for Architecture/Engineering firms with sustainable construction expertise, as well as a separate pool for commissioning and sustainable building project oversight and management. A third pool for new, retro and re-commissioning of buildings is under consideration. These pools facilitate the energy performance of both new construction and existing buildings over the “business as usual” baseline.
7. Human resources, GSA and other participating departments have assessed the potential for, and are piloting alternative work week schedules and strategies.
8. Staff is reaching out to community stakeholders such as the Building Owners Management Association to share and coordinate knowledge, training and energy consumption reduction strategies.
on-Going electrical energy Reduction activities There are existing energy conservation best practices that will be expanded through a concerted energy management and coordination effort.
• Energy Performance-based Contracting has reduced electricity consumption on the average by 11 percent for the projects executed thus far. Under the new State Energy Performance Contract, the County can now consider projects payback periods up to twice
M i a m i - D a d e C o u n t y44
that of the maximum allowed under the old contract and there are 10 companies in the new contract versus three in the previous one. As such, there should be the potential to shift the overall average reduction above 11 percent, and to implement more types of projects in more facilities and operations.
• From an operations and maintenance perspective, the combination of staff knowledge and expertise with enhanced Building Management software can result in improved efficiency through enabling more proactive rather than reactive energy management. Further training of building/facility management staff and upgrades to building/energy management systems should contribute to the maximization of operations and maintenance-based energy efficiency.
• Energy-intensive service delivery including the delivery and treatment and (re)distribution of potable and wastewater supplies benefits through decreased overall electricity consumption through aggressive water conservation outreach, education and policy. To this end, the County has adopted new water efficiency standards and launched a community-wide “Use Less” water conservation campaign as well as school-based educational programming.
Challenges
Despite the opportunities available for improving energy efficiency, the expansion of County service delivery and square footage of owned, managed and operated facility space will in some cases double or triple electrical energy consumption especially for those County departments that have energy-intensive operations. For example, WASD is facing increasing regulatory requirements for water treatment that will require even more energy to achieve. There is also the new square footage of facility space coming on line through the implementation of the five year capital plan.
Budgetary pressures are leading to cost-cutting efforts to shift County operations from leased to owned locations. It is unlikely that either efficiency strategies alone or the piloting/demonstration of renewable energy projects will guarantee the mandated 20 percent decrease in electricity consumption in the wake of these trends. The County will have to look for more aggressive and innovative ways to avoid utility-based electricity consumption, including creative financing of large-scale renewable energy projects to power key County operations/assets, and a focus on demand-side management and passive or zero energy technologies for both our own operations and energy-intensive service delivery.
Conclusion
The County’s sustainability focus and efforts raise the visibility and strategic importance of electrical energy management, along with other resource consumption issues (water, fuel, paper, etc.), is laying the foundation for a viable plan toward the 20 percent electricity reduction goal as well as other climate change mitigation and energy consumption reduction goals. The important steps the County is taking towards this end include:• Improved electrical energy baseline and alternative scenario consumption analysis for the past, present and the future,• The use of Federal Stimulus (ARRA and EECBG) monies to fund energy management planning and coordination, strategic energy-
efficiency/renewable energy demonstration projects, retrofits and financing initiatives, • A plan to expand and enhance the use of energy performance-based contracting to increase the number and energy savings of
such projects, and• The integration of energy performance into departmental service delivery and performance measures where applicable as well as
organization wide strategic planning.
While these efforts will aid the County in maximization of energy-efficiency and identifying major challenges to reducing energy consumption, additional policy and program innovation and collaboration across departments and with external stakeholders will be necessary for moving the organization to decreasing overall fossil-fuel based electrical energy consumption.
The Board will be kept apprised of our on-going efforts to reduce our electrical consumption, as appropriate. If you have any questions, please call me directly at 305-375-1880.
cc: Honorable Carlos Alvarez, Mayor Denis Morales, Chief of Staff, Office of the Mayor Assistant County Managers/Special Assistants Department Directors
E l e c t r i c i t y P l a n 45
Appendix 3: EECBG Project Summary
The Office of Sustainability is overseeing the implementation of Miami-Dade County’s Energy Efficiency and Conservation Block Grant (EECBG) program, funded by the Recovery Act and administered by the U.S. Department of Energy. Eight County departments are responsible for the implementation of the following 12 projects:
enterprise-wide and Facility-based energy Management Systems upgrade & CoordinationInstallation of energy management system software/hardware upgrades and energy conservation features at the Stephen P. Clark Government Center and Gerstein Justice Building. Implementation of enterprise-wide utility billing software.
Miami-Dade Community-Wide energy efficiency CampaignOutreach program aimed at achieving long-term behavior changes to reduce energy use. Elements include light bulb exchanges, home energy savings workshops, $750 Savings Challenge, residential appliance rebates and commercial rebates. To date, the County’s first ever, and award-winning, internal and external sustainability outreach program has resulted in a reduction of 4,933 metric tons of CO2e or $907,000 a year in energy savings.
Grants to Green nonprofits (G2Gn) ProgramProvided over $1 million in grants to 48 community based organizations to perform energy audits and energy-efficient building retrofits, replacements and upgrades to 55 existing facilities.
Development of Sustainable Capital improvement Procedures & GuidelinesCreated Sustainable Capital Improvements Procedures and Guidelines, along with a corresponding training program, to ensure Miami-Dade County’s capital improvement process maximizes energy conservation for new construction and building renovations. This project was completed in February 2011.
Methane Sequestration from Landfill & Digesters to Power Water & Sewer operationsConstruction project at the south wastewater treatment plant that will generate electricity from biogas produced at the plant and the nearby landfill. Once completed, it is expected to generate an additional 33,500 kilowatts of electricity a year that would otherwise be wasted.
energy efficient & Sustainable Buildings evaluation of Building/Zoning Codes & Permitting ProcessesEvaluated existing County and State zoning and building codes and permitting processes and suggested changes to remove obstacles to climate change-preparedness and energy efficient land use and development. Resulted in the Code Diagnosis Report and Priority Recommendations. This project was completed in August 2011.
Miami-Dade Libraries Daylight Cool Roof Retrofit ProjectReplaces the existing roof at Homestead Library with a high-reflective Cool Roof system, which reduces energy use and air pollution. This project was completed in June 2010.
Miami-Dade Libraries Daylight Harvesting Demonstration ProjectInstalled programmable lighting controls tied into daylight coming in from outside at the Naranja and Kendale Lakes and International Mall library branches. This project was completed in September 2011.
Pilot Desktop Virtualization ProjectReplacing nearly 1,800 personal computer workstations with more energy-efficient virtual desktops utilizing “thin client” technologies to reduce power consumption and environmental waste. Thin clients are currently being deployed. For more information, visit the Desktop Virtualization Support Center.
energy-efficient Lighting on “Green Roadway” Demonstration ProjectCreating “Green Roadways” on North Royal Poinciana and North Miami avenues; will promote people-friendly movement by including high-efficiency lights and pedestrian-friendly access while reducing energy use and air pollution. Construction is currently underway.
Solar Power Systems Demonstration for Powering of County Park BuildingsInstalled solar panels on the roofs of recreational buildings at the Country Village, Martin Luther King Memorial and Westwind Lakes parks. The project was completed in December 2011.
Sustainable technologies Demonstration ProgramDemonstration underway to identify and test equipment, technologies and services that can enhance building sustainability at existing County facilities based on South Florida’s climate.

M i a m i - D a d e C o u n t y46
Appendix 4: Resources for Low Cost/No Cost Energy Conservation Measures (ECMs)
BoMa 30 Point Checklisthttp://www.boma.org/SiteCollectionDocuments/Org/Docs/Resources/BEEPChecklist_final.pdf
iFMa no-Cost/Low-Cost energy Savings Guide: http://www.clima-tech.com/system/documents/5/original/NoCostLowCostGuide.pdf?1315497352
Miami-Dade County $750 Residential Savings Challenge:http://feedback.miamidade.gov/Community/se.ashx?s=57F31458263FA257
Pacific northwest national Laboratories “Building Re-tuning training”:http://retuningtraining.labworks.org
texas State energy office’s eCMs:http://www.cleanairaction.org/education/StimulisWorkshop09/SECO_Common_ECMs%5B1%5D.pdf
u.S. Department of energy Federal energy Management Program’s operations & Maintenance Best Practices Guide:http://www1.eere.energy.gov/femp/pdfs/omguide_complete.pdf

E l e c t r i c i t y P l a n 47
Appendix 5: Behavior Change Programs
Behavior change programs may target County staff, tenants or citizens. Users of this guide are encouraged to explore various behavior change resources. The consultants and authors profiled briefly here are not specifically endorsed by Miami-Dade County, nor is this an exhaustive list. Rather, this guide is intended to provide a sense of the type of work being done and the possibilities that exist within the realm of behavior change.
•Community-Based SocialMarketing:Aprovenmethod for creating effectivebehavior changeprograms, community-basedsocial marketing targets sustainability issues, including energy efficiency. Founder of the method, Doug McKenzie-Mohr, has worked across the U.S. and Canada as well as internationally on designing and implementing successful behavior change programs.
•Book:Fostering Sustainable Behavior: An Introduction to Community Based Social Marketing, by Doug McKenzie-Mohr. A “how-to” guide for creating a community based social marketing program
•Website:www.cbsm.com.Casestudiesandacademicstudies tomine forbestpracticesandsuccessfulprogramsothershave designed and implemented.
•OrganizationalChangeModels:Manyofthetoolscontainedinorganizationalchangemodelsaredirectlyapplicabletocreatingprograms that foster behavior change in organizations like County departments. There are many such models and tools. One example is the 3-part framework for change advanced by Chip and Dan Heath in their book Switch:
•Direct •Followthebrightspots,byinvestigatingwhat’sworkingandcloningit. •Scriptthecriticalmoves,bybreakingdownthebigpictureintospecificbehaviors. •Pointtothedestination,byclarifyingforallwhereyou’regoingandwhyit’sworthit.
•Motivate •Findawaytoarticulatetheemotion.Knowingsomethingisn’tenoughtocausechange.Makepeoplefeelsomething. •Shrinkthechange,breakingitdownintosmallerpiecesuntilitnolongerthreatenspeople. •Growyourpeople,bycultivatingasenseofidentityandinstillingagrowthmindset.
•ShapethePath •Tweaktheenvironment.Whenthesituationchanges,behaviorchangesinresponse.Solookforwaystochangethe
situation or environment. •Buildhabits,encouraging the“right”oneswhereverpossible,becauseoncebehaviorbecomesahabit, itno longer
requires conscious effort. •Createanewnorm.Behaviorissocialandcontagious.Helpitspreadbyshowinghowthedesiredbehaviorisbecoming
increasingly adopted.
Building Department-Wide Buy-in
Use the feedback mechanisms and ideas listed below to create and maintain buy-in, excitement, sustained contribution and commitment from departmental staff and other stakeholders.
These tools work best when implemented together, rather than separately, as they reinforce and complement one another:
1. Keep both goals and progress up-to-date and visible. 2. Make employees and other stakeholders collaborators in developing solutions. 3. Collect and publish personal success stories. 4. Reward positive behaviors publicly. All of these measures must be performed consistently over time in order to build momentum
and provide maximum effectiveness.

M i a m i - D a d e C o u n t y48
Goals, and progress toward them, should be consistently visible to all employees and stakeholders. Employees and stakeholders should be able to see:
•Thegoalsidentifiedfortheirdepartmentandprogresstowardachievingthem. •Howtheirdepartmentalgoalscomparetootherdepartments. •Theirdepartment’scontributiontowardtheCounty’s20percentelectricityreductiongoal,andtheorganization-wideprogress
toward that goal.
These measures are important, as they:
•Keepenergyattheforefrontofstaffs’minds,astheyareultimatelytheoneswhowilldrivesuccessorfailureinattainingthegoals.
• Senda strongmessage to staff thatdepartmentaladministrationconsidersenergyefficiencyandconservationgoals tobeimportant priorities.
•Inspirefriendlycompetitionforpositiveoutcomesbetweendepartments. •Provideausefulbackdropandvisiblebenchmarksforincentiveandpublicrecognitionprogramsthatrewardindividualsand
teams for progress.
energy Management Campaign implementation Vehicles
Use these vehicles to make departmental goals consistently visible: •Communicatedepartmentalsuccessesinternally:
•Placegoalsandprogressreportsinaprominentpositioninregularemailcommunications(suchasnewsletters,etc).If no such vehicle currently exists, create a simple, brief format for sending such email “blasts” out on a monthly basis, following the tabulation of each month’s energy readings, billings and break-downs.
•Placethermometer-typeorothergraphicallyillustrativepostersinkeyareasandupdatethemregularlytoshowprogresstoward goals.
•Mandatethatbriefupdatesongoalsandprogressbeincludedatthestartofdepartmentalstaffmeetings,atalllevels.
•CommunicatedepartmentalsuccessesCounty-wide:
•Communicateandpostresultseitheronaposterorawebpage. •Disseminatethroughe-newsletters,suchasGIC’s“What’sNew”weeklyupdates.
•Collaboratewithemployeesandotherstakeholdersindevelopingsolutions:
•Createasafeenvironmentforsuggestions(forexample,withanonymoussuggestionboxes). •Withapprovalfromtheoriginatoroftheidea,givecreditforideasinapublicforum.
•Considersocialnorm/peerpressuremechanismssuchasrewards,positivereinforcementandpublicrecognition.Solicitpersonalstories and/or nominations for employees that demonstrate positive contributions, successful actions and shifts in mindset/thinking about energy efficiency and/or conservation:
•Seekandencouragesubmissionsregardingenergymanagementgoalsincommunicationswithstaff(e.g.,emailblasts,newsletters, posters, during the goals update portion of staff meetings, etc).
•Collectandpublishsuccessstories.Socialproof isproventobeapowerful influenceonbehavioramongpeers.Themore of these stories that are published, the more overwhelming the social proof, and the more employees are likely to adopt new attitudes and behaviors.

E l e c t r i c i t y P l a n 49
Appendix 6: Economic Analysis and Financing OptionsAs investments, energy improvement projects should be analyzed based on economic, environmental and social benefits. This Appendix is intended to assist with return on investment (ROI) calculations and evaluating financing options for various projects under consideration.
economic analysisIt is critical that the financial evaluation of projects not be overlooked or ignored. If a project is being outsourced, financial evaluation can be requested in the bid documents. If at any point, this process feels daunting, ask for outside assistance from accounting, budgeting or finance staff.
Here are some considerations when calculating ROI:•Considertheimpactthatdurabilityandlifecyclecostanalysishaveonlong-termoperating&maintenancecosts.
•Attempttoaccountformultipleor“side”effects,bothpositiveandnegative.Considerhowtheproposedprojectmightinteractwithexisting conditions, or other upcoming projects.
•Strategizenotonlyforthegreatestfinancialreturnintheprimarytargetareaoftheinvestment/project,butalsoforthegreatestnumber of positive impacts across multiple systems.
Many tools are available in the public sphere, particularly online, for calculating all levels of ROI, from capital projects to small projects in which facility managers may evaluate best options when replacing systems or making repairs. It is beyond the scope of this guide to list all the resources that might apply to the various projects undertaken by different County departments. Seek out the tools that make sense for the project and situation at hand. Listed below are a few examples of such resources.Tools for calculating ROI and evaluating financing options:
•EPA’sEnergyStarBuildingUpgradeManual:containsmodelsforcashflowanalysisandevaluatingfinancingoptions.http://www.energystar.gov/index.cfm?c=business.EPA_BUM_CH3_InvestAnalysis.
• EPA Energy Star cash flow analysis & building upgrade value calculators: http://www.energystar.gov/index.cfm?c=assess_value.financial_tools.
•BOMA’s(BuildingOwners&ManagersAssociation)guidetosustainablebuildingoperationsandpractices:http://www.boma.org/EverGreen/Pages/default.aspx.
•TheBOMAguidecontainslinkstoahostoftools,forexample,theGSASustainableFacilitiesTool:ThisinteractiveonlinetoolfromtheU.S.GeneralServicesAdministration(GSA)helpsbuildingmanagersidentifyandprioritizecost–effectivestrategiesto make office buildings and workplaces more sustainable.
•RockyMountainInstitute’sRetrofitDepotcontainsahostofexcellenttoolsforcalculatingROI,aswellasevaluatingwhichlevelofretrofit will provide the greatest return. http://www.retrofitdepot.org/ToolsAndResources.
•FloridaDepartmentofManagementServices(DMS)implementsthestate’shigh-performancebuildingstandardsforstatefacilities.In addition, the department’s Division of Real Estate Development and Management maintains energy conservation guidelines, the state energy management plan as well as a design and construction guide. It has established a guide supporting the Florida Life-Cycle Cost Analysis Program: http://www.dms.myflorida.com/business_operations/real_estate_development_management/facilities_management/sustainable_buildings_and_energy_initiatives.
Financing optionsFlorida Power & Light (FPL)
FPL provides a suite of rebates and incentives associated with high-performance building design and construction:http://www.fpl.com/business/energy_saving/programs/index.shtml.
Miami-Dade County energy Performance Contract (ePC) Program
Through access to an existing State of Florida contract, the County is able to access the services of ten companies (“ESCOs”, Energy Services Companies), to provide energy savings improvements for all county facilities. A County Resolution (R-1147-09) has been issued to this means. By contract, the requirements of Chapter 489.145 of the State of Florida Statues, which governs Energy Efficiency Contracting, are to be followed by the County and the ESCOs in conducting this work.
The ESCOs will be assigned to identify energy and water saving opportunities, recommend saving measures, report on them to the County, and if the recommendations are acceptable, perform any necessary design and construction services to implement the measures. Typical measures include replacing light fixtures, air conditioning equipment, and plumbing fixtures.

M i a m i - D a d e C o u n t y50
in order for the conservation measures to be acceptable, all expenses associated with this program must pay for themselves, through utility savings and/or capital expenditure avoidance, within a fixed period of time from the implementation of the measures. The program also offers the advantage of reducing equipment maintenance and avoiding some capital expenditures. The program is set up to work as follows:
1. ISD (previously GSA) has been assigned to be the program coordinator and point of contact between the ESCOs and the different departments.
2. One or more of the ESCOs in the Pool is selected (through an RFQ or RFP) to perform an energy audit on specific, pre-selected County facilities.
3. Once the energy audit has been completed, a report, including recommendations for energy savings measures is submitted to the County. A copy of this report will be given to the affected Department, and other copies will be reviewed by ISD.
4. If the measures in the audit are acceptable to the County from the economic, technical and practical standpoints, the County issues a contract to the ESCO to proceed to perform any design, purchasing, and installation of equipment that may be necessary, in a “turnkey” fashion.
5. Once the contract is awarded, the ESCO will also assist the County in locating a source for providing a Municipal Lease, which is a low interest (typically 4 to 5%) financing tool for the energy improvements, with payments normally set on a regularly scheduled basis, for a period of 10 years or more. There is no requirement, however, that the improvements be paid through a Municipal Lease. A department can choose to pay in cash or other means. The State Statues, however, do not allow the improvements to become a financial obligation for the County, thus payment through the issuance of bonds is not an alternative.
The County’s Finance Department has been helpful in reviewing this process before, and can be counted on for any help required with future financial arrangements.
1. The Municipal Lease Company deposits the money to pay for the energy improvements in an escrow account. The County approves phased draws from this account as construction proceeds, to pay the ESCO. If any “upfront” cash contributions are used, they are disbursed during the construction phase.
2. At the end of the construction period, and once the equipment and/or fixtures are turned over to the County, the County starts making payments on the Municipal Lease.
The program has the following features of interest:
1. There is no cost to the departments for this work, unless the County decides to proceed with the implementation of the energy savings measures.
2. ISD assists with the evaluation of the audits, project and construction management, offers technical assistance, serves as liaison between the ESCOs and the County Department, and reports on the progress of the program to interested County and outside agencies. It is recognized that the degree of technical and project management assistance may vary according to the in-house capabilities and time availability within the particular department. There is enough flexibility to allow as much or as little involvement by the departments as they may choose.
3. The contract and the State Statues require the ESCOs to guarantee the savings for the entire “payback” period of the project. The ESCOs state in their reports how much each measure will save in term of energy units (translated to dollars according to the existing rate), and will refund the County if, after the proper measurement and verification, the measure does not achieve the guaranteed savings. Any savings above those estimated will be kept by the County.
4. The County has the final approval of any equipment that is to be purchased. Because of this, and the fact that the ESCOs guarantee the savings (thus indirectly guaranteeing the proper performance of the equipment) the equipment that is purchased through this program tends to be of the best available quality in the market, as well as of the best available efficiency. The ESCOs normally offer extended warranties or maintenance contracts on the equipment they install, which may also be of added benefit to the County.
5. The Statues also allow savings that can be achieved from avoided maintenance as credits towards the viability of a project. The County, however, has chosen to allow credits only on maintenance presently performed by outside contractors, and from avoided parts or supplies purchases. Since this program is not being viewed as a means to reduce County maintenance personnel, or as means of “privatizing” County services, no credits for in-house labor savings are allowed.
6. Since the money to pay for the Municipal Lease installments is expected to come from the department’s expense budget - more than likely through its utility budget - each department must ensure that allocations are made for these payments for each year. This is to be done throughout the life of the lease (10, in some cases 15 years). While reductions on utility bills should be evident, it is expected that the great majority of the “saved” money will have to go towards making the lease payments. Therefore, this program should not be viewed as a major means to reduce overall expenses, at least while the Municipal Lease is being paid. Since it is normally advantageous to the County and the ESCOs to include as many measures as possible within the maximum allowed “payback” period, we do not expect a major reduction on the departments’ overall expense budget during the lifetime of the Municipal Lease. The program’s primary goal instead is the reduction of the department’s energy and water usage, which is a very important County priority.
E l e c t r i c i t y P l a n 51
References
Capehart, Barney L, Wayne C. Turner and William J. Kennedy. Guide to Energy Management. Lilburn: The Fairmont Press, 2008. Print.
Collaborative Economics. Untapped Potential of Commercial Buildings: Energy Use and Emissions. 2010.Web.
ICF International and National Association of Energy Service Companies. Introduction to Energy Performance Contracting. October 2007. Web. McHugh, Eileen. Energy Management Basics for Municipal and State Planners and Managers in Massachusetts. Rebuild Massachusetts. Web.
U.S. Energy Information Administration. U.S. Department of Energy. 2012. Web.

MiaMi-DaDe County
Electricity Master Plan:
Establishing a Comprehensive
Energy Management Program


