
Metro District Highway Investment Plan
2009 – 2028
Your Destination: Our Priority
Minnesota Department of TransportationMetropolitan District

Agenda
• Setting the Context– MnDOT Strategic Vision and Mission– Statewide Planning Purpose
• Metro District Profile• Developing the Plan
– Identify Needs– Project Future Revenue– Set Goals– Identify Investment Priorities– Anticipated Projects (2009-2018)– Unfunded Needs

MnDOT Strategic Vision
Global Leader in Transportation, Committed to Upholding Public Needs and Collaboration with
Internal and External Partners to Create a Safe, Efficient and Sustainable Transportation
System for the Future

MnDOT Mission
• Provide the Highest Quality, Dependable Multi-Modal Transportation System Through Ingenuity, Integrity, Alliance and Accountability
Strategic DirectionsSafety Mobility Innovation Leadership Transparency

Minnesota Statewide Transportation Plan Purpose
• To Establish a Multimodal Transportation Vision, Supporting Policies and Strategies to Assist MnDOT and its Partners in Focusing Investments and Services Over the Next 20 Years

Statewide Plan Policies
Policy 1: Traveler SafetyPolicy 2: Infrastructure PreservationPolicy 3: Maintenance, Operations and SecurityPolicy 4: National and Global Communications Policy 5: Statewide ConnectionsPolicy 6: Twin Cities MobilityPolicy 7: Greater Minnesota Metropolitan and Regional MobilityPolicy 8: Community Development and TransportationPolicy 9: Energy and the EnvironmentPolicy 10: Accountability and Transparency

Metro District Profile

Metro District Profile
• 8 Counties• 156 Cities• 2.8 Million Population• 1.5 Million Jobs• Level 1 Trade Center (Twin
Cities)• 1169 Lane Miles of IRC• 4014 Total Lane Miles
Metro District

Metro District Profile
• About 10% of the state’s miles of trunk highway
• About 50% of statewide vehicle miles traveled
• 30 Tier I and Tier II Bridges– 1230 total bridges
• 370 Trunk Highway Interchanges

Uniquely Metro

Developing The Plan

Process and Timeframe
Metro District Open House Held February 12, 2009MnDOT Public Hearing Scheduled for March 26, 2009
Initial Public Outreach To ID
Important Issues
Initial Plan Policy
Framework
Public Discourse on Key Issues,
Chapter 152 Implications,
Emerging Plan Direction
Spring 2007
Present Draft Plans and Solicit
Stakeholder Comments
Draft State and District
Plans
Final State and District
Plans
Winter/Spring 2009Summer 2008
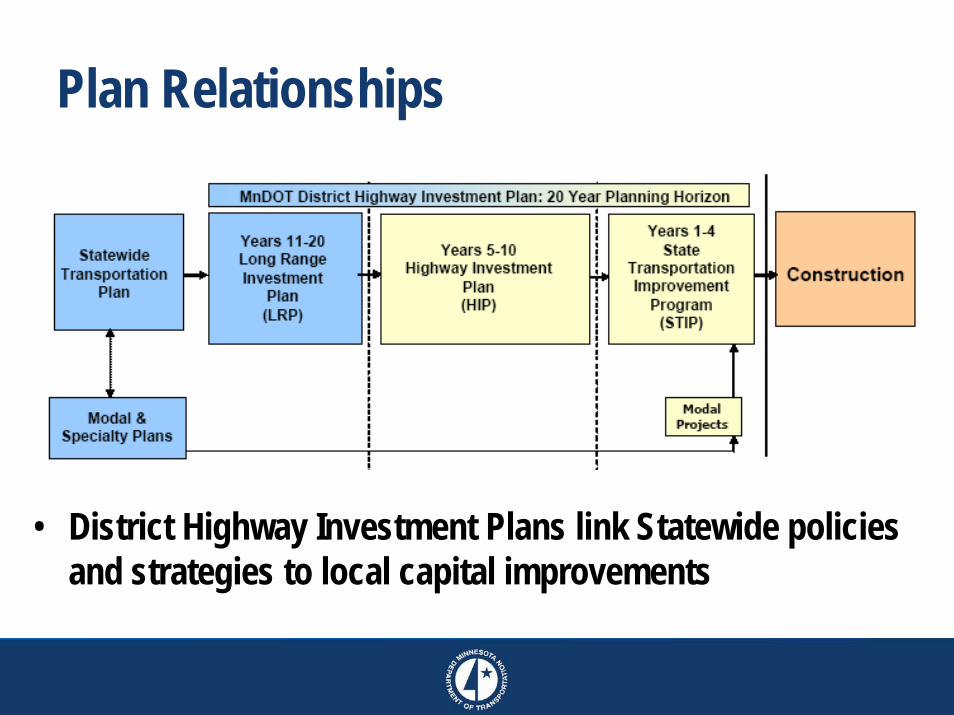
Plan Relationships
• District Highway Investment Plans link Statewide policies and strategies to local capital improvements
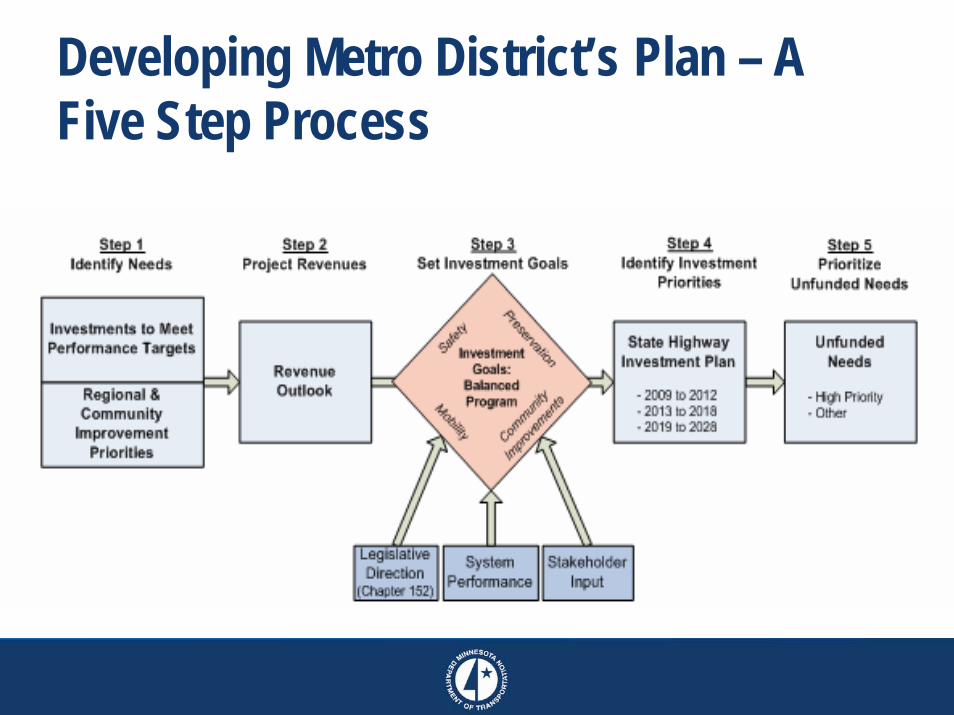
Developing Metro District’s Plan – A Five Step Process

Step 1 – Identify Needs
Improvements to Address Highway System Performance
Improvements to Address Regional or Community Improvement Priorities (RCIPs)

Investing to Meet Performance Targets• Four of 10 Major Policies in the Statewide
Transportation Plan Address System Performance That Can be Directly Affected by Capital Investments in Metro District’s Highway System
Safety Preservation Statewide Connections
Twin Cities Mobility
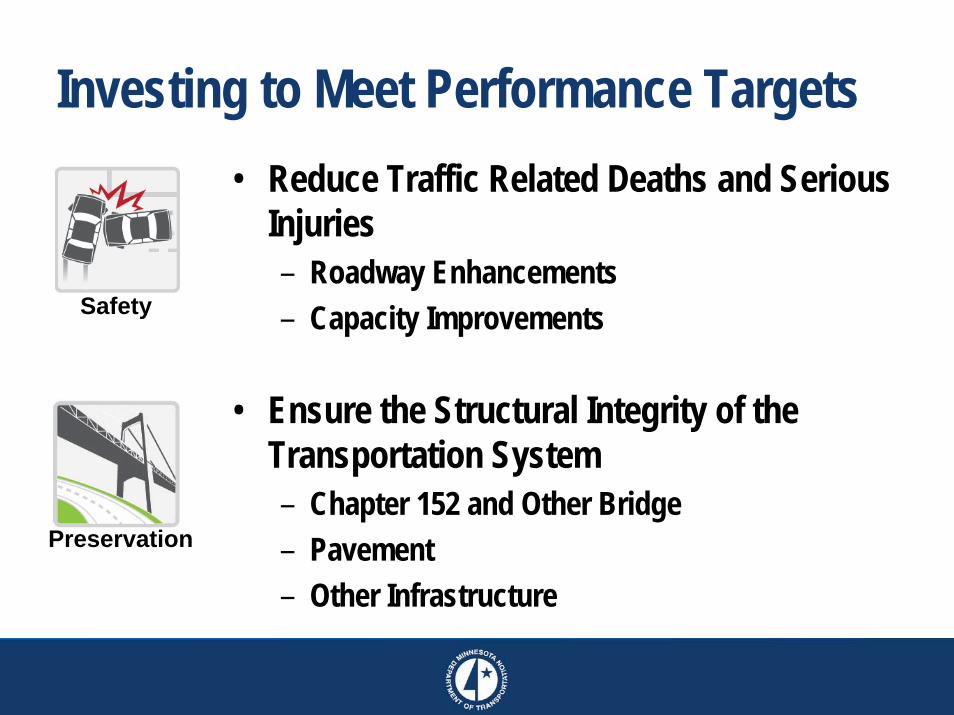
Investing to Meet Performance Targets • Reduce Traffic Related Deaths and Serious
Injuries– Roadway Enhancements– Capacity ImprovementsSafety
• Ensure the Structural Integrity of the Transportation System– Chapter 152 and Other Bridge– Pavement– Other Infrastructure
Preservation

Investing to Meet Performance Targets
• Enhance Mobility on Interregional Corridors linking Greater Minnesota Trade Centers That Are Performing Below Travel Speed Targets
• Mitigate Congestion Through Strategic Safety Capacity Improvements in Highway and Transit as well as Innovations Like Peak-Hour Demand Management
Statewide Connections
Twin Cities Mobility

Investments Needed to Meet Performance Targets• District Investments to Meet Performance Targets Over
the 20-year Period Approach an Estimated $50 Billion – $40 Billion for Mobility Needs*– $5 Billion for Preservation – Just Over $1 Billion for Safety– Plus Over $1 Billion in Regional or Community Improvement
Priorities
*Previous Plan Estimated Adjusted for Inflation. Forthcoming Metro Highway System Investment Strategy Will Revisit the Mobility Needs Number

Total Metro Needs(in millions, year of construction)Strategic Investment Priority 2009 to 2018
$ Need % of Need2019 to 2028
$ Need % of Need2009 to 2028
TOTAL $ % of Total
Traveler SafetyRoadwayCapacity
$920 4%180740
220 1%90
130
1,140 3%270870
Infrastructure PreservationChapter 152 BridgeOther BridgePavementOther Infrastructure
2,260 10%1,230350560120
2,390 11%-
1,0901,070
230
4,650 10%1,230 1,4401,630
350
MobilityInterregional CorridorsTwin Cities Metro Area
19,890 86%-
19,890
18,880 88%-
18,880
38,770 87%-
38,770
Total Investment $23,070M $21,490M $44,560M

Illustrative Regional and Community Improvement Priority Project Categories
Project Categories Annual (in millions)
Intersections $15 – 30
Interchange Needs or Geometric Conversion (assumes 50/50 Cost Sharing Policy)
$25 – 50
Cooperative Agreements $7 – 14
Noise Walls $3 – 6
Total $50 – 100

Looking Ahead – Metro’s Approach
• Conduct a “Metro Highway System Investment Strategy” with the Metropolitan Council – Inputs Include:– Principal Arterial Study– Congestion and Safety Management Planning Study,
Phases 1 and 2– Reassessment of Major Capacity Projects
Step 2 – Project Future Revenue

Future Revenue Projections
• Forecasts prepared in Spring of 2007• Bond Funding Authorized by the 2008
Legislative Session Chapter 152 Laws Included• Assumed No New Sources of Revenue or Rate
Increases in Existing State or Federal Revenue Sources
• Metro District’s Projected Revenue Over the 20 Year Planning Period Totals About $5.5 Billion

Step 3 – Set Goals
A Balanced Program of Investments

Program Objectives
• Reflect Chapter 152 Legislative Direction, System Performance Trends, and Stakeholder Input – Support Continued Development of Statewide
Economy and Community Livability– Optimize Allocation of Projected Revenues Among
Safety, Mobility, Infrastructure Preservation, and Regional Community Improvement Projects
– Invest in Efforts That Contribute to Meet Statewide System Performance Targets

Step 4 – Identify Investment Priorities

Metro District Investment Priorities
Maintain ExistingInfrastructure Improve Safety
Improve Mobility
SupportCommunity
Development

Metro District Investment Strategies –Infrastructure Preservation• Meet All Tier 1 and 2 Bridge and Approximately
85% of Other Bridge Preservation Needs• Meet Most Pavement Preservation Targets• Invest in ‘Other’ Infrastructure
– Signals– Lighting– Striping– Hydraulic Infrastructure I-35W Storm Sewer
Typical Infiltration Gusher

Metro District Investment Strategies -Safety• Focus on proactive and Reactive Strategies to
Help Achieve Mn/DOT’s “Toward Zero Deaths” Policy– Cable Medium Barrier– Geometric Intersection Changes– Turn Lanes Constructed as part of Pavement
Preservation Projects– Rumble Strips or Stripes at the Pavement Edge– Access Management

Metro District Investment Strategies -MobilityHighway Investment Plan with
Project Revenues– Maximize System Mobility with
Available Projected Funding– Optimize Use of Existing System– Make Strategic Capacity
Investments in Highways and Transit
– Use Lower-cost/High-benefit Congestion and Safety Mitigation Projects
Highway Investment Plan with Additional Funding
– Additional Lower-cost/High-benefit mobility projects
– Strategic Capacity Improvements (based on a reassessment of major expansion projects contained in past STIP and fiscally constrained TSP)

Past STIP/TSP Fiscally Constrained Projects STIP/TSP
Investments2007 Preliminary Cost
Estimate (rounded) TH 169/1-494 Interchange STIP $100I-35E from I-94 to I-694 (add lanes) TSP $350I-35E from TH 110 to TH 13 (add lanes) TSP $ 50I-35W from 46th St to I-94 (add lanes) TSP $400TH 100 from 36th St. to Cedar Lake Rd (add lanes) TSP $150I-494 from I094 to TH 55 (add lanes) TSP $250I-494 from E Bush Lake Rd to 34th Ave (add lanes) TSP $1000I694 from I-35W to W Jct of I-35E (unweave) TSP $300TH 36 from I-35W to I-35E (add lanes) TSP $150TH 610 from I-94 to TH 169 (complete freeway) STIP/TSP $200I-694 from E Jct of I-35E to TH 36 (add lanes) TSP $100TH 252 from I-94 to TH 610 (convert to freeway) TSP $150
TOTAL Preliminary Planning Cost Estimate $3+ Billion

Metro District Investment Plan Summary*Strategic Investment Priority
2009 to 2012STIP $ % of STIP
2013 to 2018HIP $ % of HIP
2019 to 2028STIP $ % of STIP
2009 to 2028TOTAL $ % of Total
Traveler Safety $150 10% $170 10% $180 7% $500 8%
Infrastructure Preservation
$840 54% $1,480 77% $1,970 79% $4,290 72%
Mobility $310 20% $270 14% $320 13% $900 15%
RCIPs $ 40 3% $20 1% $30 1% $90 2%
Right of Way, Consultants, and Supplemental Agreements
$220 14% ** ** $220 4%
Total Investments $1,560M $1,940M $2,500M $6,000M*For More Detail, See Metro District Highway Investment Plan 2009-2028; Figure 6
**Included under Strategic Investment Priority

Anticipated Projects for 2009 to 2018

Examples of Anticipated Metro District Projects
Anticipated Year of Construction
Traveler SafetyTH169 – Devils Triangle Interchange 2009TH 8 in Lindstrom 2012TH 36 at Hilton Trail in Mahtomedi 2012

Examples of Anticipated Metro District Projects
Anticipated Year of Construction
MobilityI-35W Corridor – UPA Projects 2009I-35W Crosstown Reconstruction 2009I-94 – TH 61 to White Bear Ave. (add EB auxiliary lane) 2013 – 2018 I-94 – at TH 101 (add WB auxiliary lane and improve interchange) 2013 – 2018
TH 10, Hanson Blvd. to Egret Blvd. 2009

Examples of Anticipated Metro District Projects
Anticipated Year of Construction
Infrastructure Preservation – Pavement TH 47, 40th to CSAH 10 2009I-35E, Jct 35E/35W to TH 8 2009TH 61, Roselawn Ave to White Bear Ave 2010
I-35W, New Brighton to Ramsey County Line 2011TH 96, TH 61 to TH 95 2011
I-494 – 10th St. in Oakdale to Lake Road in Woodbury (replace concrete pavement
2010
I-94 – Hennepin Cnty Line to I-494 (concrete pavement repair) 2010I-94 – Nicollet Ave to TH 280 in Minneapolis (bituminous mill and overlay) 2010

Examples of Anticipated Metro District Projects
Anticipated Year of Construction
Infrastructure Preservation – Pavement (continued)I-694 – 40th St N to 4th St N in Oakdale (unbonded concrete overlay) 2011I-35 – TH 95 to CSAH 7 (concrete overlay) 2013-2018I-35E – Lone Oak Rd to Ramsey Co. Line (overlay and CPR) 2013 – 2018 TH 3 – Anne Marie Trail to TH 110 (mill and overlay) 2013 – 2018 TH 47 – Central Ave to 27th Ave (resurfacing and rehabilitation) 2013 – 2018 TH 65 – Washington Ave to 53rd Ave N (mill and overlay) 2013 – 2018 TH 61 – 12th St to TH 96 (mill and overlay and infrastructure repair) 2013 – 2018TH 61 – TH 10 to CSAH 39 (unbonded overlay) 2013 – 2018

Examples of Anticipated Metro District Projects
Anticipated Year of Construction
Infrastructure Preservation – Bridge TH 280 – Larpenteur Ave Bridges in Lauderdale 2009TH 12 – Maple Plain Bridge 2010TH 61 – Bridge in White Bear Lake 2010I-694 – Replace Bridges in Oakdale 2010TH 61 – Bridge over Mississippi River in Hastings 2010TH 52 – Plato Blvd to I-94 (Lafayette Bridge) in St. Paul 2011TH5 – Recreational trail Bridge in Victoria 2013
I-35W – West 94th Street Bridge 2013
Examples of Anticipated Metro District Projects
Anticipated Year of Construction
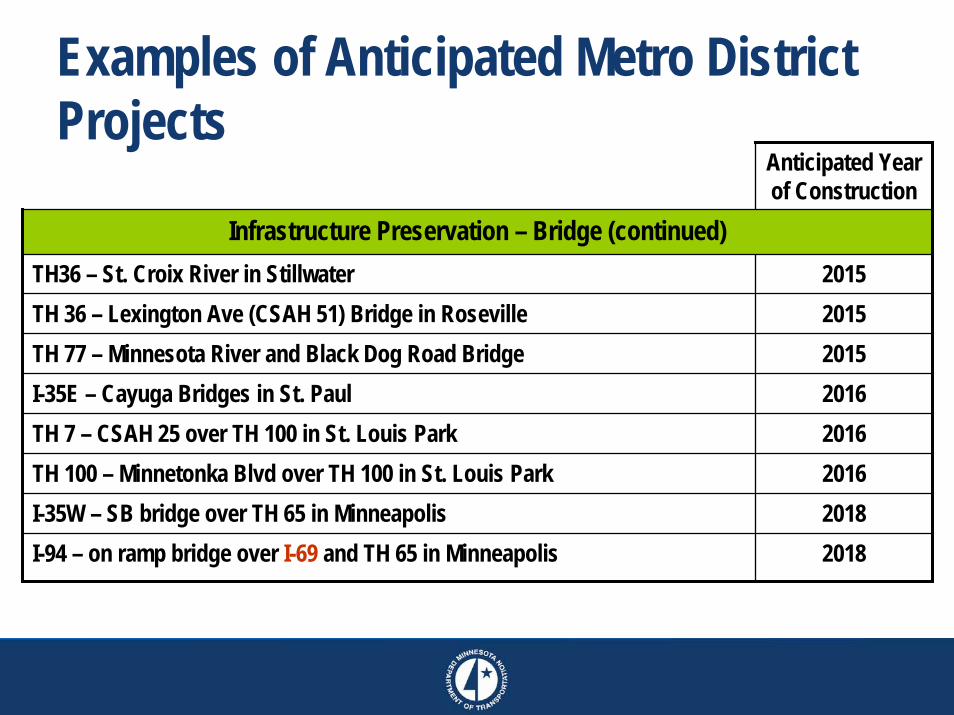
Infrastructure Preservation – Bridge (continued)TH36 – St. Croix River in Stillwater 2015TH 36 – Lexington Ave (CSAH 51) Bridge in Roseville 2015TH 77 – Minnesota River and Black Dog Road Bridge 2015I-35E – Cayuga Bridges in St. Paul 2016TH 7 – CSAH 25 over TH 100 in St. Louis Park 2016TH 100 – Minnetonka Blvd over TH 100 in St. Louis Park 2016I-35W – SB bridge over TH 65 in Minneapolis 2018I-94 – on ramp bridge over I-69 and TH 65 in Minneapolis 2018
Examples of Anticipated Metro District Projects
Anticipated Year of Construction
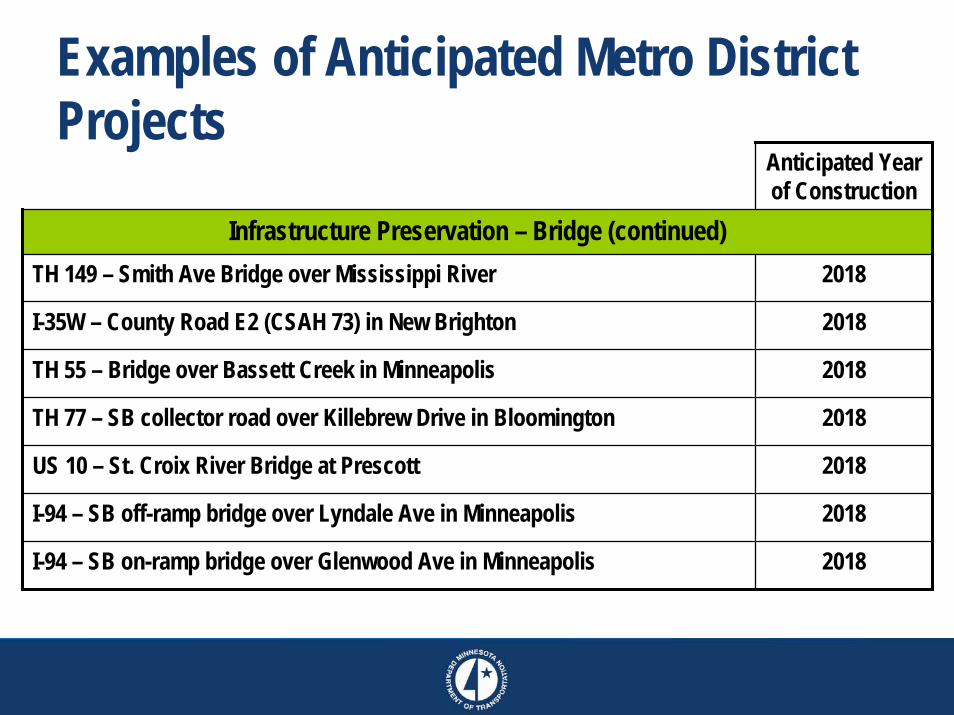
Infrastructure Preservation – Bridge (continued) TH 149 – Smith Ave Bridge over Mississippi River 2018
I-35W – County Road E2 (CSAH 73) in New Brighton 2018
TH 55 – Bridge over Bassett Creek in Minneapolis 2018
TH 77 – SB collector road over Killebrew Drive in Bloomington 2018
US 10 – St. Croix River Bridge at Prescott 2018
I-94 – SB off-ramp bridge over Lyndale Ave in Minneapolis 2018
I-94 – SB on-ramp bridge over Glenwood Ave in Minneapolis 2018

Examples of Anticipated Metro District Projects
Anticipated Year of Construction
Regional and Community PrioritiesCooperative Agreements and Noise Walls 2009 - 2018

Expected Outcomes for 2009 to 2018• Traveler Safety
– Make Progress on MnDOT’s “Toward Zero Deaths” Policy
• Infrastructure Preservation– All Tier 1 and 2 Bridges and About 85% of Other Bridge
Preservation Needs are Funded – Major Bridge Examples Include:
• TH 61 – Bridge over Mississippi in Hastings• TH 52 – Plato Boulevard to I-94 in St. Paul (Lafayette Bridge)• TH 36 – Bridge over St. Croix River in Stillwater• I-35E – Cayuga Bridges in St. Paul

Expected Outcomes for 2009 to 2018• Mobility
– Maximize System Mobility • Use Lower-cost/High-benefit Congestion and Safety Mitigation Projects• Make Strategic Investments in Highways and Transit
• IF Additional Revenue Becomes Available– Implement More Lower-cost/High-benefit and Strategic Capacity
Improvements– Reassess Major Expansion Projects Contained in Past STIP and
TSP Fiscally Constrained Plans to Find Lower-cost Alternatives

Expected Outcomes for 2009 to 2018
• Regional and Community Improvement Priorities– Add and Maintain Noise Walls– Cooperative Agreements– IF Additional Resources Become Available, Work with Local
Partners on Potential Investment Strategies for Interchanges
• Jurisdictional Transfers– Pursue Opportunities to Align Roadway Jurisdiction with the
Appropriate Functional Class

Unfunded Needs

Estimated Statewide and Metro District Needs • Statewide Investment Need Exceeds $65B Over
the Next 20 Years While Statewide Projected Investments are Projected at About $15 Billion– Metro District 2009 to 2028 Investment Need = $45B
(69% of statewide total)– Metro District 2009 to 2028 Investments = $6B
(40% of statewide total)– Metro District 2009 – 2028 Unfunded Investment
Needs = $39B (78% of the statewide total)

Prioritize Unfunded Needs
• Mn/DOT Has Identified 5% of Unfunded Needs as High Priority Investment Options Should Additional Revenue Become Available in the Next 10 years– $385M (15%) to Improve Traveler Safety– $1B (40%) to Improve Mobility on Interregional Corridors and
Congested Freeways– $970M (40%) to Preserve Infrastructure in Safe and Sound
Condition– $115M (5%) to Support Regional and Community
Improvement Priorities

MnDOT’s Unfunded Priorities – Safety • $385M (15%) to Improve Traveler Safety
– $210M for Roadway Safety Enhancements– $75M for Metro District Safety Capacity– $100M to Fund High Volume 2 to 4 Lane Capacity
Expansions

MnDOT’s Unfunded Priorities – Mobility
• $1B (40%) to Improve Mobility on Interregional Corridors and Congested Freeways– $100M for IRC Improvements to I-94 (Twin Cities to St.
Cloud– $430M to Alleviate Metro Congestion – Reconstruct I-
494/TH169 Interchange, Extend TH610 and Work Towards Completing a 3-lane I-494/I-694 Beltway
– $500M for Metro Congestion Management and Safety ($50M annually)
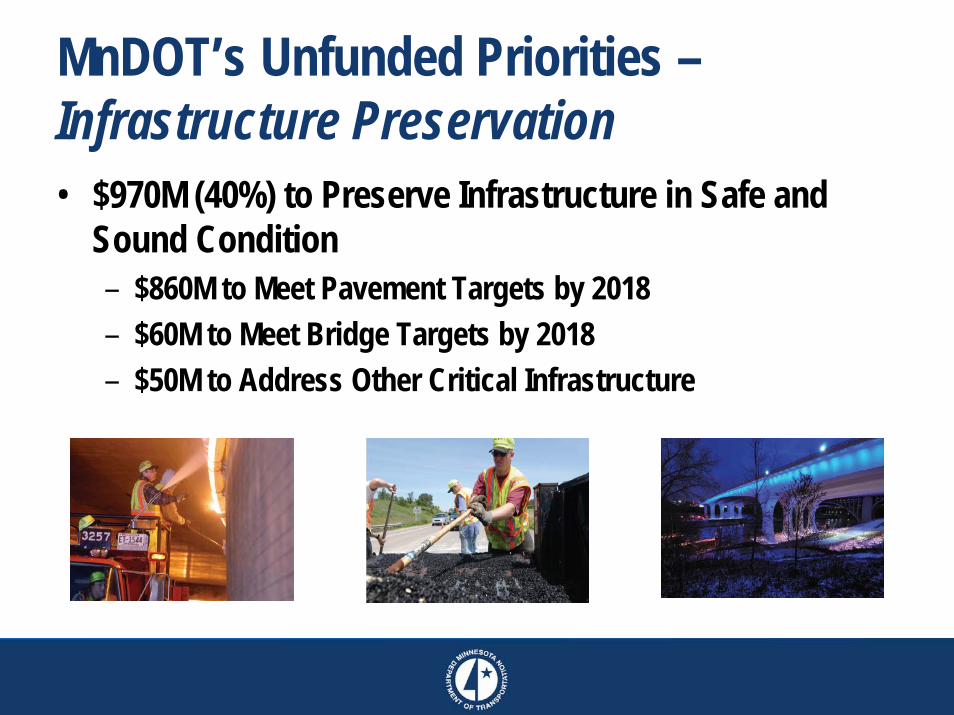
MnDOT’s Unfunded Priorities –Infrastructure Preservation• $970M (40%) to Preserve Infrastructure in Safe and
Sound Condition– $860M to Meet Pavement Targets by 2018– $60M to Meet Bridge Targets by 2018– $50M to Address Other Critical Infrastructure

MnDOT’s Unfunded Priorities – Regional Community Improvement Projects
• $115M (5%) to Support Regional and Community Improvement Priorities– $115M for Local Land
Access, Interchanges, Noise Walls and/or Cooperative Agreements

Economic Recovery Funding

MnDOT Economic Recovery Program • Will Reflect the Federal Economic Stimulus/Recovery Bill
and its Final Funding Levels/Criteria – 50/50 Allocation Between Metro District and Greater Minnesota – Project Identification Based on:
• Project Readiness• Statewide Coverage• Work Type Balance• Project Advancement - projects already funded in FY 2009 will not be
included• Job Creation - 27.8 per million based on FHWA formula

Candidate Metro District Highway Projects for Economic Recovery Funding*
State Highway
Project Description Total Project Cost Estimate
Estimated Jobs Created
5 Lake Elmo intersection improvement $3,240,000 83
100 Rebuild lighting system – TH 100 south of 394
$2,700,000 70
94 Rebuild cable median barrier $3,240,000 83
610 TH 169 to Fernbrook – construct new 4-lane freeway and interchanges
$86,000,000 2,224
35E Interchange modification to EB and WB I-494 ramps to SB I-35E
$1,296,000 33.4
212 Interchange modification to allow WB 494 to enter WB 212 as an add lane
$1,080,000 27.8
*Preliminary/Illustrative DRAFT – Subject to Change January, 2009

Candidate Metro District Highway Projects for Economic Recovery Funding* (continued)
State Highway
Project Description Total Project Cost Estimate
Estimated Jobs Created
35 Pavement preservation – North junction of 35E/35W to North of TH 8 – bituminous mill and overlay, includes CMSP auxiliary lane
$8,316,000 214.1
52 Pavement preservation – North of CSAH 42 to North Junction TH 55 (beginning of
Lafayette Freeway) – Bituminous overlay and minor CPR
$7,344,000 189
61 Pavement preservation – North of TH 10 to 12th Street in Newport – 7 inch unbonded
concrete overlay
$21,600,000 556
*Preliminary/Illustrative DRAFT – Subject to Change January, 2009

Candidate Metro District Highway Projects for Economic Recovery Funding* (continued)
State Highway
Project Description Total Project Cost Estimate
Estimated Jobs Created
35 I-35 at TH95 in North Branch – reconstruct interchange ($9M of additional funding
requested)
$10,200,000 250.2
7 Wooddale Interchange – City of St. Louis Park Sponsored ($9M of additional funding
requested)
$11,500,000 250.2
169 Reconstruct interchange at I-494 $134,000,000 3,475
TOTAL METRO DISTRICT $290,516,000 7,456
*Preliminary/Illustrative DRAFT – Subject to Change January, 2009

Metro District Long Range Highway Investment Plan
2009 – 2028
Your Destination: Our Priority
QUESTIONS? http://www.dot.state.mn.us/planning/stateplan/download.html
http://www.dot.state.mn.us/metro/programmanagement/tsp.html


