
Institut für Tierernährung
Bundesforschungsinstitut für Tiergesundheit
Friedrich-Loeffler-Institut
&
Institut für Agrar- und Ernährungswissenschaften
der Naturwissenschaftlichen Fakultät III
der
Martin-Luther-Universität Halle-Wittenberg
Methods for estimation and nutritional influencing of thermoregulation and heat
stress in dairy cows and sheep as well as impacts of changing climatic
conditions on the feed value of maize silage
Dissertation
zur Erlangung des akademischen Grades
doctor agriculturarum (Dr. agr.)
vorgelegt von
M.sc. agr. Malte Lohölter
geb. am 04.10.1982 in Frankfurt/M.
Gutachter:
Herr Prof. Dr. Dr. Sven Dänicke
Herr PD. Dr. Holger Kluth
Herr Prof. Dr. Markus Rodehutscord
Verteidigung am:
21.01.2013
Halle/Saale 2013


I
CONTENTS
INTRODUCTION 1
BACKGROUND 3
1 Climate change 3
1.1 Past observations 3
1.2 Driving forves and human impact 4
1.3 Future projections 5
2 Climate change: Agricultural implications 7
2.1 Increasing atmospheric CO2 concentration:
Effects on feed production and quality 7
2.1.1 “CO2 fertilization effect” and experimental facilities 7
2.1.1.1 C3 plants 8
2.1.1.2 C4 plants 12
2.1.2 Mycotoxin contamination 15
2.2 Drought: Plant responses and CO2-interactions 17
2.3 Heat stress in dairy cows 18
2.3.1 Emergence and impacts of heat stress 18
2.3.2 Heat stress alleviation 22
2.4 Applicability and restrictions of continuous ruminal pH
and temperature measurement 23
SCOPE OF THE THESIS 26
PAPER I 27
Effects of free air carbon dioxide enrichment and drought stress on the
feed value of maize silage fed to sheep at different thermal regimes
Archives of Animal Nutrition (2012) 66:335-346
II
PAPER II 44
Effects of the thermal environment on metabolism of deoxynivalenol
and thermoregulatory response of sheep fed on corn silage grown at
enriched atmospheric carbon dioxide and drought
Mycotoxin Research, accepted
PAPER III 63
Evaluation of a device for continuous measurement of rumen pH and
temperature considering localization of measurement and dietary
concentrate proportion
Livestock Science, submitted
PAPER IV 83
Effects of niacin supplementation and dietary concentrate proportion
on body temperature, ruminal pH and milk performance
of primiparous dairy cows
Archives of Animal Nutrition, submitted
GENERAL DISCUSSION 112
1 Feed value of maize silage 112
1.1 General aspects 112
1.2 Nutrients 112
1.3 Digestibility 114
1.4 DON in maize silage and its metabolization in the rumen 120
2 Heat stress and nutritional alleviation 122
2.1 Dissipation of body heat 122
2.2 Concentrate 123
2.3 Niacin 126
3 Continuous measurement of ruminal pH and temperature 129

III
CONCLUSIONS 132
SUMMARY 134
ZUSAMMENFASSUNG 137
REFERENCES 140
(cited in Introduction, Background and General Discussion)
IV
ABBREVIATIONS
Ash Crude ash
ADL Acid detergent lignin
ADF Acid detergent fibre
ADF D Acid detergent fibre digestibility
Aw Water activity
B Biomass
BPM Breaths per minute
CC Climatic conditions
CF Crude fibre
CF D Crude fibre digestibility
CI Confidence interval
CP Crude protein
DEE Digestible ether extract
DCF Digestible crude fibre
DIM Days in milk
DMI Dry matter intake
DOM Digestible organic matter
DON Deoxynivalenol
DM Dry matter
DS Drought stress
EE Ether extract
ELISA Enzyme-linked Immunosorbent Assay
Ery Erythrocytes
FACE Free air carbon dioxide enrichment
FCM Fat corrected milk
FLI Friedrich-Loeffler-Institute
GfE Society of Nutrition Physiology
GPR109A G protein-coupled receptor 109A
HPLC High performance liquid chromatography
I Irrigation
IAC Immunoaffinity columns
IPCC Intergovernmental Panel on Climate Change

V
ISFET Ion-selective field-effect transistor
IU International units
Y Yield
KLIFF Climate impact and adaptation research in Lower Saxony
LAVES Lower Saxony State Office for Consumer Protection and Food Safety
LC-ESI-MS Liquid chromatography-electrospray ionization tandem mass spectrometry
/MS
LSmeans Least square means
ME Metabolizable energy
MH Mild heat
N.d. Not determined
NDF Neutral detergent fibre
NDF D Neutral detergent fibre digestibility
NEL Net energy lactation
N.s. Not significant
OD Optical density
OM Organic matter
OM D Organic matter digestibility
OTA Ochratoxin A
PEP Phosphoenol pyruvate
PMR Partial mixed ration
ppb Parts per billion
ppm Parts per million
REML Restricted maximum likelihood method
Rectal temp/T Rectal temperature
RH Relative humidity
RPMI Roswell Park Memorial Institute
RR Respiration rate
RUBISCO Ribulose-1,5-biphosphate-carboxylase/-oxygenase
RUBP Ribulose 1,5-biphosphate
SARA Sub-acute ruminal acidosis
SCFA Short chain fatty acid
SD Standard deviation
SE Standard error

VI
SH Severe heat
Skin temp Skin temperature
Starch D Starch digestibility
Subcuta- Subcutaneous temperature
neous T/
Sub T
T Temperate
TD Dry bulb temperature
THI Temperature-humidity index
TMR Total mixed ration
UV Ultraviolet
VTI Johann Heinrich von Thünen-Institute
VDLUFA Verband Deutscher Landwirtschaftlicher Untersuchungs- und
Forschungsanstalten
WW Well watered
ZON Zearalenone

VII
TABLES
BACKGROUND
Table 1: Effects of atmospheric CO2 enrichment on yield and composition 14
of C4 plants by different authors
Table 2: Effects of heat stress on dry matter intake and milk performance 21
of dairy cows by different authors
PAPER I
Table 1: Climatic conditions during the balance experiment 31
(means ± standard error)
Table 2: Effects of increased atmospheric CO2 concentration and drought 35
stress on DM content (g/kg fresh matter) as well as crude
nutrient (g/kg DM) and mycotoxin concentration (μg/kg DM) of
experimental maize silages (n=3; means ± standard error)
Table 3: Effects of increased atmospheric CO2 concentration and drought 36
stress during maize cultivation and climatic conditions during
balance studies on apparent nutrient digestibility (% DM) and
metabolizable energy (MJ/kg DM) of maize silages
(LSmeans ± standard error)
PAPER II
Table 1: Climatic conditions during the feeding experiments 48
(Means ± standard error)
Table 2: Crude nutrient content (g/kg DM) and metabolizable energy 49
(MJ/ kg DM) of experimental corn silages
(Means ± standard error)
Table 3: Effects of the climatic conditions during feeding experiments 52
as well as increased atmospheric CO2 concentration and drought
stress during corn growth on rectal and skin temperature, respiration
rate and daily water usage of sheep (LSmeans ± standard error)
VIII
Table 4: Effects of the climatic conditions during feeding experiments 53
as well as increased atmospheric CO2 concentration and drought
stress during corn growth on differential blood count of sheep
(LSMeans ± standard error)
Table 5: DON and de-epoxy-DON concentrations in plasma of sheep 54
and metabolization rate as affected by the climatic conditions during
feeding experiments (LSmeans ± standard error. Values were pooled
for treatments during growth of ensiled corn fed)
PAPER III
Table 1: Chemical composition (g/ kg DM) and energy content 67
(MJ/ kg DM) of experimental diets
Table 2: Correlation coefficients of rumen pH and rumen temperature 70
among methods and localizations of measurement
PAPER IV
Table 1: Components and chemical composition of concentrates and 87
partial mixed ration (Means ± SD)
Table 2: Effects of dietary concentrate proportion (%) and niacin 93
supplementation on rumen pH and rumen temperature of
dairy cows (LSmeans±SE)
Table 3: Effects of dietary concentrate proportion (%) and niacin 96
supplementation on skin, rectal and subcutaneous temperatures as
well as respiration rates of dairy cows at THI≥68 (LSmeans±SE)
Table 4: Correlation coefficients between THI and body temperature measures 97
(°C) as well as respiration rates of dairy cows

IX
Table 5: Effects of dietary concentrate proportion (%) and niacin 98
supplementation on milk performance of dairy cows (LSMeans±SE)
GENERAL DISCUSSION
Table 3: Effects of atmospheric CO2 enrichment on the digestibility of 116
various plants by different authors

X
FIGURES
BACKGROUND
Figure 1: Estimates of Arctic air temperatures over the last 2000 years based 3
on proxy records from lake sediments, ice cores and tree rings.
The best-fit line shows the long-term cooling trend for the period
ending 1900. Adapted from Allison et al. (2009)
Figure 2: Projections of mean global surface warming relative to the period 7
1980 to 1999 for three different greenhouse gas emission scenarios
(Surface air temperature, °C; Adapted from IPCC, 2007)
Figure 3: Stylized response of C3 and C4 plant photosynthesis to atmospheric 8
CO2 concentrations (Redrawn from Kimball et al., 1983). Dotted
line approximates CO2 concentration in 2012
Figure 4: The Calvin cycle (Redrawn from Newman et al., 2011) 9
Figure 5: Schematic relationship of the animal`s core body temperature, 20
heat production and environmental temperature
(Redrawn from Kadzere et al., 2002).
LCT, lower critical temperature; UCT, upper critical temperature
PAPER II
Figure 1: Relationship between deoxynivalenol (DON) intake and DON 54
(y= 0.1321 + 0.0164x, r2= 0.09, p= 0.04) or de-epoxy-DON
(y= -0.1139 + 0.4621x, r2= 0.69, p< 0.01) concentration in plasma
of sheep. Treatments during growth of the ensiled corn fed were
highlighted (FACE/ well watered: ○, ●; FACE/ drought stress: Δ, ▲;
Control/ Well watered: ◊, ♦; Control/ Drought stress: □, ■;
Open symbols represent DON, closed symbols represent
de-epoxy-DON)

XI
PAPER III
Figure 1: Relationship between manual and bolus pH measurement. 71
y = 0.3938x + 3.9011, r2 = 0.3436, N = 315
Figure 2: Differences of bolus and manual rumen pH measurement versus their 72
mean. N = 315. Bias: 0.07, 95 % confidence interval: 0.03 to 0.11.
Dotted lines show limits of agreement. A best fit line has been added
to show change in bias with pH
Figure 3: Rumen pH depending on time after feeding (min) and diet 73
(diet 1: ●, diet 2: ■). Ventral and dorsal pH values were pooled and
presented as means ± standard error
Figure 4: Rumen temperature depending on time after feeding (min) and diet 74
(diet 1: ●, diet 2: ■). Ventral and dorsal pH values were pooled and
presented as means ± standard error
PAPER IV
Figure 1: Temperature humidity index (THI, Solid line) and ambient temperature 92
(Dotted line) at the days of body temperature measurement
Figure 2: Diet effects on diurnal variation in ruminal pH of dairy cows 94
(● group 1, ○ group 2, ▲ group 3, ∆ group 4. Values are
presented as means per hour)
Figure 3: Example of one-day variation in ruminal pH and temperature of two 95
dairy cows at warm environmental conditions (Temperature humidity
index = 73). The presented animals were the individuals with the
highest (PH: Dotted lines; Temperature: Empty symbols ○) and the
lowest mean pH (PH: Solid lines; Temperature: Closed symbols ●)
of all animals throughout the experiment
GENERAL DISCUSSION
Figure 6: Example of one-day variation in ruminal pH and temperature of 119

XII
two dairy cows at warm (a, THI=73) and thermo-neutral (b, THI=64)
conditions (Based on data published in Paper IV. Frequency of
measurements: 5 min). The animals were chosen on the basis of mean
overall pH and the presented individuals were the cows with the highest
(Cow 711. Dotted lines: pH, filled symbols: temperature) and lowest
mean pH (Cow 716. Solid lines: pH, empty symbols: temperature)
of all investigated animals during the experiment. Arrows indicate the
onset of drinking events with an intake of ≥ 5 kg water
Figure 7: Interaction of atmospheric CO2 concentration and irrigation during 121
plant growth on the concentration of DON in whole plant maize
silages (Means ± SE)
Figure 8: Effects of the thermal environment on rectal temperatures 123
(°C; ▬; ●), skin temperatures (°C; – – –; ■) and respiration rates
(Breaths per minute; •••;▲) of sheep (Based on data published
in Paper II. Means ± SE): Values were pooled for CO2 and
irrigation treatments during growth of ensiled maize fed
Figure 9: Effects of dietary concentrate proportion on individual diurnal 126
variation in ruminal pH of primiparous dairy cows (Based on data
published in Paper IV. Values are presented as means per hour.
●, solid line, 30 % concentrate, 70 % roughage composed of 60 %
maize silage and 40 % grass silage; ▲, dotted line, 60 %
concentrate, 40 % roughage composed of 60 % maize silage
and 40 % grass silage)
Figure 10: Effects of dietary concentrate proportion (30 % vs. 60 %, referring 128
To DM) and niacin supplementation (N, niacin; C, control) on the
concentration of nicotinamide in serum of primiparous dairy cows
(Unpublished data based on Paper IV. Means ± SE). Nicotinamide
in serum was determined via HPLC as described by Niehoff et al.
(2009b). Statistical evaluation was performed according to model 3
as described in Paper IV exclusive the covariates
Introduction
1
Introduction
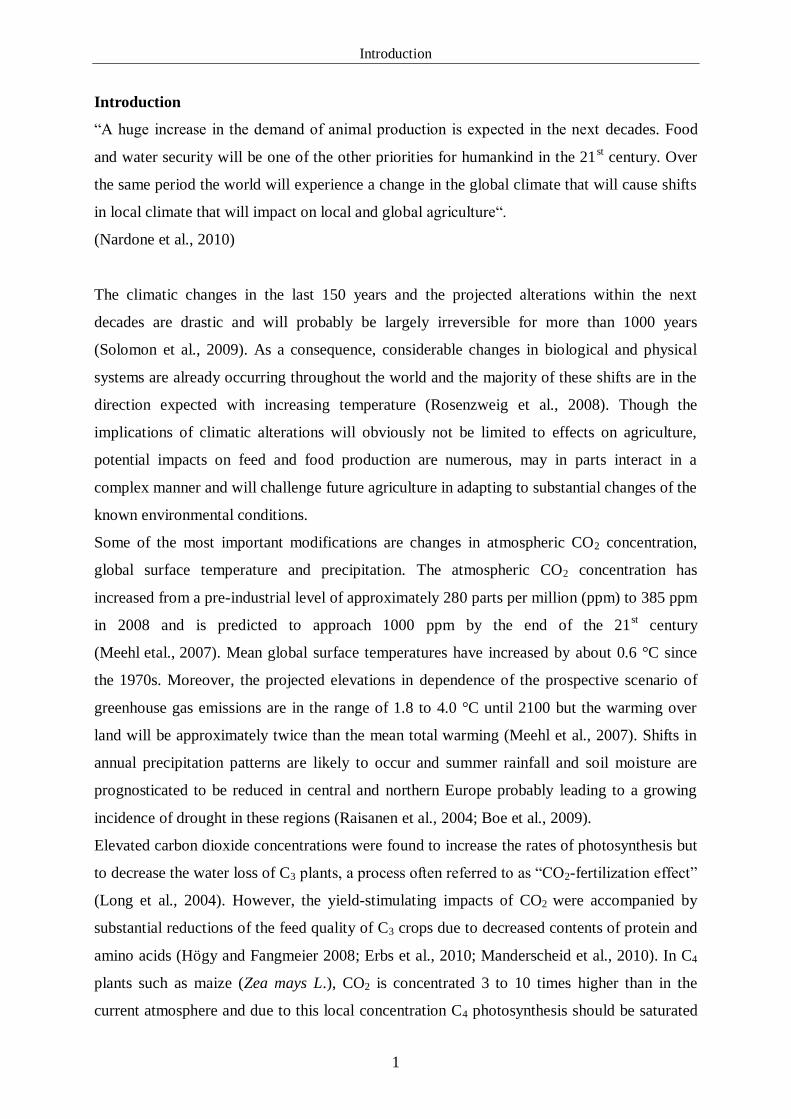
“A huge increase in the demand of animal production is expected in the next decades. Food
and water security will be one of the other priorities for humankind in the 21st century. Over
the same period the world will experience a change in the global climate that will cause shifts
in local climate that will impact on local and global agriculture“.
(Nardone et al., 2010)
The climatic changes in the last 150 years and the projected alterations within the next
decades are drastic and will probably be largely irreversible for more than 1000 years
(Solomon et al., 2009). As a consequence, considerable changes in biological and physical
systems are already occurring throughout the world and the majority of these shifts are in the
direction expected with increasing temperature (Rosenzweig et al., 2008). Though the
implications of climatic alterations will obviously not be limited to effects on agriculture,
potential impacts on feed and food production are numerous, may in parts interact in a
complex manner and will challenge future agriculture in adapting to substantial changes of the
known environmental conditions.
Some of the most important modifications are changes in atmospheric CO2 concentration,
global surface temperature and precipitation. The atmospheric CO2 concentration has
increased from a pre-industrial level of approximately 280 parts per million (ppm) to 385 ppm
in 2008 and is predicted to approach 1000 ppm by the end of the 21st century
(Meehl etal., 2007). Mean global surface temperatures have increased by about 0.6 °C since
the 1970s. Moreover, the projected elevations in dependence of the prospective scenario of
greenhouse gas emissions are in the range of 1.8 to 4.0 °C until 2100 but the warming over
land will be approximately twice than the mean total warming (Meehl et al., 2007). Shifts in
annual precipitation patterns are likely to occur and summer rainfall and soil moisture are
prognosticated to be reduced in central and northern Europe probably leading to a growing
incidence of drought in these regions (Raisanen et al., 2004; Boe et al., 2009).
Elevated carbon dioxide concentrations were found to increase the rates of photosynthesis but
to decrease the water loss of C3 plants, a process often referred to as “CO2-fertilization effect”
(Long et al., 2004). However, the yield-stimulating impacts of CO2 were accompanied by
substantial reductions of the feed quality of C3 crops due to decreased contents of protein and
amino acids (Högy and Fangmeier 2008; Erbs et al., 2010; Manderscheid et al., 2010). In C4
plants such as maize (Zea mays L.), CO2 is concentrated 3 to 10 times higher than in the
current atmosphere and due to this local concentration C4 photosynthesis should be saturated

Introduction
2
at present atmospheric CO2 (Ghannoum et al., 2000). However, uncertainty exists about the
actual responses of the feed value of ensiled maize, which is used prevalently as a major
component of ruminant diets, to increased carbon dioxide. For example, rising concentrations
of CO2 were observed to decrease the stomatal conductance of maize plants (Leakey et al.,
2006) and may thus reduce the adverse effects of increasing future drought on maize growth
and composition (Zinselmeier et al., 1999; Monneveux et al., 2006). Furthermore, both CO2
concentration and water activity (aw) can affect the growth of fungi such as Fusarium moulds
that may produce toxic secondary metabolites, mycotoxins, like deoxynivalenol (DON) and
zearalenone (ZON) which diminish the quality of contaminated feedstuff (Kokkonen et al.,
2010; Magan et al., 2011). It is unknown, whether modified growth conditions of maize and
increased ambient temperatures during feeding of the generated silages will have interactive
effects on blood and immunological parameters of ruminants or the metabolization of DON in
the rumen.
Heat stress is known to impair health and productivity of dairy cows (Kadzere et al., 2002).
Elevated future ambient temperatures will probably increase both incidence and severity of
heat and therefore effective countermeasures are necessary to alleviate its adverse effects.
Increasing the proportion of concentrate at the expense of roughage can reduce the dietary
heat increment and thus contribute to heat stress relief in ruminants (West, 1999). In dairy
cows, the dietary supplementation of niacin was tested as niacin is known to have
vasodilatative effects and could thus elevate the dissipation of body heat by a rising skin
blood flow (DiCostanzo et al., 1997; Zimbelman et al., 2010). However, experimental results
were inconsistent and more information is needed to assess the potential of niacin to alleviate
the negative impacts of heat.
In ruminants, the applicability of high concentrate diets is generally restricted as they induce
decreases in ruminal pH and may lead to sub-acute ruminal acidosis (SARA), a digestive
disorder that was shown to affect cow health and performance in a negative fashion
(Enemark, 2008). In the last years, several wireless probes were tested which serve to measure
ruminal pH and temperature continuously. Such devices may contribute to the diagnosis of
SARA and improve the current understanding of heat stress implications. However, the
validity of the obtained results may be reduced by low pH sensor accuracy, pH sensor drift or
pH gradients within the reticulorumen (Enemark et al., 2003; AlZahal et al., 2008; Kaur et
al., 2010).

Background
3
Background
1 Climate change
1.1 Past observations
The term “climate change” refers to alterations in the mean climate or its variability that last
for extended periods and has to be differentiated from internal climatic variation that is
typically present at all times (Hegerl et al., 2007).
Current climatic warming is evident basing on observations of elevations in mean air and
ocean temperatures, prevalent melting of ice and snow and rising average sea levels and is
contrary to the previous trend of global cooling during the last 2000 years (Figure 1). Global
surface temperatures maintain a strong trend towards continuous warming and they have risen
by approximately 0.6 °C since the 1970s. The total temperature increases in 2001-2005
compared to 1850-1899 were approximately 0.76 °C (IPCC, 2007). Moreover, the trend of
linear warming during the last 50 years is almost twice than for the last 100 years and the 25
years trend for the period ending 2008 was an ongoing warming of approximately 0.2 °C per
decade. This process is reflected in mean annual temperatures as, for example, every year
between 2001 and 2008 has been among the 10 warmest years since the beginning of
instrumental recording despite a decrease of solar forcing (Allison et al., 2009).
Figure 1: Estimates of Arctic air temperatures over the last 2000 years based on proxy records from lake
sediments, ice cores and tree rings. The best-fit line shows the long-term cooling trend for the period ending
1900. Adapted from Allison et al. (2009)

Background
4
Substantial climatic alterations are not a new phenomenon because the system of the earth
was subjected to different large-scale climate changes throughout the history. For example,
the Mid-Pliocene (About 3.3 to 3 million years ago) was the most recent period with
considerably warmer temperatures than nowadays in the range of 2 to 3 °C (Sloan et al., 1996;
Haywood et al., 2000). Current climatic reconstructions for the so-called last glacial
maximum, between 26500 and 19000 years ago, are of relatively high quality and simulations
demonstrated a colder and dryer climate with a global cooling of about 3.5 to 5.2 °C
(Hegerl et al., 2007). Alterations in the concentrations of so-called greenhouse gases, gases
that absorb and emit radiation within the thermal infrared range, accounted for approximately
50 % of the simulated cooling in the tropics during this period (Shin et al., 2003). Various
climatic changes in the past were initiated by different factors long before human impacts
might have been substantial, a fact that does not necessarily imply that the current
modifications are natural. Hegerl et al. (2007) suggested three pivotal factors that may have
played a role in the modifications of the global climate: (1) Changed amounts of the incoming
solar radiation (Alterations associated to the sun itself or changes in the orbit of the earth, so-
called Milankovitch cycles). (2) Changes in the reflected solar radiation (Changes in cloud
cover, land cover or aerosols, for example). (3) Changes in the long-wave energy that is
radiated back to space (By alterations in concentrations of greenhouse gases).
1.2 Driving forces and human impact
Are the current changes and the climatic alterations observed in the past decades of
anthropogenic origin or induced by natural processes?
Though not all aspects of the present climate change are unusual, there is a high probability of
an enormous anthropogenic contribution. Hegerl et al. (2007) suggested that it is extremely
unlikely (<5 %) that the global warming during the last 50 years can be explained without the
impact of external forces such as impacts related to human acting. Furthermore, it is very
unlikely that natural forces alone may be responsible for the fast changes in a period where
natural processes should otherwise have generated a cooling effect. The atmospheric
concentrations of different greenhouse gases such as carbon dioxide (CO2), methane (CH4),
nitrous oxide (N2O), halocarbons and sulphur hexafluoride (SF6) have mainly increased
dramatically within the last 250 years and it is very likely that they are responsible for the
main part of global surface warming during the last decades (Hegerl et al., 2007). The
increases in the concentration of atmospheric CO2 are primarily due to the human use of fossil
fuel and, to a smaller extent, to changes in land use. Agriculture is likely to be the main cause

Background
5
of methane and nitrous oxide emissions (IPCC, 2007). Attribution analysis has revealed that
the warming induced by greenhouse gases alone actually would have been greater than the
increases observed in the past 50 years if opposing cooling effects of, for example, aerosols
would not have reduced the rises in global surface temperature (Stott et al., 2006).
CO2 is the most important anthropogenic greenhouse gas. Its concentration is now known
from Antarctic ice cores for the last 650000 years and the present concentration represents the
highest value at any time in that period and possibly the last 3 to 20 million years (Raymo et
al., 1996; Luthi et al., 2008; Tripati et al., 2009). It has increased rapidly from a pre-industrial
level of about 280 ppm by approximately 100 ppm or 36 % to 379 ppm in 2005
(Forster et al., 2007). Furthermore, atmospheric methane has risen from varying levels during
the last 650000 years approximating 400 parts per billion (ppb) during glacial periods to 700
ppb during interglacials (Spahni et al., 2005) to the highest values throughout the complete
period approximating 1770 ppb in 2005 (Forster et al., 2007). In the meantime, the annual
growth rate of CH4 has decreased from about 1 % at the late 1970s
(Blake and Rowland, 1988) to almost zero at the end of the 1990s (Dlugokencky et al., 1998).
Basing on ice core data from Antarctica, the atmospheric N2O concentration was relatively
stable until the year 1800 and was then subjected to fast elevations, though the increases were
almost linearly during the last decades (Approximately 0.26 % per year) and the total rises
since 1750 (270 ppb) cumulated to a concentration of 319 ppb in 2005 (Forster et al., 2007).
1.3 Future projections
Projections of future climate involve various models which consider a variety of possible
emission scenarios of greenhouse gases as well as other atmospheric constituents and relevant
factors. The concentration of CO2 is likely to increase to 730 - 1020 ppm until 2100
(Meehl et al., 2007). An atmospheric CO2 concentration of more than 1000 ppm by the end of
the century would represent a 300 % elevation of the central greenhouse gas since 1750.
Carbon dioxide is known to have a very long lifetime in the atmosphere and its concentration
will be to a large extent irreversible for 1000 years after emissions stop
(Solomon et al., 2009). Therefore, the current greenhouse gas output defines the climate many
future generations have to face and CO2 emissions similar to the known reserves of fossil fuel
would take more than 2000 years to be absorbed from the atmosphere (Eby et al., 2009).
Within the twenty-first century, the mean global surface temperature is predicted to increase
in the range of 1.8 to 4.0 °C and the temperature at which the warming will stop depends on
the total amount of greenhouse gas emissions since the beginning of industrialization and the

Background
6
overall burning of fossil fuel (Meinshausen et al., 2009; Allen et al., 2009). The warming is
likely to show explicit spatial differences (Figure 2) because the increases in average surface
temperatures will be highest over land and at high northern latitudes. The warming over land
will be approximately twice than the mean warming of surface temperatures
(Meehl et al., 2007), a forecast that drastically illustrates the fundamental future alterations. In
the same report it was stated that an increased incidence of extreme events of surface
temperatures and precipitation is likely as, for example, heat waves are expected to occur
more frequently, to last longer and to be more intensive. Though the total future global
precipitation is projected to rise, considerable regional differences are likely to occur.
Different areas such as the Mediterranean region that are already frequently affected by
drought will face considerable reductions in precipitation of about 20 %
(Rowell and Jones, 2006).
In Europe, the observed increases in mean surface temperatures were higher than the global
mean and amounted 0.91 °C from 1901 to 2005 (Jones and Moberg, 2003). Future Europe
undergoes a trend of warming in the range of 1 to 5.5 °C in all seasons until the end of the
century and beyond (Alcamo et al., 2007). The European temperature change is characterized
by substantial spatial distinctions. For northern Europe climatic modeling revealed larger
warming in winter than in summer but the reverse for central and southern Europe
(Christensen and Christensen, 2007). For example, southern Europe including parts of France
and Spain will be affected by incisive increases in summer temperatures that partially exceed
6 °C (Kjellstrom, 2004; Good et al., 2006). In general, average annual precipitation is likely to
rise in northern but to decrease in southern Europe with a high seasonal and regional
variability (Alcamo et al., 2007). Winter precipitation is projected to be elevated in both
northern and central Europe (Raisanen et al., 2004). However, summer rainfall and soil
moisture will likely be substantially reduced in central and northern Europe which includes
major parts of Germany (Raisanen et al., 2004; Boe et al., 2009; Rowell, 2009).

Background
7
Figure 2: Projections of mean global surface warming relative to the period 1980 to 1999 for three different
greenhouse gas emission scenarios (Surface air temperature, °C; Adapted from IPCC, 2007)
2 Climate change: Agricultural implications
2.1 Increasing atmospheric CO2 concentration: Effects on feed production and quality
2.1.1 “CO2 fertilization effect” and experimental facilities
Rising atmospheric CO2 concentrations are not only related to changes in global surface
temperatures but were reported to cause substantial but not necessarily beneficial effects on
yield and quality of various important plants that are used for feed and food production
purposes. C3 and C4 plants differ in the primary uptake and fixation of CO2 and hence the
responses of both plant types to elevated carbon dioxide are highly different as shown in
Figure 3. These unequal reactions are likely to generate very complex future alterations in the
production of feed and food of plant origin and it is difficult to prognosticate whether in total
these effects will be rather positive or adverse.

Background
8
Figure 3: Stylized response of C3 and C4 plant photosynthesis to atmospheric CO2 concentrations (Redrawn from
Kimball et al., 1983). Dotted line approximates the atmospheric CO2 concentration in 2012
Elevated atmospheric CO2 is known to increase rates of photosynthesis, improve water-use
efficiency and decrease stomatal conductance and transpiration at least of C3 plants if all other
conditions remain equal. These observations are often referred to as the “CO2-fertilization
effect” and almost all other effects of rising atmospheric carbon dioxide on plants are derived
from the two fundamental responses, increased photosynthesis and reduced stomatal
conductance (Long et al., 2004). Already today this photosynthetic stimulation is used in
many commercial greenhouses which are often enriched to contain CO2 concentrations of
about twice the current atmospheric content and several greenhouse operators are known to
elevate carbon dioxide to 1000 ppm or more (Newman et al., 2011). Early researchers
investigating the effects of varying atmospheric carbon dioxide concentrations often used
controlled environments in open-top chambers or enclosures but such growth conditions can
produce a “chamber-effect” that may lead to an overestimation of the actual influence of high
CO2 atmospheres (Ainsworth and Long, 2005). In contrast, modern free air carbon dioxide
enrichment (FACE) technology enables the exposure of plants to enriched CO2 under natural
and full open-air field conditions. In most FACE experiments vertical or horizontal pipes are
used to release pure carbon dioxide or air enriched with CO2 to the periphery of vegetation
plots to meet the target concentrations.
0 100 200 300 400 500 600 700 800 900 1000
CO2 (ppm)
0
10
20
30
40
50
60
Net
ph
oto
syn
thes
is (
µm
ol/
m2/s
)
C4
C3
0 100 200 300 400 500 600 700 800 900 1000
CO2 (ppm)
0
10
20
30
40
50
60
Net
ph
oto
syn
thes
is (
µm
ol/
m2/s
)
C4
C3

Background
9
2.1.1.1 C3 plants
C3-plants comprise approximately 95 % of all known plant species and intensive recent
research evaluated the responses of various C3 species to elevated carbon dioxide. In C3
plants, the Calvin cycle serves to assimilate CO2 directly (Figure 4). The uptake of CO2 is
catalysed by Ribulose-1,5-biphosphate-carboxylase/-oxygenase (Rubisco). Two possible
reactions are catalysed by Rubisco, either the carboxylation of the acceptor molecule ribulose
1,5-biphosphate (RuBP) or a process called photorespiration which includes the oxygenation
of RuBP and only the carboxylated molecules can be transformed into carbohydrates
(Newman et al., 2011). The CO2-fertilization effect is induced by an elevation of the
carboxylation rate of Rubisco and a competitive inhibition of the oxygenation of Ribulose-
1,5-biphosphate (Drake et al., 1997). However, the underlying mechanism which is
responsible for the decreases in stomatal conductance due to variations in leaf stomatal
aperture is still unclear (Long et al., 2004).
Figure 4: The Calvin cycle (Redrawn from Newman et al., 2011)
3 molecules of
CO2
Catalysed by Rubisco
3 molecules of
Ribulose 1,5-biphosphate (RuBP)
6 molecules of
3-Phosphoglycerate (3PG)
6 molecules of
1,3-Diphosphoglycerate
6 ATP
Donates phosphate group
6 ADP
6 molecules of
Glyceraldehyde 3-phosphate (G3P)
1 molecule of
G3P
Glucose
5 molecules of
G3P
3 molecules of
Ribulose 5-biphosphate (RuBP)
3 ATP
3 ADP
3 molecules of
CO2
Catalysed by Rubisco
3 molecules of
Ribulose 1,5-biphosphate (RuBP)
6 molecules of
3-Phosphoglycerate (3PG)
6 molecules of
1,3-Diphosphoglycerate
6 ATP
Donates phosphate group
6 ADP
6 molecules of
Glyceraldehyde 3-phosphate (G3P)
1 molecule of
G3P
Glucose
5 molecules of
G3P
3 molecules of
Ribulose 5-biphosphate (RuBP)
3 ATP
3 ADP

Background
10
All other things being equal, the exposure to atmospheres containing 550 ppm CO2
considerably elevated the yields of important agricultural C3 plants such as wheat
(Triticum aestivum L.), rice (Oryza sativa L.), barley (Hordeum vulgare L.) or sugar beet
(Beta vulgaris L.) (Weigel et al., 1994; Wu et al., 2004; Yang et al., 2007; Erbs et al., 2010;
Manderscheid et al., 2010). This concentration of carbon dioxide will likely be exceeded in
the atmosphere by the middle of the twenty-first century and is predominantly used in current
FACE experiments. The induced increases in yields of most C3 crops were found to be in the
range of 10-20 % (Long et al., 2004; Gifford, 2004). However, such yield-stimulating effects
were not limited to crops because the above-ground biomass of trees was found to be
enhanced by up to 30 %, though the positive responses to carbon dioxide elevation were
primarily observed for young trees and the effects on mature natural forests were low or
negligible (Nowak et al., 2004; Korner et al., 2005). Moreover, the effects of CO2 elevation on
pasture were in principle consistent with the general vegetative responses and pasture above-
ground biomass was stimulated by approximately 10 % (Ainsworth and Long, 2005;
Izaurralde et al., 2011). For example, Milchunas et al. (2005) investigated the effects of
increased atmospheric CO2 on yield and forage quality of a shortgras steppe where grazing by
livestock is the dominant land use. The authors demonstrated that the yields of different plant
constituents which are relevant for the nutritive value of ruminant feed such as cellulose and
lignin partially increased by carbon dioxide enrichment. However, the effects strongly
depended on the respective plant species and both crude protein concentration and
digestibility were influenced in a negative fashion. However, experimental results are in parts
inconsistent as Hanson et al. (1993) used different model approaches to simulate the
responses of rangeland livestock production to climate change and concluded that doubling
atmospheric carbon dioxide alone would not significantly elevate pasture plant production.
The interpretation of experimental results should imperatively consider the observation that
long-term exposure of C3 plants to elevated CO2 may be associated with a reduction in the
increases of yields, a response often termed down-regulation or acclimation (Ghannoum et al.,
2000). Moreover, rising atmospheric carbon dioxide decreases the stomatal conductance, a
fact that may mediate indirect positive effects on yields of C3 plants via enhanced water use
efficiency and an amelioration of drought stress (Leakey et al., 2006). This process was
confirmed in a variety of experiments (Eamus, 1991; Morison, 1998; Wu et al., 2002) and
contributes to stimulations of crop yields in particular during periods of restricted plant water
availability.

Background
11
Increased future yields could be considered as a positive aspect of climate change and may to
a certain extent help to meet the probably increasing future food demand either directly or
mediated by quantitative elevations in feed production. However, in most experiments the
positive effects of increased CO2 concentrations on yields of several C3 plant species were
accompanied by substantial reductions in the quality of the products generated for food and
feed purposes. The effects of CO2 enrichment on the composition of wheat, which is one of
the most important crops worldwide with a total annual harvest of almost 598 million tonnes
in 2006 (FAOSTAT, 2007) and an enormous importance for both human nutrition and
feeding of various livestock species, are relatively well described. The major part of previous
research focused on implications related to food production, though approximately one-sixth
of the global annual wheat production is used for livestock feeding. Recently, Porteaus et al.
(2009) investigated the effects of an atmospheric CO2 concentration of 550 ppm on
composition and feed value of wheat grain and straw and concluded that the feed quality of
both products was altered in a negative manner because, for example, grain protein contents
were strongly reduced at low levels of N fertilization. Högy and Fangmeier (2008) reviewed
the effects of CO2 elevations on the grain quality of wheat and reported several alarming
alterations. The protein concentration of grain grown under natural conditions was reduced by
2.3 to 4.2 %, a fact that will likely reduce both feed and food value. Gluten, substantially
influencing the baking properties of wheat flour (Stafford, 2007), was decreased by up to 7.5
%. Furthermore, elevated CO2 was associated with reductions in the contents of various amino
acids (7.7 to 21.8 %) which are known to be essential for humans such as threonine, valine,
isoleucine, leucine and phenylalanine. In pig diets, lysine is usually regarded as the first
limiting amino acid. However, all mentioned amino acids are essential for pigs as well and
large reductions of these amino acids in main components of pig rations such as wheat and
barley would cause serious adverse impacts on their future feed value. In ruminants, the
amino acid supply is primarily ensured by the microbial protein production in the
reticulorumen. Nevertheless, a reduced N intake due to depleted plant protein contents would
typically reduce the substrate for microbial amino acid formation in the forestomach and may
thus indirectly impact the feed value of the respective C3 plants. Furthermore, the
concentrations of major parts of macro- and micro-elements such as Mg, Ca, Na, S, Fe and Zn
tended to decrease as well but the content of starch partially increased, though Högy and
Fangmeier (2008) described a high experimental variability.
Homologous adverse effects of enriched carbon dioxide on the quality of barley and rice were
reported. In a FACE experiment, Erbs et al. (2010) reported reductions of approximately 12 %

Background
12
in crude protein concentrations of barley grain due to the exposure to 550 ppm CO2. In the
same trial, the concentrations of starch and several macro- and micro-elements except S were
not altered by enriched atmospheric carbon dioxide. Similar carbon dioxide concentrations
induced reductions in the protein contents of rice grain, the first staple food especially in Asia
that will probably face a strongly increasing future demand
(Terao et al., 2005; Yang et al., 2007). The global importance of rice as a feedstuff is limited.
However, reduced protein concentrations in a major supplier of food protein for a large part of
the human population may contribute to malnutrition especially if the quantitative access to
food is restricted since the total yield of rice protein was not necessarily depleted by carbon
dioxide enrichment (Yang et al., 2007).
The decreased N and protein contents in C3 plants are to a large extent the result of an
accumulation of carbohydrates and other organic compounds in leaves and other plant organs
due to the described CO2-induced photosynthetic stimulation and could be referred to as a
dilution effect (Korner, 2000). These processes are well established since Cotrufo et al. (1998)
reviewed 75 previous studies and concluded that 82 % of the evaluated experiments reported
reductions in plant nitrogen concentration under conditions of elevated CO2 with a mean N
reduction of 14 %. In addition, the uptake of N from the soil could be decreased indirectly by
enhanced carbon dioxide due to lower transpiration rates (Manderscheid et al., 1995). There
are indications that reductions in enzymes of the Calvin cycle may contribute to the decreased
plant N concentration, possibly an effect of a reduced carboxylation enzyme requirement in
high CO2 atmospheres (Idso and Idso, 2001). Future increases in CO2 are likely to stimulate
yield and photosynthesis of both agricultural and wild C3 plants. However, the quality of the
generated products is often alarmingly reduced and considerable alterations in the chemical
composition of food and feed are to be expected and will challenge future diet formulation.
2.1.1.2 C4 plants
C4 plants comprise less than 5 % of the known plant species but include some of the most
important agricultural plants such as maize, sorghum (Sorghum bicolor L.) and sugarcane
(Saccharum officinarum L.). They contribute about 20 % to the global primary production
because C4 grasslands are highly productive (Ehleringer et al., 1997). In C4 photosynthesis,
the assimilation of carbon dioxide and the Calvin cycle are spatially separated and the primary
uptake of CO2 is not catalysed by Rubisco but by another enzyme called phosphoenol
pyruvate (PEP) carboxylase (Newman et al., 2011). This process takes place in outer
mesophyll cells of the leaves where carbon dioxide is converted into a 4-carbon acid,

Background
13
oxaloacetate. Afterwards, oxaloacetate is converted into another acid and this acid is
transferred into inner bundle sheath cells of the leaves, where CO2 is removed from the 4-
carbon acid and subsequently enters the normal C3 pathway. The cell walls of bundle sheath
cells are coated with suberin and hence have a low conductance to CO2 which is concentrated
in these cells 3 to 10 times higher than in the current atmosphere (Ghannoum et al., 2000).
Based on this local carbon dioxide saturation already at present atmospheric levels it was
partially suggested that C4 species would not be substantially affected by rising CO2 because a
photosynthetic stimulation should not be expected (Bowes, 1993). Interestingly, C4 plants
were proven to be limited in their ability to assimilate carbon at low atmospheric CO2
concentrations and respond strongly to elevations up to approximately 300 ppm but were
found to be CO2-saturated at about 400 ppm (Kimball, 1983; Newman et al., 2011).
However, uncertainty about the actual responses of C4 plants to increasing future CO2
concentrations persists. Experimental results were inconsistent because in some studies yields
and biomass production of several C4 species were reported to be heightened due to the
exposure to enriched carbon dioxide, though most studies did not reveal effects in terms of
quantity (Table 1). The major part of research that demonstrated increased yields used
controlled environmental conditions such as growth chambers (Maroco et al., 1999; De Souza
et al., 2008) which can lead to overestimations of the actual carbon dioxide effects. Leakey et
al. (2009) suggested that such overestimations may in parts be attributable to a restriction of
the typical deep rooting of maize and sorghum resulting in an inadequate root volume to
absorb enough water. Growth at elevated CO2 reduces plant water requirement and may thus
result in an apparent photosynthetic stimulation at sufficient water supply in such
experiments. Accordingly, various investigations partly using FACE technology did not
report significant alterations in yields of agricultural C4 plants (Leakey et al., 2004;
Barbehenn et al., 2004; Leakey et al., 2006; Chun et al., 2011). In contrast, Ghannoum et al.
(2000) reviewed the effects of rising CO2 on the growth response of C4 plants and concluded
that there is growing evidence that increased carbon dioxide can lead to accumulations of
more biomass, though the underlying mechanisms are to a large extent unclear. The
stimulation of the growth of C4 weeds was reported to be higher than that of C4 crops and
many wild C4 species and grasses responded to CO2 enrichment. It was suggested that their
photosynthesis is not necessarily saturated at ambient carbon dioxide (Wand et al., 1999).
Despite of the enormous global relevance of several agricultural C4 species most research
conducted to assess the effects of altered future climatic conditions on food and feed value
primarily focused on C3 plants. However, the controversy about potential impacts of elevated
Background
14
atmospheric CO2 on photosynthesis and yield of C4 plants also highlights both the importance
and the considerable gap of knowledge about responses of the respective species in terms of
quality, chemical composition and feed value. The limited available literature reflects the
inconsistent responses of plant yields and biomasses to increased CO2. As summarized in
Table 1, enriched carbon dioxide did not have significant effects on fibre constituents and
non-fibrous carbohydrate fractions of most investigated C4 plants. In contrast, Barbehenn et
al. (2004) reported increases of both starch (50 %) and NDF (10 %) concentrations in the C4
grass Digitaria sanguinalis L. (Crabgrass), though the concentrations of the respective
fractions were not affected in diverse other C4 grasses. Furthermore, cellulose content in
sugarcane partially increased and non-structural leaf carbohydrates of some C4 grasses were
elevated (LeCain and Morgan, 1998; De Souza et al., 2008). Thus, carbohydrate contents
remained either unaffected by CO2 enrichment or increased, but reductions were not reported
in any of the evaluated studies. Inconsistent CO2 effects were described for plant protein as
well but the concentration of protein in C4 plants such as maize or several grass species was
not altered by increased atmospheric CO2 in different experiments (Akin et al., 1994; Leakey
et al., 2006). However, maize leaf protein was reported to decrease by 22-29 % if the plants
were grown in controlled environments or subjected to high concentrations of 1100 ppm
carbon dioxide (Maroco et al., 1999; Driscoll et al., 2006) and reductions in protein contents
of total plants or single organs were described for sudangrass and crabgrass (Akin et al., 1994;
Barbehenn et al., 2004).
Background
15
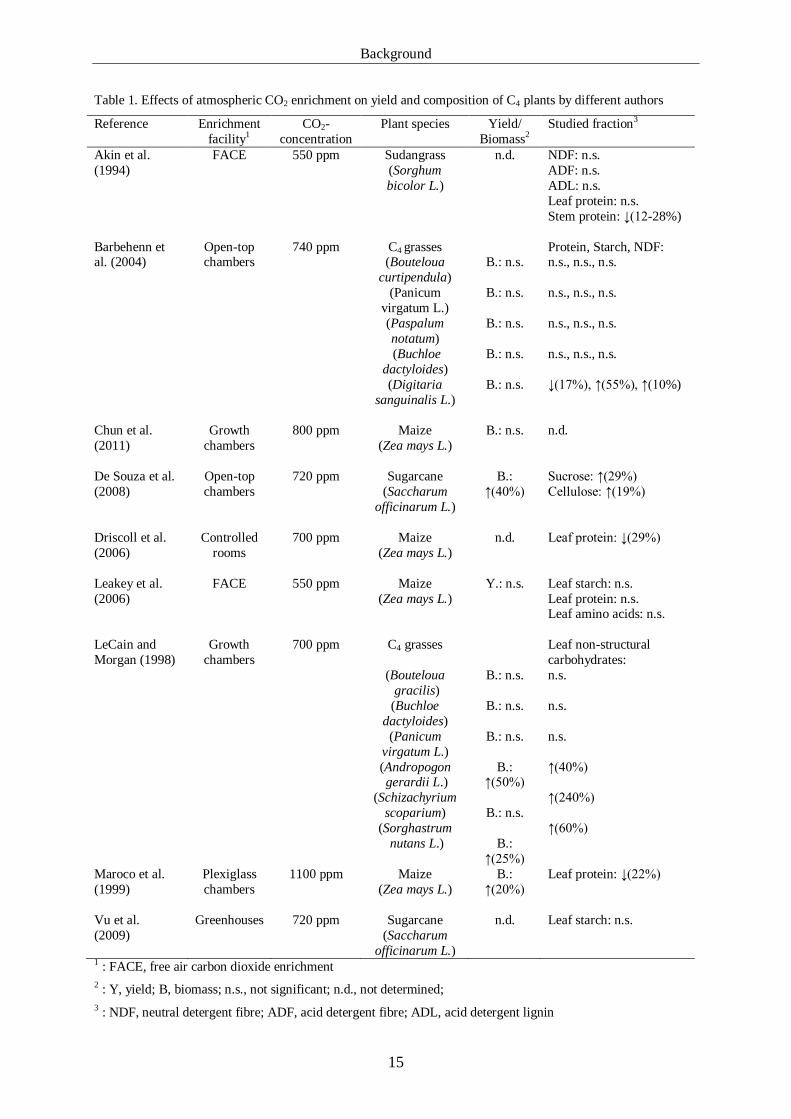
Table 1. Effects of atmospheric CO2 enrichment on yield and composition of C4 plants by different authors
Reference Enrichment
facility1
CO2-
concentration
Plant species Yield/
Biomass2
Studied fraction3
Akin et al.
(1994)
FACE 550 ppm Sudangrass
(Sorghum
bicolor L.)
n.d. NDF: n.s.
ADF: n.s.
ADL: n.s.
Leaf protein: n.s.
Stem protein: ↓(12-28%)
Barbehenn et al. (2004)
Open-top chambers
740 ppm C4 grasses (Bouteloua
curtipendula)
(Panicum
virgatum L.)
(Paspalum
notatum)
(Buchloe
dactyloides)
(Digitaria
sanguinalis L.)
B.: n.s.
B.: n.s.
B.: n.s.
B.: n.s.
B.: n.s.
Protein, Starch, NDF: n.s., n.s., n.s.
n.s., n.s., n.s.
n.s., n.s., n.s.
n.s., n.s., n.s.
↓(17%), ↑(55%), ↑(10%)
Chun et al.
(2011)
Growth
chambers
800 ppm Maize
(Zea mays L.)
B.: n.s. n.d.
De Souza et al.
(2008)
Open-top
chambers
720 ppm Sugarcane
(Saccharum
officinarum L.)
B.:
↑(40%)
Sucrose: ↑(29%)
Cellulose: ↑(19%)
Driscoll et al.
(2006)
Controlled
rooms
700 ppm Maize
(Zea mays L.)
n.d. Leaf protein: ↓(29%)
Leakey et al.
(2006)
FACE 550 ppm Maize
(Zea mays L.)
Y.: n.s. Leaf starch: n.s.
Leaf protein: n.s. Leaf amino acids: n.s.
LeCain and
Morgan (1998)
Growth
chambers
700 ppm C4 grasses
(Bouteloua
gracilis)
(Buchloe
dactyloides)
(Panicum
virgatum L.)
(Andropogon gerardii L.)
(Schizachyrium
scoparium)
(Sorghastrum
nutans L.)
B.: n.s.
B.: n.s.
B.: n.s.
B.: ↑(50%)
B.: n.s.
B.:
↑(25%)
Leaf non-structural
carbohydrates:
n.s.
n.s.
n.s.
↑(40%)
↑(240%)
↑(60%)
Maroco et al.
(1999)
Plexiglass
chambers
1100 ppm Maize
(Zea mays L.)
B.:
↑(20%)
Leaf protein: ↓(22%)
Vu et al.
(2009)
Greenhouses 720 ppm Sugarcane
(Saccharum
officinarum L.)
n.d. Leaf starch: n.s.
1 : FACE, free air carbon dioxide enrichment
2 : Y, yield; B, biomass; n.s., not significant; n.d., not determined;
3 : NDF, neutral detergent fibre; ADF, acid detergent fibre; ADL, acid detergent lignin
Background
16
2.1.2 Mycotoxin contamination
Food and feed quality of agricultural plants can be impaired by the contamination with toxic
secondary metabolites, mycotoxins. Their production follows plant colonization and infection
by fungi from various genera such as Aspergillus, Penicillium, Fusarium, Alternaria or
Claviceps. Most mycotoxins are heat-stable and very difficult to destroy during processing
and their ingestion can have serious adverse consequences for human and animal health which
include carcinogenic and immune-modulating effects (Magan et al., 2011).
In animal nutrition, several mycotoxins are of considerable importance because they can
contaminate a variety of feedstuff and lead to intoxications that may depress animal
performance of diverse livestock species. In central Europe, prevalent Fusarium species are F.
graminearum and F. culmorum, which are able to produce several toxic metabolites including
deoxynivalenol (DON) and zearalenone (ZON) that are often detected in maize, wheat and
triticale (Dänicke, 2010).
DON can inhibit the synthesis of proteins and induce vomiting (Rotter et al., 1996; Goyarts
2006). ZON has estrogenic properties and may be related to hyperestrogenism
(Döll et al., 2003). The exposure of monogastric animals such as pigs and poultry to high
dietary concentrations of DON and ZON was reported to have serious adverse effects on
animal health and performance (Goyarts et al., 2005; Dänicke et al., 2007; Dänicke and Döll,
2010). In contrast, the susceptibility of ruminants to both DON and ZON is known to be
relatively low, as in the rumen DON is converted almost completely into a less toxic de-
epoxidized metabolite (de-epoxy-DON) and ZON is converted into the less absorbable α-
zearalenol and the less potent β-zearalenol (Kiessling et al., 1984; Kennedy et al., 1998; Fink-
Gremmels, 2008). In spite of the detoxification potential of the reticulorumen, the intake of
high doses of DON may affect metabolism and immunological parameters of dairy cows
(Korosteleva et al., 2007; Korosteleva et al., 2009). Furthermore, it is unclear whether rising
future ambient temperatures will influence the ruminal detoxification of DON and ZON
indirectly as hot summer periods are usually associated with the incidence of heat-stress that
is well known to affect feed intake, performance and metabolism of ruminants (West, 2003;
Marai et al., 2007).
Conceivable climate change effects on plant infection by moulds and subsequent mycotoxin
production are complex and the specific impacts will strongly depend on the local climatic
development. In general, all main aspects of global climate change, rising surface
temperatures, increasing atmospheric CO2 concentrations and altering precipitation patterns
exhibit the potential to modify the growth conditions of various fungi species not only in

Background
17
agricultural plants. Besides such direct effects of altered climatic conditions indirect
implications such as shifted crop rotations may change the occurrence of fungal infection
(Chakraborty and Newton, 2011).
Ambient temperatures are well known to influence the growth of various moulds such as
Aspergillus and Fusarium species and often warm temperatures in the range of 20 to 30 °C
were found to be optimal conditions (Marin et al., 1995; Giorni et al., 2007). However,
alterations in ambient temperatures are complex to simulate in full open-air trials like FACE
experiments and the present work will focus primarily on effects related to future changes in
carbon dioxide concentration and water availability.
In general, fungi are able to withstand relatively high concentrations of CO2 and levels in the
range of 700 to 1000 ppm as expected by the end of the 21st century will likely not induce
inhibitions of fungal growth (Magan et al., 2011). However, very high concentrations may
affect Fusarium fungi as Magan and Lacey (1984) demonstrated that the latent period prior to
growth of F. culmorum was increased by a treatment of more than 5000 ppm CO2. In the
same study, CO2 appeared to interact with the water activity of the media as the growth of F.
culmorum was significantly inhibited by enriched carbon dioxide at 0.98 and 0.95 aw but
seemed to be unaffected at 0.90 aw. Moreover, the production of ZON by F. equiseti in maize
grain was inhibited by high CO2 levels above 20 % but a lower amount of carbon dioxide
inhibited mould development and mycotoxin formation at relatively low oxygen
concentrations (Paster et al., 1991). The actual impact of CO2 may differ among Fusarium
species because Samapundo et al. (2007) reported that the production of fumonisin B1 by F.
verticillioides was completely inhibited in a high carbon dioxide atmosphere of 10 % but the
inhibition of the same mycotoxin by F. proliferatum required 40 %, 30 % and 10 % CO2 at aw
0.984, 0.951 and 0.930.
Water availability is one of the most important factors that influences the life cycles of
mycotoxigenic fungi including Fusarium species and affects both mould growth and
mycotoxin production (Kokkonen et al., 2010) via two possible pathways. First, drought can
increase the susceptibility of plants such as maize to fungal infection (Arino and Bullerman,
1994). Secondly, the growth of fungi in different media directly depends on the respective aw.
Accordingly, Mateo et al. (2002) reported that F. sporotrichioides produced the largest
amount of mycotoxins at the highest aw (0.99) in wet maize grain.

Background
18
2.2 Drought: Plant responses and CO2-interactions
Drought-associated losses of crop yields are likely to exceed the losses induced by all other
factors and thus drought may be referred to as the most critical single menace to global food
security (Farooq et al., 2009). Moreover, the rising global food demand will probably increase
the severity of the consequences of future drought and climatic projections revealed that
considerable yield losses may occur in various regions (Somerville and Brisco, 2001).
Duration, severity and timing of drought incidents and the response of plants after the ending
of drought stress are crucial factors in the assessment of the impacts of water restriction.
Consequently, experimental drought-induced losses of maize yield varied considerably but
may exceed 50 % and even reach drastic reductions of 80 % or more (Chapman and
Edmeades, 1999; Monneveux et al., 2006). The foremost effect of drought is an impaired
germination and severe drought stress can inhibit cell elongation and growth of plants
(Nonami, 1998). The negative impact of drought on maize is not limited to quantitative
depressions of yields because limited water availability may as well affect the nutritive value
of both food and feed products and the silage making properties of whole maize plants.
Drought stress was reported to deplete the intermediates of starch synthesis and to reduce
grain numbers per ear and soluble sugar concentrations (Zinselmeier et al., 1999; Boyer and
Westgate, 2004; Yin et al., 2012). Starch is a main constituent of maize silage, a feedstuff that
is used prevalently in both northern American and European dairy cow diets to meet the
energy requirements in particular of high-yielding animals. The proportion of starch often
exceeds 30 % of maize silage dry matter (DM) and an increased future occurrence of drought-
associated reductions in starch concentrations exhibits the potential to considerably reduce the
feed value of ensiled maize.
The adverse effects of drought on plant growth and composition could be diminished by
rising atmospheric CO2 concentrations which are known to improve plant water-use
efficiency and to decrease stomatal conductance and transpiration. Same as for C3 species, the
photosynthesis of C4 plants that dominate in hot and arid regions is very sensitive to drought
stress. However, current literature suggests that elevated carbon dioxide levels indirectly
reduce the negative effects of limited water availability on plant productivity by improved soil
moisture and plant water status (Wand et al., 1999; Leakey et al., 2004; Leakey et al., 2006).
Most research assessing interactions between atmospheric CO2 and drought focused on C3
plants (Ghannoum, 2009) and the fewer studies that investigated the responses of C4 plants
primarily evaluated effects on photosynthesis and growth. Thus very few information exists
whether congruent interactions are to be expected for chemical composition and nutritive

Background
19
value of C4 species such as maize, in particular if elevated CO2 will help to maintain the
future feed value of maize silage in periods of drought.
2.3 Heat stress in dairy cows
2.3.1 Emergence and impacts of heat stress
Heat stress is an enormous financial burden to livestock production in diverse regions of the
world (Bernabucci et al., 2010). For example, the dairy industry of the United States of
America alone records annual losses due to heat stress which approximate 900 million US-
Dollar (Collier et al., 2006). Obviously, globally rising ambient temperatures will increase the
occurrence of heat stress especially in regions that already have to face heat in summer
months or throughout the year. Considering the projected drastic increases in mean surface
temperatures in the range of 1.8 to 4.0 °C until the end of the 21st century and keeping in mind
that the warming over land will be about twice than the average warming (Meehl et al., 2007)
one must conclude that future heat stress, first, will arise in diverse areas that did not
experience respective stressors yet and, second, that the overall economic and physiological
impact of climate change induced heat stress on animal production will likely be tremendous
and in parts threatening to the supply of food of animal origin.
The enormous genetic progress in milk production of dairy cows and rising animal
bodyweights were closely related to elevations in feed intake (Heinrichs and Hargrove, 1987).
Increases in feed consumption and the associated metabolism of nutrients result in higher
body heat production which requires effective thermoregulatory adaptations in order to
dissipate excess body heat if the cows are exposed to warm or hot environmental conditions.
The animals loose heat via conduction, convection, radiation and evaporation. Thus increases
in the dissipation of body heat are generated by sweating, panting, cooler environmental
conditions, elevated skin circulation or vasodilatation, alterations in coat insulation, raised
water loss, increased radiating surface and rises in air movement. If the animals fail to
discharge sufficient thermal energy, hyperthermia can occur. Kadzere et al. (2002)
summarized that heat stress indicates all forces related to high ambient temperatures that
induce adjustments from the sub-cellular to the whole animal level and help to maintain the
status of physiological functions.
It is complicated to determine the exact and individual threshold where thermoneutrality, a
prerequisite for the maintenance of normal physiological processes, is terminated and the
animals begin to suffer from heat stress. Lactating dairy cows prefer ambient temperatures in

Background
20
the range of 5 to 25 °C (Roenfeldt, 1998), their so-called thermoneutral zone (Figure 5). The
thermoneutral zone can be referred to as the zone of minimal heat production at normal core
body temperature. It depends on different variables including milk performance leading to the
conclusion that calving and peak milk yield that is associated with high heat production
should preferably take place in cold seasons. The upper critical temperature is the ambient
temperature at which the animals begin to increase heat production in order to dissipate
excess body heat. Another useful measure of the thermal impact of an environment can be the
calculation of temperature-humidity indices (THI) that consider air relative humidity which
can limit evaporative heat dissipation especially in hot and humid climates. A variety of
equations were suggested to calculate THI for the use in dairy production (Bohmanova et al.,
2007; Dikmen and Hansen, 2009). THI below 70 were usually considered as comfort zone,
mild heat stress is likely to be initiated by THI higher than 71 and severe heat stress occurs if
THI exceed 75 (Armstrong, 1994).
Figure 5: Schematic relationship of the animal`s core body temperature, heat production and environmental
temperature (Redrawn from Kadzere et al., 2002). LCT, lower critical temperature; UCT, upper critical
temperature
Environmental temperature
Thermal comfort
HypothermiaHyperthermia
Core body
temperature
Heat production
rateCool
zone
Warm
zone
Cold
zone
Hot
zone
LCT UCT
Thermoneutral zone
Death due to cold Death due to heat
Environmental temperature
Thermal comfort
HypothermiaHyperthermia
Core body
temperature
Heat production
rateCool
zone
Warm
zone
Cold
zone
Hot
zone
LCT UCT
Thermoneutral zone
Death due to cold Death due to heat

Background
21
The exposure of homoiotherm organisms to warm or hot environments induces diverse
homeostatic adaptations including thermoregulatory, humoral, metabolic, nutritive and
behavioral changes. In dairy cows and sheep, heat stress can manifest in increases in sweating
rates, skin and rectal temperatures, respiration rates, alterations in blood pH, blood gas
concentrations, heart rate, hormone secretion, mineral metabolism, water metabolism and
changes in ruminal fermentation (Schneider et al., 1988; Blazquez et al., 1994; Kadzere et al.,
2002; Marai et al., 2007; Dikmen et al., 2008). Moreover, heat was found to affect the
immune cell function in bovines and sheep (Niwano et al., 1990; Lacetera et al., 2005; Booth
et al., 2007) and the thermal environment was reported to influence the apparent digestibility
of nutrients or DM in cattle and sheep diets in diverse experiments (Christopherson and
Kennedy, 1983). For example, the digestibilities of DM, organic matter, NDF and crude
protein in steers were increased by 9 to 16 % if the animals were kept at 28 °C compared to
10 °C (Miaron and Christopherson, 1992). Similar results were reported for sheep in a trial of
Westra and Christopherson (1976) as the digestibilities of DM and ADF of both hay and
pelleted hay diets were higher at 17.7 °C than at 0.8 °C. Impaired animal health and
reproduction is mostly accompanied by two major effects of heat stress in relation to milk
performance of dairy cows, reduced voluntary feed intake and declining milk yield (Table 2).
The heat-associated daily reductions in milk production were reported to vary in the range of
0.16 to 0.57 kg/ THI unit above the respective thresholds that indicated the onset of heat
stress.
The assessment of future heat stress impacts on dairy cattle should not exclusively focus on
direct animal effects but imperatively has to integrate potential alterations in quantity and
quality of important ruminant feedstuff. It needs to be elucidated whether changes in the
chemical composition of feed may interact with a rising occurrence and duration of heat stress
and its physiological effects on the animals. Current information about such complex
interactions is very rare but would be valuable in estimating the actual consequences of
climate change on dairy production.

Background
22
Table 2. Effects of heat stress on dry matter intake and milk performance of dairy cows by different authors
Reference Experimental facility Heat stress treatment1 Effects2
Bernabucci et al.
(2002)
Commercial farm
(Italy)
THI > 72 Milk yield: ↓
Milk protein percent: ↓
Milk casein percent: ↓
Dry matter intake: ↓
Bohmanova et al. (2007)
Commercial farms (USA)
THI 68-83 Milk yield: ↓ (0.22-0.57 kg/THI unit)
Bouraoui et al.
(2002)
Dairy farm (Tunisia) THI > 69 Milk yield: ↓
(0.41 kg/THI unit)
Dry matter intake: ↓
Igono et al.
(1992)
Commercial farms
(USA)
THI > 72 Milk yield: ↓
(0.16 kg/THI unit)
Ominski et al.
(2002)
Metabolic crates in
ventilated rooms
THI > 80 Milk yield: ↓
Dry matter intake: ↓
Milk fat percent: n.s.
Ravagnolo et al.
(2000)
Commercial farms
(USA)
THI > 72 Milk yield: ↓
(0.2 kg/THI unit)
Milk fat yield: ↓
(0.012 kg/THI unit)
Milk protein yield: ↓
(0.009 kg/THI unit)
Rhoads et al.
(2009)
Environmental
chambers
THI 73 - 82 Milk yield: ↓
Milk protein percent: n.s.
Milk fat percent: ↑
Milk lactose percent: ↓ Dry matter intake: ↓
Spiehrs et al.
(2004)
Tie stalls in climatic
laboratory
THI 76 - 79 Milk yield: ↓
Dry matter intake: ↓ 1 : Temperature humidity index, THI
2 : Not significant, n.s.
2.3.2 Heat stress alleviation
Various strategies to reduce the adverse impacts of current and increasing future heat on dairy
cows were discussed in past literature. Some of the most effective methods to counteract heat
stress are shading, cooling and genetic selection (West, 2003). However, several nutritional
measures can contribute to heat stress relief and include both diet composition and the use of
supplements. Feeding of heat stressed dairy cows generally has to take into account diet
reformulation due to decreases in feed intake, greater nutrient requirements and feedstuff
specific heat increment. Nutritional countermeasures against excess body heat in warm
environments can be divided into two subsections, either direct reductions of dietary body
heat increment or the triggering of physiological mechanisms that mediate alleviations of heat

Background
23
stress via, for example, increases in skin blood flow that lead to elevated convective and
conductive dissipation of thermal energy.
Feeding dairy cows with rations that have a high concentrate to roughage ratio should reduce
the dietary heat increment because there is a greater heat production associated with the
metabolism of acetate compared to propionate (West, 1999). This was demonstrated by
Reynolds et al. (1991), who reported that feeding growing heifers with a 75 % concentrate
diet resulted in a lower production of heat energy than feeding the animals with a high fibre
diet containing 75 % alfalfa. Furthermore, feeding rations with high proportions of
concentrate is typically related to an elevated density of metabolizable energy that will be
beneficial if heat-stressed animals have to withstand reductions in feed intake (Table 2) but
increases in heat production rate to dissipate excess energy as shown in Figure 5.
Niacin comprises two vitamers, nicotinic acid and nicotinamide, is of great metabolic
importance due to its incorporation into the coenzymes NAD and NADP
(Niehoff et al., 2009a) and was recently discussed for its potential to reduce the impact of heat
stress in cattle. In humans, niacin is used therapeutically for more than 50 years and is well
known to induce a side effect called flushing, a strong cutaneous vasodilatation that manifests
itself as redness or warmth of the skin (Kamanna et al., 2009). Two pilot studies demonstrated
that the supplementation of varying doses of niacin can reduce body temperatures of heat
stressed lactating cows (DiCostanzo et al., 1997; Zimbelman et al., 2010). It was hypothesized
that the vasodilatative effects of niacin may result in an increased skin blood flow that leads to
an improved peripheral dissipation of body heat. However, experimental observations were
inconsistent because higher intakes of niacin were not necessarily related to respective
reductions of skin temperatures and the highest tested daily supplementation of 36 g niacin
per animal did not affect rectal and skin temperatures or respiration rates of Holstein cows
(DiCostanzo et al., 1997). Though differing results were reported, the supplementation of
niacin can induce a variety of further effects which include increases in milk and fat corrected
milk yield, alterations in milk protein and fat content as well as yields, rumen fermentation
and microbial populations (Minor et al., 1998; Niehoff et al., 2009a; Niehoff et al., 2009b).
However, further research is needed to evaluate the capability of niacin in reducing the
adverse effects of heat stress in cattle and to generate an extended basis of knowledge to cope
with rising future ambient temperatures. Such investigations should consider different
environmental conditions and physiological stages because uncertainty exists about the
thermoregulatory responses of growing cattle such as heifers which usually have lower
bodyweights and DM intakes than adult cows (Ahn et al., 2005).

Background
24
2.4 Applicability and restrictions of continuous ruminal pH and temperature measurement
In ruminant feeding, the applicability of high dietary concentrate proportions is limited
because the intake of low fibre diets is well known to be associated with increases in the
production of short chain fatty acids and depressions in ruminal pH. That may lead to SARA,
a digestive disorder with a considerable prevalence of 11 to 26 % even in well-managed
European and US-American dairy cow herds (Kleen et al., 2003; Enemark, 2008). SARA was
reported to impair animal health and productivity and is related to decreases in feed intake and
milk production, premature culling and death loss. Clinical signs of SARA are complicated to
detect and include reduced DMI, laminitis and diarrhea. However, prolonged periods of low
ruminal pH values may serve as indicators of SARA (Kleen et al., 2003; Morgante et al.,
2007). For example, Garrett et al. (1999) considered pH 5.5 to be the critical value and Gozho
et al. (2005) suggested that SARA may be identified by ruminal pH below 5.6 for at least 3
hours per day. Common field methods used for SARA detection via determination of ruminal
pH are rumenocentesis and the use of oral stomach tubes to measure pH in gained rumen fluid
(Duffield et al., 2004) but both fail in depicting the dynamic development of pH over time and
thus in monitoring the time spent below specific thresholds. The validity of results obtained
by both techniques is generally restricted because their use is time-consuming and expensive
and usually limited to infrequent or spot sampling (AlZahal et al., 2008). Moreover, saliva
contamination may falsify the results gained via stomach tubes and restrictions in animal
numbers may lead to insufficient representation of the situation in complete feeding groups or
herds.
Accordingly, Enemark (2008) suggested that a continuous determination of ruminal pH may
be a promising tool for the diagnosis of SARA. This can be realized by the application of
indwelling rumen probes (boluses) which serve to monitor ruminal pH continuously as
influenced by varying diets and feeding schemes. The onset of ruminal pH measurement is
represented by an early work of Dado and Allen (1993) who used a prototype device
consisting of electrode and transmitter. In the last years, technical progress has enabled the
implementation and evaluation of several self-constructed or commercially available probes
for wireless in vivo measurement of ruminal pH and in parts temperature and pressure in both
small ruminants and cattle (Enemark et al., 2003; Penner et al., 2009; Kaur et al., 2010;
Phillips et al., 2010). Though such techniques may be promising, the accuracy and validity of
pH measurement can be impaired by different confounders. First, method comparison
methods revealed that in several experiments pH determination via intraruminal boluses had
only low or moderate linear relationships to traditional manual pH measurement (Duffield et

Background
25
al., 2004; Kaur et al., 2010). Secondly, the accuracy of pH monitoring may be affected by the
occurrence of time-dependent pH sensor drift (Penner et al., 2006; Kaur et al., 2010). Thirdly,
the exact site of measurement can influence the results obtained via unfixed probes that move
freely in the reticulorumen because pH gradients may occur. For example, reticular pH may
be higher than ruminal pH due to saliva flooding into the reticulum. Furthermore, the ingesta
in the top stratum of the rumen is usually recently consumed and should be subjected to a
higher fermentative activity than the material in the ventral rumen sac (Tafaj et al., 2004).
Thus evaluation and use of new wireless devices for intraruminal pH measurement
imperatively require a comparison to established methods of pH determination in rumen fluid,
a verification of potential pH sensor drift and should consider a possible development of pH
gradients within the reticulorumen.
The determination of ruminal temperature by means of wireless boluses can contribute to
understanding direct ration effects on heat production in the rumen and thus help to optimize
dietary adaptations to hot environmental conditions. Varying proportions of concentrate may
not only induce alterations in metabolic heat production as mentioned in section 2.3.2 but can
also influence ruminal temperatures. For example, AlZahal et al. (2008) reported significant
increases in ruminal temperatures of lactating Holstein cows due to feeding high amounts of
grain in comparison to a control diet. In the same experiment, the nadirs of both ruminal pH
and temperature had a close negative relationship (R2=0.77) and the authors concluded that
therefore ruminal temperature could help in the diagnosis of SARA. Furthermore, the
temperatures in the reticulorumen were shown to be positively correlated to core body or
rectal temperatures of cows (Burns et al., 2002; Bewley et al., 2008a) and could thus
theoretically display increased core body temperatures in periods of severe heat stress.

Scope of the thesis
26
Scope of the thesis
Based on the current literature it can be deduced that future climate change will likely have
substantial, multifarious and mainly adverse effects on feed quality and productivity of dairy
cows. Considerable gaps of knowledge about the actual and complex impacts of some of the
most important climatic alterations such as increased atmospheric CO2 concentrations,
regional rises of drought incidents and global elevations in ambient temperatures on feedstuff,
health and performance of dairy cows persist and challenge global agriculture to adapt to and
cope with modified future production conditions.
Therefore the first objective of the present thesis was to investigate the effects of increased
atmospheric CO2 concentrations and drought on feed value, mycotoxin contamination and
nutrient digestibility of ensiled whole maize plants fed to sheep in consideration of varying
climatic conditions during feeding (Paper I).
Moreover, the effects of atmospheric CO2 concentration and drought during maize growth as
well as the climatic conditions during feeding on thermoregulation, blood parameters and
metabolization of DON in sheep were to be assessed (Paper II).
The applicability and accuracy of a new commercially available device for wireless
intraruminal pH and temperature measurement were to be evaluated in consideration of the
localization of measurement in the rumen and varying proportions of dietary concentrate
(Paper III).
The impacts of a supplementation of niacin and differing dietary concentrate proportions on
the thermoregulation of heat stressed primiparous dairy cows was aimed to be tested and the
effects of both treatments on milk performance as well as ruminal pH and temperature were
evaluated (Paper IV).

Paper I
27
Paper I
Effects of free air carbon dioxide enrichment and drought stress on the
feed value of maize silage fed to sheep at different thermal regimes
Malte Lohöltera, Ulrich Meyer
a, Remy Manderscheid
b, Hans-Joachim Weigel
b, Martin Erbs
b,
Gerhard Flachowskya and Sven Dänicke
a
aInstitute of Animal Nutrition, Friedrich-Loeffler-Institute (FLI), Federal Research Institute
for Animal Health, Braunschweig, Germany
bInstitute of Biodiversity, Johann Heinrich von Thuenen-Institute (vTI), Federal Research
Institute for Rural Areas, Forestry and Fisheries, Braunschweig, Germany
Archives of Animal Nutrition
2012
Volume 66
335 – 346
Doi:10.1080/1745039X.2012.697352

Paper I
28
Abstract
Information about the effects of rising atmospheric CO2 concentration and drought on the
feed value of maize silage and interactions with the thermal environment during feeding is
limited. A free air carbon dioxide enrichment facility was operated in a maize field to
generate an elevated CO2 concentration of 550 ppm. Drought was induced by the exclusion of
precipitation in one half of all experimental plots. Plants were harvested, chopped and ensiled.
In a balance experiment on sheep, the nutrient digestibility was determined for three climatic
treatments (temperate, temperature humidity index (THI) 57–63; mild heat, THI 68–71;
severe heat, THI 75–80). The CO2 concentration and drought did not alter the crude nutrient
content of silage dry matter (DM) or nutrient and organic matter (OM) digestibility. Drought
increased the concentration of deoxynivalenol (DON, p < 0.001). The drought-associated
increase of DON was reduced by CO2 enrichment (p = 0.003). The lowest digestibility of acid
detergent fibre (p = 0.024) and neutral detergent fibre (p = 0.005) was observed during the
coldest climate. OM digestibility increased during mild heat (p = 0.023). This study did not
indicate considerable alterations of the feed value of maize silage due to increased
atmospheric CO2 and drought. Enriched CO2 may decrease DON contaminations during
drought. The thermal environment during the balance experiment did not interact with feeding
maize silage grown under elevated CO2, but may affect cell wall and OM digestibility.
Keywords: Carbon dioxide enrichment, drought, thermal environment, sheep,
maize silage
1. Introduction
Climate change includes the potential to affect both crop cultivation and livestock husbandry.
The atmospheric CO2 concentration has risen to a current value of 390 parts per million
(ppm) and may double within this century (IPCC 2007). Furthermore, the global surface
temperature is likely to increase in the range of 1.8–48 °C until 2090–2099 and altering
precipitation patterns are predicted to generate augmented emergence of aridity in various
regions. Elevated atmospheric CO2 concentrations were reported to stimulate photosynthesis
and growth of C3 plants but to reduce forage and grain protein (Weigel and Manderscheid
2005). Information about the effects on C4 plants such as maize (Zea mays L.) are sparse but
necessary as besides the immense importance of maize for human food supply maize silage is
used prevalently as a major component of ruminant diets. The photosynthesis of C4 plants is
likely to be saturated at ambient CO2 concentrations (Ghannoum 2009) and therefore the
Paper I
29
impact of increasing CO2 on C4 crops may be limited. Under controlled environmental
conditions yields of C4 crops were enhanced in a range of 6–10% (Kimball 1983). On the
other hand, in a more recent FACE (free air carbon dioxide enrichment) experiment, maize
photosynthesis, biomass and yield were not affected by CO2 elevation. However, a reduced
stomatal conductance was observed in this experiment resulting in decreased plant water loss
(Leakey et al. 2006). That may alleviate the known negative effects of drought on maize plant
growth and grain yield (Azeez et al. 2005; Efeoglu et al. 2009) and contribute to the
maintenance of starch formation and feed value of maize silage. Varying atmospheric CO2
concentration and water activity (aw) were found to influence the growth of fungi from
various genera and to impact the production of several toxic secondary metabolites as
mycotoxins (Magan and Lacey 1984; Cairns-Fuller et al. 2005; Magan et al. 2011). Since the
colonisation of maize kernels by Fusarium spp. was reported to be higher during dry
conditions (Arino and Bullerman 1994), the incidence of Fusarium toxins such as
deoxynivalenol (DON) and zearalenone (ZON) may be increased in periods of drought.
Furthermore, changes of the thermal environment may be associated with alterations in the
activity and the function of the digestive system which are independent of feed intake
(Christopherson and Kennedy 1983) and induce effects on the nutrient digestibility of both
sheep and cattle (Westra and Christopherson 1976; Miaron and Christopherson 1992). It
remains unclear, whether interactions between anticipated future growth conditions of maize
such as increased CO2 concentrations and drought and an altered thermal environment during
the feeding of the generated silages are to be expected. Therefore, the objective of the present
study was to investigate the potential effects and interactions of elevated CO2 and drought
during cultivation on feed value, concentration of selected mycotoxins and nutrient
digestibility of maize silage fed at varying thermal regimes.
2. Materials and methods
2.1. Plant cultivation
The experiment was conducted in 2008 on an experimental field site of the Johann Heinrich
von Thuenen-Institute in Braunschweig, Germany (528180N, 108260E). Agricultural
measures of the 10 ha field site were carried out according to local farm practices. Maize (Zea
mays L., ‘‘Romario’’) was sown on 9 May with a plant density of 10 plants per m2 and a row
distance of 0.75 m. Mineral nutrients were added according to local fertilising practices based
on soil analysis in springtime (Manderscheid et al. 2012). After plant emergence in mid of
May, a FACE system as described in detail by Lewin et al. (1992) was installed. Treatments

Paper I
30
included three rings with blowers and CO2 enrichment to meet a target CO2 concentration of
550 ppm during daylight hours (FACE) and three control rings operated under ambient air
(Control), respectively. The mean seasonal CO2 concentration in the Control treatment was
379 ppm. The rings had a diameter of 20 m and each ring was split into a wellwatered (Well
watered) and a dry semicircular subplot (Drought stress). In the well watered subplots water
content in the 0.6 m soil profile was kept above 50% of maximum plant available soil water
content by drip irrigation. Drought stress was achieved by the operation of rain shelters (Erbs
et al. 2011). The dry subplots received 48% less water than the well watered subplots over the
whole vegetation period (Manderscheid et al. 2012). Whole maize plants (n = 5) were
harvested manually on 6 October from every semicircle within an inner diameter of 16 m and
chopped afterwards. Subsequently, ensiling was executed for at least 12 months in plastic
barrels (O-TopTM Open Head Drums, Mauser AG, Bruehl, Germany) containing a volume of
approximately 0.2 m3 each.
2.2. Balance experiment
A balance experiment, which was approved by the Lower Saxony State Office for Consumer
Protection and Food Safety (LAVES) in Oldenburg, Germany (File number 33.9.42502-
04/060/06), was performed in observance of the European Community regulations concerning
the protection of experimental animals in temperature but not relative humidity (RH)
controlled rooms of the Institute of Animal Nutrition, Friedrich Loeffler Institute, Federal
Research Institute for Animal Health, Braunschweig, Germany. The climatic conditions were
characterized by room temperature [°C] and relative humidity [%], which were combined by
the calculation of temperature humidity indices (THI). Factors were CO2 concentration
(FACE vs. Control) and irrigation (Well watered vs. Drought stress) during plant cultivation
as well as the climatic conditions during the balance experiment (Temperate, temperature 14–
16°C, RH < 50%, THI 57–63; Mild heat, temperature 24–26°C, RH < 50%, THI 68–71;
Severe heat, temperature 34–36°C, RH < 50%, THI 75–80). Room dry bulb temperature (Td)
and relative humidity were recorded every 10 min via data loggers (Tinytag Plus 2, TGP-
4500, Gemini Data Loggers, Chichester, UK). Mean temperature, relative humidity and THI
values met the aimed experimental ranges and were generally characterised by a low variation
(Table 1). The balance experiment was conducted following the guidelines for determining
the digestibility of crude nutrients in ruminants (GfE 1991). Adult castrated male sheep
(German blackheaded mutton sheep) with an initial bodyweight of 100.1 + 7.4 kg were
allocated randomly to experimental groups of four animals each. Both adaptation feeding and

Paper I
31
subsequent sampling periods were performed for seven consecutive days. The animals were
kept in individual boxes during adaptation and were transferred into metabolism cages for
sampling. Individual abdominal fleece lengths were measured prior to each sampling period.
All sheep had free access to water and were fed 1 kg dry matter (DM) of experimental maize
silage and 20 g urea per day and animal, presented in two equal portions at 6:30 h and 13:30
h. Presented diets were consumed completely. Representative samples of maize silages fed
were pooled by daily aliquot retaining. Total faeces were collected daily on an individual
basis to generate collective samples. Both silage and faeces samples were oven-dried (60°C
for 72 h) and then ground to pass through a one mm sieve for further analyses of nutrients and
mycotoxins.
Table 1. Climatic conditions during the balance experiment (Means ± standard error).
Climatic conditions
Climatic conditions Temperate Mild heat Severe heat
Temperature [°C] 15.1 ± 0.01 25.6 ± 0.02 35.1 ± 0.01 Relative humidity [%] 39.6 ± 0.14 23.4 ± 0.10 17.8 ± 0.09 THI* 58.8 ± 0.02 69.5 ± 0.02 78.2 ± 0.03
Notes: *Temperature humidity indices (THI) were calculated according to Hahn (1999): THI = 0.8 • td + RH •
(td - 14.4) + 46.4 where td is the dry bulb temperature [°C] and RH is the relative humidity.
2.3. Analyses
Dry matter (DM), crude ash (Ash), crude fibre (CF), crude protein (CP), ether extract (EE),
neutral detergent fibre (NDF), acid detergent fibre (ADF), acid detergent lignin (ADL) and
starch in maize silage and feces samples were analyzed according to the protocols of the
Association of German Agricultural Analysis and Research Centres (Naumann and Bassler
1993), whereat ADL, ADF and NDF were expressed without residual ash.
DON and ZON in maize silage samples were analysed using HPLC with UV and fluorescence
detection, respectively, after a clean-up of the sample extracts with immunoaffinity columns
(IAC) (DON: DONprepTM
, R-Biopharm Rhone, Darmstadt, Germany. ZON: ZearalatestTM
,
Vicam, Milford, USA) as described in detail in previous publications (Dänicke et al. 2001;
Valenta et al. 2003). The limits of detection were 30 μg kg-1
DM for DON and 1 μg kg-1
DM
for ZON, respectively.
Ochratoxin A (OTA) in silages was analysed by HPLC with fluorescence detection as
described by Valenta et al. (1993) after a clean-up of the sample extracts with IAC
(OtaCLEAN, LC Tech, Dorfen, Germany). The limit of detection was 0.1 μg kg-1
.

Paper I
32
2.4. Calculations
Apparent nutrient digestibility was calculated according to GfE (1991).
Calculated nutrient digestibility was utilized to estimate silage metabolizable energy (ME)
following the regression equation published by GfE (2001):
ME (MJ/kg) = 0.0312 • DEE [g kg-1
] + 0.0136 • DCF [g kg-1
] + 0.0147 × (DOM – DEE –
DCF) [g kg-1
] + 0.00234 • CP [g kg-1
]
where DEE = digestible ether extract, DCF = digestible crude fibre, DOM = digestible
organic matter, CP = crude protein.
THI were calculated according to Hahn (1999):
THI = 0.8 • td + RH • (td - 14.4) + 46.4
where td represents the dry bulb temperature [°C] and RH is the relative humidity expressed
as a decimal.
2.5. Statistical Analysis
Statistical analyses were performed using the software package SAS version 9.1 (SAS
Institute Inc., 2004). Crude nutrient and mycotoxin concentration of the experimental maize
silages were analyzed by the GLM procedure of SAS. The evaluation of nutrient digestibility
and silage ME was conducted utilizing the MIXED procedure. CO2 concentration and
irrigation during plant growth and climatic conditions during the balance experiment were
considered as fixed effects. Interactions between these variables were investigated. The
“random” statement was used for the individual animal effect. Fleece length was included as
covariate. The restricted maximum likelihood method (REML) was used to evaluate
variances. Degrees of freedom were calculated by the Kenward-Roger method. To investigate
differences between means and least square means, the “PDIFF” option was used applying a
Tukey-Kramer test for post-hoc analysis. Differences were considered to be significant at p <
0.05. Trends were declared at p < 0.1.

Paper I
33
3. Results
3.1. Chemical composition
Increased atmospheric CO2 did not affect the concentration of crude protein (p=0.944, Table
2) or the contents of the analysed nutrient and cell wall fractions of the investigated maize
silages. The concentration of starch was not significantly influenced by carbon dioxide
treatments (p=0.642). Drought stress during cultivation resulted in an increased subsequent
silage DM concentration (p=0.002). However, drought stress did not alter the crude nutrient,
cell wall or starch contents of silage DM and no significant CO2 x irrigation interactions were
observed for crude nutrients.
The concentration of DON was generally characterized by a considerable variation. Though
the CO2 treatments did not affect DON significantly, a numerical decrease was observed due
to CO2 enrichment (p=0.058). Drought stress induced a significant increase of DON in silage
DM (p<0.001). Furthermore, the interaction of CO2 concentration and irrigation was found to
be significant for DON, which was subjected to a greater increase due to drought stress in the
Control compared to FACE treatment (p=0.003). Silage ZON was not influenced by CO2
concentration, irrigation or interactions, though it was increased numerically in the maize
silages which were affected by drought stress during growth (p=0.179). OTA was found to be
lower than the limit of detection in all examined samples.
3.2. Nutrient digestibility
Increased atmospheric CO2 and drought stress during plant growth did not significantly alter
the digestibility of the investigated crude nutrient and cell wall fractions or the estimated
silage ME as shown in Table 3. The digestibility of starch was found to be generally almost
100% and was not influenced by treatments. The CO2 x irrigation interaction was significant
for ME content (p=0.014), however the nominal differences between both irrigation
treatments were below 0.15 MJ kg-1
DM each.
The most pronounced effects were conveyed by the thermal environment since the climatic
conditions during the balance experiment had a significant effect on NDF (p=0.005), ADF
(p=0.024) and OM (p=0.023) digestibility as well as on silage ME (p=0.009). The coldest
climate (T) resulted in the lowest digestibility of ADF, NDF and CF. However, the negative
effects of moderate cold on the digestibility of the analysed fibre fractions were not reflected
in OM digestibility. Though the climatic conditions had a significant impact, the numerical
effects were low and the increase of OM digestibility during MH treatment was below 2%.
Consequently, the highest ME was calculated during MH as well.

Paper I
34
No CO2 x climatic conditions interactions were observed. A significant interaction of
irrigation and climatic conditions was calculated for CF digestibility (p=0.012), which was
reduced during T treatment if the plants were grown well watered. Furthermore, undirected
interactions of CO2 concentration, irrigation and climatic conditions were calculated for NDF
(p=0.002) and OM (p=0.020) digestibility as well as for silage ME (p=0.001).
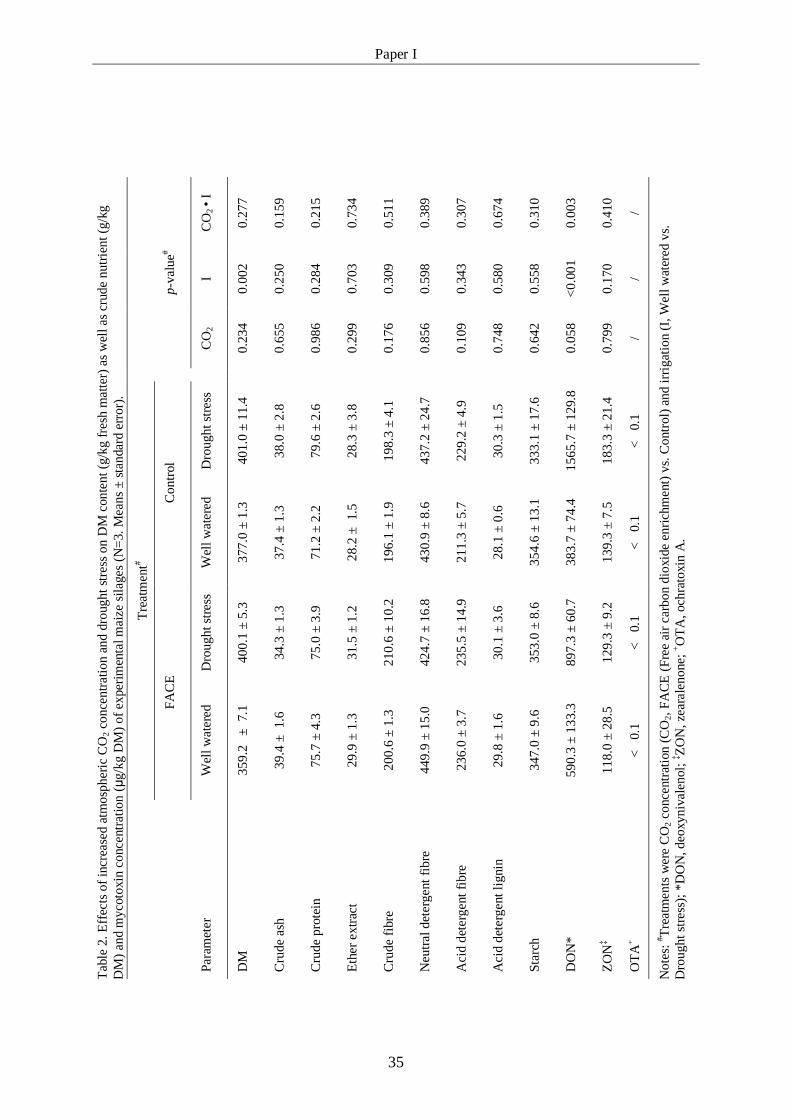
Paper I
35
Tab
le 2
. E
ffec
ts o
f in
crea
sed a
tmosp
her
ic C
O2 c
on
cen
trat
ion a
nd
dro
ug
ht
stre
ss o
n D
M c
on
ten
t (g
/kg
fre
sh m
atte
r) a
s w
ell
as c
rude
nutr
ient
(g/k
g
DM
) an
d m
yco
toxin
conce
ntr
atio
n (μ
g/k
g D
M)
of
exper
imen
tal m
aize
sil
ages
(N
=3.
Mea
ns
± s
tan
dar
d e
rror)
.
p-v
alue#
CO
2 • I
0.2
77
0.1
59
0.2
15
0.7
34
0.5
11
0.3
89
0.3
07
0.6
74
0.3
10
0.0
03
0.4
10
/
No
tes:
#T
reat
men
ts w
ere
CO
2 c
once
ntr
atio
n (
CO
2, F
AC
E (
Fre
e ai
r ca
rbo
n d
ioxid
e en
rich
men
t) v
s. C
ontr
ol)
and i
rrig
atio
n (
I, W
ell
wat
ered
vs.
Dro
ught
stre
ss);
*D
ON
, deo
xyniv
alen
ol;
‡Z
ON
, ze
arale
no
ne;
+O
TA
, och
rato
xin
A.
I
0.0
02
0.2
50
0.2
84
0.7
03
0.3
09
0.5
98
0.3
43
0.5
80
0.5
58
<0.0
01
0.1
70
/
CO
2
0.2
34
0.6
55
0.9
86
0.2
99
0.1
76
0.8
56
0.1
09
0.7
48
0.6
42
0.0
58
0.7
99
/
Tre
atm
ent#
Co
ntr
ol Dro
ug
ht
stre
ss
40
1.0
± 1
1.4
38
.0 ±
2.8
79
.6 ±
2.6
28
.3 ±
3.8
19
8.3
± 4
.1
43
7.2
± 2
4.7
22
9.2
± 4
.9
30
.3 ±
1.5
33
3.1
± 1
7.6
15
65
.7 ±
129.8
18
3.3
± 2
1.4
< 0
.1
Wel
l w
ater
ed
37
7.0
± 1
.3
37
.4 ±
1.3
71
.2 ±
2.2
28
.2 ±
1.5
19
6.1
± 1
.9
43
0.9
± 8
.6
21
1.3
± 5
.7
28
.1 ±
0.6
35
4.6
± 1
3.1
38
3.7
± 7
4.4
13
9.3
± 7
.5
< 0
.1
FA
CE
Dro
ug
ht
stre
ss
40
0.1
± 5
.3
34
.3 ±
1.3
75
.0 ±
3.9
31
.5 ±
1.2
21
0.6
± 1
0.2
42
4.7
± 1
6.8
23
5.5
± 1
4.9
30
.1 ±
3.6
35
3.0
± 8
.6
89
7.3
± 6
0.7
12
9.3
± 9
.2
< 0
.1
Wel
l w
ater
ed
35
9.2
±
7.1
39
.4 ±
1.6
75
.7 ±
4.3
29
.9 ±
1.3
20
0.6
± 1
.3
44
9.9
± 1
5.0
23
6.0
± 3
.7
29
.8 ±
1.6
34
7.0
± 9
.6
59
0.3
± 1
33.3
11
8.0
± 2
8.5
< 0
.1
Par
amet
er
DM
Cru
de
ash
Cru
de
pro
tein
Eth
er e
xtr
act
Cru
de
fibre
Neu
tral
det
ergen
t fi
bre
Aci
d d
eter
gen
t fi
bre
Aci
d d
eter
gen
t li
gnin
Sta
rch
DO
N*
ZO
N‡
OT
A+

Paper I
36
Tab
le 3
. E
ffec
ts o
f in
crea
sed a
tmosp
her
ic C
O2 c
once
ntr
atio
n a
nd d
rought
stre
ss d
uri
ng m
aize
cult
ivat
ion a
nd c
lim
atic
condit
ions
duri
ng b
alan
ce s
tudie
s on a
ppar
ent
nutr
ien
t dig
esti
bil
ity (
% D
M)
and m
etab
oli
zable
ener
gy (
MJ
kg
-1 D
M)
of
mai
ze s
ilag
es (
LS
mea
ns
± s
tandar
d e
rror)
.
Par
amet
er*
ME
10.0
± 0
.2
10.5
± 0
.2
10.4
± 0
.3
10.7
± 0
.3
10.7
± 0
.2
10.3
± 0
.2
10.8
± 0
.2
11.1
± 0
.2
10.3
± 0
.2
10.5
± 0
.3
10.6
± 0
.2
10.7
± 0
.2
0.3
23
0.8
39
0.0
09
0.0
14
0.9
14
0.1
30
0.0
01
Note
s: #
Tre
atm
ents
wer
e C
O2 c
once
ntr
atio
n (
CO
2, F
AC
E (
Fre
e ai
r ca
rbon d
ioxid
e en
rich
men
t) v
s. C
ontr
ol)
and I
rrig
atio
n (
I, W
ell
wat
ered
(W
W)
vs.
Dro
ught
stre
ss
(DS
)) d
uri
ng m
aize
cult
ivat
ion a
nd c
lim
atic
condit
ions
duri
ng b
alan
ce s
tudie
s (C
C;
T, te
mper
ate;
MH
, m
ild h
eat;
SH
, se
ver
e he
at);
*C
F D
, cr
ude f
ibre
dig
esti
bil
ity;
ND
F
D,
neu
tral
det
ergen
t fi
bre
dig
esti
bil
ity;
AD
F D
, ac
id d
eter
gen
t fi
bre
dig
esti
bil
ity;
Sta
rch D
, st
arch
dig
esti
bil
ity;
OM
D, org
anic
mat
ter
dig
esti
bil
ity;
ME
, m
etab
oli
zable
ener
gy.
OM
D
67.8
± 1
.6
71.9
± 1
.8
70.4
± 2
.1
72.0
± 1
.9
72.7
± 1
.5
70.6
± 1
.5
73.9
± 1
.4
75.1
± 1
.5
70.6
± 1
.8
72.6
± 1
.9
72.7
± 1
.8
73.2
± 1
.8
0.2
34
0.7
26
0.0
23
0.0
72
0.3
28
0.1
96
0.0
20
Sta
rch D
99.0
± 0
.3
98.8
± 0
.3
99.4
± 0
.4
99.2
± 0
.3
99.3
± 0
.3
99.0
± 0
.3
99.7
± 0
.3
99.5
± 0
.3
99.6
± 0
.3
99.6
± 0
.3
99.6
± 0
.3
99.7
± 0
.3
0.1
68
0.8
30
0.4
78
0.6
23
0.7
97
0.2
49
0.1
16
AD
F D
41
.2 ±
3.6
50
.5 ±
4.0
50
.2 ±
4.7
47
.9 ±
4.2
51
.4 ±
3.3
54
.4 ±
3.4
48
.0 ±
3.0
53
.7 ±
3.4
46
.6 ±
4.0
51
.7 ±
4.1
54
.8 ±
3.9
55
.5 ±
3.9
0.5
04
0.3
50
0.0
24
0.8
03
0.1
07
0.2
18
0.4
58
ND
F D
45
.9 ±
2.9
55
.6 ±
3.3
56
.5 ±
3.8
52
.5 ±
3.4
51
.7 ±
2.7
55
.0 ±
2.8
55
.3 ±
2.5
59
.2 ±
2.8
53
.5 ±
3.3
50
.5 ±
3.4
58
.7 ±
3.2
59
.7 ±
3.2
0.3
11
0.9
21
0.0
05
0.9
94
0.1
92
0.2
07
0.0
02
CF
D
47
.3 ±
3.1
55
.6 ±
3.4
54
.6 ±
3.9
58
.4 ±
3.7
56
.5 ±
2.9
59
.8 ±
3.0
52
.9 ±
2.7
59
.2 ±
2.9
54
.7 ±
3.3
55
.8 ±
3.5
57
.3 ±
3.4
60
.3 ±
3.4
0.6
99
0.2
62
0.0
55
0.0
86
0.7
02
0.0
12
0.2
38
Tre
atm
ent#
CC
T
MH
SH
T
MH
SH
T
MH
SH
T
MH
SH
I
WW
DS
WW
DS
CO
2
FA
CE
Contr
ol
p-v
alue
CO
2
I
CC
CO
2 •
I
CO
2 •
CC
I •
CC
CO
2 •
I •
CC

Paper I
37
4. Discussion
4.1. Chemical composition
Intensified recent research was conducted in order to investigate the responses of
photosynthesis and growth of C4 plants to increasing atmospheric CO2 (Leakey et al. 2006;
Prasad et al. 2009). However information about effects on chemical composition and feed
value of C4 plants are rare. For example, the protein concentrations of various plant parts of
sudangrass (Sorghum bicolor L.) except stem protein were generally not affected by CO2
enrichment (Akin et al. 1994). That is coherent with the results obtained in the present study
since the crude protein content of the analysed whole plant maize silages was not influenced
by CO2 enrichment. Considering the distinctly decreased protein concentrations of C3 plants
due to elevated atmospheric CO2 (Weigel and Manderscheid 2005), an unaltered protein
content may be regarded as a positive aspect for the future feed value of maize silage.
Nevertheless, the exposure to atmospheres characterized by high CO2 concentrations
exceeding 1000 ppm as expected by the end of the century (IPCC 2007) might affect the
protein contents of whole maize plants because under controlled environmental conditions a
significant reduction of maize leaf protein was reported due to a treatment of 1100 ppm CO2
(Maroco et al. 1999). The lack of effects of elevated CO2 on maize silage fibre content in the
present trial is congruent with previous results since the concentrations of different fibre
compounds in sugarcane (Saccharum officinarum L.) (De Souza et al. 2008), sudangrass
(Akin et al. 1994) and various C4 grasses (Barbehenn et al. 2004) were generally not
influenced by rising CO2. Furthermore, the content of starch was not affected by elevated
atmospheric CO2 as reported for different C4 species by Barbehenn et al. (2004).
In the present study, the successful induction of restricted water availability was reflected by a
significant reduction of silage water content due to drought stress treatment. Nevertheless, the
crude nutrient contents of the analysed DM were not affected and hence no indication for a
decreased feed value was observed. In maize, drought was reported to decrease grain number
per ear (Boyer and Westgate 2004) and deplete the intermediates of starch synthesis
(Zinselmeier et al. 1999). This has also been observed in the present study, in which grain
yield was decreased under drought by 35% in the Control CO2 treatment and by 8% in the
FACE treatment (Manderscheid et al. 2012). A reduced plant water loss due to elevated CO2
(Leakey et al. 2006; Ghannoum 2009) may theoretically mitigate the potentially adverse
effects of drought stress on the chemical composition of maize silage. Actually, in the present
study under drought stress and Control CO2 crude protein content increased and starch

Paper I
38
content decreased as compared to the other treatments. However, these changes were small
and not significant. Thus, the water deficit might have been to low to result in considerable
alterations of the crude nutrient contents.
In several experiments, the growth of various fungi species and subsequent mycotoxin
production in different media were inhibited by very high CO2 concentrations (Cairns-Fuller
et al. 2005; Giorni et al. 2008). Paster and Bullerman (1988) suggested that rather the
biosynthetic pathways for the production of mycotoxins than fungal growth may be blocked
by high CO2 levels. However, 800 to 1000 ppm was discussed to be unproblematic for
mycotoxigenetic fungi (Magan et al. 2011). Accordingly, increasing the atmospheric CO2
concentration to 550 ppm had only a numerical effect on silage DON concentration and did
not impact silage ZON in the present study. Drought stress was reported to increase Fusarium
spp. colonization of maize kernels (Arino and Bullerman 1994). Therefore, the more than
twofold increase of DON due to restricted water availability may represent an indication for
plant drought stress supporting maize infection by Fusarium fungi and DON formation.
However, maize aw was sufficient to enable Fusarium proliferation and mycotoxin production
since severe osmotic and matric water stress were reported to lag the germination of Fusarium
graminearum (Ramirez et al. 2004) and extreme drought will likely impact mycotoxigenetic
fungi (Magan et al. 2011). CO2 enrichment resulted in a reduced DON concentration in
ensiled maize samples which were exposed to drought stress during growth. Considering the
improbability of direct CO2 effects on fungal growth and mycotoxin production a decreased
plant water loss due to increased CO2 as observed in previous experiments (Leakey et al.
2006) may have alleviated the impacts of the generated drought stress and thus counteracted
plant infection by Fusarium fungi and the production of DON indirectly. Accordingly, DON
was not reduced by CO2 enrichment in the absence of drought and the different DON
contaminations of the silages grown under well watered conditions may rather reflect natural
variations. In general, the susceptibility of ruminants to DON is known to be relatively low
and, for example, feeding lambs with a diet containing 15.6 mg DON/kg feed was not related
to adverse effects on performance parameters (Harvey et al. 1986). Thus, the considerably
lower concentrations of DON in the silages fed in the present experiment were not reflected in
effects on the digestibility of the investigated nutrients and may not be problematic for adult
sheep during short term exposure.

Paper I
39
4.2. Nutrient digestibility
In an experiment of Simsek et al. (2011), drought stress was reported to affect the in vitro DM
digestibility of maize silage. Nevertheless, the absence of effects of both drought stress and
CO2 enrichment on the digestibility of the investigated nutrients was consistent since both
factors did not alter the crude nutrient contents of the investigated silage DM. If the
physiological mechanisms of sheep fail to negate the heat load during periods of elevated
ambient temperatures, such exposure evokes a series of drastic changes in the biological
functions, which include alterations in feed efficiency and utilization (Marai et al. 2007). In
several experiments, warmer environmental conditions were observed to increase the
digestibility of plant cell walls or DM of diets fed to both sheep (Westra and Christopherson
1976) and cattle (Miaron and Christopherson 1992). Similar positive effects of body heat
increment were observed in the present study since the coldest experimental treatment
resulted in the lowest digestibility of NDF, ADF and CF, respectively. However these
alterations were not reflected in OM digestibility, which was highest during MH treatment
indicating a compensation of the adverse effects of the colder climate on fibre digestibility by
an increased digestibility of other constituents. Christopherson and Kennedy (1983) suggested
that decreases in diet digestibility caused by exposure of ruminants to low environmental
temperatures are related to increases in the rate of passage of ingesta through the
gastrointestinal tract induced by enhanced motility and, in contrast, opposite changes in these
parameters appear to occur in response to heat stress. Accordingly, the retention time of
ingesta in Suffolk wethers was reported to decrease from 38.5 h in a warm environment to
32.5 h in a cold treatment (Westra and Christopherson 1976). In the same experiment, the
mean number of reticulum contractions was found to increase from 60 at 21.2 °C to 72.5 at
1.3 °C. However, the thermal environment does not necessarily affect the digestibility of
ruminant diets. In a recent experiment, Lourenco et al. (2010) investigated the effects of two
temperature treatments (25.0±0.26 °C vs. 10.8±0.01 °C) and did not observe significant
alterations of DM or NDF digestibility using ewes from different breeds. Christopherson and
Kennedy (1983) suggested that the magnitude of temperature changes in several experiments
may not be large enough to cause measurable alterations in digestion.
5. Conclusions
An increased atmospheric CO2 concentration of 550 ppm did not affect the feed value of
whole plant maize silage. Furthermore, the effects of drought stress on the chemical
composition of silage DM were generally low and did not indicate considerable alterations of

Paper I
40
the nutritive value. CO2 enrichment may reduce the DON content of maize silage which can
be increased in periods of drought. In sheep, the thermal environment may influence both OM
and fibre digestibility of maize silage. Based on the present experiment, no interactions of
altered ambient temperatures during feeding of sheep and changed growth conditions of
maize silage are to be expected. Further investigations of the effects of increased atmospheric
CO2 should preferably consider continuous and long-term elevations potentially exceeding
1000 ppm by the end of the century.
Acknowledgements
The study was supported by the Ministry for Science and Culture of Lower Saxony within the
network KLIFF – climate impact and adaptation research in Lower Saxony. Furthermore, the
assistance of the co-workers of the Institute of Animal Nutrition and the Experimental Station
of the Friedrich-Loeffler-Institute in Braunschweig, Germany in performing experiment and
analysis and the provision of FACE maize samples by the staff of the Institute of Biodiversity,
Johann Heinrich von Thuenen-Institute, Federal Research Institute for Rural Areas, Forestry
and Fisheries in Braunschweig, Germany is gratefully acknowledged.
References
Akin DE, Kimball BA, Mauney JR, LaMorte RL, Hendrey GR, Lewin K, Nagy J, Gates RN.
1994. Influence of enhanced CO2 concentration and irrigation on Sudangrass
digestibility. Agr Forest Meteorol. 70:279-287.
Arino AA, Bullerman LB. 1994. Fungal colonization of corn grown in Nebraska in relation to
year, genotype and growing conditions. J Food Protect. 57:1084-1087.
Azeez JO, Chikoye D, Kamara AY, Menkir A, Adetunji MT. 2005. Effect of drought and
weed management on maize genotypes and the tensiometric soil water content of an
eutric nitisol in South Western Nigeria. Plant Soil. 276:61-68.
Barbehenn RV, Chen Z, Karowe DN, Spickard A. 2004. C-3 grasses have higher nutritional
quality than C-4 grasses under ambient and elevated atmospheric CO2. Global Change
Biol.10:1565-1575.
Boyer JS, Westgate ME. 2004. Grain yields with limited water. J Exp Bot. 55:2385-2394.
Cairns-Fuller V, Aldred D, Magan N. 2005. Water, temperature and gas composition
interactions affect growth and Ochratoxin A production by isolates of Penicillium
verrucosum on wheat grain. J Appl Microbiol. 99:1215-1221.

Paper I
41
Christopherson RJ, Kennedy PM. 1983. Effect of the thermal environment on digestion in
ruminants. Can J Anim Sci. 63:477-496.
Dänicke S, Überschär KH, Halle I, Valenta H, Flachowsky G. 2001. Excretion kinetics and
metabolism of zearalenone in broilers in dependence on a detoxifying agent. Arch Anim
Nutr. 55:299-313.
De Souza AP, Gaspar M, Da Silva EA, Ulian EC, Waclawovsky AJ, Nishiyama MY, Dos
Santos RV, Teixeira MM, Souza GM, Buckeridge MS. 2008. Elevated CO2 increases
photosynthesis, biomass and productivity and modifies gene expression in sugarcane.
Plant Cell Environ. 31:1116-1127.
Efeoglu B, Ekmekci Y, Cicek N. 2009. Physiological responses of three maize cultivars to
drought stress and recovery. S Afr J Bot. 75:34-42.
Erbs M., Manderscheid R, Weigel HJ. 2011. A combined rain shelter and free-air CO2
enrichment system to study climate change impacts on plants in the field. Methods Ecol
Evol. (in press).
GfE (Gesellschaft für Ernährungsphysiologie). 1991. Guidelines for determining the
digestibility of crude nutrients in ruminants. J Anim Physiol An N. 65:229-234.
GfE (Gesellschaft für Ernährungsphysiologie). 2001. Empfehlungen zur Energie- und
Nährstoffversorgung der Milchkühe und Aufzuchtrinder. DLG-Verlags GmbH,
Frankfurt am Main.
Ghannoum O. 2009. C-4 photosynthesis and water stress. Ann Bot. 103:635-644.
Giorni P, Battilani P, Pietri A, Magan N. 2008. Effect of a(w) and CO2 level on Aspergillus
flavus growth and aflatoxin production in high moist-Lire maize post-harvest. Int J
Food Microbiol. 122:109-113.
Hahn GL. 1999. Dynamic responses of cattle to thermal heat loads. J Anim Sci. 77:10-20.
Harvey RB, Kubena LF, Corrier DE, Witzel DA, Phillips TD, Heidelbaugh ND. 1986. Effects
of Deoxynivalenol in A Wheat Ration Fed to Growing Lambs. Am J Vet Res. 47:1630-
1632.
IPCC. 2007. Climate change 2007: The physical science basis. Summary for policy makers.
Contribution of working group 1 to the fourth assessment report of the
intergovernmental panel on climate change. Cambridge University press, Cambridge
and New York.
Kimball BA. 1983. Carbon-dioxide and agricultural yield - An assemblage and analysis of
430 prior observations. Agron J. 75:779-788.

Paper I
42
Korosteleva SN, Smith TK, Boermans HJ., 2007. Effects of feedborne fusarium mycotoxins
on the performance, metabolism, and immunity of dairy cows. J Dairy Sci. 90:3867-
3873.
Leakey ADB, Uribelarrea M, Ainsworth EA, Naidu SL, Rogers A, Ort DR., Long SP. 2006.
Photosynthesis, productivity, and yield of maize are not affected by open-air elevation
of CO2 concentration in the absence of drought. Plant Physiol. 140:779-790.
Lewin KF, Hendrey GR, Kolber Z. 1992. Brookhaven National Laboratory Free-Air Carbon-
Dioxide Enrichment Facility. Crit Rev Plant Sci. 11:135-141.
Lourenco AL, Cone JW, Fontes P, Dias-da-Silva, AA. 2010. Effects of ambient temperature
and soybean meal supplementation on intake and digestion of two sheep breeds
differing in mature size. J Anim Physiol Anim Nutr. 94:571-583.
Magan N, Lacey J. 1984. Effects of Gas-Composition and Water Activity on Growth of Field
and Storage Fungi and Their Interactions. T Brit Mycol Soc. 82:305-314.
Magan N, Medina A, Aldred D. 2011. Possible climate-change effects on mycotoxin
contamination of food crops pre- and postharvest. Plant Pathol. 60: 150-163.
Manderscheid R, Erbs M, Weigel HJ. 2012. Interactive effects of free-air CO2 enrichment and
drought stress on maize growth. Eur J Agron. in press.
Marai IFM, El-Darawany, AA, Fadiel A., Abdel-Hafez MAM. 2007. Physiological traits as
affected by heat stress in sheep – A review. Small Ruminant Res. 71:1-12.
Maroco JP, Edwards GE, Ku MSB. 1999. Photosynthetic acclimation of maize to growth
under elevated levels of carbon dioxide. Planta. 210:115-125.
Miaron JOO, Christopherson RJ. 1992. Effect of Prolonged Thermal Exposure on Heat-
Production, Reticular Motility, Rumen-Fluid and Rumen-Particulate Passage-Rate
Constants, and Apparent Digestibility in Steers. Can J Anim Sci. 72:809-819.
Naumann C, Bassler R. 1993. Die chemische Untersuchung von Futtermitteln. Methodenbuch
Bd. 3 mit Ergänzungslieferungen 1983,1988,1993, 1997, 2004 und 2006. VDLUFA-
Verlag, Darmstadt.
Paster N, Bullerman LB. 1988. Mold Spoilage and Mycotoxin Formation in Grains As
Controlled by Physical Means. Int J Food Microbiol. 7:257-265.
Prasad PVV, Vu JCV, Boote KJ, Allen LH. 2009. Enhancement in leaf photosynthesis and
upregulation of Rubisco in the C4 sorghum plant at elevated growth carbon dioxide and
temperature occur at early stages of leaf ontogeny. Funct Plant Biol. 36:761-769.

Paper I
43
Ramirez ML, Chulze SN, Magan N. 2004. Impact of osmotic and matric water stress on
germination, growth, mycelial water potentials and endogenous accumulation of sugars
and sugar alcohols in Fusarium graminearum. Mycologia. 96:470-478.
SAS Institute Inc, 2004. SAS/STAT 9.1 User’s Guide. SAS Inst., Inc., Cary, NC.
Simsek M, Can A, Denek N, Tonkaz T. 2011. The effects of different irrigation regimes on
yield and silage quality of corn under semi-arid conditions. Afr J Biotechnol. 10:5869-
5877.
Valenta H, Dänicke S, Döll S. 2003. Analysis of deoxynivalenol and de-epoxy-
deoxynivalenol in animal tissues by liquid chromatography after clean-up with an
immunoaffinity column. Mycotox Res. 19:51-55.
Valenta H, Kuhn I, Rohr K. 1993. Determination of Ochratoxin-A in Urine and Feces of
Swine by High-Performance Liquid-Chromatography. J Chromatogr-Biomed. 613:295-
302.
Weigel HJ, Manderscheid R. 2005. CO2 enrichment effects on forage and grain nitrogen
content of pasture and cereal plants. J Crop Impr. 13:73-89.
Westra R, Christopherson RJ. 1976. Effects of Cold on Digestibility, Retention Time of
Digesta, Reticulum Motility and Thyroid-Hormones in Sheep. Can J Anim. Sci. 56:699-
708.
Zinselmeier C, Jeong BR, Boyer JS. 1999. Starch and the control of kernel number in maize
at low water potentials. Plant Physiol. 121:25-35.

Paper II
44
Paper II
Effects of the thermal environment on metabolism of deoxynivalenol and
thermoregulatory response of sheep fed on corn silage grown at enriched
atmospheric carbon dioxide and drought
Malte Lohölter1, Ulrich Meyer
1, Susanne Döll
1, Remy Manderscheid
2, Hans-Joachim
Weigel2, Martin Erbs
2, Martin Höltershinken
3, Gerhard Flachowsky
1, Sven Dänicke
1
1Institute of Animal Nutrition, Friedrich-Loeffler-Institute (FLI), Federal Research Institute
for Animal Health, Brunswick, Germany
2Institute of Biodiversity, Johann Heinrich von Thünen-Institute (VTI), Federal Research
Institute for Rural Areas, Forestry and Fisheries, Brunswick, Germany
3Clinic for Cattle, University of Veterinary Medicine Hanover, Foundation, Germany
Mycotoxin Research
Accepted

Paper II
45
Abstract
Future livestock production is likely to be affected by both rising ambient temperatures and
indirect effects mediated by modified growth conditions of feed plants such as increased
atmospheric CO2 concentrations and drought. Corn was grown at elevated CO2 concentrations
of 550 ppm and drought stress using free air carbon dioxide enrichment technology. Whole
plant silages were generated and fed to sheep kept at three climatic treatments. Differential
blood count was performed. Plasma DON and de-epoxy-DON concentration were measured.
Warmer environment increased rectal and skin temperatures and respiration rates (p<0.001
each) but did not affect blood parameters and the almost complete metabolization of DON
into de-epoxy-DON. Altered growth conditions of the corn fed did not have single effects on
sheep body temperature measures and differential blood count. Though the thermoregulatory
activity of sheep was influenced by the thermal environment, the investigated cultivation
factors did not indicate considerable impacts on the analysed parameters.
Keywords: Heat stress, CO2 concentration, drought, sheep, deoxynivalenol
Introduction
Changing future climate will likely affect both livestock production and growth conditions of
cereal and pasture plant species. The atmospheric CO2 concentration has risen from a
preindustrial level of about 280 parts per million (ppm) to a current value of approximately
390 ppm and is predicted to exceed 700 ppm by the end of the century. These processes are
forecasted to be accompanied by further elevations of the global surface temperature in the
range of 1.8 – 4°C until 2090-2099, depending on the future greenhouse emission scenario.
Furthermore, increased drought is likely to occur in different regions throughout the world
(IPCC 2007).
Rising future ambient temperatures will likely increase the incidence of heat stress especially
in free-ranging farm animals such as sheep as heat stress is initiated if a combination of
environmental conditions cause the effective temperature of the environment to be higher than
the thermo-neutral zone of an animal (Bianca 1962). The exposure of sheep to heat stress
evokes a series of drastic changes in the biological functions, which include decreases in feed
intake, disturbances in water, protein, energy and mineral balances, enzymatic reactions,
hormonal secretion and blood metabolites (Marai et al. 2007).
Such direct effects of changing environmental conditions on sheep will likely be accompanied
by indirect impacts mediated by differing quantity and quality of feed. Rising atmospheric
Paper II
46
CO2 concentrations were found to stimulate yields but to reduce grain and forage protein
concentrations of C3 crops and to alter the contents of various essential minerals
(Manderscheid et al. 2009; Porteaus et al. 2009; Yang et al. 2007). Information about
responses of C4 plants such as corn (Zea mays L.) to elevated CO2 is limited but of immense
importance since corn silage is used prevalently as a main constituent of ruminant diets to
meet the energy requirements of high-yielding animals. Substantial changes in diet
formulation can affect the body temperature of both cattle (O`Kelly 1987) and sheep
(Sudarman and Ito 2000) and thus may interact with rising ambient temperatures. The
photosynthesis of C4 crops is likely to be saturated at ambient CO2 concentrations (Ghannoum
2009) and therefore the impact of increasing CO2 may be limited. Corn photosynthesis,
biomass and yield were reported to be unaffected under sufficient water supply using free air
carbon dioxide enrichment (FACE) technology (Leakey et al. 2006) but were stimulated in
periods of drought stress (Ghannoum 2009) potentially due to a decreased stomatal
conductance. Therefore increased atmospheric CO2 may reduce the adverse effects of drought
on corn plant growth and grain yield which were described previously (Azeez et al. 1994;
Efeoglu et al. 2009). Furthermore, both varying atmospheric CO2 concentrations and water
availability were reported to affect the growth of fungi from various genera in different media
and to influence the production of several toxic secondary metabolites such as mycotoxins
(Cairns-Fuller et al. 2005; Magan et al. 2011). The incidence of Fusarium toxins such as
deoxynivalenol (DON) may increase in periods of drought since corn is known to be
susceptible to infection during plant drought stress and accordingly the colonization of corn
kernels by Fusarium spp. was reported to be higher during dry conditions (Arino and
Bullerman 1994). Though in ruminants DON is converted almost completely into the less
toxic metabolite de-epoxy-DON (Fink-Gremmels 2008; Seeling et al. 2006), the intake of
high concentrations of DON may affect metabolism and immunological parameters of dairy
cows (Korosteleva et al. 2007; Korosteleva et al. 2009). It is unclear, whether the capacity of
the conversion of DON in ruminants may be impaired by increased ambient temperatures and
associated heat stress.
The objective of the present study was to investigate the effects of the thermal environment
on the metabolism of DON and thermoregulatory and blood parameters of sheep considering
indirect influences possibly mediated by increased atmospheric CO2 concentration and
drought stress during the growth of whole corn plants fed as silage.

Paper II
47
Materials and methods
The present study was a part of the experiment described by Lohölter et al. (2012).
Plant cultivation
Plants were cultivated in 2008 on an experimental field site of the Johann Heinrich von
Thünen-Institute in Brunswick, Germany (52°18´N, 10°26´E). Agricultural measures of the
10 hectare field site were carried out according to local farm practices. Corn (Zea mays L.,
variety “Romario”) was sown at May 9 with a plant density of 10 plants m-2
. Mineral
nutrients were added according to local fertilizing practices based on soil analysis in
springtime (Manderscheid et al. 2012). After plant emergence in mid of May a FACE system
as described in detail by Lewin et al. (1992) was installed. Treatments included three rings
with blowers and CO2 enrichment to meet a target CO2 concentration of 550 ppm during
daylight hours (FACE) and three control rings operated under ambient air (Control),
respectively. Mean seasonal CO2 concentration in the Control treatment was 379 ppm. The
rings had an outer diameter of 20 m and each ring was splitted into a well-watered (Well
watered) and a dry semicircular subplot (Drought stress). In the well watered subplots water
content in the upper 0.6 m soil profile was kept above 50% of maximum plant available soil
water content by drip irrigation. Drought stress was achieved by the operation of rain shelters
(Erbs et al. 2011). The dry subplots received 48% less water than the well watered subplots
over the whole vegetation period (Manderscheid et al. 2012).
Whole corn plants were harvested manually on October 6 from every semicircle within an
inner diameter of 16 m and chopped afterwards. Subsequently, ensiling was executed for at
least 12 months in plastic barrels (O-TopTM
Open Head Drums, Mauser AG, Bruehl,
Germany) containing a volume of approximately 0.2 m3 each.
Experimental design
In a feeding experiment, the produced corn silages were fed to sheep which were subjected to
three climatic treatments (Table 1). Accordingly, the three experimental factors were CO2
concentration (FACE vs. Control) and irrigation (Well watered vs. Drought stress) during
plant growth as well as the climatic conditions during the feeding experiment (Temperate:
Temperature 14–16°C, relative humidity (RH)<50%, temperature humidity index (THI) 57–
63; Mild heat: Temperature 24–26°C, RH<50%, THI 68–71; Severe heat: Temperature 34–
36°C, RH<50%, THI 75–80).

Paper II
48
Table 1 Climatic conditions during the feeding experiments (Means ± standard error)
Treatmenta Temperature (°C) RH (%) THIb
T 15.1±0.01 39.6±0.1 58.8±0.02
MH 25.6±0.02 23.4±0.1 69.5±0.02
SH 35.1±0.01 17.8±0.1 78.2±0.03 a: T, temperate; MH, mild heat; SH, severe heat b: Temperature humidity indices (THI) were calculated according to Hahn (1999): THI = 0.8 × td + RH × (td - 14.4) + 46.4
Animals and sampling
The feeding experiment was performed in temperature but not relative humidity controlled
rooms of the Institute of Animal Nutrition, Friedrich-Loeffler-Institute, Federal Research
Institute for Animal Health, Brunswick, Germany, following the guidelines for determining
the digestibility of crude nutrients in ruminants (GfE 1991). Room dry bulb temperature (Td)
and relative humidity were recorded every 10 minutes using data loggers (Tinytag Plus 2,
TGP-4500, Gemini Data Loggers, Chichester, United Kingdom).
Adult castrated male sheep (German blackheaded mutton sheep) with an initial bodyweight of
100.1±7.4 kg were allocated randomly to experimental groups of 4 animals each. Both
adaptation feeding and subsequent sampling periods were performed for 7 consecutive days.
The animals were kept in individual boxes during adaptation and were transferred into
metabolism cages for sampling. Individual abdominal fleece length was measured prior to
each sampling period. All sheep had free access to water and were fed on 1 kg dry matter
(DM) experimental corn silage and 20 g urea per day and animal, presented in 2 equal
portions at 6.30 h and 13.30 h. All presented diets were consumed completely. Daily water
usage was recorded manually. Representative samples of corn silages fed were pooled by
daily aliquot retaining. Silage samples were oven-dried (60°C for 72 h) and then ground to
pass through a 1 mm sieve for further analyses.
Rectal temperature, skin temperature and respiration rate were measured twice daily on day 3,
4, 5 and 6 of each sampling period between 9:00 and 11:00 h and between 15:00 and 17:00 h,
respectively. Rectal temperature was determined by digital thermometry (Digitemp Servoprax
E315, Servopax GmbH, Wesel, Germany). Skin temperature was measured at the left
abdomen on a spot shaved prior to each sampling period using an infrared thermometer
(Fluke 561, Fluke Corporation, Everett, WA, USA). Blood samples were obtained from the
Vena jugularis externa directly after the last experimental morning feeding at 7.30 h. Whole
blood and plasma (Heparin) samples were gained. Plasma was stored at –20°C for further
analyses.

Paper II
49
The effects of atmospheric CO2 concentration and irrigation during plant growth on silage
crude nutrient content and the concentration of DON were described previously (Lohölter et
al. 2012). The crude nutrient content of silage DM was not affected by both treatments and is
presented in Table 2. Both a significant effect of drought stress and an interaction of CO2 and
irrigation on silage DON concentration were observed resulting in the following DON
contaminations of the corn silages fed (Means ± Standard Error, referring to DM):
FACE/Well watered: 590±133 μg kg-1
, FACE/Drought stress: 897±60 μg kg-1
, Control/Well
watered: 384±74 μg kg-1
, Control/Drought stress 1566±130 μg kg-1
.
Table 2 Crude nutrient content (g kg-1 DM) and metabolizable energy (MJ kg-1 DM) of experimental corn
silages (Means ± standard error)
Treatmenta Parameterb
CO2 I CP EE CF NDF ADF Starch ME
FACE WW 75.7±4.3 29.9±1.3 201±1 450±15 236±4 347±10 10.3±0.2
DS 75.0±3.9 31.5±1.2 211±10 425±17 236±15 353±9 10.6±0.2
Control WW 71.2±2.2 28.2±1.5 196±2 431±9 211±6 355±13 10.7±0.2 DS 79.6±2.6 28.3±3.8 198±4 437±25 229±5 333±18 10.6±0.2
a: Treatments were CO2 concentration (CO2, FACE vs. Control) and Irrigation (I, Well watered (WW) vs.
Drought stress (DS)) during cultivation
b: CP, crude protein; EE, ether extract; CF, crude fibre; NDF, neutral detergent fibre; ADF, acid detergent fibre;
ME = Metabolizable energy, calculation based on nutrient digestibilitites measured with wethers (GfE 1991)
Analyses
Dry matter (DM), crude ash (Ash), crude fibre (CF), crude protein (CP), ether extract (EE),
neutral detergent fibre (NDF), acid detergent fibre (ADF), acid detergent lignin (ADL) and
starch in corn silage samples were analyzed according to the protocols of the Association of
German Agricultural Analysis and Research Centres (Naumann and Bassler 1993), whereat
ADL, ADF and NDF were expressed without residual ash.
Total leukocytes were counted manually in stained whole blood samples using an improved
Neubauer counting chamber (Carl Roth GmbH + Co. KG, Karlsruhe, Germany) and Türk`s
solution (VWR International GmbH, Darmstadt, Germany). Stained whole blood smears were
generated on microscope slides to perform manual 200-cell differential counts.
Plasma samples were analysed for DON and de-epoxy-DON after incubation with 6000 U ß-
glucuronidase (Type H-2, min. 98800U/ml, Sigma, Steinheim, Germany) at pH 5.5 (Acetate
buffer) and 37°C overnight. Samples were extracted on ChemElut columns (Varian,
Darmstadt, Germany) and cleaned up with immunoaffinity columns (IAC) (DONtest, Vicam,
Watertown, USA) before analysis by LC-ESI-MS/MS (liquid chromatography-electrospray
ionization tandem mass spectrometry, API 4000 QTrap, Applied Biosystems, Darmstadt,

Paper II
50
Germany, coupled with a 1200 series HPLC system, Aligent Technologies, Böblingen,
Germany) as described by Döll at al. (2009). The limit of detection for both DON and de-
epoxy-DON was 0.2 ng ml-1
. The mean recovery was 94% for DON and 97% for de-epoxy-
DON, respectively. Analytical results were not corrected for recovery.
Calculations
Temperature humidity indices (THI) were calculated according to Hahn (1999):
THI = 0.8 × td + RH × (td - 14.4) + 46.4
where td represents the dry bulb temperature (°C) and RH (%) is the relative humidity
expressed as a decimal.
The metabolization rate of DON was calculated following Keese et al. (2008) as the ratio of
the De-epoxy-DON-concentration in plasma and the sum of both DON and De-epoxy-DON
concentration in plasma and expressed as a percentage.
Daily DON intake was calculated as the ratio of daily DON intake and individual bodyweight.
Statistical analyses
Statistical analyses were performed using the software package SAS version 9.1. The
evaluation of all investigated parameters was conducted by the MIXED procedure of SAS.
CO2 concentration and irrigation during corn growth and climatic conditions during feeding
experiments were considered as fixed effects for all parameters except mycotoxin residues in
plasma. Interactions between these factors were examined. The climatic conditions were
defined as fixed effect for the analysis of plasma mycotoxins. The “random” statement was
used for the individual animal effect to evaluate all parameters. Fleece length was tested as
covariate and included if it improved the respective model. Time of measurement was tested
as an additional covariate assessing rectal temperature, skin temperature and respiration rate
to consider diurnal variation and was included if it improved the respective model. DON
intake was used as an additional covariate for the evaluation of DON and de-epoxy-DON in
plasma. The restricted maximum likelihood method (REML) was used to evaluate variances.
Degrees of freedom were calculated by the Kenward-Roger method. To investigate

Paper II
51
differences between least square means, the “PDIFF” option was used applying a Tukey-
Kramer test for post-hoc analysis.
The dose-response relationship between DON intake and DON or de-epoxy-DON in plasma
was considered by a simple linear regression analysis using STATISTICA software 10.
Differences were considered to be significant at p<0.05. Trends were declared at p< 0.1.
Results
Thermoregulatory mechanisms
Elevated atmospheric CO2 concentration and drought stress during corn growth did not affect
rectal temperature, skin temperature, respiration rate and water usage of the experimental
sheep (Table 3). In contrast, all investigated parameters were influenced by the thermal
environment. Warmer climatic conditions induced increases in body temperatures, respiration
rates and water usage (p<0.001). Skin temperature data were characterized by a higher
variation than rectal temperature. The rises of both rectal and skin temperature due to heat
exposure seemed to be approximately linear. However, the differences between both body
temperature measures decreased with progressing body heat load indicating an unequal slope.
In contrast, respiration rate seemed to rise in an exponential manner and was subjected to a
3.5- to 4-fold increase between T and SH treatment. Though the interaction of irrigation and
climatic conditions was significant for rectal temperature (p<0.001), the numerical differences
were minimal. An interaction of CO2 concentration, irrigation and climatic conditions was
observed for skin temperature (p<0.001).

Paper II
52
Table 3 Effects of the climatic conditions during feeding experiments as well as increased atmospheric CO2
concentration and drought stress during corn growth on rectal and skin temperature, respiration rate and daily
water usage of sheep (LSmeans ± standard error)
Treatmenta Parameterb
CC CO2 I Rectal temp Skin temp RR Water usage
T FACE WW 38.5±0.1 28.6±0.3 26.5±3.6 1.6±1.3 MH 38.8±0.1 33.6±0.4 67.2±3.7 3.4±1.3 SH 39.3±0.1 37.6±0.5 124.0±4.8 4.0±1.4 T DS 38.4±0.1 27.6±0.5 36.8±4.7 2.2±1.4
MH 38.9±0.1 33.2±0.4 73.4±3.3 3.8±1.3 SH 39.2±0.1 37.4±0.4 121.8±3.6 4.6±1.3 T Control WW 38.4±0.1 28.1±0.3 29.6±3.1 2.6±1.2
MH 38.7±0.1 34.6±0.3 63.3±3.1 3.7±1.3 SH 39.2±0.1 38.4±0.4 113.6±3.9 4.6±1.3 T DS 38.4±0.1 28.6±0.4 33.9±4.6 2.4±1.3
MH 38.8±0.1 33.2±0.4 64.3±4.2 3.3±1.3 SH 39.0±0.1 36.7±0.4 121.8±4.4 4.6±1.3
p-value
CC <0.001 <0.001 <0.001 <0.001
CO2 0.441 0.338 0.152 0.903
I 0.374 0.173 0.436 0.804
CC × CO2 0.397 0.443 0.130 0.501
CC × I <0.001 0.058 0.288 0.780
CO2 × I 0.125 0.329 0.605 0.170
CC × CO2 × I 0.237 <0.001 0.182 0.910 a: Treatments were climatic conditions during feeding experiments (CC; T, temperate; MH, mild heat; SH,
severe heat) as well as CO2 concentration (CO2, FACE vs. Control) and Irrigation (I, Well watered (WW) vs.
Drought stress (DS)) during cultivation
b: Rectal temp, rectal temperature (°C); Skin temp, skin temperature (°C); RR, respiration rate (Breaths per
minute); Water usage (kg/d)
Differential blood count
The total count of leukocytes and their distribution were generally not affected by the
experimental treatments and were characterized by a considerable variation (Table 4).
Furthermore, all interactions were found to be insignificant. Basophils (1.3±0.1, Means ±
Standard error), eosinophils (3.4±0.3) and monocytes (1.4 ±0.2) were within the reference
ranges given by Kraft and Dürr (1999) but were not subjected to statistical analysis because of
the low numbers of those cells. The total leukocyte count was observed to be partially lower
than the reference range. In contrast, lymphocytes tended to exceed the expected percentage.

Paper II
53
Table 4 Effects of the climatic conditions during feeding experiments as well as increased atmospheric CO2
concentration and drought stress during corn growth on differential blood count of sheep (LSmeans ± standard
error)
Parameter
Treatmenta Leukocytes, 109/L Lymphocytes, % Neutrophils, %
CC CO2 I 4.2-6.2b 40-65b 20-45b
T FACE WW 5.8±1.0 70.9±6.3 21.2±6.0 MH 6.0±1.1 56.6±7.1 36.8±6.6 SH 5.8±1.4 57.9±8.5 30.3±7.8 T DS 2.0±1.2 75.3±7.7 20.2±7.1
MH 4.0±0.9 76.5±5.9 18.7±5.6 SH 3.6±1.0 69.4±6.0 27.1±5.8 T Control WW 5.0±0.8 67.3±5.2 25.5±5.0
MH 5.8±1.0 64.3±6.5 24.7±6.0 SH 4.6±1.1 61.1±7.2 27.6±6.6 T DS 3.8±1.2 80.0±7.4 16.5±6.7
MH 3.4±1.1 73.1±6.8 21.2±6.3 SH 3.0±1.1 73.0±6.8 23.4±6.3
p-value
CC 0.367 0.212 0.353
CO2 0.727 0.637 0.480
I 0.118 0.186 0.410
CC × CO2 0.392 0.924 0.783
CC × I 0.824 0.735 0.620
CO2 × I 0.309 0.887 0.758
CC × CO2 × I 0.370 0.438 0.309 a: Treatments were climatic conditions during feeding experiments (CC; T, temperate; MH, mild heat; SH,
severe heat) as well as CO2 concentration (CO2, FACE vs. Control) and Irrigation (I, Well watered (WW) vs.
Drought stress (DS)) during cultivation
b: Reference values according to Kraft and Dürr (1999)
Deoxynivalenol and its metabolite in plasma
The concentration of DON in the analysed plasma samples was not affected by the climatic
conditions, though a numerical decrease was associated with warmer environment (Table 5).
Plasma de-epoxy-DON was slightly increased during T treatment (p=0.057). The
metabolization rate of DON was higher than 90 % and was not influenced by the climatic
conditions (p=0.197), though it was found to be lowest during T treatment. The covariate
daily individual DON intake had a significant effect on the concentration of de-epoxy-DON
(p<0.001), but did not influence DON (p=0.225) and the metabolization rate of DON
(p=0.803), respectively. The mean daily DON intake as determined by the varying
contaminations of the corn silages was highest during T treatment (11.0±1.1 μg kg-1
BW.
Means ± standard error) compared to MH (7.5±1.2 μg kg-1
BW) and SH (7.8±1.1 μg kg-1
BW)
and ranged from 2.4 to 19.3 μg kg-1
BW. The concentration of DON was observed to be lower
than 1 ng/ml plasma except for one sample. In contrast, the concentration of the metabolite

Paper II
54
de-epoxy-DON strongly depended on the intake of DON and increased with rising oral DON
exposure (Fig. 1).
Table 5 DON and de-epoxy-DON concentrations in plasma of sheep and metabolization rate as affected by the
climatic conditions during feeding experiments (LSmeans ± standard error. Values were pooled for treatments
during growth of ensiled maize fed)
Treatment**
Parameter T MH SH p-value
DON concentration in plasma (ng ml-1) 0.37±0.07 0.28±0.07 0.22±0.07 0.368
De-epoxy-DON concentration in plasma (ng ml-1) 4.94±0.40 3.66±0.39 3.73±0.40 0.057
Metabolization rate* (%) 90.9±1.8 94.3±1.8 95.4±1.8 0.197 *: Metabolization rate = de-epoxy-DON concentration in plasma / (DON plus de-epoxy-DON concentration in
plasma) x 100 **: Experimental treatments were temperate (T), mild heat (MH) and severe heat (SH)
0 2 4 6 8 10 12 14 16 18 20
DON intake (μg kg-1 BW d-1)
0
2
4
6
8
10
12
14
DO
N a
nd
de-
epo
xy
-DO
N i
n
pla
sma
(ng
ml-1
)
Fig. 1 Relationship between deoxynivalenol (DON) intake and DON (y= 0.1321 + 0.0164x, r2= 0.09, p= 0.04) or
de-epoxy-DON (y= -0.1139 + 0.4621x, r2= 0.69, p< 0.01) concentration in plasma of sheep. Treatments during
growth of the ensiled corn fed were highlighted (FACE/ well watered: ○, ●; FACE/ drought stress: Δ, ▲;
Control/ Well watered: ◊, ♦; Control/ Drought stress: □, ■; Open symbols represent DON, closed symbols
represent de-epoxy-DON)
Discussion
The heat exchange between animal and environment depends on environmental variables such
as ambient temperature, relative humidity, radiation and wind, diverse animal factors and the
thermoregulatory mechanisms as well as circulatory adjustments (Nienaber et al. 1999). If

Paper II
55
homeothermic animals are within the so-called thermo-neutral zone, heat production is
minimal at normal rectal temperatures (Kadzere et al. 2002). In the present experiment, rectal
temperatures were rising significantly due to warmer environment but did not exceed 39.3°C
during SH treatment. That may be considered as a high physiological level that should not be
problematic for adult animals during temporary exposure since rectal temperatures of sheep
are characterized by a considerable variation between 38.3°C and 39.9°C under thermo-
neutral conditions (Marai et al. 2007a) and can exceed 40°C if the animals are kept at 36°C
(Llamaslamas and Combs 1990). The low RH of 17.8 % will likely have facilitated
evaporative heat dissipation and therefore may have contributed to the relatively low rectal
temperatures during SH treatment. The differences between rectal and skin temperature
decreased with warmer environmental conditions and were lower than 2°C during SH
treatment indicating an increased skin blood flow in order to dissipate excess body heat. In
sheep, close positive correlations between ambient temperature and skin temperature were
described (Monty et al. 1991) and the skin temperature measured at the trunk of unshorn
pregnant Dorset ewes was observed to rise from 30.2°C to 37.2°C when the animals were
kept at 25°C and 35°C, respectively (Hofman and Riegle 1977). In the present experiment,
skin temperature increased from a higher initial level of approximately 33.5°C during MH
treatment to a value exceeding 37°C during SH treatment. Furthermore, the respiration rate
was found to increase exponentially resulting in a total 3.5 to 4-fold elevation between T and
SH treatment. The process of rising respiratory energy dissipation due to an elevated body
heat load was consistent with former literature. The proportion of respiratory heat loss
accounts for approximately 20 % of the total body heat dissipation of sheep in a thermo-
neutral environment of 12°C (Marai et al. 2007a) but increases up to 60 % if the animals are
kept at 35°C (Thompson 1985).
In ruminants, the microbial activity during fermentation in the reticulorumen accounts for 3-8
% of the total heat production (Czerkawski 1980). Diet formulation may influence body heat
production since feeding more concentrate at the expense of fibrous ingredients should reduce
the heat increment (West 1999). For example, the level of nitrogen intake was found to affect
vaginal and skin temperatures of sheep significantly (Sudarman and Ito 2000). However, such
diet effects were caused by considerable alterations of the formulation of the diets and even
substantial changes in diet composition do not necessarily affect the body temperature of
sheep (Bhattacharya and Uwayjan 1975). Accordingly, the lack of effects of both increased
atmospheric CO2 concentration and drought stress during the growth of the corn silages fed

Paper II
56
on the investigated thermoregulatory parameters was consistent since both factors did not
cause significant alterations of the crude nutrient content of silage DM (Lohölter et al. 2012).
The differential blood count of sheep in the present experiment was generally not affected by
the evaluated treatments. That coincides with a study of da Silva et al. (1992), where the
exposure to high ambient temperatures of 25-46°C did neither affect the concentration of
leucocytes, lymphocytes nor neutrophils in the blood of sheep of both sexes.
The exposure of monogastric animals to DON is well documented to result in adverse effects
on health and performance (Dänicke et al. 2007; Goyarts et al. 2005). In contrast, ruminants
are less susceptible to DON as in the rumen DON is converted almost completely into the less
toxic metabolite de-epoxy-DON (Fink-Gremmels 2008; Seeling et al. 2006). In a study by
Keese et al. (2008), lactating dairy cows were fed either a control diet with a daily DON
intake between 15 and 20 μg kg-1
BW or a DON contaminated diet associated with a
considerably higher intake of 150-225 μg kg-1
BW and day. The intake per kg BW of the
control group was comparable to the daily intake in the present study which ranged between
2.4 and 19.3 μg kg-1
BW. Low concentrations of unmetabolized DON were measured in the
bovine serum samples of both control (Maximum: 2.0 ng ml-1
) and contaminated group
(Maximum: 18.0 ng ml-1
) (Keese et al. 2008). That was congruent with the DON
concentrations in the ovine plasma samples of the current experiment which were generally
close to the limit of detection with a maximum of 1.4 ng ml-1
. Furthermore, the concentration
of DON was not influenced by the daily DON intake and the climatic conditions during
feeding, respectively. Thus neither the significant increase of DON in ensiled corn grown
under drought stress conditions nor the reduction of silage DON contamination as induced by
elevated atmospheric CO2 in the plants affected by drought were reflected in the plasma
concentration of DON. The metabolite de-epoxy-DON was the predominant compound found
in plasma samples after oral DON exposure and was highly related to DON intake. That
coincides with former literature since Seeling et al. (2006) investigated the effects of feeding
Fusarium contaminated wheat on the biotransformation of DON in dairy cows and concluded
that in the rumen DON is rapidly and almost completely (94-99 %) biotransformed to de-
epoxy-DON. It needs to be elucidated whether the time between the consumption of the corn
silages and blood sampling contributed to the low concentrations of plasma DON in the
present study. However, similar results were reported for lactating cows in the experiment of
Seeling et al. (2006). Offering one of four daily portions of contaminated concentrate
containing 5.2 mg DON kg-1
DM two hours prior to blood sampling resulted in low serum
concentrations of DON with a maximum of 5 ng ml-1
. In the current study, the de-epoxy-

Paper II
57
DON concentration was found to be elevated during T treatment (p=0.057). However, the
mean daily DON intake as determined by the varying contaminations within each treatment
during plant growth was highest during T climate as well and will likely explain the increases
because blood de-epoxy-DON strongly depended on the consumption of DON.
Though in ruminants DON is metabolized to a large extent, high dietary concentrations were
reported to affect the ruminal utilization of protein (Dänicke et al. 2005) as well as
metabolism and immunity (Korosteleva et al. 2007; Korosteleva et al. 2009) of dairy cows.
Only few experiments were conducted in order to investigate toxic effects of DON in sheep
(Eriksen and Pettersson 2004). For example, feed consumption, weight gain, feed efficiency
and different blood parameters of lambs were not affected by feeding the animals with a diet
containing 15.6 mg DON kg-1
feed (Harvey et al. 1986). In the present study, the DON
contaminations of the corn silages fed were generally lower than 2 mg kg-1
DM. As indicated
by the high metabolization rate of DON, such low dietary concentrations should not be
hazardous for adult sheep. Accordingly, the effects of the treatments during corn growth on
the concentration of DON in the silages fed as described by Lohölter et al. (2012) were not
reflected in effects on rectal or skin temperature, respiration rate and differential blood count.
Conclusions
In conclusion, the thermal environment did not affect differential blood count and metabolism
of DON, respectively, though body temperature and respiration rate of adult castrated male
sheep increased due to heat exposure. Furthermore, elevated atmospheric CO2 concentration
and drought stress during corn growth did not have single effects on the examined
thermoregulatory parameters or differential blood count as both factors did not alter the crude
nutrient content of silage DM. In sheep, the almost complete conversion of DON into the
metabolite de-epoxy-DON was not related to the thermal environment but the concentration
of de-epoxy-DON in plasma strongly depended on the intake of DON.
Acknowledgements
The assistance of the co-workers of the Institute of Animal Nutrition and the Experimental
Station of the Friedrich-Loeffler-Institute in Brunswick, Germany in performing experiment
and analysis as well as the provision of FACE corn samples by the staff of the Institute of
Biodiversity, Johann Heinrich von Thünen-Institute, Federal Research Institute for Rural
Areas, Forestry and Fisheries in Brunswick, Germany and the analysis of blood gases and red

Paper II
58
blood cells by the staff of the clinical chemical laboratory of the clinic for cattle in Hanover,
Germany is gratefully acknowledged.
References
Arino AA, Bullerman LB (1994) Fungal colonization of corn grown in Nebraska in relation to
year, genotype and growing conditions. J Food Protect 57:1084-1087
Azeez JO, Chikoye D, Kamara AY, Menkir A, Adetunji MT (2005) Effect of drought and
weed management on maize genotypes and the tensiometric soil water content of
an eutric nitisol in South Western Nigeria. Plant Soil 276:61-68
Bhattacharya AN, Uwayjan M (1975) Effect of high ambient temperature and low humidity
on nutrient utilization and on some physiological responses in Awasi sheep fed
different levels of roughage. J Anim Sci 40:320-328
Bianca W (1962) Relative importance of dry- and wet-bulb temperatures in causing heat
stress in cattle. Nature 195: 51-252
Boyer JS, Westgate ME (2004) Grain yields with limited water. J Exp Bot 55:2385-2394
Cairns-Fuller V, Aldred D, Magan N (2005) Water, temperature and gas composition
interactions affect growth and Ochratoxin A production by isolates of
Penicillium verrucosum on wheat grain. J Appl Microbiol 99:1215-1221
Czerkawski JW (1980) A novel estimate of the magnitude of heat produced in the rumen. Brit
J Nutr 42:239-243
Dänicke S, Matthäus K, Lebzien P, Valenta H, Stemme K, Überschär KH, Razzazi-Fazeli E,
Bohm J, Flachowsky G (2005) Effects of Fusarium toxin-contaminated wheat
grain on nutrient turnover, microbial protein synthesis and metabolism of
deoxynivalenol and zearalenone in the rumen of dairy cows. J Anim Physiol An
N 89:303-315
Dänicke S, Valenta H, Überschär KH, Matthes S (2007) On the interactions between
Fusarium toxin-contaminated wheat and non-starch-polysaccharide hydrolysing
enzymes in turkey diets on performance, health and carry-over of
deoxynivalenol and zearalenone. Brit Poultry Sci 48:39-48

Paper II
59
Da Silva RG, Da Costa MJRP, Sobrinho AGS (1992) Influence of hot environments on some
blood variables of sheep. Int J Biometeorol 36:223-225
Döll S, Schrickx JA, Valenta H, Dänicke S, Fink-Gremmels J (2009) Interactions of
deoxynivalenol and lipopolysaccharides on cytotoxicity protein synthesis and
metabolism of DON in porcinbe hepatocytes and Kupffer cell enriched
hepatocyte cultures. Toxycol Lett 189:121-129
Efeoglu B, Ekmekci Y, Cicek N (2009) Physiological responses of three maize cultivars to
drought stress and recovery. S Afr J Bot 75:34-42
Eriksen GS, Pettersson H (2004) Toxicological evaluation of trichothecenes in animal feed.
Anim Feed Sci Tech 114:205-239
Erbs M, Manderscheid R, Weigel HJ (2012) A combined rain shelter and free-air CO2
enrichment system to study climate change impacts on plants in the field,
Methods in Ecol Evol 3:81-88
Fink-Gremmels J (2008) Mycotoxins in cattle feeds and carry-over to dairy milk: A review.
Food Addit Contam 25:172-180
Ghannoum O (2009) C-4 photosynthesis and water stress. Ann Bot 103: 635-644
Goyarts T, Dänicke S, Rothkötter HJ, Spilke J, Tiemann U, Schollenberger M (2005) On the
effects of a chronic deoxynivalenol intoxification on performance,
haematological and serum parameters of pigs when diets are offered either for ad
libitum consumption or fed restrictively. J Vet Med 52:305-314
Goyarts T, Dänicke S, Grivel N, Tiemann U, Rothkötter HJ (2006) Methodical aspects of in
vitro proliferation of porcine blood lymphocytes when exposed to
deoxynivalenol (DON). Landbauforsch Volk 56:139-148
GfE (Gesellschaft für Ernährungsphysiologie) (1991) Guidelines for determining the
digestibility of crude nutrients in ruminants. J Anim Physiol An N 65:229-234
Hahn GL (1999) Dynamic responses of cattle to thermal heat loads. J Anim Sci 77:10-20

Paper II
60
Harvey RB, Kubena LF, Corrier DE, Witzel DA, Phillips TD, Heidelbaugh ND (1986)
Effects of deoxynivalenol in a wheat ration fed to growing lambs. Am J Vet Res
47:1630-1632
Hofman WF, Riegle GD (1977) Thermo-respiratory responses of shorn and unshorn sheep to
mild heat-stress,.Resp Physiol 30:327-338
IPCC (2007) Climate change 2007: The physical science basis. Summary for policy makers.
Contribution of working group 1 to the fourth assessment report of the
intergovernmental panel on climate change, Cambridge University press,
Cambridge and New York
Kadzere CT, Murphy MR, Silanikove N, Maltz E (2002) Heat stress in lactating dairy cows: a
review. Livest Prod Sci 77:59-91
Keese C, Meyer U, Valenta H, Schollenberger M, Starke A, Weber IA, Rehage J, Breves G,
Dänicke S (2008) No carry over of unmetabolised deoxynivalenol in milk of
dairy cows fed high concentrate proportions. Mol Nutr Food Res 52:1514-1529
Korosteleva SN, Smith TK, Boermans HJ (2007) Effects of feedborne fusarium mycotoxins
on the performance, metabolism, and immunity of dairy cows. J Dairy Sci
90:3867-3873
Korosteleva SN, Smith TK, Boermans HJ (2009) Effects of feed naturally contaminated with
Fusarium mycotoxins on metabolism and immunity of dairy cows. J Dairy Sci
92:1585-1593
Kraft W, Dürr JM (1999) Klinische Labordiagnostik in der Tiermedizin. Schattauer, Stuttgart
Leakey ADB, Uribelarrea M, Ainsworth EA, Naidu SL, Rogers A, Ort DR, Long SP (2006)
Photosynthesis, productivity, and yield of maize are not affected by open-air
elevation of CO2 concentration in the absence of drought. Plant Physiol 140:779-
790
Llamaslamas G, Combs DK (1990) Effects of environmental temperature and ammonization
on utilization of straw by sheep. J Anim Sci 68:1719-1725
Lewin KF, Hendrey GR, Kolber Z (1992) Brookhaven National Laboratory Free-Air Carbon-
Dioxide Enrichment Facility. Crit Rev Plant Sci 11:135-141

Paper II
61
Lohölter M, Meyer U, Manderscheid R, Weigel HJ, Erbs M, Flachowsky G, Dänicke S
(2012) Effects of free air carbon dioxide enrichment and drought stress on the
feed value of corn silage fed to sheep at different thermal regimes.Arch Anim
Nutr 66:335-346
Magan N, Medina A, Aldred D (2011) Possible climate-change effects on mycotoxin
contamination of food crops pre- and postharvest. Plant Pathol 60:150-163
Manderscheid R, Pacholski A, Frühauf C, Weigel HJ (2009) Effects of free air carbon dioxide
enrichment and nitrogen supply on growth and yield of winter barley cultivated
in a crop rotation. Field Crop Res 110:185-196
Manderscheid R, Erbs M, Weigel HJ (2012) Interactive effects of free-air CO2 enrichment
and drought stress on maize growth. Eur J Agron. Doi:
10.1016/j.eja.2011.12.007
Marai IFM, El-Darawany AA, Fadiel A, Abdel-Hafez MAM (2007) Physiological traits as
affected by heat stress in sheep – A review. Small Ruminant Res 71:1-12
Monty DE, Kelley LM, Rice WR (1991) Acclimatization of St-Croix, Karakul and
Rambouillet to intense and dry summer heat. Small Ruminant Res 4:379-392
Naumann C, Bassler R (1993) Die chemische Untersuchung von Futtermitteln.
Methodenbuch Bd. 3 mit Ergänzungslieferungen 1983, 1988, 1993, 1997, 2004
und 2006. Association of German Agricultural Analysis and Research Centres,
Darmstadt
Nienaber JA, Hahn GL, Eigenberg RA (1999) Quantifying livestock responses for heat stress
management: a review. Int J Biometeorol 42:183-188
O`Kelly JC (1987) Influence of dietary fat on some metabolic responses of cattle to
hyperthermia induced by heat exposure. Comp Biochem Phys A 87:677-682
Otegui ME, Andrade FH, Suero EE (1995) Growth, Water-Use, and Kernel Abortion of
Maize Subjected to Drought at Silking. Field Crops Res 40:87-94
Porteaus F, Hill J, Ball AS, Pinter PJ, Kimball BA, Wall GW, Adamsen FJ, Hunsaker DJ,
LaMorte RL, Leavitt SW, Thompson TL, Matthias AD, Brooks TJ, Morris CF
(2009) Effect of Free Air Carbon dioxide Enrichment (FACE) on the chemical

Paper II
62
composition and nutritive value of wheat grain and straw. Anim Feed Sci Tech
149:322-332
Renner L, Schwabe A, Döll S, Höltershinken M, Dänicke S (2011) Effect of rare earth
elements on beef cattle growth performance, blood clinical parameters and
mitogen stimulated proliferation of bovine peripheral blood mononuclear cells in
vitro and ex vivo. Toxycology Lett 201:277-284
Seeling K, Dänicke S, Valenta H, Van Egmond HP, Schothorst RC, Jekel AA, Lebzien P,
Schollenberger, Razzazi-Fazeli E, Flachowsky G (2006) Effects of Fusarium
toxin-contaminated wheat and feed intake level on the biotransformation and
carry-over of deoxynivalenol in dairy cows. Food Addit Contam 23:1008-1020
Sudarman A, Ito T (2000) Effects of dietary protein sources and levels on heat production and
thermoregulatory responses of sheep exposed to a high ambient temperature.
Asian-Australian J Anim 13:1523-1528
Thompson GE (1985) Respiratory system. In: Young MK (ed) Stress Physiology in
Livestock. CRC Press, Inc., Boca Raton, Horida, pp 155-162
West JW (1999) Nutritional strategies for managing the heat-stressed dairy cow. J Anim Sci
77:21-35
Yang LX, Wang YL, Dong GC, Gu H, Huang JY, Zhu JG, Yang HJ, Liu G, Han Y (2007)
The impact of free-air CO2 enrichment (FACE) and nitrogen supply on grain
quality of rice. Field Crop Res 102:128-140

Paper III
63
Paper III
Evaluation of a device for continuous measurement of rumen pH and
temperature considering localization of measurement and dietary
concentrate proportion
M. Lohölter1, R. Rehage
1, U. Meyer
1, P. Lebzien
1, J. Rehage
2, S. Dänicke
1
1Institute of Animal Nutrition, Friedrich-Loeffler-Institute (FLI), Federal Research Institute
for Animal Health, Bundesallee 50, D-38116 Braunschweig, Germany
2University of Veterinary Medicine Hanover, Clinic for Cattle, Bischofsholer Damm 15, D-
30173 Hanover, Germany
Livestock Science
Submitted

Paper III
64
Abstract: Continuous rumen pH and temperature measurement may be useful tools for
diverse diagnostic and research purposes including the detection of indications of subacute
ruminal acidosis. The primary objective of the present study was to evaluate a commercially
available device for continuous monitoring of rumen pH, temperature and pressure of cattle
focussing on rumen pH determination and to test the effects of measurement localization as
well as dietary concentrate proportion on rumen pH and temperature. Four rumen-fistulated
cows were fed on two diets containing 0 and 40 % concentrate, respectively. Measurement
was executed for 2 days per cow and diet. One probe was inserted each in the dorsal and
ventral rumen sac to measure pH and temperature continuously. Manual temperature
determination and removal of rumen fluid for subsequent manual pH measurement were
performed postprandial in direct proximity to the probes at preset short term intervals. PH
sensors were tested for drift. The pH sensor drift was inconsistent and in parts undirected with
a considerable individual variation. A moderate correlation between manual and continuous
measurement of pH (r=0.59, p<0.001) and temperature (r=0.46, p<0.001) was calculated. The
Bland-Altman comparison of both methods indicated moderate agreement that may as well be
due to a deficient accuracy of manual pH measurement. A bias effect of probe pH
determination with a pH overestimation in the range of low rumen pH below 6.0 and an
underestimation of higher rumen pH above 6.5 was observed. Rumen pH was not affected by
the localization of measurement, but by diet and time after feeding. Significant effects of
localization, diet and time and an interaction of localization and diet on rumen temperature
were found. In conclusion, the evaluated technique was promising. However indications of
inaccuracy of probe pH measurement suggested the need of further improvement.
Keywords: continuous rumen pH measurement, rumen temperature, concentrate proportion
1. Introduction
Subacute ruminal acidosis (SARA) is a metabolic disorder affecting rumen fermentation and
functionality, animal health and productivity of dairy cows with a considerable prevalence in
European herds (Kleen et al., 2009; Morgante, 2007). It may be induced by the consumption
of diets containing high amounts of easily fermentable carbohydrates, particularly in
combination with a rumen environment insufficiently adapted to such diets as frequently
occurring in post-partum periods (Kleen et al., 2003). Feeding high amounts of grain results
in increased production of short chain fatty acids (Bauman, 1971) and decreased rumen pH,
Paper III
65
whereas especially in early lactation the rumen mucosal papillae are short with a small surface
for the absorption of short chain fatty acids.
Various thresholds of rumen pH have been discussed to indicate the onset of SARA. Garrett
at al. (1999) suggested a critical value of 5.5 and discussed the determination of pH in rumen
fluid from group subsamples as a potential tool to detect SARA in dairy cow herds. In a
recent study, the onset of SARA was supposed to be characterized by a rumen pH below 5.6
for at least 3 hours per day (Gozho et al., 2005). The validity of results obtained by pH
measurement in rumen fluid gained either by means of rumenocentesis, via oro-ruminal
probes or through a rumen cannula as frequently executed in research is discussed to be
limited. Restricted times of sampling, sample and animal number as well as sampling sites in
the rumen or saliva contamination may affect the significance of obtained results.
Furthermore the mentioned methods can hardly be applied by farmers. Enemark (2008)
discussed the continuous monitoring of rumen pH instead of spot sampling as a promising
measure to contribute to SARA diagnosis. One opportunity to realize a continuous pH
measurement may be the use of indwelling rumen probes, which would allow the animal to
move freely and undisturbed and would offer the benefit of sampling rumen pH at
programmed intervals and thus give the chance to closely follow the course of rumen pH as
influenced by different feeding regimes (Enemark, 2008). After the beginning of continuous
rumen pH determination by means of intraruminal devices (Dado and Allen, 1993) various
probes were evaluated for the application both in small ruminants (Penner et al., 2003) and
cattle (Enemark et al., 2003; Penner et al., 2006; Phillips et al., 2010). Effects of the sites of
sampling on pH of withdrawn rumen fluid were reported, mean pH values at the cranial-
dorsal rumen were slightly but not significantly lower than those at the cranial-ventral rumen
(Duffield, 2004; Li et al., 2009). Dietary concentrate proportion is well known to affect rumen
pH (AlZahal et al., 2009; Mishra et al., 1970), though small alterations of the forage :
concentrate ratio in dairy cow diets do not necessarily influence mean rumen pH (Maekawa et
al., 2002). Information about interactions of the localization of pH measurement in the rumen
and the amount of concentrate fed is rare but may be valuable for the interpretation of pH data
determined by indwelling rumen probes.
Recently, Kaur et al. (2010) tested commercially available devices for rumen pH, pressure
and temperature measurement with the ability of telemetric data transfer (KB 1101 bolus,
Kahne Limited, New Zealand). They observed a weak relationship between bolus and manual
pH measurement in withdrawn rumen fluid and a steadily increasing pH sensor drift. Bolus
pH determination was performed via ISFET (ion-selective field-effect transistor) sensors,

Paper III
66
which may show long-term drift and low performance in comparison to glass electrodes
(Oelssner, 2005). Meanwhile, a renewed successor of these probes is available using a glass
membrane sensor for pH measurement. Though an improved accuracy and agreement with
manual rumen pH determination may be expected, reliable information about the actual
performance of that transformed probe is required. Furthermore, rumen temperature
measurement may aid in the detection of SARA since a close inverse correlation with rumen
pH was reported (AlZahal et al., 2008). Forestomach temperature was found to be strongly
correlated with rectal temperature (Bewley et al., 2008; Burns et al., 2002) and may also be a
useful diagnostic parameter for the detection of estrus, heat stress or infectious diseases in
dairy cows (Fordham et al., 1988; Kadzere et al., 2002; Martello et al., 2010). The aim of the
present study was to evaluate new commercially available devices for pH, temperature and
pressure measurement in the rumen of cattle primarily focussing on the examination of pH
measurement and to test potential effects of the localization of measurement in the rumen as
well as dietary concentrate proportion on rumen pH and temperature.
2. Materials and Methods
2.1 Animals and feeding
The present study was performed at the Experimental Station of the Institute of Animal
Nutrition, Friedrich-Loeffler-Institute (FLI), Federal Research Institute for Animal Health in
Braunschweig, Germany, in compliance with the European Union Guidelines concerning the
protection of experimental animals. Four non-lactating German Holstein cows with a mean
initial bodyweight of 614 ± 76 kg equipped with large rubber cannulas in the dorsal rumen sac
were used in the experiment, which was divided into two successive periods. Due to illness
one animal had to be replaced by a lactating cow before adaptation feeding of diet 2 was
started. The animals were kept in a tethered barn with individual troughs and free access to
water. Two diets were fed successively after three weeks of adaptation each. Feeding was
performed ad libitum twice daily at 05:15 and 15:15 h. Daily individual dry matter intake was
recorded to calculate organic matter intake. Diet 1 was composed of 60 % maize silage and 40
% grass silage on a dry matter (DM) basis. Diet 2 was designed as a Total Mixed Ration
(TMR) containing 36 % maize silage, 24 % grass silage and 40 % concentrate. Concentrate
was composed of 50.0 % wheat grain, 26.8 % soybean meal, 20.8 % corn grain and 2.4 %
mineral and vitamin premix. Feed samples were collected daily to produce an aggregate

Paper III
67
sample for analysis of the chemical composition. Diet crude nutrient contents were analyzed
according to the suggestions of the Verband Deutscher Landwirtschaftlicher Untersuchungs-
und Forschungsanstalten (Naumann and Bassler, 1993). Acid detergent fibre (ADF) and
neutral detergent fibre (NDF) were determined according to Goering and Van Soest (1970)
and expressed without residual ash. The chemical composition of the diets is presented in
Table 1.
Table 1: Chemical composition (g/ kg DM) and energy content (MJ/ kg DM) of experimental diets
Parameter Diet 1 Diet 2
Organic matter 948 948
Crude protein 97 144
Ether extract 35 33
Crude fibre 227 149
ADF 245 164
NDF 447 333
ME1 10.4 11.6
NEL1 6.2 7.1
1Tabular values were used to estimate silage and concentrate digestibility (DLG, 1997). Metabolizable Energy
(ME) and Net Energy Lactation (NEL) were calculated as following (GfE, 2001): ME [MJ/kg] = 0.0312* DEE
[g/kg] + 0.0136* DCF [g/kg] + 0.0147* (DOM - DEE – DCF) [g/kg] + 0.00234* CP [g/kg], where DEE =
digestible ether extract; DCF = digestible crude fibre; DOM = digestible organic matter.
2.2. Rumen probes
The experiment was performed using two rumen probes (KB 3/04 bolus, Kahne Limited, New
Zealand). The boluses were a successor of the technique described by Kaur et al. (2010) and
were constructed to measure rumen pH, temperature and pressure in an adjustable frequency
of 10 to 59 seconds or 1 to 255 minutes. The probes were constructed as a copolymer barrel
of 145 mm length and 27 mm diameter with wings of altogether 185 mm attached to the
tapered top. For pH determination a glass membrane pH sensor was incorporated in the
bottom of the boluses. Pre- and post-use storage of the pH sensor was performed as
recommended in a 3 molar potassium chloride solution. Kahne Data Processing System V 5.1
software was used for the calibration of the boluses and to download and export data for
evaluation. The pH sensors were calibrated according to Kaur et al. (2010) in a water bath of
40 ± 0.1 °C in standard buffer solutions with a pH of 7.0 (first) and 4.0 (second), respectively
(ZMK-Analytik-GmbH, Bitterfeld-Wolfen, Germany). A Kahne KR 2001 transceiver was
connected to a computer by USB cable to transfer the calibration and setting instructions.
Both temperature and pressure sensor were integrated in the probe enclosure. No

Paper III
68
manufacturer information about construction and functionality of the temperature sensor were
available. Measured data were stored in an integrated memory card for later download with a
maximum storage capacity of 11.955 data points per bolus, according to manufacturer. Data
could be transferred to a computer in real time simultaneously. Logged bolus data
transmission was initialized on demand using a handheld trigger device (Kahne Wand KW1,
frequency 134.2 KHz). Data were received by a KR 2002 receiver (frequency 433.9 MHz)
including antenna with a range of up to 30 meters, according to manufacturer.
2.3. Sampling
Bolus and manual measurement was performed simultaneously for two consecutive days per
cow and diet. Manual rumen pH and temperature as well as rectal temperature were
determined 15, 45, 75, 135, 195, 255, 315, 375, 435 and 495 minutes after morning feeding.
Two boluses were set to measure every 5 minutes. The probes were fixed to a coated cord tied
to the inner cannula and weighed down by a galvanised iron weight of approximately 500 g in
such a way to place one bolus in the dorsal and ventral rumen sac, respectively. The dorsal
bolus was immersed approximately 10 cm in the rumen content at pre feeding level in the
morning. Bolus data were downloaded using the trigger device. To minimize the impact of
short term variation bolus rumen pH and bolus rumen temperature were calculated by taking
the arithmetic mean of all recorded values within ± 15 minutes from preset manual
measurement times. To investigate pH sensor drift boluses were removed at the end of both 8
days periods followed by pH measurement in unused standard buffer solutions at 40 °C as
utilized for calibration. This procedure was followed by bolus recalibration. Temperature
sensors were not subjected to drift examination as their drift was reported to be negligible in a
former study conducted by Kaur et al. (2010). Pressure data were not included in the
evaluation due to expected data falsification by the rumen cannula and the necessity of
opening it during the experiment.
Manual temperature measurement was performed via digital thermometer (Digitemp
Servoprax E315, Servopax GmbH, Wesel, Germany) rectally and in the rumen in direct
proximity of the two boluses. For manual pH measurement rumen content was withdrawn
from the localizations of manual temperature determination. Obtained samples were squeezed
immediately trough a close meshed nylon net followed by pH measurement in the gained
fluid using a pH meter (WTW pH 530 BCB, LAT Labor- und Analysenbedarf, Garbsen,
Germany).

Paper III
69
2.4. Statistical analyses
Statistical analyses were performed utilizing the software package SAS version 9.1 (SAS
Institute Inc., 2004). Pearson correlation coefficients between rumen pH, rumen temperature
and rectal temperature data were calculated using the procedure “CORR”. Linear regression
analysis was executed by means of the “REG” procedure to compare bolus and manual pH
measurement. The method described by Bland and Altman (1986) was used to assess the
agreement between both techniques, differences between bolus and manual pH were plotted
against the arithmetic mean for the pairs at each measurement point. The bias as the mean
difference (d) including 95% confidence interval (CI) and the standard deviation of the
differences (s) were calculated. The upper and lower limits of agreement were defined as d ±
1.96 s and used to summarize the level of agreement between both methods.
The procedure “MIXED” was applied to analyze rumen pH and temperature data. Diet,
localization in the rumen, method and time were considered as fixed effects. Interactions
between theses variables were investigated. Rumen temperature and rumen pH were included
as covariates assessing rumen pH and temperature, respectively. The “random” statement was
utilized for the individual cow effect. The restricted maximum likelihood method (REML)
was used to evaluate variances. Degrees of freedom were calculated by the Kenward-Roger
method. To investigate differences between least square means, the “PDIFF” option was used
applying a Tukey-Kramer test for post-hoc analysis. Values used to quantify the effects of the
mentioned variables were presented as LS means. Differences were considered to be
significant at p<0.05.
3. Results
3.1. General results
The mean daily organic matter intake per cow was 9.6 kg for diet 1 and 17.3 kg for diet 2.
One bolus had to be replaced after feeding diet 1 due to technical disturbances which occurred
after sampling. The operation of trigger device, receiver and software was easy to handle and
appropriate for the download of data under the given experimental conditions, though the
trigger had to be used in direct proximity of the animals. The receiver was able to receive data
continuously and directly after the record of each data point from a distance of approximately
5 meters, whereat the manufacturer` s data of a range of up to 30 meters was not verified. A

Paper III
70
total of 315 paired samples were available each for the comparison of pH and temperature
data obtained by bolus and manual measurement, respectively.
The drift of the pH sensors after both 8 days periods resulted in a mean bias of 0.04 ± 0.12
(Mean ± s.d.) in pH 4 buffer solution and -0.02 ± 0.15 in pH 7 buffer solution. One sensor
showed a minimal positive drift in pH 4 buffer solution (Diet 1: 0.02, diet 2: 0.01) but slightly
negative drift in pH 7 buffer solution (Diet 1: -0.03, diet 2: -0.08). However the other 2
sensors drift was either positive (Diet 1: pH 4: 0.19, pH 7: 0.20) or negative (Diet 2: pH 4: -
0.04, pH 7: -0.16). Due to the partially undirected pH drift bolus pH data were not subjected
to drift correction.
Slightly negative overall Pearson correlation coefficients between rumen pH and rumen
temperature were calculated for both bolus (r=-0.11, p=0.052) and manual (r=-0.25, p<0.001)
measurement. A closer inverse relationship was found between rumen pH at both
localizations of measurement and dorsal rumen temperature compared with ventral rumen
temperature (Table 2). The correlations between pH values and rectal temperature (Bolus: r=-
0.06, p=0.323. Manual: r=-0.14, p=0.002, respectively) and between rumen and rectal
temperature (Bolus: r=0.15, p=0.09. Manual: r=0.11, p=0.053, respectively) were not existent
or minimal.
Table 2: Correlation coefficients of rumen pH and rumen temperature among methods and localizations of
measurement
Temperature
Bolus Manual
Ventral Dorsal Ventral Dorsal
pH Bolus Ventral r 0.07 -0.35 -0.01 -0.26
p 0.385 <0.001 0.936 0.001
Dorsal r 0.06 -0.20 0.01 -0.16
p 0.463 0.012 0.895 0.040
Manual Ventral r 0.05 -0.43 -0.09 -0.37
p 0.553 <0.001 0.272 <0.001
Dorsal r 0.01 -0.30 -0.11 -0.36
p 0.935 <0.001 0.165 <0.001
3.2. Comparison of methods
The mean (± s.d.) total rumen pH was 6.39 ± 0.38 for bolus and 6.31 ± 0.57 for manual
measurement. The number of recorded data points with a pH below 6.0 were in total n=50 for
bolus and n=144 for manual reading. The correlation coefficients between the evaluated
methods were r=0.59 (p<0.001) for rumen pH and r=0.46 (p<0.001) for rumen temperature. A

Paper III
71
closer correlation was found between ventral bolus pH and both ventral and dorsal manual pH
(r=0.80, p<0.001 and r=0.74, p<0.001, respectively) than between dorsal bolus pH and ventral
and dorsal manual pH (r=0.51, p<0.001 and r=0.45, p<0.001, respectively). The intra method
correlation between pH determination at the ventral and dorsal rumen sac, respectively, was
r=0.59 (p<0.001) for bolus and r=0.85 (p<0.001) for manual sampling.
Performing linear regression analysis the relationship between bolus and manual pH
measurement was characterized by a considerable variation around the regression line with a
relatively low coefficient of determination of r2=0.3436 (Fig. 1). The Bland-Altman
comparison indicated a bias effect of bolus pH measurement with the tendency of pH
overestimation in the range of low rumen pH below 6.0 and a pH underestimation at rumen
pH above 6.5 (Fig. 2). The estimated limits of agreement between bolus and manual pH
measurement were -0.83 to 0.97.
Fig. 1: Relationship between manual and bolus pH measurement. y = 0.3938x + 3.9011, r2 = 0.3436, N = 315.
5.0 5.5 6.0 6.5 7.0 7.5 8.0
Manual pH
5.0
5.5
6.0
6.5
7.0
7.5
8.0
Bolu
spH
5.0 5.5 6.0 6.5 7.0 7.5 8.0
Manual pH
5.0
5.5
6.0
6.5
7.0
7.5
8.0
Bolu
spH

Paper III
72
Fig. 2: Differences of bolus and manual rumen pH measurement versus their mean. N = 315. Bias: 0.07, 95 %
confidence interval: 0.03 to 0.11. Dotted lines show limits of agreement. A best fit line has been added to show
change in bias with pH.
3.3. Effects of diet, localization and time
A significant diet effect on rumen pH was observed (Diet 1: 6.61. Diet 2: 6.16. p < 0.001. Fig.
3). The localization of measurement in the rumen did not influence pH values (Dorsal: 6.39.
Ventral: 6.37. p>0.05), whereas the method of pH determination had a significant effect
(p=0.004). Rumen pH was affected by time after feeding (p<0.001, Fig. 3). It decreased
postprandial and recovered approximately to the initial value within the sampling period of
495 minutes. Though the interaction of diet and localization was significant (p=0.014), the
nominal effects were marginal. Dorsal and ventral rumen pH were nearly equal feeding diet 1
(Dorsal: 6.58, ventral: 6.63) and differed only slightly feeding diet 2 (Dorsal: 6.20, ventral:
6.12). No interactions were found between diet and time (p>0.05) and localization and time
(p>0.05), respectively.
5.0 5.5 6.0 6.5 7.0 7.5 8.0
Average of Bolus and Manual pH
-2.0
-1.5
-1.0
-0.5
0.0
0.5
1.0
1.5
2.0
Bolu
s-
Man
ual
pH
5.0 5.5 6.0 6.5 7.0 7.5 8.0
Average of Bolus and Manual pH
-2.0
-1.5
-1.0
-0.5
0.0
0.5
1.0
1.5
2.0
Bolu
s-
Man
ual
pH

Paper III
73
Fig. 3: Rumen pH depending on time after feeding (min) and diet (diet 1: ●, diet 2: ■). Ventral and dorsal pH
values were pooled and presented as means ± standard error.
Rumen temperature was influenced by diet and increased due to feeding low fibre but high
energy (Diet 1: 38.9 °C, Diet 2: 39.3 °C. p<0.001). The localization of measurement had a
significant effect on rumen temperature (p<0.001). Ventral and dorsal temperature were
almost equal feeding diet 1 (Ventral: 39.0 °C, dorsal: 38.9 °C), however a temperature
gradient was observed for diet 2 (Ventral 39.0 °C, dorsal: 39.7 °C. Localization x diet:
p<0.001). The applied methods did not affect temperature values (p=0.115). A time effect on
rumen temperature (p<0.001) was investigated. The significant interaction between diet and
time was characterized by a time dependent decline of rumen temperature feeding diet 1 with
the nadir after 75 minutes and a full recovery within the sampling period (p<0.001, Fig. 4).
Localization and time did not interact significantly (p>0.05).
0 60 120 180 240 300 360 420 480
Time after feeding (min)
5.8
6.0
6.2
6.4
6.6
6,8
7.0
Rum
enpH
0 60 120 180 240 300 360 420 480
Time after feeding (min)
5.8
6.0
6.2
6.4
6.6
6,8
7.0
Rum
enpH

Paper III
74
Fig. 4: Rumen temperature depending on time after feeding (min) and diet (diet 1: ●, diet 2: ■). Ventral and
dorsal pH values were pooled and presented as means ± standard error.
4. Discussion
A close relationship between rumen pH and temperature as indicated by AlZahal et al. (2009)
would be expected to be inverse and to arise especially during intensive postprandial
fermentation reflecting both decreasing rumen pH but increasing rumen temperature. In the
present study, the correlations between rumen pH and temperature were considerably lower
than those reported in earlier experiments. An inverse relationship of r=-0.39 between rumen
pH obtained by manual determination in fluid withdrawn from the ventral rumen sac of sheep
and bolus temperature measured in vivo was found by Kaur et al. (2010). AlZahal et al.
(2008) observed a correlation of r=-0.46 between ventral rumen pH and temperature utilizing
an indwelling electrode measuring both parameters simultaneously in lactating dairy cows,
whereas the direct proximity of both sensors may have contributed to the close relationship.
The authors developed an equation for the prediction of rumen pH from rumen temperature
and thus discussed the potential of rumen temperature for the detection of SARA in cattle. In
the present experiment, rumen pH measured via both methods was distinctly closer correlated
to dorsal than to ventral temperature. Thus, under the present conditions, the potential
contribution of rumen temperature measurement to the prediction of rumen pH and the use as
an indication of SARA may depend on the site of intraruminal temperature determination.
0 60 120 180 240 300 360 420 480
Time after feeding (min)
38.2
38.4
38.6
38.8
39.0
39.2
39.4
39.6
39.8
40.0
Ru
men
tem
per
atu
re(°
C)
0 60 120 180 240 300 360 420 480
Time after feeding (min)
38.2
38.4
38.6
38.8
39.0
39.2
39.4
39.6
39.8
40.0
Ru
men
tem
per
atu
re(°
C)

Paper III
75
A close correlation (r=0.65) between reticulum temperature measured by an indwelling probe
and rectal temperature of intact dairy cows was observed by Bewley et al. (2008) and based
on a large amount of paired samples which were taken during several seasons. Burns et al.
(2002) used the same technique in cows near the occurrence of oestrus and reported a
relationship of r=0.50 between reticular and rectal temperature. The restricted postprandial
sampling times may have contributed to the low relationship of rumen and rectal temperature
in the present trial. Though after feeding a time effect was observed for rumen temperature,
rectal temperature may have been less affected causing a low correlation. Uncertainty exists
whether an outflow of heat through the perforating rumen cannula has contributed to the low
relationship of the two parameters. However a close correlation between rumen and rectal
temperature (r=0.92) was reported for rumen-fistulated lactating cows in a former study using
a prototype rumen bolus (Sievers et al., 2004).
Observations concerning sensor drift of indwelling devices for rumen pH measurement were
diverse. Penner et al. (2006) reported partially undirected but not significant pH drift after 72
hours using an encapsulated electrode for pH measurement in the ventral rumen sac of dairy
cows. In a former study, Enemark et al. (2003) utilized devices which were initially
developed for marine animals and observed a slightly positive electrode drift after 10 days of
continuous application in the reticulum of cows. In a study of Kaur et al. (2010) a predecessor
generation of probes for intraruminal pH, temperature and pressure measurement produced by
the same manufacturer was evaluated utilizing fistulated sheep in 10 day periods. Bolus pH
sensor drift was visually apparent after 48 h and increased steadily from that time. The
technical comparability of both probe series may be limited due to constructional differences,
as the former boluses were equipped with ISFET sensors for pH measurement, which may
exhibit long-term drift and low performance in comparison to glass electrodes (Oelssner et al.,
2005). The inconsistent and partially undirected pH sensor drift in the present study and the
wide range reported for sensors in earlier experiments suggested the need to assess occurrence
and direction of pH sensor drift individually and depending on application time. Therefore
further investigations of direction, amount and time-dependence of pH sensor drift seemed to
be recommended prior to longer-term application of the evaluated boluses in intact animals.
Differing correlations between pH measurement via intraruminal probes and manual
determination were reported in earlier studies. Duffield et al. (2004) observed varying but
mainly weak relationships between pH measurement via a device placed in the ventral sac of
the rumen of cows and manual pH determination in the second 200 ml of rumen fluid gained
by a tube-like probe through a rumen cannula from different intraruminal sites (Cranial-

Paper III
76
ventral: r=0.25, Caudal-ventral: r=0.24, Central: r=0.58, Cranial-dorsal: r=0.53). A rather low
correlation (r=0.46) between pH readings gained by the former probe generation produced by
the same manufacturer as the boluses used in the present study and manual measurement was
investigated by Kaur et al. (2010). The closer correlation between bolus and manual pH data
in the present study may be due to the better performance of the used glass membrane pH
sensors and the potentially wider distance of probe and manual sampling in the former
experiment. Other workers have proved closer correlations of r=0.85 (Dado and Allen, 1993),
r=0.88 (AlZahal et al., 2007), r=0.88 as well as r=0.98 (Penner et al., 2006) and r=0.98
(Phillips et al., 2010) between various indwelling probes and in vitro pH measurement in
withdrawn rumen fluid samples.
The minor correlations between dorsal bolus pH and manual pH readings and the low intra
method relationship between bolus pH measurement at the dorsal and ventral rumen sac,
respectively, may be due to methodological reasons. The probe used to measure dorsal rumen
pH was fixed to a cord to be immersed in the rumen content for approximately 10 cm at pre
morning feeding level and may have protruded into the rumen gas phase for several short
times during the sampling periods and thus may have produced a distortion of dorsal bolus pH
data.
Though in the present trial the different standard deviations of pH values determined by both
methods of rumen pH measurement indicated an unequal variation, the mean bolus pH was
only slightly higher than the mean manual pH. That is consistent with results of Kaur et al.
(2010), who found the probe pH to be 0.05 to 0.21 pH units higher than the manual pH
measured by a pH meter, depending on diet. Contradictory findings were observed in earlier
studies, were manual pH values were reported to be higher in rumen fluid removed through a
cannula than the pH measured in vivo in the rumen (Dado and Allen, 1993) or the reticulum
(Enemark et al., 2003) of dairy cows. The distance between the probe location and the site of
rumen fluid sampling was discussed as a possible explanation for the differences in pH
(Enemark et al., 2003).
The significance of the Pearson correlation coefficient as a tool of method comparison is
limited as it is a measure of the linearity between two variables, not of the agreement between
them. No indication of how the plotted data deviate from the line y = x can be derived (Lin,
1992) and data which seem to be in poor agreement can produce high correlations (Bland and
Altman, 1986). Furthermore it may be difficult to assess differences between methods by a
simple plot of the results of one method against those of the other. The method described by
Bland and Altman involved plotting the difference (y-axis) of the paired measurements

Paper III
77
against their arithmetic mean (x-axis). The true value is unknown and the mean is the best
available estimate (Bland and Altman, 1986). In the present study a deficient accuracy of
manual pH determination cannot be excluded and may be caused by inherent bias like
temperature effects (Meinrath and Spitzer, 2000). Such potentially restricted accuracy of
manual pH measurement may have been responsible for the limited agreement between both
methods. The positive bias of 0.07 in the Bland-Altman analysis would suggest the probes
typically gave slightly higher results than the standard manual method. However the trend line
indicated a lack of bias consistency with a pH overestimation in the range of rather low rumen
pH below 6.0 and a pH underestimation at higher rumen pH above 6.5. This is congruent with
the lower number of total data points of rumen pH below 6.0 detected by bolus measurement
(n=50) in comparison with the manual technique (n=144) and may be misleading especially in
interpreting rumen pH values to obtain indications of SARA. The calculated limits of
agreement were – 0.83 to 0.97 indicating rather low agreement within the given experimental
design. This range is expected to include 95 % of the values and its magnitude can be utilized
to assess the utility of an alternative method (MacFarlane et al., 2010). Bland and Altman
(1986) suggested that the acceptable range of the limits of agreement should be based on the
clinical impact of the results within this range. Though it would be difficult to define suitable
limits of agreement for rumen pH measurement, the determination of rumen pH requires a
high accuracy to ensure reliable results for both research and diagnostic purposes.
The evaluation of the accuracy of continuous measurement via indwelling rumen probes using
aggregated bolus data may be adequate for a comparison with spot sampling techniques same
as the described manual method. Actually such method comparison did not consider the
option of continuous measurement being the primarily advantage of the investigated boluses.
According to Gozho et al. (2005), SARA in cattle should be defined as a depression of rumen
pH below 5.6 for 3 or more hours per day. In intact animals, such intervals are hardly
detectable with spot sampling techniques.
Rumen pH decreased significantly due to feeding concentrate as previously reported for steers
(Jaakkola and Huhtanen, 1993; Owens et al., 2008) and cows fed high amounts of grain
(Mishra et al., 1970). Besides the effects of dietary concentrate, the feeding of diet 2 was
characterized by a higher OM intake level which may have contributed to the calculated diet
effect on rumen pH. The localization of measurement in the rumen did not influence pH
readings significantly (p>0.05). Though a considerable pH gradient would be expected to
emerge especially between reticulum and rumen, earlier experiments partially proved effects
of the site of measurement in the rumen on mean pH values (Duffield et al., 2004; Li et al.,

Paper III
78
2009). Despite the absence of such a pH gradient between dorsal and ventral rumen sac in the
present experiment, its possible emergence should be taken into consideration for potential
on-farm and research application of the evaluated boluses or similar unfixed devices for
intraruminal usage, as the probes may move through the reticulorumen if used in intact
animals without certainty of the exact site of measurement.
In the current study rumen temperature was affected by diet, however a rise in mean rumen
temperature associated with the feeding of concentrate was primarily observed at the dorsal
rumen. Similar to the evaluation of diet effects on rumen pH, the higher intake level of diet 2
may have increased the described effect on rumen temperature. AlZahal et al. (2009) reported
a significant increase of rumen temperature due to feeding high amounts of grain in
comparison to a mixed hay diet. Such effects may depend on the amount of concentrate fed as
in a study of Gasteiner et al. (2009) differences in rumen temperature of steers were not
significant between a 100 % hay and a 50 % concentrate diet. The postprandial development
of a temperature gradient in the rumen of dairy cows with an increased dorsal temperature due
to feeding high-concentrate diets was coherent as, first, concentrate would be expected to be
subjected to a faster ruminal degradation than forage and, secondly, the materials in the top
stratum of the rumen digesta are recently ingested and are subjected to a higher fermentative
activity than those contained in the middle and bottom strata of the rumen (Martin et al.,
1999; Tafaj et al., 2004).
5. Conclusion
The evaluated devices showed a moderate linear relationship and agreement of pH
measurement with the applied manual method, a fact that may as well be due to a deficient
accuracy of manual pH determination. Varying and partially undirected but low pH sensor
drift was observed. Indications for an inconsistent bias of bolus pH determination were found.
Effects of the site of measurement in the rumen were not observed for pH but for temperature,
may interact with the diet fed and should be taken into consideration for a potential use of
indwelling devices. Though the described indications of inaccuracy of bolus pH measurement
suggested the need of further improvement, the technique was promising especially due to the
option of continuous intraruminal measurement.

Paper III
79
Acknowledgements
The authors would like to thank the Niedersächsisches Ministerium für Wissenschaft und
Kultur for financial support. Furthermore, the assistance of the co-workers of the Institute of
Animal Nutrition and the Experimental Station of the Friedrich-Loeffler-Institute (FLI) in
Brunswick, Germany in performing the experiment and analysis as well as the Clinic for
Cattle of the University of Veterinary Medicine Hannover and Mr. Pat Fernley from Kahne
Limited, New Zealand, is gratefully acknowledged.
References
AlZahal, O., Kebreab, E., France, J., Froetschel, M., McBride, B. W., 2008. Ruminal
temperature may aid in the detection of subacute ruminal acidosis. J. Dairy Sci. 91,
202-207.
AlZahal, O., Rustomo, B., Odongo, N. E., Duffield, T. F., McBride, B. W., 2007. Technical
Note: A System for continuous recording of ruminal pH in cattle. J. Anim. Sci. 85,
213-217.
AlZahal, O., Steele, M. A., Valdes, E. V., McBride, B. W., 2009. The use of a telemetric
system to continuously monitor ruminal temperature and to predict ruminal pH in
cattle. J. Dairy Sci. 92, 5697-5701.
Bauman, D. E., Davis, C. L., Buchholtz, H. F., 1971. Propionate production in rumen of cows
fed either a control or high-grain, low-fibre diet. J. Dairy Sci. 54, 1282-1287.
Bewley, J. M., Einstein, M. E., Grott, M. W., Schutz, M. M., 2008. Comparison of reticular
and rectal core body temperatures in lactating dairy cows. J. Dairy Sci. 91, 4661-4672.
Bland, J. M., Altman, D. G., 1986. Statistical methods for assessing agreement between two
methods of clinical measurement. Lancet 8476, 307-310.
Burns, P., Wailes, W., Baker, P., 2002. Changes in reticular und rectal temperature during the
periestrous period in cows. J. Anim. Sci. 80(Suppl. 2), 128-129.
Dado, R. G., Allen, M. S., 1993. Continuous computer acquisition of feed and water intakes,
chewing, reticular motility and ruminal pH of cattle. J. Dairy Sci. 76, 1589-1600.
DLG (1997). Futterwerttabellen Wiederkäuer. 7 ed. DLG-Verlags GmbH, Frankfurt am Main.
Duffield, T., Plaizier, J. C., Fairfield, A., Bagg, R., Vessie, G., Dick, P., Wilson, J., Aramini,
J., McBride, B., 2004. Comparison of techniques for measurement of rumen pH in
lactating dairy cows. J. Dairy Sci. 87, 59-66.
Enemark, J. M. D, 2008. The monitoring, prevention and treatment of sub-acute ruminal
acidosis (SARA): A review. J. Vet. Med. Ser. A 176, 32-43.

Paper III
80
Enemark, J. M. D., Peters, G., Jorgensen, R. J., 2003. Continuous monitoring of rumen pH –
A case study with cattle. J. Vet. Med. Ser. A 50, 62-66.
Fordham, D. P., Rowlinson, P., McCarthy, T. T., 1988. Estrus detection in dairy cows by milk
temperature-measurement. Res. Vet. Sci. 44, 366-374.
Garrett, E. F., Pereira, M. N., Nordlund, K. V., Armentano, L. E., Goodger, W. J., Oetzel, G.
R., 1999. Diagnostic methods for the detection of subacute ruminal acidosis in dairy
cows. J. Dairy Sci. 82, 1170-1178.
Gasteiner, J., Fallast, M., Rosenkranz, S., Hausler, J., Schneider, K., Guggenberger, T., 2009.
Measuring rumen pH and temperature by an indwelling and wireless data
transmitting unit and application under different feeding conditions. Wien. Tierarztl.
Monatsschr. 96, 188-194.
GfE, 2001. Empfehlungen zur Energie- und Nährstoffversorgung der Milchkühe und
Aufzuchtrinder. DLG-Verlags GmbH, Frankfurt am Main.
Goering, H., Van Soest, P., 1970. Forage fibre analysis (apparatus, reagents, procedure and
some applications), Agric Handbook No 379, ARS-USDA, Washington D.C.
Gozho, G. N., Plaizier, J. C., Krause, D. O., Kennedy, A. D., Wittenberg, K. M., 2005.
Subacute ruminal acidosis induces ruminal lipopolysaccharide endotoxin release and
triggers an inflammatory response. J. Dairy Sci. 88, 1399-1403.
Jaakola, S., Huhtanen, P., 1993. The effects of forage preservation and proportion of
concentrate on nitrogen digestion and rumen fermentation in cattle. Grass. Forage
Sci. 48, 146-154.
Kadzere, C. T., Murphy, M. R., Silanikove, N., Maltz, E., 2002. Heat stress in lactating dairy
cows: a review. Livest. Prod. Sci. 77, 59-91.
Kaur, R., Garcia, S. C., Horadagoda, A., Fulkerson, W. J., 2010. Evaluation of rumen probe
for continuous monitoring of rumen pH, temperature and pressure. Anim. Prod. Sci.
50, 98-104.
Kleen, J. L., Hooijer, G. A., Rehage, J., Noordhuizen, J. P. T. M., 2003. Subacute ruminal
acidosis (SARA): a review. Vet. Med. Ser. A 50, 406-414.
Kleen, J. L., Hooijer, G. A., Rehage, J., Noordhuizen, J. P. T. M., 2009. Subacute ruminal
acidosis in dutch dairy herds. Vet. Rec. 164, 681-684.
Li, M., Penner, G. B., Hernandez-Sanabria, E., Oba, M., Guan, L. L., 2009. Effects of
sampling location and time, and host animal on assessment of bacterial diversity and
fermentation parameters in the bovine rumen. J. Appl. Microbiol. 107, 1924-1934.

Paper III
81
Lin, L. I. K., 1992. Assay validation using the concordance correlation coefficient. Biometrics
48, 599-604.
MacFarlane, P. D., Grint, N., Dugdale, A., 2010. Comparison of invasive and noninvasive
blood pressure monitoring during clinical anaesthesia in dogs. Vet. Res. Commun.
34, 217-227.
Maekawa, M., Beauchemin, K. A., Christensen, D. A., 2002. Effect of concentrate level and
feeding management on chewing activities, saliva production, and ruminal pH of
lactating dairy cows. J. Dairy Sci. 85, 1165-1175.
Martello, L. S., Savastano, H., Silva, S. L., Balieiro, J. C. C., 2010. Alternative body sites for
heat stress measurement in milking cows under tropical conditions and their
relationship to the thermal discomfort of the animals. Int. J. Biometereol. 54, 647-
652.
Martin, C., Devillard, E., Michalet-Doreau, B., 1999. Influence of sampling site on
concentrations and carbohydrate-degrading enzyme activities of protozoa and
bacteria in the rumen. J. Anim. Sci. 77, 979-987.
Meinrath, G., Spitzer, P., 2000. Uncertainties in determination of pH. Mikrochimica Acta
135, 155-168.
Mishra, M., Martz, F. A., Stanley, R. W., Johnson, H. D., Campbell, J. R., Hilderbr, E., 1970.
Effect of diet and ambient temperature-humidity on ruminal pH, oxidation reduction
potential, ammonia and lactic acid in lactating cows. J. Anim. Sci. 30, 1023-1028.
Morgante, M., Stelletta, C., Berzaghi, P., Gianesella, M., Andrighetto, I., 2007. Subacute
rumen acidosis in lactating cows: an investigation in intensive Italian dairy herds. J.
Anim. Physiol. Anim. Nutr. 91, 226-234.
Naumann C., Bassler R., 1993. Die chemische Untersuchung von Futtermitteln.
Methodenbuch Bd. 3 mit Ergänzungslieferungen 1983, 1988, 1993, 1997, 2004 und
2006. VDLUFA, Darmstadt, Germany.
Oelssner, W., Zosel, J., Guth, U., Pechstein, T., Babel, W., Connery, J. G., Demuth, C.,
Ganseve, M. G., Verburg, J. B., 2005. Encapsulation of ISFET sensor chips. Sensors
and actuators B-Chemical 105, 104-117.
Owens, D., McGee, M., Boland, T., O’Kiely, P., 2008. Intake, rumen fermentation and
nutrient flow to the omasum in beef cattle fed grass silage fortified with sucrose
and/or supplemented with concentrate. Anim. Feed Sci. Technol. 144, 23-43.

Paper III
82
Penner, G. B., Aschenbach, J. R., Gabel, G., Oba, M., 2009. Technical note: Evaluation of a
continuous ruminal pH measurement system for use in noncannulated small
ruminants. J. Anim. Sci. 87, 2363-2366.
Penner, G. B., Beauchemin, K. A., Mutsvangwa, T., 2006. An evaluation of the accuracy and
precision of a stand-alone submersible continuous ruminal pH measurement system.
J. Dairy Sci. 89, 2132-2140.
Phillips, N., Mottram, T., Poppi, D., Mayer, D., McGowan, M. R., 2010. Continuous
monitoring of ruminal pH using wireless telemetry. Anim. Prod. Sci. 50, 72-77.
SAS Institute Inc., 2004. SAS/STAT 9.1 User’s Guide. SAS Inst., Inc., Cary, NC.
Sievers, A. K., Kristensen, N. B, Laue, H. J., Wolffram, S., 2004. Development of an
intraruminal device for data sampling and transmission. J. Anim. Feed Sci. 13
(Supll. 1), 207-210.
Tafaj, M., Junck, B., Maulbetsch, A., Steingass, H., Piepho, H. P., Drochner, W., 2004.
Digesta characteristics of dorsal, middle and ventral rumen of cows fed with
different hay qualities and concentrate levels. Arch. Anim. Nutr. 58, 325-342.
Paper IV
83
Paper IV
Effects of niacin supplementation and dietary concentrate proportion on
body temperature, ruminal pH and milk performance of primiparous dairy
cows
M. Lohöltera, U. Meyer
a, C. Rauls
a, J. Rehage
b and S. Dänicke
a
aInstitute of Animal Nutrition, Friedrich-Loeffler-Institute (FLI), Federal Research Institute
for Animal Health, Bundesallee 50, 38116 Brunswick, Germany
bClinic for Cattle, School of Veterinary Medicine Hannover, 30173 Hanover; Germany
Archives of Animal Nutrition
Submitted

Paper IV
84
Abstract
The objective of this study was to investigate the effects of niacin and dietary concentrate
proportion on body temperature, ruminal pH and milk production of dairy cows. In a 2 × 2
factorial design, 20 primiparous Holstein cows (179±12 days in milk) were assigned to four
dietary treatments aimed to receive either 0 or 24 g niacin and 30% (Low) or 60% (High)
concentrate with the rest being a partial mixed ration composed of 60% corn and 40% grass
silage (On a dry matter basis). Ambient temperature and relative humidity were determined
and combined by the calculation of temperature humidity index (THI). Respiration rates,
rectal, skin and subcutaneous temperatures were measured. Milk production and composition
were determined. Ruminal pH and temperature were recorded in a frequency of 5 minutes
using wireless devices for continuous intraruminal measurement (Boluses). PH values were
corrected for pH sensor drift. The climatic conditions varied considerably but temporarily
indicated mild heat stress. Niacin did not affect skin, rectal and subcutaneous temperatures
but tended to increase respiration rates. High concentrate reduced skin temperatures at rump,
thigh and neck by 0.1 to 0.3 °C. Due to technical disturbances, not all bolus data could be
subjected to statistical evaluation. However, both niacin and high concentrate influenced
mean ruminal pH. High concentrate increased the time spent with a pH below 5.6 and ruminal
temperatures (0.2 to 0.3 °C). Niacin and high concentrate enhanced milk, protein and lactose
yield but reduced milk fat and protein content. Milk fat yield was slightly reduced by high
concentrate but increased due to niacin supplementation. In conclusion, niacin did not affect
body temperature but stimulated milk performance. High concentrate partially influenced
body temperatures and had beneficial effects on milk production.
Keywords: niacin, concentrate, body temperature, milk production
1. Introduction
The global surface temperature has increased within the last century (0.74±0.18 °C) and will
likely be elevated in the range of 1.8–4 °C until 2090-2099, depending on the prospective
greenhouse emission scenario (IPCC 2007). Rising ambient temperatures will probably
increase the incidence of heat stress in livestock which is initiated if a combination of
environmental conditions cause the effective temperature of the environment to be higher than
the thermo-neutral zone of an animal (Bianca 1962). Heat stress is well known to decrease dry
matter intake and milk performance of high-yielding dairy cows, which are particularly
susceptible to body heat load (Kadzere et al. 2002; West 2003; Bohmanova et al. 2007).

Paper IV
85
Elevated dissipation of excess body heat by rising peripheral vasomotor activity could
ameliorate the adverse effects of heat stress and thus contribute to the maintenance of health
and productivity.
In humans, the B-vitamin niacin or nicotinic acid can induce flushing (Andersson et al. 1977),
which is primarily characterized by cutaneous vasodilation. This process results to a
considerable extent from the niacin mediated activation of the G protein-coupled receptor
109A (GPR109A) in epidermal Langerhans cells (Benyo et al. 2005; Benyo et al. 2006),
leading to the production of prostaglandins, which act on receptors in the capillaries
(Kamanna et al. 2009). Previous studies revealed varying vasomotor and skin temperature
responses of heat stressed dairy cows to dietary niacin supplementation. DiCostanzo et al.
(1997) reported reductions in skin temperatures of lactating Holstein cows consuming 12 and
24 g niacin per day. However, increased consumption was not necessarily related to decreased
skin temperatures because a daily supplementation of 36 g did not have significant effects.
Furthermore, feeding 12 g encapsulated niacin enhanced evaporative heat loss of dairy cows
during periods of peak heat and was associated with reductions of vaginal and rectal
temperatures in the range of 0.2 to 0.4 °C during mild heat though skin temperatures were not
affected (Zimbelman et al. 2010). However, both studies used multiparous animals and it is
unclear, whether congruent effects are to be expected for primiparous cows which typically
have lower dry matter intakes (DMI) and milk yields (Ray et al. 1992).
Besides such thermoregulatory effects niacin can alter the microbial populations in the rumen
and these changes may affect the patterns of ruminal fermentation (Niehoff et al. 2009a). For
example, additive niacin was reported to increase the total numbers of rumen protozoa,
especially Entodinia (Kumar and Dass 2005). Moreover, the concentration of short chain fatty
acids (SCFA) may be altered due to supplemental niacin (Kumar and Dass 2005). In
ruminants, the microbial activity during fermentation in the reticulorumen can account for 3-
8% of the total heat production (Czerkawski 1980) and altered amounts of SCFA may
influence body heat increment (West 1999).
Moreover, high dietary proportions of concentrate may reduce the negative effects of warm
environmental conditions on the productivity of dairy cows as low fiber diets were observed
to be associated with lower heat production (Reynolds et al. 1991) and the large amounts of
easily fermentable carbohydrates fed in typical high concentrate diets should minimize the
production of body heat (West 1999).

Paper IV
86
Therefore the objective of the present study was to investigate the effects of niacin
supplementation and concentrate proportion in consideration of the thermal environment on
body temperatures, ruminal pH and milk production of primiparous dairy cows.
2. Materials and Methods
2.1 Experimental design, animals and feeding
The study was performed in 2010 at the experimental station of the Institute of Animal
Nutrition, Friedrich-Loeffler-Institute (FLI), in Brunswick, Germany, was approved by the
Lower Saxony State Office for Consumer Protection and Food Safety (LAVES), Oldenburg,
Germany (File Number 33.14-42502-04-085/09) and was conducted according to the
European Community regulations concerning the protection of experimental animals. The
experiment was part of a more comprehensive feeding trial executed to investigate a higher
number of animals, was started one day ante partum and continued during the complete
lactation (Unpublished data). The presented examinations were started in mid-april and lasted
until drying off at the beginning of august to test the effects of the assessed dietary treatments
under heat stress conditions.
In a 2 × 2 factorial design, 20 lactating primiparous German Holstein cows producing 16±3.7
kg milk per day balanced for bodyweight (597±47 kg) and stage of lactation (179±12 days in
milk (DIM)) were assigned to four dietary treatments. On a dry matter (DM) basis, the four
diets offered were aimed to be composed of 30% concentrate and 70% partial mixed ration
(PMR, 60% corn and 40% grass silage) (Group 1), 30% concentrate and 70% PMR
supplemented with 24 g niacin/d and animal (Group 2), 60% concentrate and 40% PMR
(Group 3) and 60% concentrate and 40% PMR supplemented with 24 g niacin/d and animal
(Group 4). The niacin was powdered, contained at least 99.5 % nicotinic acid (Lonza Ltd,
Basel, Switzerland) and was included in the pelletized concentrate. Except for niacin, all
rations were formulated to meet the requirements of the German Society of Nutrition
Physiology (2001). Water was offered for ad libitum intake. The cows were kept in group
pens in a free stall barn equipped with slatted floors and cubicles covered with rubber
mattresses. The PMR was offered in self-feeding stations (TYPE RIC, Insentec, B.V.,
Marknesse, The Netherlands), which were re-filled daily at approximately 10.00 h. All
animals were marked with ear transponders to record daily water and feed intake (DMI).
Concentrate was provided via computerized concentrate feeding stations (Insentec, B.V.,
Marknesse, The Netherlands). Though feed was aimed to be provided for ad libitum intake,
the available amount of concentrate and PMR was adjusted individually twice weekly basing

Paper IV
87
on the current respective DMI of both components in order to realize the intended dietary
forage to concentrate ratios in all feeding groups.
Table 1. Components and chemical composition of concentrates and partial mixed ration (Means ± SD).
Concentrate
Variable Group 1 Group 2 Group 3 Group 4 PMR#
Component (%)
Wheat grain 50 50 50 50
Soybean meal 26 26 26.8 26.8
Corn grain 20 20 20.8 20.8
Mineral premix* 4 2.4
Mineral premix including
supplemental niacin
4 2.4
Niacin in concentrate
(g/kg DM)
3.52 1.76
Nutrients (g/kg DM)
Crude ash 63 62 51 49 58
Crude protein 217 219 219 224 106
Ether extract 30 29 30 30 34
Crude fiber 33 34 34 34 220
NDF 128 130 185 156 440
ADF 47 47 47 47 241
Energy+ (MJ/kg)
NEL 8.2 8.2 8.3 8.3 6.4
Notes: #: Partial mixed ration (60 % maize silage, 40 % grass silage on DM basis); *: Per kg mineral feed: 140 g
Ca; 120 g Na; 70 g P; 40 g Mg; 6 g Zn; 5. 4 g Mn; 1 g Cu; 100 mg I; 40 mg Se; 5 mg Co; 1 000 000 IU vitamin
A; 100 000 IU vitamin D3; 1500 mg vitamin E; +: Calculation based on nutrient digestibilities measured with
wethers for silages (GfE 1991) and tabulated values for concentrate (DLG 1997); NEL = Net energy lactation.
2.2 Sample collection
Representative concentrate samples were taken once, corn and grass silage samples twice a
week and were pooled over four weeks. Milking was performed twice daily at 5.30h and
14.30h. Individual milk yield was recorded by automatic milk counters and bodyweight was
recorded automatically when the animals left the milking parlor. Milk samples were taken
twice weekly and were stored at 4 °C until analysis of composition.
2.3 Chemical analyses
Dry matter (DM), crude ash (Ash), crude fiber (CF), crude protein (CP), ether extract (EE),
neutral detergent fiber (NDF) and acid detergent fiber (ADF) were analysed according to the
protocols of the Association of German Agricultural Analysis and Research Centres
(Naumann and Bassler 1993), whereat ADF and NDF were expressed without residual ash.
Milk samples were analyzed for fat, protein and lactose using an infrared milk analyzer
(Milkoscan FT 6000, Foss Electric, Hillerød, Denmark).

Paper IV
88
2.4 Temperature measurements
The determination of respiration rate (RR) and body temperature was conducted at four preset
days per week. Measurements were performed at 8.00 h or 16.00 h at two days each to
consider diurnal variation. After morning or afternoon milking, respectively, all cows were
fixed in a feed fence in the free stall barn. After completed fixation the measurements were
initiated after a delay of 15 min to avoid data falsification mediated by potentially different
previous animal activity. Respiration rates were determined by twofold visual counting of
flank movements for 15 and 30 seconds and calculated as the mean of both values per minute.
Rectal temperature (Rectal T) was recorded via digital thermometry (Digitemp Servoprax
E315, Servopax GmbH, Wesel, Germany). Skin temperature (Skin T) measurement was
conducted using an infrared thermometer (Fluke 561, Fluke Corporation, Everett, WA, USA)
on shaved spots at both dextral and sinistral rump, dextral and sinistral thigh and sinistral
neck. Subcutaneous temperature (Subcutaneous T) was obtained by an implanted microchip
of 1.2 × 0.1 cm which was constructed as a passive radio frequency identification unit
(LifeChip, Destron Fearing, South Saint Paul, USA). The microchip was preloaded into a
sterile syringe by the manufacturer and was aseptically inserted subdermally in the sinistral
neck of each animal. Temperature measurement and subsequent information communication
were initiated using the energy of the radio signal transmitted by a Reader (Pocket Reader
EX, Destron Fearing, South Saint Paul, USA) using a frequency of 143.2 kHz, according to
manufacturer. The reader had to be applied in direct proximity of the microchip and displayed
both unique chip number and temperature.
Barn dry bulb temperature (Td) and relative humidity (RH) were recorded in a frequency of
10 minutes using two data loggers (Tinytag Plus 2, TGP-4500, Gemini Data Loggers,
Chichester, United Kingdom). One data logger each was placed in the free stall barn and at
the feed fence used for animal fixation, respectively. Td and RH were combined by the
calculation of the temperature-humidity-index (THI) according to Hahn (1999).
2.5 Rumen probes
Ruminal pH and temperature were determined using probes designed for continuous
intraruminal measurement (KB 3/04 bolus, Kahne Limited, New Zealand). The boluses were
constructed to determine ruminal pH and temperature in an adjustable frequency and were
built as a copolymer barrel of 145 mm length and 27 mm diameter with wings of altogether
185 mm attached to the tapered top. A glass membrane pH sensor was incorporated in the
bottom of the probes. Pre-use storage of the pH sensor was performed as recommended in a 3

Paper IV
89
molar potassium chloride solution. The temperature sensor was integrated in the probe
enclosure. Associated software was applied for the calibration of the boluses and to download
and export data (Kahne Data Processing System V 5.1). The pH sensors were calibrated as
described by Kaur et al. (2010) in a water bath of 40±0.1 °C in standard buffer solutions with
a pH of 7.0 (first) and 4.0 (second), respectively (ZMK-Analytik-GmbH, Bitterfeld-Wolfen,
Germany). A transceiver (Kahne KR 2001, Kahne Limited, New Zealand) was connected to a
computer by USB cable to transfer the calibration and setting instructions. Measured data
were stored in an integrated memory card. The probes were set to measure every five minutes,
inserted through the oesophagus using a balling gun and persisted in the reticulorumen of all
investigated cows throughout the experiment. In group 3, one cow was not equipped with a
rumen probe. Logged bolus data transmission was initialized on demand using a handheld
trigger device operating with a frequency of 134.2 kHz (Kahne Wand KW1, Kahne Limited,
New Zealand). Data were captured by a receiver with a frequency of 433.9 MHz (KR 2002,
Kahne Limited New Zealand) including antenna with a range of up to 30 meters, according to
manufacturer.
2.6 PH drift correction
An additional experiment was conducted for 70 days to test the occurrence of time dependent
pH sensor drift. Four lactating German Holstein cows equipped with large rubber cannulas in
the dorsal rumen sac were kept in a tethered barn with individual troughs and had free access
to water. Therefore the animals were fed twice daily on a ration consisting of 30%
concentrate, 42% corn silage and 28% grass silage, referring to DM. The concentrate
consisted of 27% wheat grain, 20% rapeseed meal, 10% oat grain, 10% barley grain, 5%
soybean meal, 5% dried sugar beet pulp, 2% mineral and vitamin premix, 0.4% calcium
carbonate and 0.1% sodium chloride. The contents of minerals and vitamins per kg premix
were as follows: 140 g Ca, 120 g Na, 70 g P, 40 g Mg, 6 g Zn, 5.4 g Ma, 1 g Cu, 100 mg I, 40
mg Se, 24 mg Co, 1.000.000 International Units (IU) vitamin A, 100.000 IU vitamin D3,
1.500 mg vitamin E, 90 mg pantothenic acid.
Four boluses were calibrated as described in the previous section and were set to measure
every 15 minutes. The probes were fixed to a cord of approximately 50 cm which was tied to
the inner cannula. One probe was inserted in the rumen of each cow. In the first week, the
boluses were removed daily in a frequency of 24 hours. From week 2 on the removal was
conducted every 7 days. After each removal, the boluses were cleaned thoroughly with
distilled water. Subsequently, pH measurement was conducted at 40±0.1 °C in four standard

Paper IV
90
buffer solutions (ZMK-Analytik-GmbH, Bitterfeld-Wolfen, Germany) with a pH of 4.0, 5.0,
6.0 and 7.0, respectively. This procedure was performed twice consecutively. The data over
this 70 days period were plotted to generate a simple linear regression equation. All ruminal
pH values determined in the main experiment were then corrected by the calculated linear rate
of increase in pH (0.0042) at the respective day of measurement.
2.7 Calculations
Temperature humidity indices (THI) were calculated according to Hahn (1999):
THI = 0.8 • td + RH • (td - 14.4) + 46.4
where td represents the dry bulb temperature (° C) and RH is the relative humidity expressed
as a decimal.
Minutes per day of ruminal pH below 5.6, 5.8 and 6.0, respectively, were determined by
multiplying the individual daily percentage of values below the respective threshold with the
total number of minutes per day to avoid data falsification by potentially missing values.
Fat-corrected milk (FCM) was estimated as following:
FCM [kg/d] = ((milk fat [%] × 0.15) + 0.4) • milk yield [kg/d] (Gaines 1928)
Ruminal pH data were corrected by the calculated linear rate of increase using the following
equation:
Ruminal pH = Measured ruminal pH – (0.0042 • Respective number of days after bolus
insertion)
2.8 Statistics
Statistical analyses were performed by the PROC MIXED procedure of the software package
SAS version 9.1 (SAS Institute Inc., 2004). Bolus data were only subjected to statistical
evaluation if pH or temperature values were available for complete days to consider potential
diurnal variation. Three different models were used for the evaluation of ruminal pH and
temperature data (Model 1), respiration rate, rectal, skin and subcutaneous temperatures
(Model 2) and milk yield, protein, fat, lactose and dry matter intake (Model 3). Dietary
concentrate proportion and niacin supplementation were considered as fixed effects in all
models and the interactions between these variables were investigated. In model 1, THI on a
daily basis and DMI were included as covariates. Time of day was included as an additional

Paper IV
91
covariate for the evaluation of mean ruminal pH and temperature. For model 2, THI were
divided in nine classes, with the first class being THI<68. Subsequent classes were defined as
one class for each 2 THI points thereafter until the last class which was THI>81.
Measurements conducted at THI class one were not included to test the effects of the fixed
effects exclusively under heat stress conditions. In model 2, THI class, time of day, DMI and
bodyweight were considered as covariates. In model 3, THI, DIM, DMI and bodyweight were
considered as covariates but were not included if the respective parameter was evaluated as
dependent variable. The individual cow effects resulting from the frequent measurements in
the course of the experiment were considered by the repeated procedure in all models. The
restricted maximum likelihood method (REML) was used to evaluate variances. Degrees of
freedom were calculated by the Kenward-Roger method. Pearson correlation coefficients
were calculated using the PROC CORR procedure. To investigate differences between least
square means, the “PDIFF” option was used applying a Tukey-Kramer test for post-hoc
analysis. Values used to quantify the effects of the mentioned variables were presented as LS
means. Differences were considered to be significant at p < 0.05.
3. Results
3.1 General results
The climatic conditions at the days of body temperature measurement are presented in Fig. 1
and were characterized by a considerable variation with a mean THI of 66±7.8 (Variation: 50-
84) as calculated from ambient temperature (20±5.7 °C, Variation: 9-35 °C) and RH
(74±17.2%, Variation: 37-100%).
The realized intake of concentrate and PMR met the aimed proportions in the different
feeding groups to a large extent (Group 1: 30±4% Concentrate, 70±5% PMR; Group 2:
30±5% Concentrate, 70±5% PMR; Group 3: 57±7% Concentrate, 43±7% PMR; Group 4:
56±8% Concentrate, 44±8% PMR; referring to DM). In contrast, the calculated daily intake of
supplemental niacin was below the intended quantity of 24 g per animal in the respective
groups (Group 2: 20.5±3.0 g; Group 4: 17.9±4.8 g).
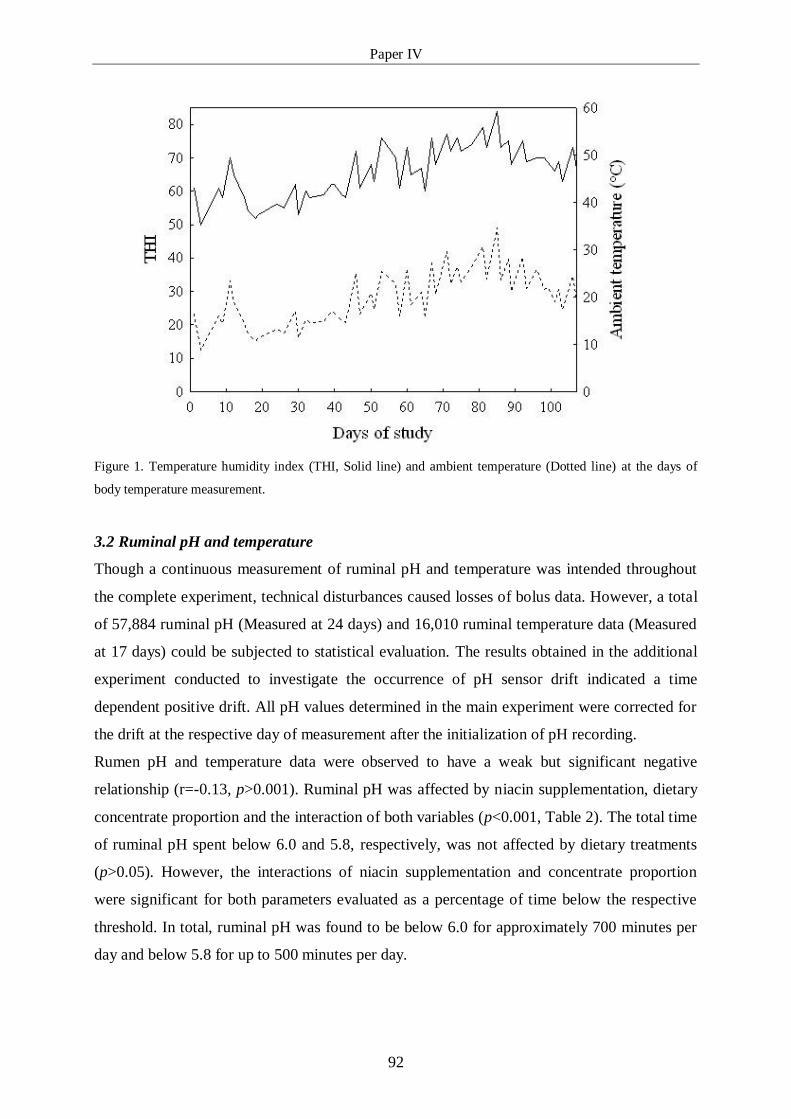
Paper IV
92
Figure 1. Temperature humidity index (THI, Solid line) and ambient temperature (Dotted line) at the days of
body temperature measurement.
3.2 Ruminal pH and temperature
Though a continuous measurement of ruminal pH and temperature was intended throughout
the complete experiment, technical disturbances caused losses of bolus data. However, a total
of 57,884 ruminal pH (Measured at 24 days) and 16,010 ruminal temperature data (Measured
at 17 days) could be subjected to statistical evaluation. The results obtained in the additional
experiment conducted to investigate the occurrence of pH sensor drift indicated a time
dependent positive drift. All pH values determined in the main experiment were corrected for
the drift at the respective day of measurement after the initialization of pH recording.
Rumen pH and temperature data were observed to have a weak but significant negative
relationship (r=-0.13, p>0.001). Ruminal pH was affected by niacin supplementation, dietary
concentrate proportion and the interaction of both variables (p<0.001, Table 2). The total time
of ruminal pH spent below 6.0 and 5.8, respectively, was not affected by dietary treatments
(p>0.05). However, the interactions of niacin supplementation and concentrate proportion
were significant for both parameters evaluated as a percentage of time below the respective
threshold. In total, ruminal pH was found to be below 6.0 for approximately 700 minutes per
day and below 5.8 for up to 500 minutes per day.

Paper IV
93
Tab
le 2
. E
ffec
ts o
f die
tary
conce
ntr
ate
pro
port
ion (
%)
and
nia
cin
su
pple
men
tati
on
on
ru
men
pH
an
d r
um
en t
emper
ature
of
dai
ry c
ow
s (L
SM
eans±
SE
)
P-v
alue
Conce
ntr
ate×
Nia
cin
<0.0
01
0.1
30
0.1
21
0.3
32
0.0
45
0.0
49
0.1
77
0.0
46
Nia
cin
<0.0
01
0.3
17
0.1
68
0.1
48
0.6
01
0.3
52
0.2
99
0.7
77
Conce
ntr
ate
<0.0
01
0.2
67
0.1
38
0.0
32
0.1
61
0.0
85
0.0
20
<0.0
01
Tre
atm
ent
60
% C
once
ntr
ate Nia
cin
(Gro
up
4, n=
5)
5.9
2±
0.0
04
69
9±
30
49
5±
28
32
4±
23
48±
2
34±
2
22±
2
39
.8±
0.0
4
Co
ntr
ol
(Gro
up
3, n
=4)
5.8
9±
0.0
04
71
5±
31
50
0±
29
31
3±
25
52±
2
36±
2
23
±2
39
.8±
0.0
2
30
% C
once
ntr
ate N
iaci
n
(Gro
up
2, n
=5)
5.9
1±
0.0
04
70
9±
34
49
3±
32
29
2±
27
49
±2
34
±2
20
±2
39
.5±
0.0
1
Contr
ol
(Gro
up 1
, n
=5)
6.0
0±
0.0
03
632
±29
410
±27
234
±23
44
±2
29
±2
16±
2
39.6
±0.0
1
Var
aib
le
Ru
min
al p
H
p
H<
6.0
(M
in/d
)
p
H<
5.8
(M
in/d
)
p
H<
5.6
(M
in/d
)
P
erce
nt
of
tim
e pH
<6.0
(%
)
P
erce
nt
of
tim
e p
H<
5.8
(%
)
P
erce
nt
of
tim
e p
H<
5.6
(%
)
Ru
min
al T
emp
erat
ure
(°C
)

Paper IV
94
In contrast, time of ruminal pH spent below 5.6 expressed in minutes per day (p=0.032) or as
a percentage (p=0.020) was increased by feeding high concentrate diets and was observed to
exceed 300 minutes per day in the groups aimed to consume 60% concentrate. Ruminal
temperature was not influenced by the supplementation of niacin but increased by 0.2 to 0.3
°C due to feeding high amounts of concentrate (p<0.001). Moreover, an interaction between
dietary niacin and concentrate was observed for ruminal temperature (p=0.046).
The patterns of diurnal variation in ruminal pH were to a large extent comparable among the
different feeding groups (Fig. 2). PH generally decreased between 0 and 2h and was
afterwards subjected to gradual increases reaching a peak at the time of PMR re-filling at
approximately 10h. Subsequently, pH values declined again and remained on a relatively low
level until they increased again in the late evening. However, ruminal pH showed a different
progression in feeding group 3 because it further decreased after 18.00 h.
Figure 2. Diet effects on diurnal variation in ruminal pH of dairy cows (● group 1, ○ group 2, ▲ group 3, ∆
group 4. Values are presented as means per hour).
An example of individual one-day courses of ruminal pH and temperature of two selected
cows during warm environmental conditions (THI=73) is given in Fig. 3. The ruminal pH of
both presented animals was generally characterized by a considerable short-term variation and
the individual differences in pH were visually apparent. Ruminal temperature was observed to
be on a relatively high and stable level until approximately 10 h in the morning. However, it

Paper IV
95
was repeatedly subjected to abrupt declines which could mainly be assigned to drinking
events.
Figure 3. Example of one-day variation in ruminal pH and temperature of two dairy cows at warm environmental
conditions (Temperature humidity index = 73). The presented animals were the individuals with the highest (PH:
Dotted lines; Temperature: Empty symbols ○) and the lowest mean pH (PH: Solid lines; Temperature: Closed
symbols ●) of all animals throughout the experiment.
3.3 Body temperature
The supplementation of niacin did not affect the investigated measures of body temperature
during periods of THI≥68 (p>0.05, Table 3). Feeding high proportions of concentrate
significantly reduced skin temperatures measured at sinistral rump (p<0.001), sinistral thigh
(p=0.007), dextral thigh (p=0.003) and neck (p=0.038), respectively, in the range of 0.1 to 0.4
°C. Rectal temperatures tended to decrease due to high concentrate (p=0.050), though the
changes were below 0.2 °C. Respiration rates were not significantly altered by the tested
dietary treatments, but tended to increase due to additive niacin (p=0.097). Mean rectal
temperatures were found to be approximately 38.5 °C, whereas subcutaneous temperatures
were almost 37 °C and skin temperatures did not exceed 36.5 °C. Positive correlations were
observed among all body temperature and respiration rate data and the calculated THI (Table
4).

Paper IV
96
Tab
le 3
. E
ffec
ts o
f die
tary
conce
ntr
ate
pro
port
ion (
%)
and
nia
cin
su
pple
men
tati
on
on
skin
, re
ctal
an
d s
ub
cuta
neo
us
tem
per
ature
s as
wel
l as
res
pir
atio
n r
ates
of
dai
ry c
ow
s at
TH
I1≥
68
(L
SM
eans±
SE
)
P-v
alue
Conce
ntr
ate×
Nia
cin
0.5
00
0.3
35
0.8
83
0.8
31
0.9
72
0.6
28
0.1
15
0.9
84
1 T
emp
erat
ure
hum
idit
y i
ndex
.
2 S
kin
T, sk
in t
emper
ature
; R
ecta
l T
, re
ctal
tem
per
atu
re;
Su
bcu
tan
eou
s T
, su
bcu
tan
eou
s te
mp
erat
ure
; R
R, re
spir
atio
n r
ate
(Bpm
, bre
aths
per
min
ute
).
Nia
cin
0.3
42
0.8
31
0.1
88
0.6
24
0.9
28
0.2
58
0.4
52
0.0
97
Conce
ntr
ate
<0.0
01
0.1
14
0.0
07
0.0
03
0.0
38
0.0
50
0.1
99
0.2
40
Tre
atm
ent
60
% C
once
ntr
ate Nia
cin
(Gro
up
4, n=
5)
36
.0±
0.0
8
36
.1±
0.0
7
35
.7±
0.0
8
35
.8±
0.0
9
36.2
±0.0
7
38
.4±
0.0
5
36
.8±
0.0
6
48
.6±
1.9
4
Co
ntr
ol
(Gro
up
3, n
=4)
36
.1±
0.0
8
36
.2±
0.0
7
35
.8±
0.0
8
35
.7±
0.0
9
36
.2±
0.0
7
38
.5±
0.0
5
36
.8±
0.0
6
45
.5±
2.0
8
30
% C
once
ntr
ate N
iaci
n
(Gro
up
2, n
=5)
36
.4±
0.0
8
36
.3±
0.0
7
36
.0±
0.0
8
36
.1±
0.0
9
36
.3±
0.0
7
38
.5±
0.0
5
36
.8±
0.0
6
51
.2±
1.9
5
Contr
ol
(Gro
up 1
, n
=5)
36.4
±0.0
7
36.3
±0.0
7
36.1
±0.0
8
36.0
±0.0
8
36.3
±0.0
7
38.6
±0.0
5
36.9
±0.0
6
48.1
±1.8
9
Var
aib
le2
Sk
in T
(°C
)
R
um
p s
inis
tral
Rum
p d
extr
al
Thig
h s
inis
tral
Thig
h d
extr
al
Nec
k
Rec
tal
T (
°C)
Su
bcu
tan
eou
s T
(°C
)
RR
(B
pm
)

Paper IV
97
Skin temperatures determined at different body sites were interrelated in the range of r=0.69
to r=0.89 and were closely correlated to both subcutaneous temperature (r=0.66 to r=0.74) and
THI (r=0.70 to r=0.78). In contrast, the correlation coefficients between rectal temperatures
and respiration rates, respectively, and skin as well as subcutaneous temperatures and THI
were less close (r= 0.43 to r=0.62).
Table 4. Correlation coefficients between THI1 and body temperature measures (°C) as well as respiration rates
of dairy cows
Skin T
Parameter2
Rump
sinistral
Rump
dextral
Thigh
sinistral
Thigh
dextral Neck Rectal T Sub T
RR
(BPM) THI
Skin T
Rump sinistral / 0.77** 0.78** 0.74** 0.69** 0.47** 0.66** 0.50** 0.70**
Rump dextral 0.77** / 0.81** 0.83** 0.78** 0.49** 0.72** 0.53** 0.78**
Thigh sinistral 0.78** 0.81** / 0.89** 0.80** 0.52** 0.74** 0.57** 0.76**
Thigh dextral 0.74** 0.83** 0.89** / 0.78** 0.50** 0.72** 0.56** 0.74**
Neck 0.69** 0.78** 0.80** 0.78** / 0.46** 0.74** 0.53** 0.76**
Rectal T 0.47** 0.49** 0.52** 0.50** 0.46** / 0.44** 0.52** 0.43**
Sub T 0.66** 0.72** 0.74** 0.72** 0.74** 0.44** / 0.52** 0.70**
RR (Bpm) 0.50** 0.53** 0.57** 0.56** 0.53** 0.52** 0.52** / 0.62**
THI 0.70** 0.78** 0.76** 0.74** 0.76** 0.43** 0.70** 0.62** / 1 Temperature humidity index.
2 Skin T, skin temperature; Rectal T, rectal temperature; Sub T, subcutaneous temperature; RR, respiration rate
(Bpm, breaths per minute).
**P<0.01.
3.4 Milk performance and feed intake
DMI was lower in the groups fed on high concentrate (p<0.001, Table 5). Both the
supplementation of niacin and feeding 60% concentrate increased milk yield (p<0.001).
However, the interaction between both factors revealed relatively higher elevations of milk
yield due to niacin supplementation if the animals were fed on high percentages of
concentrate (p<0.001). This cumulative effect resulted in a total difference of approximately
7.7 kg milk per day and animal between feeding group 1 (21.9 kg) and feeding group 4 (29.6
kg). In contrast, FCM was not affected by dietary concentrate but increased by more than 2 kg
due to additional niacin (p<0.001). Milk fat percent was decreased by both niacin
supplementation and high concentrate and the interaction showed larger reductions due to
niacin addition if the animals were fed on high concentrate (p<0.001 each).

Paper IV
98
Tab
le 5
. E
ffec
ts o
f die
tary
conce
ntr
ate
pro
port
ion (
%)
and
nia
cin
su
pple
men
tati
on
on
mil
k p
erfo
rman
ce o
f d
airy
cow
s (L
SM
eans±
SE
)
P-v
alue
Conce
ntr
ate×
Nia
cin
0.0
02
<0.0
01
<0.0
01
<0.0
01
0.4
25
0.0
25
0.2
74
0.0
27
0.2
16
Nia
cin
0.5
31
<0.0
01
<0.0
01
<0.0
01
<0.0
01
<0.0
01
0.0
70
<0.0
01
<0.0
01
Conce
ntr
ate
<0.0
01
<0.0
01
<0.0
01
0.0
03
<0.0
01
<0.0
01
0.3
83
<0.0
01
0.2
29
Tre
atm
ent
60
% C
once
ntr
ate Nia
cin
(Gro
up
4, n=
5)
15
.0±
0.3
29
.6±
0.2
3.3
8±
0.0
8
1.0
1±
0.0
2
3.4
5±
0.0
3
1.0
5±
0.0
2
4.8
7±
0.0
4
1.4
8±
0.0
2
27
.2±
0.4
Co
ntr
ol
(Gro
up
3, n
=4)
15
.9±
0.2
24
.3±
0.2
4.1
6±
0.0
7
1.0
2±
0.0
2
3.6
3±
0.0
3
0.8
9±
0.0
1
4.8
5±
0.0
3
4.8
5±
0.0
3
24
.9±
0.3
30
% C
once
ntr
ate N
iaci
n
(Gro
up
2, n
=5)
17
.7±
0.3
25
.6±
0.2
4.5
5±
0.0
7
1.1
4±
0.0
2
3.3
6±
0.0
3
0.8
6±
0.0
2
4.8
8±
0.0
4
1.2
5±
0.0
2
27
.2±
0.4
Contr
ol
(Gro
up 1
, n
=5)
17.0
±0.3
21.9
±0.2
4.6
4±
0.0
7
1.0
1±
0.0
2
3.4
9±
0.0
3
0.7
6±
0.0
1
4.7
8±
0.0
4
1.0
5±
0.0
2
24.0
±0.4
Var
aib
le
DM
I (k
g d
-1)
Mil
k y
ield
(k
g d
-1)
Mil
k f
at (
%)
Mil
k f
at y
ield
(kg d
-1)
Mil
k p
rote
in (
%)
Mil
k p
rote
in y
ield
(kg d
-1)
Mil
k l
acto
se (
%)
Mil
k l
acto
se y
ield
(kg d
-1)
FC
M (
kg d
-1)

Paper IV
99
Total milk fat yield was affected by the supplementation of niacin and high dietary
concentrate. Milk protein percent was reduced by supplemental niacin but increased due to
high concentrate proportions (p<0.001). Nevertheless, the total yield of milk protein was
significantly elevated by added niacin (More than 100 g per day and animal) and high
concentrate (More than 150 g per day and animal), respectively. Lactose yield was increased
by both supplemental niacin (p<0.001) and high concentrate (p<0.001), respectively. Same as
for milk yield, the interactions between concentrate proportion and niacin on both protein
(p=0.025) and lactose (p=0.027) yield were in the direction of higher positive responses to
niacin if the animals were fed on high concentrate.
4. Discussion
The climatic conditions in the course of the present experiment covered a relatively wide
range of THI with a considerable day to day variation. However, at different days THI were
on a level indicating the development of mild heat stress because heat stress may be initiated
if THI exceeds a value of 71 (Armstrong 1994).
The intended dietary concentrate proportions were met to a large extent but varied within the
limits of the performed feeding scheme. The temporary restriction of the individual access to
PMR in order to realize the aimed concentrate to forage ratios will likely explain the negative
effect of high dietary concentrate on total DMI because feeding more concentrate at the
expense of forage otherwise should have increased the voluntary feed intake of dairy cows
(Friggens et al. 1998; Shingfield et al. 2002; Kennedy et al. 2008).
The observed effects of niacin on ruminal pH were below 0.1 pH units and the relatively high
number of ruminal pH measurements will likely have contributed to the calculated statistical
significance. Accordingly, in previous experiments the supplementation of niacin did not
substantially affect the pH measured either in vitro in a fermenter (Horner et al. 1988) or in
rumen fluid of lactating Holstein cows (MadisonAnderson et al. 1997), respectively. Niacin
slightly reduced ruminal pH in the animals fed on low concentrate, a process that was not
confirmed for the high concentrate diets. This observation may be mediated indirectly by
stimulating effects of niacin on rumen protozoa such as Entodinia (Erickson et al., 1990;
Kumar and Dass 2005). Entodinia contribute to the degradation of fibrous constituents and
are able to consume starch granula (Erickson et al. 1991). Elevated SCFA concentrations due
to increased protozoal fiber degradation may have contributed to the decreased ruminal pH
values of the animals fed on low concentrate. These niacin-associated reductions in pH may
have been compensated by an increased protozoal inclusion of starch and thus altered

Paper IV
100
fermentation patterns of the higher amounts of starch available if the animals were fed on
high concentrate.
Both the decreased mean ruminal pH and the extended time spent below pH 5.6 due to
feeding high concentrate are consistent because it is known that increased dietary concentrate
may reduce the ruminal pH of ruminants (Mishra et al. 1970; Jaakkola and Huhtanen 1993;
Owens et al. 2008). However, the time of ruminal pH below specific low thresholds is not
necessarily elevated even by high amounts of concentrate (Nocek et al. 2002; Maekawa et al.
2002). Prolonged periods with a depressed ruminal pH may indicate subacute ruminal
acidosis (SARA) in cattle (Kleen et al. 2003; Morgante et al. 2007; Kleen et al. 2009).
Various thresholds have been proposed to identify the onset of SARA. For example, Garrett et
al. (1999) discussed a critical value of pH 5.5. Gozho et al. (2005) suggested the onset of
SARA to be associated with a ruminal pH below 5.6 for at least 3 hours a day. In the present
experiment, the daily interval of ruminal pH below 5.6 was found to be considerably higher
than 3 hours independent of dietary treatment and exceeded 5 hours in the groups fed on high
concentrate. Accordingly, the exclusive interpretation of the measured ruminal pH may
indicate the presence of SARA. However, SARA as a ruminal disorder is usually associated
with further clinical signs such as diarrhea, loss of body condition and laminitis (Nocek 1997)
but these symptoms were not observed to occur frequently in the current study.
Feeding high proportions of concentrate was accompanied by elevations of mean ruminal
temperatures in the range of 0.2 to 0.3 °C. Such increased ruminal temperatures were in
accordance with results obtained by AlZahal et al. (2009), who reported rises in mean ruminal
temperature (Approximately 0.7 °C) due to feeding a high concentrate TMR compared to a
control TMR. Such effects may depend on the total amount of concentrate fed because
Gasteiner et al. (2009) did not induce differences in ruminal temperature by feeding steers a
100% hay or a 50% concentrate diet, respectively.
Increases of ruminal temperatures but simultaneous reductions of both skin and rectal
temperatures of dairy cows during periods of heat stress due to high concentrate diets are not
necessarily contradictory. First, the fermentation in the rumen accounts for only 3-8% of the
total heat production (Czerkawski 1980). Secondly, feeding high fiber diets was reported to
result in greater metabolic and total heat production that may be associated with increased
rectal and skin temperatures because, for example, feeding cows on 100, 75 or 50% alfalfa
with the rest being a mixture of corn and soybean meal was associated with a heat production
of 688, 647 and 620 kcal per megacalorie ME (Coppock et al. 1964; Reynolds et al. 1991).
Moreover, in an early work of Stott and Moody (1960) lactating dairy cows subjected to high

Paper IV
101
ambient temperatures and fed on high fiber diets primarily composed of alfalfa hay were
reported to have higher body temperatures and respiration rates than cows fed on a highly
digestible low fiber diet. Such rising dietary heat increments due to high fiber rations may
arise because the metabolism of acetate is associated with a higher heat production than the
metabolism of propionate (West et al. 1999). MacRae and Lobley (1982) suggested that the
main reason for the larger thermal losses due to feeding roughage may be a different ability to
use excess acetate. In the same study it was hypothesized that the greater amounts of
propionate gained from high dietary concentrate should supply enough NADPH to enable
acetate to be converted into body fat whereas high fiber diets are related to larger amounts of
acetate and smaller propionate production leading to a metabolic excess of acetate that has to
be eliminated as heat.
The closer positive correlations between THI and respiration rates as well as skin
temperatures (r=0.62 to 0.78) than between THI and rectal temperatures (r=0.43) were
consistent. If homeothermic animals are within the so-called thermo-neutral zone, rectal
temperatures are normal at minimal heat production (Kadzere et al. 2002). If warm climatic
conditions induce the need to dissipate excess body heat to avoid hyperthermia, the loss of
heat via both the mammalian skin and respiratory moisture are pathways for the thermal
exchange between animal and environment and were thus observed to be elevated in lactating
cows in hot periods (Marai et al. 2007; Dikmen et al. 2008). Accordingly, respiration rates
and skin temperatures are likely to increase in a warm environment in order to maintain
thermal homeostasis before a response of core body or rectal temperatures is inevitable.
In humans, niacin was reported to induce flushing, a strong cutaneous vasodilation
(Andersson et al. 1977). The vasodilative effect of niacin is likely related to the production of
prostaglandins following the niacin mediated activation of the G protein-coupled receptor
109A (Benyo et al. 2005; Benyo et al. 2006; Kamanna et al. 2009). During mild heat stress,
the supplementation of niacin did not affect skin, subcutaneous or rectal temperatures in the
present study. Accordingly no indications for an elevated skin blood flow and a potential
alleviation of heat stress via increased dissipation of excess body heat were obtained. Current
information about impacts of niacin supplementation on vasodilation and body temperatures
of heat stressed dairy cows is rare and primarily bases on two experiments. Zimbelman et al.
(2010) did not report differences between skin temperatures of dairy cows assigned either to a
niacin treatment with a daily supplementation of 12 g or a control group under thermo-neutral
and mild heat stress conditions, respectively. However, evaporative heat loss was higher in
the niacin fed cows and both vaginal and rectal temperatures were reduced by 0.2 to 0.4 °C

Paper IV
102
during mild heat stress. The authors suggested that these observations were associated with a
niacin-induced cutaneous vasodilation. Though not significant, the cows fed on supplemental
niacin had higher respiration rates, a trend that was observed in the present study as well. The
lack of measurable niacin effects on skin temperatures remains to be elucidated but seems not
to be related to the investigated thermal environments or the total amount of additive niacin
fed. DiCostanzo et al. (1997) reported reduced skin temperatures at tail and rump of dairy
cows in the range of 0.3 to 0.4 °C due to a supplementation of 12 g niacin per day and animal
in a period of mild heat stress. However, increasing the addition of niacin to 24 g in a second
period of severe heat stress was not related to further reductions of skin temperatures as they
were only reduced at the tail (0.3 °C) and a daily amount of 36 g niacin was not related to any
reduction of skin temperatures in a period with thermo-neutral conditions.
The observed positive effects of dietary niacin on milk yields were only partially reflected in
previous literature as lower levels of niacin in the range of 6 to 12 g did either not affect
(MadisonAnderson et al. 1997; Niehoff et al. 2009b) or increase milk yields by 2.2 to 2.5 kg
(Cervantes et al. 1996; Drackley et al. 1998). Ottou et al. (1995) suggested that positive
lactational responses are mainly to be expected for cows in early lactation when the animals
are in a negative energy balance. However, niacin does not necessarily elevate milk
production during early lactation (Driver et al. 1990) and the hypothesis could not be
examined in the present experiment because the investigations were initiated when the
animals were in mid-lactation Moreover, the number of lactation seems not to be a pivotal
factor affecting the response to dietary niacin because Muller et al. (1986) used a large
quantity of animals and milk yield was improved for both first lactation and older cows by 0.7
to 0.9 kg.
Experimental results concerning the effects of niacin on milk protein were characterized by a
high variability (Niehoff et al. 2009a). For example, Drackley et al. (1998) reported decreased
protein contents but a trend towards increased total protein yield. The authors attributed the
reduced protein contents to dilutive effects because milk yield was increased. These findings
were in accordance with the current study where niacin decreased milk protein content but
increased protein yield in the range of 0.1 to 0.15 kg per day. Erickson et al. (1992) suggested
two possible explanations for the responses of milk protein to niacin. First, the amino acid
uptake by the mammary gland might be elevated because niacin may increase plasma insulin
(Horner et al. 1986) and intravenous insulin was shown to increase milk protein content
(Molento et al. 2002). Secondly, niacin supplementation was reported to enhance the
microbial protein synthesis (Horner et al. 1988).

Paper IV
103
Both milk fat percent and yield were not altered in different trials investigating the effects of
niacin (Driver et al. 1990; Aschemann et al. 2012). However, Muller et al. (1986) reported
unaffected milk fat percentages but improved fat yields and the greatest daily increases
approximating 0.08 kg were found for high-yielding cows. In the present study, milk fat yield
was slightly elevated but milk fat percent decreased, a fact that may be attributed to dilutive
responses considering the increases in milk yield. A similar tendency towards reduced milk
fat percent due to niacin was reported by Cervantes et al. (1996). Niehoff et al. (2009a)
suggested that changes in milk fat following dietary niacin may be due to effects at the
ruminal level but this thesis needs to be verified because most research on the effects of niacin
in the rumen focused primarily on the rumen and milk measurements were rare.
In accordance with the present results, increased levels of concentrate generally enhanced
milk yields of dairy cows and were found to stimulate protein yields in previous studies
(Agnew et al. 1996; O'Mara et al. 1998). However, FCM yield was not altered in the present
study. Milk fat percent decreased due to high dietary concentrate, an observation that is well
established because reduced forage to concentrate ratios are usually but not necessarily
associated with decreases in milk fat content (Sutton 1989).
5. Conclusions
Based on the present results, the potential of supplemental niacin to contribute to an
alleviation of heat stress in lactating primiparous dairy cows is likely to be limited.
Furthermore, the effects on ruminal pH and temperature were marginal or not significant.
High concentrate diets were associated with decreased skin temperatures and may thus reduce
the negative effects of body heat increment during warm environmental conditions. However,
the applicability of concentrate is restricted as high proportions were demonstrated to
decrease mean ruminal pH and the duration of pH spent below 5.6, respectively, increasing
the probability of the development of SARA. Both niacin and high dietary concentrate
slightly altered milk fat yield and increased milk, protein and lactose yield. Milk constituents
were rather decreased or not affected.
Acknowledgements
The study was supported by the Ministry for Science and Culture of Lower Saxony within the
network KLIFF – climate impact and adaptation research in Lower Saxony. Furthermore, the
assistance of the co-workers of the Institute of Animal Nutrition and the Experimental Station

Paper IV
104
of the Friedrich-Loeffler-Institute in Brunswick, Germany in performing experiment and
analysis is gratefully acknowledged.
References
Agnew KW, Mayne CS, Doherty JG. 1996. An examination of the effect of method and level
of concentrate feeding on milk production in dairy cows offered a grass silage-based
diet. Anim. Sci. 63:21-31.
AlZahal O, Steele MA, Valdes EV, McBride BW. 2009. The use of a telemetric system to
continuously monitor ruminal temperature and to predict ruminal pH in cattle. J. Dairy
Sci. 92:5697-5701.
Andersson RGG, Aberg G, Brattsand R, Ericsson E, Lundholm L. 1977. Studies on
Mechanism of Flush Induced by Nicotinic-Acid. Acta Pharmacol. Tox. 41:1-10.
Armstrong DV. 1994. Symposium - nutrition and heat-stress interaction with shade and
cooling. J. Dairy Sci. 77:2044-2050.
Aschemann M, Lebzien P, Hüther L, Döll S, Südekum KH, Dänicke S. 2012. Effect of niacin
supplementation on digestibility, nitrogen utilisation and milk and blood variables in
lactating dairy cows fed a diet with a negative rumen nitrogen balance. Arch. Anim.
Nutr., in press.
Benyo Z, Gille A, Kero J, Csiky M, Suchankova MC, Nusing RM, Moers A, Pfeffer K,
Offermanns S. 2005. GPR109A (PUMA-G/HM74A) mediates nicotinic acid-induced
flushing. J. Clin. Invest. 115:3634-3640.
Benyo Z, Gille A, Bennett CL, Clausen BE, Offermanns S. 2006. Nicotinic acid-induced
flushing is mediated by activation of epidermal langerhans cells. Mol. Pharmacol.
70:1844-1849.
Bianca W. 1962. Relative importance of dry- and wet-bulb temperatures in causing heat stress
in cattle. Nature 195:251-252.
Bohmanova J, Misztal I, Cole JB. 2007. Temperature-humidity indices as indicators of milk
production losses due to heat stress. J. Dairy Sci. 90:1947-1956.
Cervantes A, Smith TR, Young JW. 1996. Effects of nicotinamide on milk composition and
production in dairy cows fed supplemental fat. J. Dairy Sci. 79:105-113.
Coppock CE, Flatt WP, Moore LA, Stewart WE. 1964. Effect of hay to grain ratio on
utilization of metabolizable energy for milk production by dairy cows. J. Dairy Sci.
47:1330-1338.

Paper IV
105
Czerkawski JW. 1980. Novel estimate of the magnitude of heat produced in the rumen. Brit.
J. Nutr. 43:239-243.
DiCostanzo A, Spain JN, Spiers DE. 1997. Supplementation of nicotinic acid for lactating
Holstein cows under heat stress conditions. J. Dairy Sci. 80:1200-1206.
Dikmen S, Alava E, Pontes E, Fear JM, Dikmen BY, Olson TA, Hansen PJ. 2008.
Differences in thermoregulatory ability between slick-haired and wild-type lactating
Holstein cows in response to acute heat stress. J. Dairy Sci. 91:3395-3402.
DLG. 1997. DLG Futterwerttabellen Wiederkäuer (Feed value tables for ruminants). 7th ed.
DLG-Verlag, Frankfurt am Main.
Drackley JK, LaCount DW, Elliott JP, Klusmeyer TH, Overton TR, Clark JH, Blum SA.
1998. Supplemental fat and nicotinic acid for Holstein cows during an entire lactation.
J. Dairy Sci. 81:201-214.
Driver LS, Grummer RR, Schultz LH. 1990. Effects of feeding heat-treated soybeans and
niacin to high producing cows in early lactation. J. Dairy Sci. 73:463-469.
Erickson PS, Murphy MR, Clark JH. 1992. Supplementation of dairy-cow diets with calcium
salts of long-chain fatty-acids and nicotinic-acid in early lactation. J. Dairy Sci.
75:1078-1089.
Erickson PS, Murphy MR, Mcsweeney CS, Trusk AM. 1991. Niacin absorption from the
rumen. J. Dairy Sci. 74:3492-3495.
Erickson PS, Trusk AM, Murphy MR. 1990. Effects of niacin source on epinephrine
stimulation of plasma nonesterified fatty-acid and glucose-concentrations, on diet
digestibility and rumen protozoal numbers in lactating dairy-cows. J. Nutr. 120:1648-
1653.
Friggens NC, Emmans GC, Kyriazakis I, Oldham JD, Lewis M. 1998. Feed intake relative to
stage of lactation for dairy cows consuming total mixed diets with a high or low ratio of
concentrate to forage. J. Dairy Sci. 81:2228-2239.
Gaines W. 1928. The energy basis of measuring milk yield in dairy cows. Illinois Agric. Exp.
Sta. Bull. 308:401-438.
Garrett EF, Pereira MN, Nordlund KV, Armentano LE, Goodger WJ, Oetzel GR. 1999.
Diagnostic methods for the detection of subacute ruminal acidosis in dairy cows. J.
Dairy Sci. 82:1170-1178.
Gasteiner J, Fallast M, Rosenkranz S, Hausler J, Schneider K, Guggenberger T. 2009.
Measuring rumen pH and temperature by an indwelling and wireless data transmitting

Paper IV
106
unit and application under different feeding conditions. Wien. Tierarztl. Monatsschr.
96:188-194.
GfE (Gesellschaft für Ernährungsphysiologie). 1991. Guidelines for determining the
digestibility of crude nutrients in ruminants. J Anim Physiol An N. 65:229-234.
Gozho GN, Plaizier JC, Krause DO, Kennedy AD, Wittenberg KM. 2005. Subacute ruminal
acidosis induces ruminal lipopolysaccharide endotoxin release and triggers an
inflammatory response. J. Dairy Sci. 88:1399-1403.
Hahn GL. 1999. Dynamic responses of cattle to thermal heat loads. J. Anim. Sci.77:10-20.
Horner JL, Coppock CE, Schelling GT, Labore JM, Nave DH. 1986. Influence of niacin and
whole cottonseed on intake, milk-yield and composition, and systemic responses of
dairy-cows. J. Dairy Sci. 69:3087-3093.
Horner JL, Windle LM, Coppock CE, Labore JM, Lanham JK, Nave DH. 1988. Effects of
whole cottonseed, niacin, and niacinamide on in vitro rumen fermentation and on
lactating Holstein cows. J. Dairy Sci. 71:3334-3344.
IPCC. 2007. Climate change 2007: The physical science basis. Summary for policy makers.
Contribution of working group 1 to the fourth assessment report of the
intergovernmental panel on climate change. Cambridge University press, Cambridge
and New York.
Jaakkola S, Huhtanen P. 1993. The effects of forage preservation method and proportion of
concentrate on nitrogen digestion and rumen fermentation in cattle. Grass Forage Sci.
48:146-154.
Kadzere CT, Murphy MR, Silanikove N, Maltz E. 2002. Heat stress in lactating dairy cows: a
review. Livest. Prod. Sci. 77:59-91.
Kamanna VS, Ganji SH, Kashyap ML. 2009. The mechanism and mitigation of niacin-
induced flushing. Int. J. Clin. Pract. 63:1369-1377.
Kaur R, Garcia SC, Horadagoda A, Fulkerson WJ. 2010. Evaluation of rumen probe for
continuous monitoring of rumen pH, temperature and pressure. Anim. Prod. Sci. 50:98-
104.
Kennedy E, O'Donovan M, Delaby L, O'Mara FP. 2008. Effect of herbage allowance and
concentrate supplementation on dry matter intake, milk production and energy balance
of early lactating dairy cows. Livest. Sci. 117:275-286.
Kleen JL, Hooijer GA, Rehage J, Noordhuizen JPTM. 2003. Subacute ruminal acidosis
(SARA): a review. J. Vet. Med. Series A-Physiol. Pathol. Cl. 50:406-411.

Paper IV
107
Kleen JL, Hooijer GA, Rehage J, Noordhuizen JPTM. 2009. Subacute ruminal acidosis in
Dutch dairy herds. Vet. Rec. 164:681-684.
Kumar R, Dass RS. 2005. Effect of niacin supplementation on rumen metabolites in murrah
buffaloes (Bubalus bubalis). Asian Austral. J. Anim. 18:38-41.
Macrae JC, Lobley GE. 1982. Some factors which influence thermal-energy losses during the
metabolism of ruminants. Livest. Prod. Sci. 9: 447-456.
MadisonAnderson RJ, Schingoethe DJ, Brouk MJ, Baer RJ, Lentsch MR. 1997. Response of
lactating cows to supplemental unsaturated fat and niacin. J. Dairy Sci. 80:1329-1338.
Maekawa M, Beauchemin KA, Christensen DA. 2002. Effect of concentrate level and feeding
management on chewing activities, saliva production, and ruminal pH of lactating dairy
cows. J. Dairy Sci. 85:1165-1175.
Marai IFM, El-Darawany AA, Fadiel A, Abdel-Hafez MAM. 2007. Physiological traits as
affected by heat stress in sheep - A review. Small Ruminant Res. 71:1-12.
Mishra M, Martz A, Stanley RW, Johnson HD, Campbell JR, Hilderbr E. 1970. Effect of diet
and ambient temperature-humidity on ruminal ph, oxidation reduction potential,
ammonia and lactic acid in lactating cows. J. Anim. Sci. 30:1023-1028.
Molento CFM, Block E, Cue RI, Petitclerc D. 2002. Effects of insulin, recombinant bovine
somatotropin, and their interaction on insulin-like growth factor-I secretion and milk
protein production in dairy cows. J. Dairy Sci. 85:738-747.
Morgante M, Stelletta C, Berzaghi P, Gianesella M, Andrighetto I. 2007. Subacute rumen
acidosis in lactating cows: an investigation in intensive Italian dairy herds. J. Anim.
Physiol. Anim. Nutr. 91:226-234.
Muller LD, Heinrichs AJ, Cooper JB, Atkin YH. 1986. Supplemental niacin for lactating
cows during summer feeding. J. Dairy Sci. 69:1416-1420.
Naumann C, Bassler R. 1993. Die chemische Untersuchung von Futtermitteln. Methodenbuch
Bd. 3 mit Ergänzungslieferungen 1983,1988,1993, 1997, 2004 und 2006. VDLUFA-
Verlag, Darmstadt.
Niehoff, ID, Hüther L, Lebzien P. 2009a. Niacin for dairy cattle: a review. Brit. J. Nutr.
101:5-19.
Niehoff ID, Hüther L, Lebzien P, Bigalke W, Dänicke S, Flachowsky G. 2009b.
Investigations on the effect of a niacin supplementation to three diets differing in
forage-to-concentrate ration on several blood and milk variables of dairy cows. Arch.
Anim. Nutr. 63:203-218.
Nocek JE. 1997. Bovine acidosis: Implications on laminitis. J. Dairy Sci. 80:1005-1028.

Paper IV
108
Nocek JE, Allman JG, Kautz WG. 2002. Evaluation of an indwelling ruminal probe
methodology and effect of grain level on diurnal pH variation in dairy cattle. J. Dairy
Sci. 85:422-428.
O'Mara FP, Murphy JJ, Rath M. 1998. Effect of amount of dietary supplement and source of
protein on milk production, ruminal fermentation, and nutrient flows in dairy cows. J.
Dairy Sci. 81:2430-2439.
Ottou JF, Doreau M, Chilliard Y. 1995. Duodenal infusion of rapeseed oil in midlactation
cows. 6. Interaction with niacin on dairy performance and nutritional balance. J. Dairy
Sci. 78:1345-1352.
Owens D, Mcgee M, Boland T, O'Kiely P. 2008. Intake, rumen fermentation and nutrient
flow to the omasum in beef cattle fed grass silage fortified with sucrose and/or
supplemented with concentrate. Anim. Feed Sci. Tech. 144:23-43.
Ray DE, Halbach TJ, Armstrong DV. 1992. Season and lactation number effects on milk-
production and reproduction of dairy-cattle in Arizona. J. Dairy Sci. 75:2976-2983.
Reynolds CK, Tyrrell HF, Reynolds PJ. 1991. Effects of diet forage-to-concentrate ratio and
intake on energy-metabolism in growing beef heifers - whole-body energy and nitrogen-
balance and visceral heat-production. J. Nutr. 121:994-1003.
Shingfield KJ, Jaakkola S, Huhtanen P. 2002. Effect of forage conservation method,
concentrate level and propylene glycol on intake, feeding behaviour and milk
production of dairy cows. Anim. Sci. 74:383-397.
Stott GH, Moody E. 1960. Tolerance of dairy cows to high climatic temperatures on low
roughage ration. J. Dairy Sci. 43:871-872.
Sutton JD. 1989. Altering milk composition by feeding. J. Dairy Sci. 72:2801-2814.
West JW. 2003. Effects of heat-stress on production in dairy cattle. J. Dairy Sci. 86:2131-
2144.
West JW. 1999. Nutritional strategies for managing the heat-stressed dairy cow. J. Anim. Sci.
77:21-35.
West JW, Hill GM, Fernandez JM, Mandebvu P, Mullinix BG. 1999. Effects of dietary fiber
on intake, milk yield, and digestion by lactating dairy cows during cool or hot, humid
weather. J. Dairy Sci. 82:2455-2465.
Zimbelman RB, Baumgard LH, Collier RJ. 2010. Effects of encapsulated niacin on
evaporative heat loss and body temperature in moderately heat-stressed lactating Holstein
cows. J. Dairy Sci. 93:2387-2394.

General discussion
109
General discussion
Current and future climate change will likely induce massive and long-lasting environmental
modifications that may considerably alter the conditions of global feed and food production in
a world characterized by both growing human population and food demand. The exact
magnitudes of the prospective alterations are unknown and strongly depend on the future
greenhouse gas emission scenario (Eby et al., 2009). In general, the probably most important
climatic changes in relation to agriculture are increased atmospheric CO2 concentrations,
elevated ambient temperatures and altered precipitation patterns.
It is unknown whether rising atmospheric carbon dioxide may directly affect the feed value of
maize silage via altered contents of nutrients or mycotoxin contamination and if CO2 induced
ameliorations of the negative effects of future drought on nutrient formation are to be
expected due to decreases in plant water loss as described previously (Leakey et al., 2006;
Markelz et al., 2011). Hence, the effects of an atmospheric CO2 concentration of 550 ppm as
expected by the middle of the 21st century and drought stress on feed value and contents of
chosen mycotoxins of ensiled maize were investigated in a FACE experiment and the
digestibility of the generated silages was tested in sheep at different climatic conditions
(Paper I). In addition, the effects of enriched CO2, drought and varying thermal environments
on thermoregulation and blood parameters of sheep were investigated and it was tested
whether differing climatic conditions may affect the metabolization of DON in the ovine
rumen (Paper II).
Increasing future incidence and severity of heat stress are likely to have a variety of adverse
effects on health and performance of dairy cows (Nienaber et al., 1999; Kadzere et al., 2002).
High proportions of dietary concentrate and the supplementation of niacin to dairy cow
rations were suggested to potentially reduce the negative impact of heat by means of
decreased heat increment (concentrate) or improved dissipation of heat via increases in skin
blood flow due to vasodilatative properties (niacin) (West, 2003; Zimbelman et al., 2010).
Therefore, the effects of varying concentrate proportions and supplemental niacin on skin and
core body temperatures, respiration rates and milk performance of primiparous dairy cows
were assessed (Paper IV). In ruminants, the applicability of high concentrate diets is
generally limited as they can substantially decrease ruminal pH and lead to the development
of SARA (Kleen et al., 2003). Innovative technology such as wireless probes for continuous
measurement of ruminal pH and temperature may help to detect SARA in cattle (Enemark et
al., 2003; AlZahal et al., 2008; Kaur et al., 2010). New devices for an ongoing in vivo

General discussion
110
determination of both parameters were evaluated in dairy cows using method comparison
techniques in consideration of the effects of different dietary concentrate proportions, the
localization of measurement in the rumen and a potential occurrence of pH sensor drift
(Paper III-IV).
1 Feed value of maize silage
1.1 General aspects
Feeding ensiled maize plants that were grown in a fictitious future atmosphere to ruminants
which were exposed to different thermal environments including warm conditions that were
likely to induce heat stress to simulate future climatic conditions was an innovative approach
conducted to contribute to an estimation of the impact of climate change of agricultural
production. The absence of negative interactions between elevated CO2 concentrations during
maize growth and warm climatic conditions during feeding of the generated silages on
nutrient content and digestibility of future maize silage may be considered a positive aspect.
However, the expected future climatic alterations are likely to interact in a very complex
manner that could not be simulated completely within the present investigations. For example,
severe future increases in summer heat will not only directly impact livestock but its
occurrence during maize growth is known to disrupt kernel growth and endosperm starch
biosynthesis and could thus have serious negative effects on yield, nutrient content and
digestibility of maize silage (Cheikh and Jones, 1995; Monjardino et al., 2005). Though it is
difficult to induce experimental variations in ambient temperature in field studies such as
FACE trials, such investigations should be considered in future research to cover the complete
range of possible effects of climatic changes on future feed and food production.
1.2 Nutrients
The photosynthesis of C4 plants such as maize should theoretically be saturated at current
atmospheric CO2 concentrations (Ghannoum et al., 2000; Ghannoum, 2009) and therefore
future increases in carbon dioxide should not stimulate maize yield or affect the feed value of
ensiled whole maize plants in terms of altered nutrient contents. Generally, it has to be kept in
mind that the past rises in atmospheric CO2 that have taken place since the beginning of the
industrialization in the 19th
century (Initial concentration: Approximately 280 ppm) sum up to
a total elevation of nearly 40 % leading to a current concentration of approximately 385 to
390 ppm (Forster et al., 2007) and that C4 photosynthesis was likely not CO2-saturated at

General discussion
111
concentrations below 350 to 370 ppm as shown in Figure 3. Thus this past increases in
carbon dioxide will probably have stimulated the basal photosynthesis of C4 plants that were
grown under natural field conditions in comparison to the previous atmospheric concentration
and this photosynthetic stimulation may have been accompanied by qualitative reductions as
reported for C3 crops in terms of protein (Manderscheid et al., 1995; Högy and Fangmeier,
2008; Manderscheid et al., 2010).
The present results were in principle consistent with this theoretical background because the
cultivation of maize in an atmosphere containing 550 ppm CO2 did not influence the
concentration of crude protein, ether extract, starch or different fibre fractions such as NDF,
ADF and ADL in the produced silages in comparison to a control treatment of approximately
380 ppm CO2 (Paper I). In contrast, the protein contents of grassland and different C3 crops
such as wheat or barley were not only decreased by carbon dioxide enrichment but the quality
of protein for both human nutrition purposes or feeding of monogastric livestock species such
as pigs was considerably impaired due to decreases in essential amino acids (Manderscheid et
al., 1995; Wu et al., 2004; Milchunas et al., 2005; Högy and Fangmeier, 2008). These
observations were confirmed in a recent study of Porteaus et al. (2009) and the authors
concluded that for wheat increased future yields are likely to be accompanied by reductions in
the quality of both grain and straw in terms of depleted crude protein and protein to energy
ratio, respectively, and that this may lead to decreases in the total supply of protein that is
useable for livestock feeding. In the present experiment, the amino acid sequence of maize
protein was not determined and thus it cannot be excluded that alterations may have been
induced by CO2 enrichment. However, this should not negate the validity of the current
results as, first, whole plant maize silage is predominantly fed to ruminants for which the
source of N is known to be a less important factor than for monogastric species due to the
production of high-quality microbial protein in the forestomach and, secondly, maize silage
usually contains relatively low amounts of crude protein that do not exceed 10 % of silage
DM and therefore ensiled maize is primarily used as a supplier of energy in ruminant diets
(Jetana, et al., 2000; Kirkland et al., 2005; Keady et al., 2008). Hence potential CO2-induced
changes in the amino acid sequence of maize protein may be more important if other maize
products such as grain were used, for example, in pig or poultry feeding.
The described decreases in plant protein of various C3 species were mainly due to an
accumulation of carbohydrates that was induced by a photosynthetic stimulation due to
atmospheric carbon dioxide enrichment (Korner, 2000). In several studies, this accumulation
was reported to manifest in increased starch concentrations in wheat grain using both FACE
General discussion
112
or growth-chamber technology (Fangmeier et al., 1999; Wu et al., 2004; Porteaus et al.,
2009). Grain comprise approximately 70 % carbohydrates and almost all carbohydrates are
present as starch with less than 3 % other compounds such as sucrose, glucose or fructose
(Abouguen and Dappolon, 1973; Boyacioglu and Dappolonia, 1994). However, experimental
results were inconsistent as such CO2 effects on the concentration of starch were not
necessarily observed in wheat grain (Högy et al., 2009) or were not significant in some
experiments as reviewed by Högy and Fangmeier (2008). In maize silage, starch may be
considered the most important compound with regard to its feed value that often exceeds 30
% of DM and thus substantially contributes to the supply of dietary energy (Khan et al.,
2009). The ruminal degradability of maize starch is known to be relatively low, though it was
observed to be increased by ensiling, and bypass starch that escapes the fermentation in the
rumen is to a large extent subjected to enzymatic digestion in the intestine, a process that was
discussed to be energetically more efficient than ruminal fermentation and absorption of
SCFA (Huntington, 1997; Philippeau and Michalet-Doreau, 1998; Garnsworthy et al., 2009).
As presented in Paper I, the concentration of starch in the investigated maize silages was
found to be generally higher than 30 % and was not affected by CO2 enrichment. Thus,
increased future carbon dioxide will likely not increase the starch content of ensiled maize or
affect its potential future supply of feed energy.
The dry subplots in the present FACE experiment received 48 % less water than the well
watered subplots and drought treatment depleted maize grain yields by 35 % in the CO2
Control treatment and by 8 % in the FACE plots (Manderscheid et al., 2012). However,
drought did not affect the nutrient content of the investigated maize silages and no
interactions between CO2 and drought were observed. Consequently, in terms of crude
nutrients there were no indications of, first, direct drought effects and, secondly, of a potential
alleviation of negative effects of restricted water availability by a decreased stomatal
conductance and plant water loss due to enriched CO2 as described for maize in previous
literature (Leakey et al., 2006). That was surprising especially in consideration of the
distinctly lower drought-associated losses in grain yields if maize was grown at elevated
carbon dioxide and the reduced content of DM in experimental silage fresh matter that
demonstrated the presence of a drought effect (Paper I). These results can lead to the
conclusion that the water deficit may have been large enough to decrease yields but probably
was too low to result in measurable changes of the investigated nutrients in whole plant
silage.

General discussion
113
1.3 Digestibility
In general, the use of results from digestibility trials with sheep for the evaluation of feed for
other ruminants such as cattle may be restricted but can provide useful information if
characteristic interspecies differences are considered and when the available amounts of feed
are limited as in the present investigations. Mertens and Ely (1982) suggested that sheep have
a better capacity to digest high quality feed but cattle have a higher ability to digest low
quality feed and that the crossover point was at a DM digestibility of 660 g/kg. Experimental
results comprise a considerable variation and differences in apparent digestibility of feedstuff
between cattle and sheep may depend on feeding level or turnover rate (Bines et al., 1988;
Mulligan et al., 2001). However, Aerts et al. (1984) evaluated a large number of digestibility
trials involving 26 maize silages and concluded that sheep and cattle did not differ
systematically in digesting maize silages. Consequently, the present results may give
transferable indications for the estimation of the effects of increased atmospheric CO2
concentrations and drought during plant growth on the digestibility of maize silage in cattle as
well.
The lack of effects of elevated atmospheric CO2 on the digestibility of maize silage CF, ADF,
NDF, starch and OM was consistent with the absence of CO2 effects on the concentration of
crude nutrients. Information about the in vivo digestibility of plants that were grown in high
CO2 atmospheres is very rare, though several experiments were conducted in order to assess
the in vitro digestibility of different plant species (Table 3). These results were found to be
relatively inhomogeneous. However, with the exception of one experiment the in vitro
digestibility of DM or OM of the investigated C3 and C4 grasses and crops was either not
affected or reduced by elevated CO2 during growth. All decreases in digestibility were
induced by higher carbon dioxide concentrations (640 to 720 ppm) than those used in Paper I
and Paper II and these effects were not limited to C3 species. For example, the DM
digestibility of the C4 grass Bouteloua gracilis was found to be reduced by enriched CO2 as
well (Fritschi et al., 1999; Carter et al., 1999; Morgan et al., 2004; Milchunas et al., 2005).
Against this background the lack of negative CO2 effects on OM and nutrient digestibility of
the investigated ensiled whole maize plants may be regarded as a positive aspect. However,
the repeated detection of decreases in the in vitro digestibility of C3 and C4 species highlights
the importance of further research to evaluate the impact of high atmospheric CO2
concentrations that considerably exceed 550 ppm as expected by the end of the century.

General discussion
114
Table 3. Effects of atmospheric CO2 enrichment on the digestibility of various plants by different authors
Reference Enrichment
facility1
CO2-
concentration
Plant species Determination
of digestibility
Studied
fraction2
Akin
et al. (1994)
FACE 550 ppm Sudangrass
(Sorghum bicolor L.)
In vitro DM: n.s.
Bertrand
et al. (2007)
Growth
chambers
800 ppm Alfalfa
(Medicago sativa L.)
In vitro DM: n.s.
Carter
et al. (1999)
Growth
chambers
700 ppm Birds-Foot trefoil
(Lotus corniculatus L.)
In vitro Leave DM: ↓
Stem DM: n.s.
Fritschi
et al. (1999)
Greenhouses 640 ppm Rhizoma peanut
(Arachis galabra L.)
Bahiagrass
(Paspalum notatum)
In vitro OM: ↓
OM: n.s.
Lilley
et al. (2001)
Field tunnels 690 ppm Subterranean clover
(Trifolium subterraneum
L.) Phalaris
(Phalaris aquatica L.)
In vitro DM: n.s.
DM: n.s.
Milchunas
et al. (2005)
Open-top
chambers
720 ppm Shortgrass steppe:
45 % Bouteloua gracilis
(C4-grass)
25 % Stipa comata.
(C3-grass)
18 % Pascopyrum smithii
(C3-grass)
In vitro DM: ↓
Morgan
et al. (2004)
Open-top
chambers
720 ppm Bouteloua gracilis.
(C4-grass)
Pascopyrum smithii
(C3-grass)
Stipa comata
(C3-grass)
In vitro DM: ↓
DM: ↓
DM: ↓
Muntifering
et al. (2006)
FACE 516–533
ppm
Red clover
(Trifolium pratense L.)
White clover
(Trifolium repens L.)
In vitro DM: n.s.
Cell walls: n.s.
DM: n.s.
Cell walls: n.s.
Paper I FACE 550 ppm Maize (Zea mays L.) In vivo CF: n.s.
ADF, NDF:
n.s.
Starch: n.s.
OM: n.s.
Picon-
Cochard
et al. (2003)
FACE 600 ppm C3 grassland
community
In vitro DM: ↑
1 : FACE, free air carbon dioxide enrichment
2 : n.s., not significant; ADF, acid detergent fibre; NDF, neutral detergent fibre; CF, crude fibre; DM, dry matter;
OM, organic matter

General discussion
115
The climatic conditions during feeding were related to the most marked effects on the
digestibility of ADF, NDF and OM of maize silage (Paper I). The coldest climate induced the
lowest digestibilities of ADF, NDF and, by trend, CF, though the positive effects of heat on
fibre digestibilities were not reflected in OM digestibility indicating compensations via altered
digestibilities of other nutrients. In general, increases in nutrient or diet digestibility due to
heat exposure during feeding may improve the feed utilization in ruminants. That may be of
particular importance if heat stress induces reductions in DM intake as illustrated for cows in
Table 2. Higher digestibilities of plant cell walls during warm environmental conditions may
compensate for a part of the usually reduced intake of feed energy that takes place in periods
of increased expenditure of energy due to the dissipation of excess body heat as shown in
Figure 5.
Similar effects of the climatic conditions during feeding on the digestibility of ruminant diets
were described in previous experiments but the largest part of the relevant fundamental
research was conducted between 1970 and 1985. In general, changing ambient temperatures
can induce alterations in feed efficiency in sheep (Marai et al., 2007). Christopherson and
Kennedy (1983) reviewed the effects of the thermal environment on digestion in ruminants
and suggested that an energy deficit of the animal modulates gut function as, for example,
Graham et al. (1982) reported differences in gastrointestinal weights of cold- and warm-
acclimated sheep fed approximately at maintenance level. Furthermore, the increases in the
digestibility of DM and fibre in cattle and sheep diets at high ambient temperatures are related
to decreases in the rate of passage of ingesta through the gastrointestinal tract via reduced
motility and probably rumination activity (Christopherson and Kennedy, 1983). The retention
time of specific markers in the gastrointestinal tract of steers that were fed on forage based
diets was increased from 36.6 to 43.2 h and the longer retention time enhanced the
digestibility of DM, ADF and NDF (Warren et al., 1974). In several studies with sheep it was
demonstrated that the longer retention times of markers in the digestive tract of animals kept
in warm environments were primarily due to increased retention times in the reticulorumen,
the main localization of fibre degradation via microbial fermentation in ruminants, and that
post-ruminal retention time was either not or inconsistently affected (Westra and
Christopherson, 1976; Kennedy et al., 1977; Kennedy and Milligan, 1978; Kennedy et al.,
1982). The improved cell wall digestibility in the current experiment (Paper I) due to heat
exposure was accompanied by increases in rectal and skin temperatures, respiration rates and
water usage that occurred mainly within the physiological variation of sheep (Paper II).
However, the shifts in body temperatures and respiratory activity indicated the presence of

General discussion
116
heat effects and the need to dissipate excess body heat. Therefore the retention time of ingesta
in the forestomach was likely increased as well during periods of mild and severe heat leading
to an improved ruminal fermentation of maize cell walls as reported in previous literature.
In ruminants, variations in consumed amount and temperature of drinking water may
potentially contribute to effects of the thermal environment during feeding on the digestibility
of plant cell walls as observed in Paper I but were not considered in most experiments that
evaluated the impact of the climatic conditions on diet digestibility. The temperature of
drinking water in most commercial and experimental farms is likely to strongly depend on
ambient temperature if there is no device operated to adapt to shifts in ambient temperature by
means of cooling or heating. Hence, the cooling effect of drinking water should be higher
during cold environmental conditions and the potential reduction of ruminal temperatures may
increase during cool periods. It was reported that the intake of high amounts of water that is
differing in temperature can considerably affect reticuloruminal temperatures and therefore
the conditions of microbial fermentation may be temporarily influenced as well. For example,
Bewley et al. (2008b) investigated the impact of a forced intake of 25 kg hot (34.3 °C), warm
(18.2 °C) or cold (5.1 °C) water on reticular temperatures of dairy cows and reported
substantial declines with mean maximum drops of 2.2, 6.9 and 8.5 °C, respectively. Even
after 3 hours, reticular temperatures did not consistently return to baseline. Similar results
were reported for sheep (Brod et al., 1982). Though a single consumption of 25 kg water
should not occur frequently in well-managed dairy cow herds, even distinctly smaller amounts
of drinking water can considerably reduce the temperature in the forestomach by more than 4
°C within a few minutes and the recovery can last several hours as shown in Figure 6. The
total intakes of drinking water of the investigated cows numbered 711 and 716 at the
presented days were 33.5 and 57.1 kg in a warm environment (a) but amounted 53.5 and 69.0
kg (b) in thermo-neutral conditions. Day two (b) followed a warm period with THI ≥ 71 for
several days and this previous heat increment including the respective losses of water may
explain the higher water intakes during colder ambient temperatures. As indicated in Figure
6, almost all large reductions in ruminal temperatures were related to single consumptions of
more than 5 kg drinking water. Moreover, the abrupt decreases in ruminal temperatures
seemed to occur more frequently at the day with thermo-neutral conditions (b). This
observation may be related to both colder drinking water temperatures and the higher total
water intakes in comparison to the other investigated daily profile (a).

General discussion
117
Figure 6: Example of one-day variation in ruminal pH and temperature of two dairy cows at warm (a, THI=73)
and thermo-neutral (b, THI=64) conditions (Based on data published in Paper IV. Frequency of measurements:
5 min). The animals were chosen on the basis of mean overall pH and the presented individuals were the cows
with the highest (Cow 711. Dotted lines: pH, filled symbols: temperature) and lowest mean pH (Cow 716. Solid
lines: pH, empty symbols: temperature) of all investigated animals during the experiment. Arrows indicate the
onset of drinking events with an intake of ≥ 5 kg water
The microbial population in the rumen should be adapted to a range of temperatures and it
needs to be elucidated, which magnitude in ruminal temperature changes may cause the
ruminal environment to become suboptimal for certain microbe species. Recently, Uyeno et
al. (2010) investigated the molecular diversity of ruminal bacteria in Holstein heifers which
were exposed to 20, 28 and 33 °C and found that the relative proportions of the genera
Clostridium and Streptococcus increased but Fibrobacter decreased due to exposing the
animals to high ambient temperatures. However, these results were not related to drinking
water intake and temperature. In a previous study, Gengler et al. (1970) assessed the effects of
different ambient and hot ruminal temperatures on the concentrations of SCFA in non-
lactating fistulated Holstein cows and concluded that lower concentrations of SCFA were
found at high ambient temperatures but these effects were not due to alterations in ruminal
2 4 6 8 10 12 14 16 18 20 224.5
5.0
5.5
6.0
6.5
7.0
7.5
8.0
8.5
9.0R
um
inal
pH
30
32
34
36
38
40
42
Ru
min
al t
emp
erat
ure
(°C
)
2 4 6 8 10 12 14 16 18 20 224.5
5.0
5.5
6.0
6.5
7.0
7.5
8.0
8.5
9.0
Ru
min
al p
H
30
32
34
36
38
40
42
Ru
min
al t
emp
erat
ure
(°C
)
(a)
(b)
Time of day
2 4 6 8 10 12 14 16 18 20 224.5
5.0
5.5
6.0
6.5
7.0
7.5
8.0
8.5
9.0R
um
inal
pH
30
32
34
36
38
40
42
Ru
min
al t
emp
erat
ure
(°C
)
2 4 6 8 10 12 14 16 18 20 224.5
5.0
5.5
6.0
6.5
7.0
7.5
8.0
8.5
9.0
Ru
min
al p
H
30
32
34
36
38
40
42
Ru
min
al t
emp
erat
ure
(°C
)
(a)
(b)
Time of day
2 4 6 8 10 12 14 16 18 20 224.5
5.0
5.5
6.0
6.5
7.0
7.5
8.0
8.5
9.0R
um
inal
pH
30
32
34
36
38
40
42
Ru
min
al t
emp
erat
ure
(°C
)
2 4 6 8 10 12 14 16 18 20 224.5
5.0
5.5
6.0
6.5
7.0
7.5
8.0
8.5
9.0
Ru
min
al p
H
30
32
34
36
38
40
42
Ru
min
al t
emp
erat
ure
(°C
)
(a)
(b)
Time of day

General discussion
118
temperatures. Low ruminal temperatures as typically induced by the intake of high amounts of
cold drinking water were not evaluated in the cited experiment and therefore the validity of
the results was limited to the effects of high temperatures in the rumen. In sheep, there were
no significant differences in the in vitro gas production by rumen fluid gained from animals
that were exposed to warm or cold environments (Kennedy et al., 1982). Further research is
required to determine whether consumption and temperature of drinking water may affect the
microbial populations in the forestomach or the digestibility of ruminant diets.
1.4 DON in maize silage and its metabolization in the rumen
The probably most pronounced effects of the investigated treatments during growth of the
evaluated maize plants were a considerable drought-associated increase in the concentration
of DON in the generated silages and a reduction of this rises by cultivating the plants in a high
CO2 atmosphere of 550 ppm as reported in Paper I. As shown graphically in Figure 7,
enriched carbon dioxide did not directly affect the concentration of silage DON. That is in
accordance with previous literature as it was suggested that even distinctly higher CO2
concentrations up to 1000 ppm as expected by the end of the century should not affect
mycotoxigenetic fungi (Magan et al., 2011). Thus the CO2-induced reduction of DON in
maize silages made of plants that were grown under conditions of drought may be rather
related to a decreased plant water loss than to direct carbon dioxide effects. Reduced water
losses could have diminished the susceptibility of maize to fungal infection as reported
previously because the dry subplots in the FACE experiment received 48 % less water than
the well watered plots and high atmospheric CO2 is known to reduce the stomatal
conductance of maize (Arino and Bullerman, 1994; Leakey et al., 2006; Manderscheid et al.
2012). This indirect CO2-related decrease of DON in ensiled maize which was grown under
conditions of restricted water availability obviously represents a positive implication of the
prognosticated future atmospheric alterations. However, it remains unclear whether such a
reducing effect will be able to completely compesate for the probably increasing future
incidence of Fusarium fungi infections and hence DON contamination of maize due to an
elevated occurrence of drought in diverse regions and if the overall effects of climate change
on occurrence and concentration of mycotoxins in maize will be adverse or not. Future
increases in ambient temperatures were not investigated in the present experiment but may as
well play an important role in assessing conceivable climate change effects on, for example,
DON in maize plants as they exhibit the potential to modify growth and mycotoxin
production of different Fusarium species (Waalwijk et al., 2003; Jennings et al., 2004; Giorni
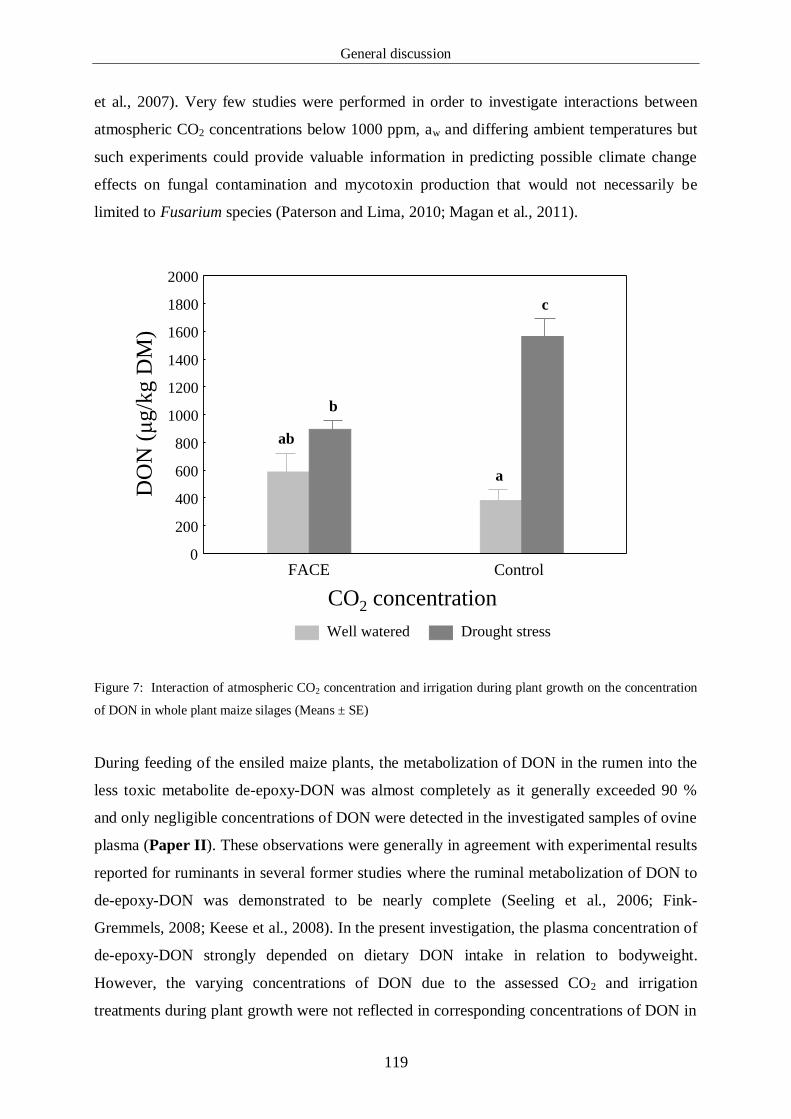
General discussion
119
et al., 2007). Very few studies were performed in order to investigate interactions between
atmospheric CO2 concentrations below 1000 ppm, aw and differing ambient temperatures but
such experiments could provide valuable information in predicting possible climate change
effects on fungal contamination and mycotoxin production that would not necessarily be
limited to Fusarium species (Paterson and Lima, 2010; Magan et al., 2011).
Well watered Drought stress
FACE Control
CO2 concentration
0
200
400
600
800
1000
1200
1400
1600
1800
2000
DO
N (
μg/k
g D
M)
ab
b
a
c
Figure 7: Interaction of atmospheric CO2 concentration and irrigation during plant growth on the concentration
of DON in whole plant maize silages (Means ± SE)
During feeding of the ensiled maize plants, the metabolization of DON in the rumen into the
less toxic metabolite de-epoxy-DON was almost completely as it generally exceeded 90 %
and only negligible concentrations of DON were detected in the investigated samples of ovine
plasma (Paper II). These observations were generally in agreement with experimental results
reported for ruminants in several former studies where the ruminal metabolization of DON to
de-epoxy-DON was demonstrated to be nearly complete (Seeling et al., 2006; Fink-
Gremmels, 2008; Keese et al., 2008). In the present investigation, the plasma concentration of
de-epoxy-DON strongly depended on dietary DON intake in relation to bodyweight.
However, the varying concentrations of DON due to the assessed CO2 and irrigation
treatments during plant growth were not reflected in corresponding concentrations of DON in

General discussion
120
plasma. It can be concluded that exposing the animals to warm or hot environmental
conditions did not impair the known detoxification potential of the rumen (Fink-
Gremmels, 2008) as neither the concentration of DON in the assessed plasma samples nor the
metabolization of DON into de-epoxy-DON were affected by the climatic conditions. Hence
the present results did not give indications for negative interactive effects of increasing future
ambient temperatures during feeding and the metabolization of dietary DON that may vary
due to a potentially altered contamination of maize exposed to drought and increased
atmospheric carbon dioxide. Accordingly, the differing concentrations of silage DON were
not reflected in corresponding effects of atmospheric CO2 and drought during maize
cultivation on nutrient or OM digestibility of the produced silages (Paper I) or body
temperature, respiration rate, water usage and blood parameters of sheep as presented in
Paper II.
2 Heat stress and nutritional alleviation
2.1 Dissipation of body heat
If homoiotherm livestock species are kept within the thermoneutral zone, heat production is
minimal at normal and relatively constant core body temperatures and rectal temperatures
may serve as a practical indicator of core body temperatures (Marai et al., 2007). The UCT is
referred to as the ambient temperature that induces the need to dissipate excess body heat due
to rises of core body temperature and the UCT may therefore indicate the onset of heat stress
(Kadzere, et al., 2002). In the current experiment, the exposure of castrated male sheep to
warm environmental conditions caused the rectal temperatures to rise reaching approximately
38.8 °C at mild heat and about 39.2 °C at severe heat treatment in comparison to the initial
mean of 38.4 °C during thermoneutral conditions (Paper II). According to the reference
values for adult sheep (38.4 to 40.0 °C) given by Hörnicke (1987), the increases were within a
physiological range that should theoretically not indicate the presence of noxious heat stress.
In contrast, the rises of skin temperatures and respiration rates due to an increasing thermal
load were considerably more pronounced as shown in Figure 8. That is in accordance with
the results reported in Paper IV because the thermal environment was closer related to skin
temperatures and respiration rates (r= 0.62 to 0.78) than to rectal temperatures (r=0.43) of the
investigated dairy cows. The mammalian skin is a central pathway for the exchange of heat
between animal and environment and the observed rises in skin temperatures are likely to be
the result of adjustments of skin blood flow in order to eliminate excess body heat via

General discussion
121
conductive and convective mechanisms (Silanikove, 2000). The evaporative dissipation of
heat is generally more efficient in hot and dry than in wet climates. In the course of the
balance experiment, RH was generally below 50 % and decreased with higher ambient
temperatures (Paper I and II). Therefore RH should not have limited respiratory heat loss
substantially. The potential elimination of body heat via sweating is restricted in unshorn
sheep due to the presence of a wool coat and hence the importance of the respiratory
dissipation of heat increases with rising ambient temperatures and a decreasing temperature
gradient between animal and environment, respectively. Respiratory heat loss accounts for up
to 60 % if sheep are kept at 35 °C (Marai et al., 2007). This process was reflected in the
current study because the total rises in breaths per minute between the exposure of sheep to
ambient temperatures of 15 and 25 °C were found to be approximately 35 but the rises
between ambient temperatures of 25 and 35 °C exceeded 50 breaths per minute (Paper II).
Figure 8: Effects of the thermal environment on rectal temperatures (°C; ▬; ●), skin temperatures
(°C; – – –; ■) and respiration rates (Breaths per minute; •••;▲) of sheep (Based on data published in Paper II.
Means ± SE): Values were pooled for CO2 and irrigation treatments during growth of ensiled maize fed.
14 16 18 20 22 24 26 28 30 32 34 36
Ambient temperature (°C)
28
30
32
34
36
38
40
Body t
emper
ature
(°C
)
40
60
80
100
120
140
Res
pir
atio
n r
ate
(Bre
aths
per
min
ute
)
14 16 18 20 22 24 26 28 30 32 34 36
Ambient temperature (°C)
28
30
32
34
36
38
40
Body t
emper
ature
(°C
)
40
60
80
100
120
140
Res
pir
atio
n r
ate
(Bre
aths
per
min
ute
)

General discussion
122
2.2 Concentrate
The processes that are associated with maintenance, digestion, metabolism and activity
generate heat and it was reported that the loss of heat of a 600 kg cow yielding 40 kg of 4 %
fat milk accounted for approximately 31 % of the total energy consumption (Coppock, 1985;
West, 1999). Though the production of heat is advantageous during cold environmental
conditions and enables the animal to maintain core body temperatures, the dissipation of such
large amounts of heat is a physiological burden during warm and hot periods. Increasing the
proportion of concentrate in diets fed to heat stressed animals provides two advantages. First,
reductions in voluntary feed intake and milk yield as summarized in Table 2 can be
compensated to a certain extent by increases in the content of dietary energy and nutrients
(Beede and Collier, 1986). Secondly, feeding high concentrate at the expense of roughage
ingredients was reported to reduce the heat production associated with feed consumption
(Coppock, 1985; Orskov and Macleod, 1990; Reynolds et al., 1991). These findings were in
accordance with the results reported in Paper IV as increased proportions of dietary
concentrate (60 % in comparison to 30 %, referring to DM) in rations of heat stressed
primiparous dairy cows were accompanied by reductions in skin temperatures in the range of
0.1 to 0.4 °C and tended to decrease rectal temperatures by 0.1 to 0.2 °C. West (1999)
suggested that the heat increment of high fibre diets exceeds the heat increment of rations
high in concentrate because the metabolism of acetate is related to a higher heat production
than the metabolism of propionate. This may be due to unequal abilities to use excess acetate.
The larger amounts of propionate associated with feeding high concentrate may provide
sufficient reduction equivalents to enable acetate to be converted into body fat but high fibre
rations lead to a higher production of acetate but lower propionate formation and excess
metabolic acetate has to be eliminated as heat (MacRae and Lobley, 1982).
Besides economic factors, the applicability of high concentrate rations in ruminant feeding is
primarily restricted for two reasons. Elevations in the production of SCFA may induce SARA
and though the supplementation of concentrate usually increases the voluntary feed intake of
dairy cows, very low forage to concentrate ratios may depress feed consumption (Friggens et
al., 1998; O'Mara et al., 1998; Andersen et al., 2003; Krause and Oetzel, 2006). Prolonged
periods of low ruminal pH may be useful indicators of SARA as according to Gozho et al.
(2005) the onset of SARA may be indentified by ruminal pH below 5.6 for at least 3 hours per
day. In the present experiment, ruminal pH was found to be lower than 5.6 for more than 3
hours in the cows fed on 30 % concentrate and for more than 5 hours in the animals fed on 60
% concentrate (Paper IV). These values were likely to be relatively reliable and should at

General discussion
123
least not overestimate ruminal pH as they were obtained after correcting for the observed
time-dependent positive drift of pH-sensors (Paper IV). Moreover, performing a Bland-
Altman comparison to manual pH measurement in rumen fluid in vitro revealed that the
boluses tended to overestimate low rumen pH below 6.0 indicating that the actual pH may
have been even lower (Paper III). However, the animals did not show enhanced clinical signs
of SARA such as diarrhea, loss of body condition, depressions in voluntary feed intake or
laminitis and both DMI and milk yield were within a normal magnitude for primiparous
Holstein cows (Nocek, 1997; Kleen et al., 2003; Le Cozler et al., 2009; Janovick and
Drackley, 2010). These observations suggested that the exclusive interpretation of ruminal pH
may possibly lead to an insufficient detection of SARA and that clinical examinations
imperatively have to be integrated in an expedient diagnosis. Within this context, the
usefulness of pH values measured by means of spot sampling techniques such as
rumenocentesis or the application of oro-ruminal probes has to be strongly questioned. As
shown in Figure 6 and in Paper IV ruminal pH is subjected to a considerable short term
variation and this variability was visually apparent even after aggregating ruminal pH values
of individual animals to means per hour (Figure 9). Furthermore, ruminal pH showed a
substantial postprandial decline irrespective of dietary concentrate percentage (Paper III).
Therefore the interpretation of results obtained by spot sampling techniques requires precise
information about recent intakes of water and amount and type of feed as considerable diet
effects on ruminal pH were verified (Paper III-IV).
An elevation of the proportion of dietary concentrate can reduce heat production and body
temperatures of heat stressed dairy cows and increase the energy density of rations in periods
of heat-induced decreases of DMI and milk performance. Thus higher percentages of
concentrate may represent a useful nutritional measure to reduce the negative impacts of heat
on the productivity of dairy cows. However, the applicable percentage of concentrate is
limited due to inherent physiological restrictions.

General discussion
124
2 3 4 5 6 7 8 9 10 11 12 13 14 15 16 17 18 19 20 21 22 23
Time of day
5.4
5.6
5.8
6.0
6.2
6.4
Ru
min
al p
H
Figure 9: Effects of dietary concentrate proportion on individual diurnal variation in ruminal pH of primiparous
dairy cows (Based on data published in Paper IV. Values are presented as means per hour. ●, solid line, 30 %
concentrate, 70 % roughage composed of 60 % maize silage and 40 % grass silage; ▲, dotted line, 60 %
concentrate, 40 % roughage composed of 60 % maize silage and 40 % grass silage).
2.3 Niacin
In humans, the therapeutic use of niacin is well known to induce flushing, a strong cutaneous
vasodilatation (Benyo et al., 2005; Kamanna et al., 2009). It was hypothesized that in dairy
cows this vasodilatative effect may be used in a beneficial manner as the supplementation of
niacin could improve the dissipation of excess body heat via an increased skin blood flow.
Two pilot studies demonstrated that additional niacin can reduce skin and rectal temperatures
of heat stressed lactating Holstein cows but the results were contradictory as such effects were
not observed consistently throughout the tested dietary and environmental treatments and
higher doses of niacin were not necessarily accompanied by respective reductions of body
temperatures (DiCostanzo et al., 1997; Zimbelman et al., 2010). In the current investigation,
the mean daily supplementation of 17.9 g and 20.5 g niacin to diets of primiparous dairy cows
did not influence ruminal, skin, subcutaneous and rectal temperatures during periods of THI ≥
68 indicating the presence of heat stress (Paper IV). This lack of niacin effects on the
investigated thermoregulatory parameters was likely not due to a too low amount of

General discussion
125
supplemented niacin because Di Costanzo et al. (1997) reported that the daily addition of 12
and 24 g niacin per animal partially induced reductions in skin temperatures during mild to
severe heat stress but supplementing 36 g niacin in a period predominantly characterized by
thermo-neutral conditions did not affect rectal or skin temperatures and respiration rates.
The reason for the discrepancies between the results obtained in the present experiment and
the findings published by Di Costanzo et al. (1997) and Zimbelman et al. (2010) needs to be
clarified. Dissimilarity in the experimental feeding schemes and in the time of body
temperature measurement after the intake of supplemental niacin may have generated unequal
concentrations of niacin in blood. This parameter generally varies in a relatively wide range,
probably due to differences in the analyzed blood fractions and difficulties in vitamin analysis
(Niehoff et al., 2009a). The ruminal disappearance of niacin was reported to exceed 98 %
(Santschi et al., 2005a). However, no absorption should take place in the rumen and most of
the niacin is incorporated into the bacterial fraction (Erickson et al., 1991; Santschi et al.,
2005b). Dietary addition was reported to increase the amount of niacin reaching the
duodenum and the duodenal absorption of niacin was found to be approximately 80 %
(Riddell et al., 1985; Zinn et al., 1987; Santschi et al., 2005a). Accordingly, Campbell et al.
(1994) reported postprandial increases in the concentration of nicotinic acid in duodenal fluid
1 to 6 hours after feed consumption with the peak after 2 hours feeding 12 g niacin per day in
two equal portions. Rises in blood nicotinamide within similar postprandial time spans were
described by Cervantes et al. (1996) and Niehoff et al. (2009b).
In the study of Di Costanzo et al. (1997), the cows were fed a TMR with or without
supplemental niacin twice daily at 8.00 h and at 15.00 h, respectively. Body temperature
measurements were initiated directly after both feeding events suggesting that, though not
determined, blood niacin was likely elevated during both periods of temperature detection. In
the present experiment, the supplemented niacin was integrated in the concentrate which was
offered separately via computerized feeding stations and the amount of individually available
concentrate was adjusted in order to meet predefined dietary forage to concentrate ratios
(Paper IV). Therefore the intake of concentrate was theoretically possible throughout the
main part of the day and it seems questionable that relatively large amounts of dietary niacin
were consistently consumed shortly before the initiation of body temperature determination at
8.00 h or 16.00 h, respectively, because the cows were fixed for temperature detection directly
after milking. However, once serum nicotinamide was determined at 8.00 h and the
supplementation of niacin was shown to induce significant increases of the vitamer in serum
as shown in Figure 10. These rises may have been to low to manifest in vasodilatative
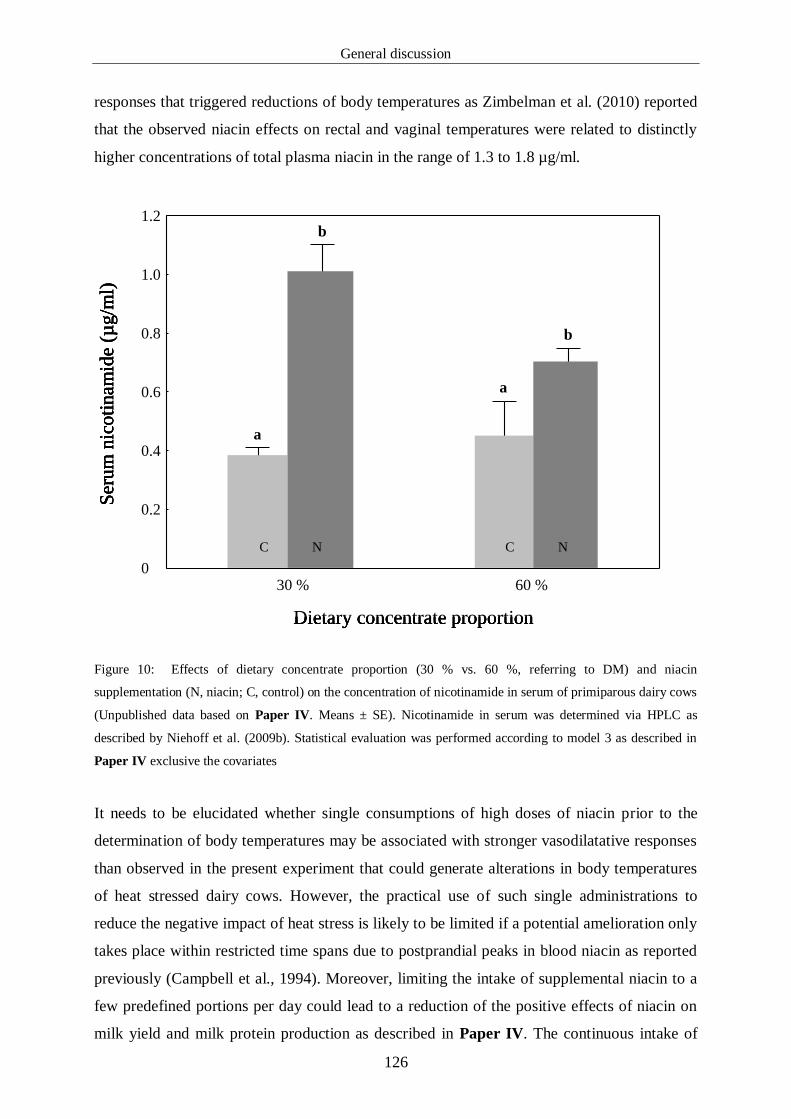
General discussion
126
responses that triggered reductions of body temperatures as Zimbelman et al. (2010) reported
that the observed niacin effects on rectal and vaginal temperatures were related to distinctly
higher concentrations of total plasma niacin in the range of 1.3 to 1.8 µg/ml.
Figure 10: Effects of dietary concentrate proportion (30 % vs. 60 %, referring to DM) and niacin
supplementation (N, niacin; C, control) on the concentration of nicotinamide in serum of primiparous dairy cows
(Unpublished data based on Paper IV. Means ± SE). Nicotinamide in serum was determined via HPLC as
described by Niehoff et al. (2009b). Statistical evaluation was performed according to model 3 as described in
Paper IV exclusive the covariates
It needs to be elucidated whether single consumptions of high doses of niacin prior to the
determination of body temperatures may be associated with stronger vasodilatative responses
than observed in the present experiment that could generate alterations in body temperatures
of heat stressed dairy cows. However, the practical use of such single administrations to
reduce the negative impact of heat stress is likely to be limited if a potential amelioration only
takes place within restricted time spans due to postprandial peaks in blood niacin as reported
previously (Campbell et al., 1994). Moreover, limiting the intake of supplemental niacin to a
few predefined portions per day could lead to a reduction of the positive effects of niacin on
milk yield and milk protein production as described in Paper IV. The continuous intake of
30 % 60 %
Dietary concentrate proportion
0
0.2
0.4
0.6
0.8
1.0
1.2
Ser
um
nic
oti
nam
ide
(µg/m
l)
NN CC
a
a
b
b
30 % 60 %
Dietary concentrate proportion
0
0.2
0.4
0.6
0.8
1.0
1.2
Ser
um
nic
oti
nam
ide
(µg/m
l)
NN CC
30 % 60 %
Dietary concentrate proportion
0
0.2
0.4
0.6
0.8
1.0
1.2
Ser
um
nic
oti
nam
ide
(µg/m
l)
30 % 60 %
Dietary concentrate proportion
0
0.2
0.4
0.6
0.8
1.0
1.2
Ser
um
nic
oti
nam
ide
(µg/m
l)
NN CC
a
a
b
b

General discussion
127
niacin throughout the day via concentrate feeding stations may have been one reason for the
relatively high stimulation of milk, FCM, protein and lactose yield in the present experiment
that partially exceeded the effects observed in past literature if niacin was fed once or twice
daily (MadisonAnderson et al., 1997; Niehoff et al., 2009b).
The lack of thermoregulatory niacin effects in the present experiment and the inconsistent
results reported in previous studies suggested that niacin could potentially contribute to an
alleviation of heat stress in dairy cows but the relief is likely to be limited to certain
environmental and nutritional preconditions. More information about optimal dose and time
of supplementation is strongly required before the administration of niacin as a tool for the
alleviation of heat stress can be recommended.
3 Continuous measurement of ruminal pH and temperature
The assessment of the devices constructed for continuous intraruminal pH, temperature and
pressure measurement primarily focused on ruminal pH and was performed in order to
evaluate the presence of three main confounders that could impair pH measurement: The
accuracy of the pH sensors indicated by the relationship to traditional manual pH
determination (1), the occurrence of pH sensor drift (2) and impacts of the localization of
measurement in the rumen (3).
First, the linear relationship of r=0.59 between bolus and manual pH measurement and the
considerable variation around the regression line represented a rather moderate correlation
(Paper III). However, this relationship indicated a better agreement compared to Kaur et al.
(2010) who reported a less close correlation of r=0.46. In contrast, previous experiments
demonstrated distinctly closer positive correlations between manual and automated
intraruminal pH determination (Penner et al., 2006; Phillips et al., 2010). However, the
differences in pH in the present experiment were not clearly attributable to one method and
may thus have been due to an insufficient accuracy of manual pH determination as well.
Performing a Bland-Altman comparison revealed bias effects with a tendency of pH
overestimation of low ruminal pH below 6.0 but a pH underestimation of rumen pH higher
than 6.5. Both observations may limit the validity of bolus pH measurement and in this
context the relatively long time spent below specific thresholds such as pH 5.6 in dependence
on dietary concentrate proportion as reported in Paper IV may actually have been longer. In
particular the overestimation of rather low ruminal pH below 6.0 in the critical range for
SARA detection may restrict the usefulness of bolus pH measurement in detecting ruminal

General discussion
128
acidosis in cattle and imperatively has to be considered in the interpretation of such results
gained by the evaluated boluses.
Secondly, pH sensor drift was found to be undirected in the first 8 days of in vivo
measurement after calibration (Paper III) but prolonged investigation showed the occurrence
of a time-dependent positive drift that can be corrected for by the linear rate of increase
(Paper IV). In contrast, Kaur et al. (2010) reported an earlier onset of positive pH sensor drift
after 48 hours followed by a relatively constant subsequent increase. These observations and
the need to correct for pH drift obviously complicate the practical applicability of the
evaluated boluses for the detection of ruminal pH and SARA.
Thirdly, as shown in Paper III, the site of measurement in the rumen does not necessarily
impact mean ruminal pH. Nevertheless, the emergence of pH gradients within the rumen were
partially reported in previous studies and unfixed boluses which move freely within the
reticulorumen could be temporarily transferred into the reticulum where the ingesta can have
higher pH than in the rumen due to greater saliva and water contamination (Duffield et al.,
2004; Li et al., 2009). Therefore the interpretation of single values can only give limited
indications for the presence of SARA and the main advantage of the evaluated boluses, the
continuity of measurement, should be used especially in SARA detection to create mean
values which integrate a larger amount of data to minimize the potential falsification.
The successful application of the technique required the consideration of specific constraints
that could affect reliability and durability of measurement. For example, the operation of
boluses, software, receiver and trigger device was relatively uncomplicated and served to
generate, download and export data for further analysis but its usage needed a specific
introduction (Paper III). Moreover, the calibration of the pH sensors required standard buffer
solutions and a water bath to ensure constant temperatures and these prerequisites are likely to
limit the applicability of the complete technique to research institutions or larger farms and
companies with respective resources and knowledge. The trigger had to be used in direct
proximity to the animals and therefore its use is restricted if the cows are able to move in free
stall barns. Initiating the transfer of recorded data from boluses that are used in vivo may
result in data loss if a larger quantity of cows is fixed in direct vicinity because accidently
triggering more than one bolus was observed to possibly cause inconsistent data transmission.
Furthermore, the trigger used a frequency of 134.2 KHz that is prevalently applied in
radiofrequency identification (RFID) technology for farm purposes like the record of estrus,
milk performance and feeding behaviour (Eradus and Jansen, 1999; Samad et al., 2010). If the
animals pass a signal with a similar frequency in the milking parlor or feeding stations,

General discussion
129
unintended data transmission may be triggered and data loss can occur. However, losing data
can be prevented by a specific setting of the software that only enables the trigger download
within predefined intervals.
The evaluated bolus technology represents a promising tool for the ongoing determination of
ruminal pH and temperature in cattle, may serve as a diagnostic method and can contribute to
an improved understanding of ruminal fermentation processes in particular due to the option
of continuous measurement as shown in Figure 6 and Figure 9. However, indications for a
limited accuracy of pH measurement and time dependent pH sensor drift were found and
indicated the need of further improvement. The emergence of pH-gradients within the
reticulorumen should be taken into consideration and a detailed introduction and training prior
to the application in vivo is strongly recommended.

Conclusions
130
CONCLUSIONS
The future feed value of maize silage is likely to remain relatively unaffected if the growing
plants are exposed to restricted levels of drought and elevated atmospheric CO2
concentrations of 550 ppm as expected to arise within the 21st century. As the quality of
various C3 crops was found to be considerably impaired by rising CO2, the absence of such
effects on the C4 plant maize may be considered a positive aspect.
The concentration of DON in ensiled maize may increase in periods of restricted water
availability during plant cultivation but such rises could be reduced almost to base level by
enriched atmospheric CO2.
Both the evaluated increased atmospheric CO2 concentration and drought during maize
growth will likely not influence thermoregulatory and blood parameters of sheep fed the
generated silages. Heat exposure will probably not impair the almost complete ruminal
metabolization of varying levels of dietary DON into the less toxic metabolite de-epoxy-
DON.
High amounts of dietary concentrate can reduce body temperatures of heat stressed dairy
cows and may therefore contribute to an amelioration of the known negative impacts of heat
on lactating cattle. Increasing the proportion of concentrate in dairy cow diets to 60 % can
stimulate milk and protein yield but may reduce milk fat and protein percentages leading to a
lack of effects on FCM yield in comparison to a 30 % concentrate ration. However, the
applicability of high concentrate diets is limited as they induce substantial decreases of
ruminal pH indicating the risk of SARA development.
In contrast to previous experiments, it was shown that the supplementation of relatively high
doses of niacin, a feed additive potentially able to alter skin blood flow, does not necessarily
influence skin, subcutaneous or rectal temperatures of heat stressed lactating dairy cows. As a
consequence, the capability of niacin to facilitate the dissipation of excess body heat via an
increased skin vasodilatation is likely to be limited to restricted postprandial time intervals.
However, supplemental niacin can stimulate milk, FCM, protein and lactose yields of
primiparous dairy cows, though milk fat, protein and lactose percent are either decreased or
not affected.

Conclusions
131
The investigated wireless boluses designed for in vivo application in bovines represent a
promising technology for an ongoing determination of ruminal pH and temperature in cattle
and can serve to improve the knowledge about the patterns of ruminal fermentation and to
indicate SARA in particular due the option of continuous intraruminal measurement.
However, a limited accuracy of the pH sensor, the occurrence of time dependent positive pH
drift and possibly emerging pH-gradients within the reticulorumen may falsify the obtained
results and imperatively have to be considered in their interpretation.

Summary
132
SUMMARY
Considerable and lasting climatic changes were projected to occur within the next decades.
Some of the probably most important alterations in relation to agriculture are increases in
atmospheric CO2 concentrations and global surface temperatures as well as modifications of
precipitation patterns that are likely to induce a higher incidence of summer drought in middle
Europe.
Elevated atmospheric CO2 concentrations are known to stimulate photosynthesis and yields of
C3 crops but were reported to substantially reduce their feed quality not only by altered
proportions of protein. C4 photosynthesis should theoretically be saturated at current CO2 but
the actual responses of feed value and mycotoxin contamination of C4 plants such as maize
are unknown. Uncertainty exists whether interactions with drought during cultivation and
increased ambient temperatures during feeding of the generated maize silages are to be
expected.
Rising ambient temperatures are likely to increase incidence and severity of heat stress that is
well known to impair health and productivity of livestock. In ruminants, potential dietary
countermeasures against heat stress may be elevations in the proportion of concentrate and the
supplementation of niacin which is known to have vasodilatative properties and was described
to reduce body temperatures of heat stressed dairy cows. However, the applicability of high
concentrate diets is limited as they were reported to reduce ruminal pH and to induce SARA.
Innovative devices (boli) for a continuous measurement of ruminal pH and temperature may
contribute to the diagnosis of ruminal acidosis.
Hence, the effects of an increased atmospheric CO2 concentration and drought during maize
growth on feed value, mycotoxin contamination and digestibility of maize silage were to be
investigated in consideration of the climatic conditions during feeding. Moreover, the
implications on thermoregulatory and blood parameters of sheep and the ruminal
metabolization of DON should be assessed. The impact of supplemental niacin and high
dietary concentrate on thermoregulation and milk performance of heat stressed dairy cows
were to be tested. New devices for intraruminal pH and temperature measurement were aimed
to be evaluated considering different localizations of measurement in the rumen and varying
proportions of dietary concentrate.
For these purposes, a FACE (Free Air Carbon dioxide Enrichment) facility was operated in a
maize field to produce an enriched CO2 concentration of 550 ppm. Drought was induced by
the exclusion of precipitation in one half of all experimental plots. Whole plants were

Summary
133
harvested, ensiled and analyzed for their contents of nutrients and chosen mycotoxins. In a
balance experiment on sheep, nutrient digestibilities, blood and thermoregulatory parameters
and the concentration of DON and de-epoxy-DON in plasma were determined for three
climatic treatments (temperate; mild heat; severe heat).
Moreover, four non-lactating rumen fistulated cows were fed on 0 and 40 % concentrate,
respectively. One bolus was inserted each in dorsal and ventral rumen sac to continuously
measure ruminal pH and temperature. For method comparison, postprandial manual
temperature measurement and removal of rumen fluid for manual pH determination were
conducted in direct proximity to the boluses in preset short term intervals.
In addition, 20 primiparous cows were allocated to four dietary treatments and were aimed to
receive either 0 or 24 g niacin and 30 % or 60 % concentrate. The effects on body
temperatures and respiration rates were investigated during periods likely to induce heat
stress. Milk production as well as ruminal pH and temperature were assessed. In a
concomitant experiment, the rumen boluses were tested for the occurrence of pH sensor drift
using four rumen fistulated cows.
Elevated atmospheric CO2 and drought during maize growth did not alter the crude nutrient
content of silage DM or nutrient digestibilities indicating a mainly unaffected future feed
value of ensiled whole maize plants. However, drought induced significant increases in the
concentration of DON summing up to more than 1500 µg/ kg DM. These drought-associated
rises were reduced almost to base level by growing the plants in a high CO2 atmosphere, an
observation that may have been due to a reduced plant water loss leading to decreases in the
susceptibility to fungal infection. The climatic conditions during feeding had the most
pronounced effects on nutrient digestibility and the lowest digestibilities of ADF, NDF and,
by trend, CF, were observed during the coldest climatic treatment. This may have been caused
by increases in the retention time of ingesta in the reticulorumen during warm periods. The
investigated blood parameters, body temperatures and respiration rates of sheep remained
mainly unaffected by elevated atmospheric carbon dioxide and drought during the cultivation
of the silages fed. Heat exposure induced increases in thermoregulatory activity within the
physiological limits of sheep. The ruminal metabolization of varying concentrations of dietary
DON into the less toxic metabolite de-epoxy-DON was found to be higher than 90 % and was
not impaired by exposing the animals to hot environments. Accordingly, the concentrations of
DON in ovine plasma were predominantly lower than 1 ng/ml.
The performed Bland-Altman comparison and the linear relationship between bolus and
manual pH measurement (r=0.59) indicated moderate agreement between both methods of pH

Summary
134
determination, a fact that may as well be due to deficient accuracy of manual pH detection. A
bias effect of bolus pH measurement with an overestimation of ruminal pH below 6.0 and an
underestimation of ruminal pH higher than 6.5 was observed. In addition, the occurrence of a
time-dependent positive pH sensor drift indicated the need of further improvement.
Rising proportions of dietary concentrate decreased ruminal pH values but increased ruminal
temperatures. The localization of measurement did not affect ruminal pH but ruminal
temperature. Feeding high concentrate diets may contribute to an amelioration of the negative
effects of heat as they reduced skin temperatures of heat stressed dairy cows by 0.2 to 0.3 °C
indicating a reduced dietary heat increment. The time spent with a ruminal pH below 5.6 was
significantly increased to more than 5 hours per day by feeding high concentrate leading to a
rising risk of SARA. Elevations in the proportion of dietary concentrate to 60 % stimulated
milk and protein yield but reduced milk fat and protein percent resulting in an unaffected
FCM yield in comparison to a 30 % concentrate diet. The potential of additional niacin to
alleviate heat stress via increased skin vasodilatation is likely to be limited as the
supplementation did not affect body temperatures during heat exposure. Milk, FCM, protein
and lactose yields were elevated by additional niacin, though milk fat, protein and lactose
percent were either decreased or not affected.
It can be concluded that the future feed value of maize silage will likely remain mainly
unaffected by elevated atmospheric CO2 concentrations of 550 ppm and drought during plant
growth. However, the concentration of DON may increase in periods of drought but can be
reduced by enriched atmospheric carbon dioxide. In sheep, the almost complete ruminal
metabolization of different levels of dietary DON into de-epoxy-DON should not be impaired
by hot climatic conditions during feeding. High concentrate diets could contribute to an
alleviation of heat stress and can induce beneficial effects on milk production. However, the
applicability of high concentrate rations is limited by considerable decreases in ruminal pH
that can be detected by promising ruminal boluses. The potential of supplemental niacin to
reduce the impacts of heat on dairy cows is limited. However, the addition of niacin can
considerably stimulate milk performance.

Zusammenfassung
135
ZUSAMMENFASSUNG
Aktuelle Prognosen weisen auf drastische und langfristig irreversible Klimaveränderungen in
den nächsten Jahrzehnten hin. Steigende atmosphärische CO2-Konzentrationen und
Umgebungstemperaturen sowie veränderte Niederschlagsmuster mit erhöhter
Sommertrockenheit stellen die bedeutsamsten Transformationen mit unmittelbarem Bezug zur
Landwirtschaft dar.
Erhöhte atmosphärische CO2-Gehalte stimulieren Photosynthese und Erträge von C3-
Pflanzen, diese Effekte gehen allerdings mit erheblichen Qualitätsminderungen und
reduzierten Proteingehalten einher. Die Photosynthese von C4-Pflanzen wie Mais könnte
bereits bei aktuellen CO2-Konzentrationen gesättigt sein. Allerdings fehlen die
experimentellen Grundlagen zur Einschätzung der tatsächlichen Auswirkungen steigender
atmosphärischer CO2-Gehalte auf den Futterwert von Maissilage sowie möglicher
Interaktionen mit vermehrt auftretender Sommertrockenheit und den Effekten höherer
Umgebungstemperaturen während der Fütterung.
Ansteigende Umgebungstemperaturen lassen auf erhöhte Inzidenz und Intensität von
Hitzestress einschließlich der bekannten negativen Folgen für Gesundheit und Leistung
landwirtschaftlicher Nutztiere schließen. Bei Wiederkäuern werden höhere Konzentratanteile
in der Ration und die Supplementierung von Niacin unter Nutzung seiner vasodilatativen
Eigenschaften als mögliche Gegenmaßnahmen im Bereich der Fütterung diskutiert.
Entsprechend wurden bei hitzegestressten Milchkühen durch die Gabe von Niacin
Reduktionen der Körpertemperaturen beobachtet. Die Nutzung hoher Konzentratanteile
unterliegt jedoch aufgrund von steigendem Pansenazidoserisiko physiologischen
Restriktionen. Innovative Messgeräte (Boli) zur kontinuierlichen Messung von pH-Wert und
Temperatur im Pansen könnten durch die Erfassung beider Parameter zu Diagnose und
Verständnis von subakuter Pansenazidose beitragen.
Die Ziele der vorliegenden Arbeit umfassten die Evaluierung der Auswirkungen von erhöhten
atmosphärischen CO2-Konzentrationen und Trockenheit während des Anbaues von Mais auf
den Futterwert der erstellten Silagen, die Kontamination mit ausgewählten Mykotoxinen und
die Nährstoffverdaulichkeit und Metabolisierung von DON bei steigenden
Umgebungstemperaturen während der Fütterung. Die Supplementierung von Niacin und
erhöhte Konzentratanteile in der Ration sollten hinsichtlich ihrer Effekte auf
Thermoregulation und Milchleistung von Milchkühen bewertet werden. Dies erfolgte unter
Anwendung innovativer Boli zur Messung von pH-Wert und Temperatur im Pansen.

Zusammenfassung
136
In einem Maisfeld wurde durch CO2-Expositionstechnik (FACE) in definierten
Feldabschnitten eine CO2-Konzentration von 550 ppm generiert. In einer Hälfte jeder
Versuchsstelle wurde Niederschlag ausgeschlossen. Maisganzpflanzen wurden geerntet,
einsiliert und ihre Nährstoff- und Mykotoxingehalte analysiert. In einem Bilanzversuch an
Schafen wurden die Nährstoffverdaulichkeiten der Maissilagen bei unterschiedlicher
Wärmeexposition der Tiere sowie Differenzialblutbild, thermoregulatorische Parameter und
die Metabolisierung von DON in de-epoxy-DON untersucht.
Zusätzlich wurden vier am Pansen fistulierte Milchkühe mit Rationen verschiedener
Konzentratanteile gefüttert. In dorsalen und ventralen Pansensack wurde je ein Bolus zur
kontinuierlichen Messung von Pansen-pH und –temperatur eingebracht. Zur Durchführung
eines Methodenvergleiches wurden im Vormagen in unmittelbarer Nähe zu den Boli an
definierten postprandialen Zeitpunkten die Pansentemperaturen bestimmt und Panseninhalt
zur manuellen pH-Messung entnommen.
Weiterhin wurden 20 erstlaktierende Milchkühe in vier Fütterungsgruppen mit einer
täglichen Supplementierung von 0 oder 24 g Niacin sowie Konzentratanteilen von 30 % oder
60 % eingeteilt. Körpertemperaturen und Atemfrequenzen bei Hitzestress sowie
Milchleistung, Pansen-pH und –temperatur wurden ermittelt. Die pH-Sensoren der genutzten
Boli wurden auf die Entstehung zeitabhängiger Drift untersucht.
Erhöhte atmosphärische CO2-Konzentration und Trockenheit hatten keinen Einfluss auf die
Rohnährstoffgehalte der generierten Silagen und deren Nährstoffverdaulichkeiten, was auf
einen unter diesen Bedingungen größtenteils unveränderten zukünftigen Futterwert von
Maissilage schließen lässt. Wasserrestriktion war mit signifikant auf über 1500 µg/ kg
Trockensubstanz steigenden DON Gehalten verbunden. Diese Konzentrationserhöhungen
wurden allerdings durch die CO2-Exposition annähernd auf Ausgangsniveau reduziert. Die
geringsten Verdaulichkeiten von ADF, NDF und Rohfaser wurden bei den niedrigsten
Umgebungstemperaturen beobachtet. Die simulierten zukünftigen Anbaubedingungen der
verfütterten Maispflanzen hatten keinen Einfluss auf die untersuchten Blutparameter und
Körpertemperaturen der Schafe, wohingegen Wärmeexposition signifikant erhöhte
Körpertemperaturen und thermoregulatorische Aktivität induzierte. Die Metabolisierung von
DON in de-epoxy-DON lag generell über 90 %, wurde nicht von Hitzestress beeinträchtigt
und resultierte in niedrigen DON-Konzentrationen im Plasma von überwiegend unter 1 ng/
ml.
Bland-Altman Vergleich und linearer Zusammenhang (r=0.59) zwischen Bolus und manueller
pH-Messung wiesen auf eine mittlere Übereinstimmung beider pH-Messverfahren hin, wobei

Zusammenfassung
137
auf Basis dieser Ergebnisse die mangelnde Kongruenz nicht präzise der mangelnden
Genauigkeit einer Methode zugeordnet werden kann. Die pH-Bestimmung per Bolus war
jedoch durch systematische Überschätzungen niedriger pH-Werte unter 6.0 sowie
Überschätzungen hoher pH-Werte über 6.5 charakterisiert. Ein weiteres Indiz für die
Notwendigkeit weiterer technischer Verbesserungen war das Auftreten zeitabhängiger
positiver pH-Drift.
Steigende Konzentratanteile in der Ration induzierten signifikant reduzierte pH-Werte sowie
erhöhte Temperaturen im Vormagen. Der Messort im Pansen hatte keinen Einfluss auf den
pH-Wert, beeinträchtigte jedoch die Pansentemperatur. Konzentratreiche Fütterung kann zur
Verringerung der negativen Effekte von Hitzestress auf Milchkühe beitragen, da hohe
Kraftfutteranteile mit einer signifikanten Reduktion der Hauttemperaturen um 0.2 bis 0.3 °C
einhergingen. Der Pansen-pH war bei Verfütterung von Rationen mit Konzentratanteilen von
60 % täglich für über 5 Stunden unter 5.6 reduziert, was auf ein steigendes Risiko der
Entstehung von subakuter Pansenazidose hinweist. Konzentratanteile von 60 % stimulierten
im Vergleich zu Rationen mit 30 % Kraftfutter bei reduzierten Milchfett- und
Milchproteingehalten sowohl Milchleistung als auch Milchproteinmenge.
Niacinsupplementierung hatte keinen Einfluss auf die Körpertemperaturen, war allerdings mit
erhöhter Milchproduktion sowie steigender Milchprotein- und Laktosemenge verbunden.
Es kann geschlussfolgert werden, dass im Rahmen der durchgeführten Untersuchungen keine
Hinweise auf zukünftige Veränderungen des Futterwertes von Maissilage durch Erhöhungen
der atmosphärischen CO2-Konzentration auf 550 ppm und Trockenheit während des
Pflanzenwachstums festgestellt wurden. Mangelnde Wasserversorgung der Maispflanzen
kann zu steigenden DON-Gehalten in den erstellten Silagen führen. Diese Kontamination
kann jedoch durch erhöhte atmosphärische CO2-Konzentrationen reduziert werden. Zukünftig
vermehrt auftretende Wärmeexposition beeinträchtigt die beinahe vollständige
Metabolisierung unterschiedlicher Mengen von DON im Pansen voraussichtlich nicht. Hohe
Konzentratanteile in Milchkuhrationen können zur Milderung von Hitzestress beitragen und
wirken sich positiv auf die Milchproduktion aus, unterliegen jedoch aufgrund von ruminalen
pH-Depressionen physiologischen Restriktionen. Derartige pH-Reduktionen können durch
innovative Boli unter Berücksichtigung etwaiger Störgrößen detektiert werden. Das Potential
der Supplementierung von Niacin zur Verringerung von Hitzestress bei Milchkühen ist
beschränkt, Niacinzulage kann jedoch zu deutlich stimulierter Milchleistung führen.

References
138
REFERENCES (cited in Introduction, Background and General Discussion sections)
Abouguen, M. and Dappolon, B. L., 1973. Changes in carbohydrate components during wheat
maturation .2. Changes in sugars, pentosans, and starch. Cereal Chem. 50:723-
734.
Aerts, J. V., Deboever, J. L., Cottyn, B. G., Debrabander, D. L., and Buysse, F. X., 1984.
Comparative digestibility of feedstuffs by sheep and cows. Anim. Feed Sci.
Tech. 12:47-56.
Ahn, B., Jeon, B., Baek, K., Park, S., Lee, H., Lee, W., Kim, S., Park, S., Kim, H., Ju, J., and
Khan, M., 2005. The effects of various factors on milk yield and variation in
milk yield between milking, milk components, milking duration, and milking
flow rate in Holstein dairy cattle. J. Anim. Sci. Tech. 47:919-924.
Ainsworth, E. A. and Long, S. P., 2005. What have we learned from 15 years of free-air CO2
enrichment (FACE)? A meta-analytic review of the responses of
photosynthesis, canopy. New Phytol. 165:351-371.
Akin, D. E., Kimball, B. A., Mauney, J. R., LaMorte, R. L., Hendrey, G. R., Lewin, K., Nagy,
J., and Gates, R. N., 1994. Influence of enhanced CO2 concentration and
irrigation on sudangrass digestibility. Agr. Forest Meteorol. 70:279-287.
Alcamo, J., Moreno, J. M., Nováky, B., Bindi, M., Corobov, R., Devoy, R. J. N.,
Giannakopoulos, C., Martin, E., Olesen, J. E. and Shvidenko, A., 2007.
Europe. In: Parry, M. L., Canziani, O. F., Palutikof, J. P., van der Linden, P. J.
and Hanson, C. E. (Eds.), Climate Change 2007: Impacts, Adaptation and
Vulnerability. Contribution of the Working Group II to the Fourth Assessment
Report of the Intergovernmental Panel on Climate Change. Cambridge
University Press, Cambridge, pp. 541-580.
Allison I., Bindoff, N. L., Bindschadler, R. A., Cox, P. M., de Noblet, N., England, M. H.,
Francis, J. E., Gruber, N., Haywood, A. M., Karoly, D. J., Kaser, G., Le Quéré,
C., Lenton, T. M., Mann, M.E., McNeil, B. I., Pitman, A. J., Rahmstorf, S.,
Rignot, E., Schellnhuber H. J., Schneider, S. H., Sherwood, S. C., Somerville,
R. C. J., Steffen, K., Steig, E. J., Visbeck, M. and Weaver, A. J., 2009. The
Copenhagen Diagnosis. The University of New South Wales Climate Research
Centre (CCRC), Sydney, pp. 1-60.
References
139
Allen, M. R., Frame, D. J., Huntingford, C., Jones, C. D., Lowe, J. A., Meinshausen, M., and
Meinshausen, N., 2009. Warming caused by cumulative carbon emissions
towards the trillionth tonne. Nature 458:1163-1166.
AlZahal, O., Kebreab, E., France, J., Froetschel, M., and McBride, B. W., 2008. Ruminal
temperature may aid in the detection of subacute ruminal acidosis. J. Dairy Sci.
91:202-207.
Andersen, J. B., Friggens, N. C., Sejrsen, K., Sorensen, M. T., Munksgaard, L., and
Ingvartsen, K. L., 2003. The effects of low vs. high concentrate level in the
diet on performance in cows milked two or three times daily in early lactation.
Livest. Prod. Sci. 81:119-128.
Arino, A. A. and Bullerman, L. B., 1994. Fungal colonization of corn grown in Nebraska in
relation to year, genotype and growing conditions. J. Food Protect. 57:1084-
1087.
Armstrong, D. V., 1994. Symposium - nutrition and heat-stress interaction with shade and
cooling. J. Dairy Sci. 77:2044-2050.
Barbehenn, R. V., Chen, Z., Karowe, D. N., and Spickard, A., 2004. C3 grasses have higher
nutritional quality than C4 grasses under ambient and elevated atmospheric
CO2. Global Change Biol. 10:1565-1575.
Beede, D. K. and Collier, R. J., 1986. Potential nutritional strategies for intensively managed
cattle during thermal-stress. J. Anim. Sci. 62:543-554.
Benyo, Z., Gille, A., Kero, J., Csiky, M., Suchankova, M. C., Nusing, R. M., Moers, A.,
Pfeffer, K., and Offermanns, S., 2005. GPR109A (PUMA-G/HM74A)
mediates nicotinic acid-induced flushing. J. Clin. Invest. 115:3634-3640.
Bernabucci, U., Lacetera, N., Baumgard, L. H., Rhoads, R. P., Ronchi, B., and Nardone, A.,
2010. Metabolic and hormonal acclimation to heat stress in domesticated
ruminants. Animal 4:1167-1183.
Bernabucci, U. Lacetera, N., Ronchi, B. and Nardone, A., 2002. Effects of the hot season on
milk protein fractions in Holstein cows. Anim. Res. 51:25-33.
Bertrand, A., Prevost, D., Bigras, F. L., Lalande, L., Tremblay, G. F., Castonguay, Y. and
Berlanger, G., 2007. Alfalfa response to elevated atmospheric CO2 varies with
the symbiotic rhizobial strain. Plant Soil 301:173-187.
Bewley, J. M., Einstein, M. E., Grott, M. W., and Schutz, M. M., 2008a. Comparison of
reticular and rectal core body temperatures in lactating dairy cows. J. Dairy
Sci. 91:4661-4672.

References
140
Bewley, J. M., Grott, M. W., Einstein, M. E., and Schutz, M. M., 2008b. Impact of intake
water temperatures on reticular temperatures of lactating dairy cows. J. Dairy
Sci. 91:3880-3887.
Bines, J. A., Broster, W. H., Sutton, J. D., Broster, V. J., Napper, D. J., Smith, T., and Siviter,
J. W., 1988. Effect of amount consumed and diet composition on the apparent
digestibility of feed in cattle and sheep. J. Agr. Sci. 110:249-259.
Blake, D. R. and Rowland, F. S., 1988. Continuing worldwide increase in tropospheric
methane, 1978 to 1987. Science 239:1129-1131.
Blazquez, N. B., Long, S. E., Mayhew, T. M., Perry, G. C., Prescott, N. J., and Wathes, C.,
1994. Rate of discharge and morphology of sweat glands in the perineal,
lumbodorsal and scrotal skin of sattle. Res. Vet. Sci. 57:277-284.
Boe, J., Terray, L., Cassou, C., and Najac, J., 2009. Uncertainties in European summer
precipitation changes: role of large scale circulation. Clim. Dynam. 33:265-
276.
Bohmanova, J., Misztal, I., and Cole, J. B., 2007. Temperature-humidity indices as indicators
of milk production losses due to heat stress. J. Dairy Sci. 90:1947-1956.
Booth, J. S., Nichani, A. K., Benjamin, P., Dar, A., Krieg, A. M., Babiuk, L. A., and Mutwiri,
G. K., 2007. Innate immune responses induced by classes of CpG
oligodeoxynucleotides in ovine lymph node and blood mononuclear cells. Vet.
Immunol. Immunop. 115:24-34.
Bouraoui, R., Lahmar, M., Majdoub, A., Djemali, M. and Belyea, R., 2002. The relationship
of temperature-humidity index with milk production of dairy cows in a
Mediterranean climate. Anim. Res. 51:479-491.
Bowes, G., 1993. Facing the inevitable - plants and increasing atmospheric CO2. Annu. Rev.
Plant Phys. 44:309-332.
Boyacioglu, M. H. and Dappolonia, B. L., 1994. Characterization and utilization of durum-
wheat for breadmaking .3. Staling properties of bread baked from bread wheat
flours and durum-wheat flours. Cereal Chem. 71:34-41.
Boyer, J. S. and Westgate, M. E., 2004. Grain yields with limited water. J. Exp. Bot. 55:2385-
2394.
Brod, D. L., Bolsen, K. K., and Brent, B. E., 1982. Effect of water temperature on rumen
temperature, digestion and rumen fermentation in sheep. J. Anim. Sci. 54:179-
182.

References
141
Burns, P., Wailes, W., and Baker, P., 2002. Changes in reticular and rectal temperature during
the periestrous period in cows. J. Anim. Sci. 80:128-129.
Campbell, J. M., Murphy, M. R., Christensen, R. A., and Overton, T. R., 1994. Kinetics of
niacin supplements in lactating dairy cows. J. Dairy Sci. 77:566-575.
Carter, E. B., Theodorou, M. K., and Morris, P., 1999. Responses of Lotus corniculatus to
environmental change. 2. Effect of elevated CO2, temperature and drought on
tissue digestion in relation to condensed tannin and carbohydrate
accumulation. J. Sci. Food Agr. 79:1431-1440.
Cervantes, A., Smith, T. R., and Young, J. W., 1996. Effects of nicotinamide on milk
composition and production in dairy cows fed supplemental fat. J. Dairy Sci.
79:105-113.
Chakraborty, S. and Newton, A. C., 2011. Climate change, plant diseases and food security:
an overview. Plant Pathol. 60:2-14.
Chapman, S. C. and Edmeades, G. O., 1999. Selection improves drought tolerance in tropical
maize populations: II. Direct and correlated responses among secondary traits.
Crop Sci. 39:1315-1324.
Cheikh, N. and Jones, R. J., 1995. Heat-stress effects on sink activity of developing maize
kernels grown in vitro. Physiol. Plantarum 95:59-66.
Christensen, J. H. and Christensen, O. B., 2007. A summary of the PRUDENCE model
projections of changes in European climate by the end of this century. Climatic
Change 81:7-30.
Christopherson, R. J. and Kennedy, P. M., 1983. Effect of the thermal environment on
digestion in ruminants. Can. J. Anim. Sci. 63:477-496.
Chun, J. A., Wang, Q. G., Timlin, D., Fleisher, D., and Reddy, V. R., 2011. Effect of elevated
carbon dioxide and water stress on gas exchange and water use efficiency in
corn. Agr. Forest Meteorol. 151:378-384.
Collier, R. J., Dahl, G. E., and VanBaale, M. J., 2006. Major advances associated with
environmental effects on dairy cattle. J. Dairy Sci. 89:1244-1253.
Coppock, C. E., 1985. Energy nutrition and metabolism of the lactating dairy cow. J. Dairy
Sci. 68:3403-3410.
Cotrufo, M. F., Ineson, P., and Scott, A., 1998. Elevated CO2 reduces the nitrogen
concentration of plant tissues. Glob. Change Biol. 4:43-54.
References
142
Dado, R. G. and Allen, M. S., 1993. Continuous computer acquisition of feed and water
intakes, chewing, reticular Motility, and ruminal pH of cattle. J. Dairy Sci.
76:1589-1600.
Dänicke, S., 2010. Experiments on the formation of deoxynivalenol (DON) sulfonate (DONS)
through wet treatment of DON contaminated cereal grains with sodium
metabisulfite (NA2S2O2SBS) and investigations on the effects of DON, DONS
and SBS on rearing piglets and on various porcine cell types in vitro.
Dissertation, Hannover, pp 1-72.
Dänicke, S. and Döll, S., 2010. A probiotic feed additive containing spores of Bacillus subtilis
and B. licheniformis does not prevent absorption and toxic effects of the
Fusarium toxin deoxynivalenol in piglets. Food Chem. Toxicol. 48:152-158.
Dänicke, S., Valenta, H., and Matthes, S., 2007. On the interactions between Fusarium toxin-
contaminated wheat and nonstarch polysaccharide hydrolyzing enzymes in
diets of broilers on performance, intestinal viscosity, and carryover of
deoxynivalenol. Poultry Sci. 86:291-298.
De Souza, A. P., Gaspar, M., Da Silva, E. A., Ulian, E. C., Waclawovsky, A. J., Nishiyama,
M. Y., Dos Santos, R. V., Teixeira, M. M., Souza, G. M., and Buckeridge, M.
S., 2008. Elevated CO2 increases photosynthesis, biomass and productivity,
and modifies gene expression in sugarcane. Plant Cell Environ. 31:1116-1127.
DiCostanzo, A., Spain, J. N., and Spiers, D. E., 1997. Supplementation of nicotinic acid for
lactating Holstein cows under heat stress conditions. J. Dairy Sci. 80:1200-
1206.
Dikmen, S., Alava, E., Pontes, E., Fear, J. M., Dikmen, B. Y., Olson, T. A., and Hansen, P. J.,
2008. Differences in thermoregulatory ability between slick-haired and wild-
type lactating Holstein cows in response to acute heat stress. J. Dairy Sci.
91:3395-3402.
Dikmen, S. and Hansen, P. J., 2009. Is the temperature-humidity index the best indicator of
heat stress in lactating dairy cows in a subtropical environment? J. Dairy Sci.
92:109-116.
Dlugokencky, E. J., Masarie, K. A., Lang, P. M., and Tans, P. P., 1998. Continuing decline in
the growth rate of the atmospheric methane burden. Nature 393:447-450.
Döll, S., Dänicke, S., Ueberschar, K. H., Valenta, H., Schnurrbusch, U., Ganter, M., Klobasa,
F., and Flachowsky, G., 2003. Effects of graded levels of Fusarium toxin

References
143
contaminated maize in diets for female weaned piglets. Arch. Anim. Nutr.
57:311-334.
Drake, B. G., GonzalezMeler, M. A., and Long, S. P., 1997. More efficient plants: A
consequence of rising atmospheric CO2? Annu. Rev. Plant Phys. 48:609-639.
Driscoll, S. P., Prins, A., Olmos, E., Kunert, K. J., and Foyer, C. H., 2006. Specification of
adaxial and abaxial stomata, epidermal structure and photosynthesis to CO2
enrichment in maize leaves. J. Exp. Bot. 57:381-390.
Duffield, T., Plaizier, J. C., Fairfield, A., Bagg, R., Vessie, G., Dick, P., Wilson, J., Aramini,
J., and McBride, B., 2004. Comparison of techniques for measurement of
rumen pH in lactating dairy cows. J. Dairy Sci. 87:59-66.
Eamus, D., 1991. The interaction of rising CO2 and temperatures with water-use efficiency.
Plant Cell and Environ. 14:843-852.
Eby, M., Zickfeld, K., Montenegro, A., Archer, D., Meissner, K. J., and Weaver, A. J., 2009.
Lifetime of anthropogenic climate change: Millennial time scales of potential
CO2 and surface temperature perturbations. J. Climate 22:2501-2511.
Ehleringer, J. R., Cerling, T. E., and Helliker, B. R., 1997. C4 photosynthesis, atmospheric
CO2 and climate. Oecologia 112:285-299.
Enemark, J. M. D., 2008. The monitoring, prevention and treatment of sub-acute ruminal
acidosis (SARA): A review. Veterinary J. 176:32-43.
Enemark, J. M. D., Peters, G., and Jorgensen, R. J., 2003. Continuous monitoring of rumen
pH - A case study with cattle. J. Vet. Med. A-Physiol. Pathol. Cl. 50:62-66.
Eradus, W. J. and Jansen, M. B., 1999. Animal identification and monitoring. Comput.
Electron. Agr. 24:91-98.
Erbs, M., Manderscheid, R., Jansen, G., Seddig, S., Pacholski, A., and Weigel, H. J., 2010.
Effects of free-air CO2 enrichment and nitrogen supply on grain quality
parameters and elemental composition of wheat and barley grown in a crop
rotation. Agr. Ecosyst. Environ. 136:59-68.
Erickson, P. S., Murphy, M. R., Mcsweeney, C. S., and Trusk, A. M., 1991. Niacin absorption
from the rumen. J. Dairy Sci. 74:3492-3495.
Fangmeier, A., De Temmerman, L., Mortensen, L., Kemp, K., Burke, J., Mitchell, R., van
Oijen, M., and Weigel, H. J., 1999. Effects on nutrients and on grain quality in
spring wheat crops grown under elevated CO2 concentrations and stress
conditions in the European, multiple-site experiment 'ESPACE-wheat'. Eur. J.
Agron. 10:215-229.

References
144
Farooq, M., Wahid, A., Kobayashi, N., Fujita, D., and Basra, S. M. A., 2009. Plant drought
stress: effects, mechanisms and management. Agron. Sustain. Dev. 29:185-
212.
FAOSTAT, 2007. Agricultural Data. Food and Agricultural Organization of the United
Nations, Rome. http://faostat.fao.org/.
Fink-Gremmels, J., 2008. Mycotoxins in cattle feeds and carry-over to dairy milk: A review.
Food Addit. Contam. 25:172-180.
Forster, P. V., Ramaswamy, V., Artaxo, P., Berntsen, T., Betts, R., Fahey, D. W., Haywood,
J., Lean, J., Lowe, D. C., Myhre, G., Nganga, J. and Prinn, R., 2007. Changes
in Atmospheric Constituents and in Radiative Forcing. In: In: Solomon, S.,
Quin, D., Manning, M., Chen, Z., Marquis, M., Averyt, K. B., Tignor, M. and
Miller, H. L. (eds.). Cambridge University Press, Cambridge and New York,
pp. 131-234.
Friggens, N. C., Emmans, G. C., Kyriazakis, I., Oldham, J. D., and Lewis, M., 1998. Feed
intake relative to stage of lactation for dairy cows consuming total mixed diets
with a high or low ratio of concentrate to forage. J. Dairy Sci. 81:2228-2239.
Fritschi, F. B., Boote, K. J., Sollenberger, L. E., and Allen, L. H., 1999. Carbon dioxide and
temperature effects on forage establishment: tissue composition and nutritive
value. Glob. Change Biol. 5:743-753.
Garnsworthy, P. C., Gong, J. G., Armstrong, D. G., Mann, G. E., Sinclair, K. D., and Webb,
R., 2009. Effect of site of starch digestion on metabolic hormones and ovarian
function in dairy cows. Livest. Sci. 125:161-168.
Garrett, E. F., Pereira, M. N., Nordlund, K. V., Armentano, L. E., Goodger, W. J., and Oetzel,
G. R., 1999. Diagnostic methods for the detection of subacute ruminal acidosis
in dairy cows. J. Dairy Sci. 82:1170-1178.
Gengler, W. R., Martz, F. A., Johnson, H. D., Krause, G. F., and Hahn, L., 1970. Effect of
temperature on food and water intake and rumen fermentation. J. Dairy Sci.
53:434-437.
Ghannoum, O., 2009. C4 photosynthesis and water stress. Ann. Bot. 103:635-644.
Ghannoum, O., von Caemmerer, S., Ziska, L. H., and Conroy, J. P., 2000. The growth
response of C4 plants to rising atmospheric CO2 partial pressure: a
reassessment. Plant Cell Environ. 23:931-942.
Gifford, R. M., 2004. The CO2 fertilising effect - does it occur in the real world? The
International Free Air CO2 Enrichment (FACE) Workshop: Short- and long-

References
145
term effects of elevated atmospheric CO2 on managed ecosystems, Ascona,
Switzerland, March 2004. New Phytol. 163:221-225.
Giorni, P., Magan, N., Pietri, A., Bertuzzi, T., and Battilani, P., 2007. Studies on Aspergillus
section Flavi isolated from maize in northern Italy. Int.J. Food Microbiol.
113:330-338.
Goyarts, T, 2006. Effects of the Fusarium toxin deoxynivalenol (DON) on protein synthesis
and immunological parameters and DON-kinetics in the pig. Dissertation,
Hannover, pp 1-190.
Good, P., Barring, L., Giannakopoulos, C., Holt, T., and Palutikof, J., 2006. Non-linear
regional relationships between climate extremes and annual mean temperatures
in model projections for 1961-2099 over Europe. Climate Res. 31:19-34.
Goyarts, T., Dänicke, S., Rothkötter, H. J., Spilke, J., Tiemann, U., and Schollenberger, M.,
2005. On the effects of a chronic deoxynivalenol intoxication on performance,
haematological and serum parameters of pigs when diets are offered either for
ad libitum consumption or fed restrictively. J. Vet. Med. A-Physiol. Pathol.
52:305-314.
Gozho, G. N., Plaizier, J. C., Krause, D. O., Kennedy, A. D., and Wittenberg, K. M., 2005.
Subacute ruminal acidosis induces ruminal lipopolysaccharide endotoxin
release and triggers an inflammatory response. J. Dairy Sci. 88:1399-1403.
Graham, A. D., Nicol, A. M., and Christopherson, R. J., 1982. Rumen motility responses to
adrenaline and noradrenaline and organ weights of warm-acclimated and cold-
acclimated Sheep. Can. J. Anim. Sci. 62:777-786.
Hanson, J. D., Baker, B. B., and Bourdon, R. M., 1993. Comparison of the effects of different
climate change scenarios on rangeland livestock production. Agr. Syst. 41:487-
502.
Haywood, A. M., Valdes, P. J., and Sellwood, B. W., 2000. Global scale palaeoclimate
reconstruction of the middle Pliocene climate using the UKMO GCM: initial
results. Global Planet. Change 25:239-256.
Hegerl, G. C., Zwiers, F. W., Braconnot, P., Gillett, N. P., Luo, Y., Marengo, J. A., Nicholls,
N., Penner, J. E. amd Stott, P. A., 2007. Understanding and Attributing
Climate Change. In: Solomon, S., Quin, D., Manning, M., Chen, Z., Marquis,
M., Averyt, K. B., Tignor, M. and Miller, H. L. (eds.). Cambridge University
Press, Cambridge and New York, pp. 665-745.

References
146
Heinrichs, A. J. and Hargrove, G. L., 1987. Standards of weight and height for Holstein
heifers. J. Dairy Sci. 70:653-660.
Högy, P. and Fangmeier, A., 2008. Effects of elevated atmospheric CO2 on grain quality of
wheat. J. Cereal Sci. 48:580-591.
Högy, P., Wieser, H., Kohler, P., Schwadorf, K., Breuer, J., Franzaring, J., Muntifering, R.,
and Fangmeier, A., 2009. Effects of elevated CO2 on grain yield and quality of
wheat: results from a 3-year free-air CO2 enrichment experiment. Plant
Biology 11:60-69.
Hörnicke, H., 1987. Thermophysiologie. In: Scheunert, A. and Trautmann, A., Lehrbuch der
Veterinärphysiologie. Verlag Paul Parey, Berlin und Hamburg, pp. 142-158.
Huntington, G. B., 1997. Starch utilization by ruminants: From basics to the bunk. J. Anim.
Sci. 75:852-867.
Idso, S. B. and Idso, K. E., 2001. Effects of atmospheric CO2 enrichment on plant constituents
related to animal and human health. Environ. Exp. Bot. 45:179-199.
Igono, M. O., Bjotvedt, G. and Sanfordcrane, H. T., 1992. Environmental profile and critical-
temperature effects on milk-production of Holstein cows in desert climate. Int.
J. Biometeorol. 36.77-87.
IPCC, 2007. Summary for Policymakers. In: Solomon, S., Quin, D., Manning, M., Chen, Z.,
Marquis, M., Averyt, K. B., Tignor, M. and Miller, H. L. (eds.). Cambridge
University Press, Cambridge and New York, pp. 1-18.
Izaurralde, R. C., Thomson, A. M., Morgan, J. A., Fay, P. A., Polley, H. W., and Hatfield, J.
L., 2011. Climate impacts on agriculture: Implications for forage and
rangeland production. Agron. J. 103:371-381.
Janovick, N. A. and Drackley, J. K., 2010. Prepartum dietary management of energy intake
affects postpartum intake and lactation performance by primiparous and
multiparous Holstein cows. J. Dairy Sci. 93:3086-3102.
Jennings, P., Coates, M. E., Walsh, K., Turner, J. A., and Nicholson, P., 2004. Determination
of deoxynivalenol- and nivalenol-producing chemotypes of Fusarium
graminearum isolated from wheat crops in England and Wales. Plant Pathol.
53:643-652.
Jetana, T., Abdullah, N., Halim, R. A., Jalaludin, S., and Ho, Y. W., 2000. Effects of energy
and protein supplementation on microbial-N synthesis and allantoin excretion
in sheep fed guinea grass. Anim. Feed Sci. Tech. 84:167-181.

References
147
Jones, P. D. and Moberg, A., 2003. Hemispheric and large-scale surface air temperature
variations: An extensive revision and an update to 2001. J. Climate 16:206-
223.
Kadzere, C. T., Murphy, M. R., Silanikove, N., and Maltz, E., 2002. Heat stress in lactating
dairy cows: a review. Livest. Prod. Sci. 77:59-91.
Kamanna, V. S., Ganji, S. H., and Kashyap, M. L., 2009. The mechanism and mitigation of
niacin-induced flushing. Int. J. Clin. Pract. 63:1369-1377.
Kaur, R., Garcia, S. C., Horadagoda, A., and Fulkerson, W. J., 2010. Evaluation of rumen
probe for continuous monitoring of rumen pH, temperature and pressure.
Anim. Prod. Sci. 50:98-104.
Keady, T. W. J., Kilpatrick, D. J., Mayne, C. S., and Gordon, F. J., 2008. Effects of replacing
grass silage with maize silages, differing in maturity, on performance and
potential concentrate sparing effect of dairy cows offered two feed value grass
silages. Livest. Sci. 119:1-11.
Keese, C., Meyer, U., Valenta, H., Schollenberger, M., Starke, A., Weber, I. A., Rehage, J.,
Breves, G., and Dänicke, S., 2008. No carry over of unmetabolised
deoxynivalenol in milk of dairy cows fed high concentrate proportions. Mol.
Nutr. Food Res. 52:1514-1529.
Kennedy, D. G., Hewitt, S. A., Mcevoy, J. D. G., Currie, J. W., Cannavan, A., Blanchflower,
W. J., and Elliot, C. T., 1998. Zeranol is formed from Fusarium spp. toxins in
cattle in vivo. Food Addit. Contam. 15:393-400.
Kennedy, P. M., Christopherson, R. J., and Milligan, L. P., 1982. Effects of cold-exposure on
feed protein-degradation, microbial protein-synthesis and transfer of plasma
urea to the rumen of sheep. Brit. J. Nutr. 47:521-535.
Kennedy, P. M. and Milligan, L. P., 1978. Effects of cold-exposure on digestion, microbial
synthesis and nitrogen transformations in sheep. Brit. J. Nutr. 39:105-117.
Kennedy, P. M., Young, B. A., and Christopherson, R. J., 1977. Studies on relationship
between thyroid-function, cold-acclimation and retention time of digesta in
sheep. J. Anim. Sci. 45:1084-1090.
Khan, N. A., Cone, J. W., and Hendriks, W. H., 2009. Stability of fatty acids in grass and
maize silages after exposure to air during the feed out period. Anim. Feed Sci.
Tech. 154:183-192.
References
148
Kiessling, K. H., Pettersson, H., Sandholm, K., and Olsen, M., 1984. Metabolism of aflatoxin,
ochratoxin, zearalenone, and 3 trichothecenes by intact rumen fluid, rumen
protozoa, and rumen bacteria. Appl. Environ. Microb. 47:1070-1073.
Kimball, B. A., 1983. Carbon-dioxide and agricultural yield - an assemblage and analysis of
430 prior observations. Agron. J. 75:779-788.
Kirkland, R. M., Steen, R. W. J., Gordon, F. J., and Keady, T. W. J., 2005. The influence of
grass and maize silage quality on apparent diet digestibility, metabolizable
energy concentration and intake of finishing beef cattle. Grass Forage Sci.
60:244-253.
Kjellstrom, E., 2004. Recent and future signatures of climate change in Europe. Ambio
33:193-198.
Kleen, J. L., Hooijer, G. A., Rehage, J., and Noordhuizen, J. P. T. M., 2003. Subacute ruminal
acidosis (SARA): a review. J.Vet. Med. A-Physiol. Pathol. Cl. 50:406-414.
Kokkonen, M., Ojala, L., Parikka, P., and Jestoi, M., 2010. Mycotoxin production of selected
Fusarium species at different culture conditions. Int. J. Food Microbiol.
143:17-25.
Korner, C., 2000. Biosphere responses to CO2 enrichment. Ecol. Appl. 10:1590-1619.
Korner, C., Asshoff, R., Bignucolo, O., Hattenschwiler, S., Keel, S. G., Pelaez-Riedl, S.,
Pepin, S., Siegwolf, R. T. W., and Zotz, G., 2005. Carbon flux and growth in
mature deciduous forest trees exposed to elevated CO2. Science 309:1360-
1362.
Korosteleva, S. N., Smith, T. K., and Boermans, H. J., 2009. Effects of feed naturally
contaminated with Fusarium mycotoxins on metabolism and immunity of
dairy cows. J. Dairy Sci. 92:1585-1593.
Korosteleva, S. N., Smith, T. K., and Boermans, H. J., 2007. Effects of feedborne Fusarium
mycotoxins on the performance, metabolism, and immunity of dairy cows. J.
Dairy Sci. 90:3867-3873.
Krause, K. M. and Oetzel, G. R., 2006. Understanding and preventing subacute ruminal
acidosis in dairy herds: A review. Anim. Feed Sci. Tech. 126:215-236.
Lacetera, N., Bernabucci, U., Scalia, D., Ronchi, B., Kuzminsky, G., and Nardone, A., 2005.
Lymphocyte functions in dairy cows in hot environment. Int. J. Biometeorol.
50:105-110.

References
149
Le Cozler, Y., Peyraud, J. L., and Troccon, J. L., 2009. Effect of feeding regime, growth
intensity and age at first insemination on performances and longevity of
Holstein heifers born during autumn. Livest. Sci. 124:72-81.
Leakey, A. D. B., Ainsworth, E. A., Bernacchi, C. J., Rogers, A., Long, S. P., and Ort, D. R.,
2009. Elevated CO2 effects on plant carbon, nitrogen, and water relations: six
important lessons from FACE. J. Exp. Bot. 60:2859-2876.
Leakey, A. D. B., Bernacchi, C. J., Dohleman, F. G., Ort, D. R., and Long, S. P., 2004. Will
photosynthesis of maize (Zea mays) in the US Corn Belt increase in future CO2
rich atmospheres? An analysis of diurnal courses of CO2 uptake under free-air
concentration enrichment (FACE). Glob. Change Biol. 10:951-962.
Leakey, A. D. B., Uribelarrea, M., Ainsworth, E. A., Naidu, S. L., Rogers, A., Ort, D. R., and
Long, S. P., 2006. Photosynthesis, productivity, and yield of maize are not
affected by open-air elevation of CO2 concentration in the absence of drought.
Plant Physiol. 140:779-790.
LeCain, D. R. and Morgan, J. A., 1998. Growth, gas exchange, leaf nitrogen and carbohydrate
concentrations in NAD-ME and NADP-ME C4 grasses grown in elevated CO2.
Physiol. Plantarum 102:297-306.
Li, M., Penner, G. B., Hernandez-Sanabria, E., Oba, M., and Guan, L. L., 2009. Effects of
sampling location and time, and host animal on assessment of bacterial
diversity and fermentation parameters in the bovine rumen. J. Appl. Microbiol.
107:1924-1934.
Lilley, J. M., Bolger, J. T., Peoples, M. B. and Gifford, R. M., 2001. Nutritive value and the
nitrogen dynamics of Trifolium subterraneum and Phalaris aquatica under
warmer, high CO2 conditions. New Phytol. 150:385-395.
Long, S. P., Ainsworth, E. A., Rogers, A., and Ort, D. R., 2004. Rising atmospheric carbon
dioxide: Plants face the future. Annu. Revi. Plant Biol. 55:591-628.
Luthi, D., Le Floch, M., Bereiter, B., Blunier, T., Barnola, J. M., Siegenthaler, U., Raynaud,
D., Jouzel, J., Fischer, H., Kawamura, K., and Stocker, T. F., 2008. High-
resolution carbon dioxide concentration record 650000-800000 years before
present. Nature 453:379-382.
MacRae, J. C. and Lobley, G. E., 1982. Some factors which influence thermal-energy losses
during the metabolism of ruminants. Livest. Prod. Sci. 9:447-456.

References
150
MadisonAnderson, R. J., Schingoethe, D. J., Brouk, M. J., Baer, R. J., and Lentsch, M. R.,
1997. Response of lactating cows to supplemental unsaturated fat and niacin. J.
Dairy Sci. 80:1329-1338.
Magan, N. and Lacey, J., 1984. Effects of gas-composition and water activity on growth of
field and storage fungi and their Interactions. T. Brit. Mycol. Soc. 82:305-314.
Magan, N., Medina, A., and Aldred, D., 2011. Possible climate-change effects on mycotoxin
contamination of food crops pre- and postharvest. Plant Pathol. 60:150-163.
Manderscheid, R., Bender, J., Jager, H. J., and Weigel, H. J., 1995. Effects of season long
CO2 enrichment on cereals .2. Nutrient concentrations and grain quality. Agr.
Ecosyst. Environ. 54:175-185.
Manderscheid, R., Pacholski, A., and Weigel, H. J., 2010. Effect of free air carbon dioxide
enrichment combined with two nitrogen levels on growth, yield and yield
quality of sugar beet: Evidence for a sink limitation of beet growth under
elevated CO2. Eur. J. Agron. 32:228-239.
Marai, I. F. M., El-Darawany, A. A., Fadiel, A., and bdel-Hafez, M. A. M., 2007.
Physiological traits as affected by heat stress in sheep - A review. Small
Ruminant Res. 71:1-12.
Marin, S., Sanchis, V., and Magan, N., 1995. Water activity, temperature, and pH effects on
growth of Fusarium moniliforme and Fusarium proliferatum isolates from
maize. Can. J. Microbiol. 41:1063-1070.
Markelz, R. J. C., Strellner, R. S., and Leakey, A. D. B., 2011. Impairment of C4
photosynthesis by drought is exacerbated by limiting nitrogen and ameliorated
by elevated CO2 in maize. J. Exp. Bot. 62:3235-3246.
Maroco, J. P., Edwards, G. E., and Ku, M. S. B., 1999. Photosynthetic acclimation of maize to
growth under elevated levels of carbon dioxide. Planta 210:115-125.
Mateo, J. J., Mateo, R., and Jimenez, M., 2002. Accumulation of type A trichothecenes in
maize, wheat and rice by Fusarium sporotrichioides isolates under diverse
culture conditions. Int. J. Food Microbiol. 72:115-123.
Meehl, G. A., Stocker, T. F., Collins, W. D., Friedlingstein, P., Gaye, A. T., Gregory, J. M.,
Kitoh, A., Knutti, R., Murphy, J. M., Noda, A. and Raper, S. C. B., 2007.
Global Climate Projections. In: Solomon, S., Qin, D., Manning, M., Chen, Z.,
Marquis, M., Averyt, K. B., Tignor, M. and Miller, H. L. (Eds.), Climate
Change 2007: The Physical Science Basis. Contribution of the Working Group

References
151
I to the Fourth Assessment Report of the Intergovernmental Panel on Climate
Change. Cambridge University Press, Cambridge and New York, pp. 749-844.
Meinshausen, M., Meinshausen, N., Hare, W., Raper, S. C. B., Frieler, K., Knutti, R., Frame,
D. J., and Allen, M. R., 2009. Greenhouse-gas emission targets for limiting
global warming to 2 degrees C. Nature 458:1158-1196.
Mertens, D. R. and Ely, L. O., 1982. Relationship of rate and extent of digestion to forage
utilization - a dynamic-model evaluation. J. Anim. Sci. 54:895-905.
Miaron, J. O. O. and Christopherson, R. J., 1992. Effect of prolonged thermal exposure on
heat-production, reticular motility, rumen-fluid and rumen-particulate passage-
rate constants, and apparent digestibility in steers. Can. J. Anim. Sci. 72:809-
819.
Milchunas, D. G., Mosier, A. R., Morgan, J. A., Lecain, D. R., King, J. Y., and Nelson, J. A.,
2005. Elevated CO2 and defoliation effects on a shortgrass steppe: Forage
quality versus quantity for ruminants. Agr. Ecosyst. Environ. 111:166-184.
Minor, D. J., Trower, S. L., Strang, B. D., Shaver, R. D., and Grummer, R. R., 1998. Effects
of nonfiber carbohydrate and niacin on periparturient metabolic status and
lactation of dairy cows. J. Dairy Sci. 81:189-200.
Monjardino, P., Smith, A. G., and Jones, R. J., 2005. Heat stress effects on protein
accumulation of maize endosperm. Crop Sci. 45:1203-1210.
Monneveux, P., Sanchez, C., Beck, D., and Edmeades, G. O., 2006. Drought tolerance
improvement in tropical maize source populations: Evidence of progress. Crop
Sci. 46:180-191.
Morgan, J. A., Mosier, A. R., Milchunas, D. G., Lecain, D. R., Nelson, J. A., and Parton, W.
J., 2004. CO2 enhances productivity, alters species composition, and reduces
digestibility of shortgrass steppe vegetation. Ecol. Appl. 14:208-219.
Morgante, M., Stelletta, C., Berzaghi, P., Gianesella, M., and Andrighetto, I., 2007. Subacute
rumen acidosis in lactating cows: an investigation in intensive Italian dairy
herds. J. Anim. Physiol. Anim. Nutr. 91:226-234.
Morison, J. I. L., 1998. Stomatal response to increased CO2 concentration. J. Exp. Bot.
49:443-452.
Mulligan, F. J., Caffrey, P. J., Rath, M., Callan, J. J., and O'Mara, F. P., 2001. The
relationship between feeding level, rumen particulate and fluid turnover rate
and the digestibility of soya hulls in cattle and sheep (including a comparison

References
152
of Cr-mordanted soya hulls and Cr2O3 as particulate markers in cattle). Livest.
Prod. Sci. 70:191-202.
Muntifering, R. B., Chappelka, A. H., Lin, J. C., Karnosky, D. F. and Somers, G. L., 2006.
Chemical composition and digestibility of Trifolium exposed to elevated ozone
and carbon dioxide in a free-air (FACE) fumigation system. Funct. Ecol.
20:269-275.
Nardone, A., Ronchi, B., Lacetera, N., Ranieri, M. S., and Bernabucci, U., 2010. Effects of
climate changes on animal production and sustainability of livestock systems.
Livest. Sci. 130:57-69.
Newman, J. A., Anand, M., Henry, H. A. L., Hunt, S. and Gedalof, Z., 2011. Climate change
biology. CAB International, Wallingford, pp. 183-197.
Niehoff, I. D., Hüther, L., and Lebzien, P., 2009a. Niacin for dairy cattle: a review. Brit. J.
Nutr. 101:5-19.
Niehoff, I. D., Hüther, L., Lebzien, P., Bigalke, W., Dänicke, S., and Flachowsky, G., 2009b.
Investigations on the effect of a niacin supplementation to three diets differing
in forage-to-concentrate ratio on several blood and milk variables of dairy
cows. Arch. Anim. Nutr. 63:203-218.
Nienaber, J. A., Hahn, G. L., and Eigenberg, R. A., 1999. Quantifying livestock responses for
heat stress management: a review. Int. J. Biometeorol. 42:183-188.
Niwano, Y., Becker, B. A., Mitra, R., Caldwell, C. W., Abdalla, E. B., and Johnson, H. D.,
1990. Suppressed peripheral-blood lymphocyte blastogenesis in prepartal and
postpartal sheep by chronic heat-stress, and suppressive property of heat-
stressed sheep serum on lymphocytes. Dev. Comp. Immunol. 14:139-149.
Nocek, J. E., 1997. Bovine acidosis: Implications on laminitis. J. Dairy Sci. 80:1005-1028.
Nonami, H., 1998. Plant water relations and control of cell elongation at low water potentials.
J. Plant Res. 111:373-382.
Nowak, R. S., Ellsworth, D. S., and Smith, S. D., 2004. Functional responses of plants to
elevated atmospheric CO2 - do photosynthetic and productivity data from
FACE experiments support early predictions? New Phytol. 162:253-280.
O'Mara, F. P., Murphy, J. J., and Rath, M., 1998. Effect of amount of dietary supplement and
source of protein on milk production, ruminal fermentation, and nutrient flows
in dairy cows. J. Dairy Sci. 81:2430-2439.

References
153
Ominski, K. H., Kennedy, A. D., Wittenberg, K. M. and Nia, S. A. M., 2002. Physiological
and production responses to feeding schedule in lactating dairy cows exposed
to short-term, moderate heat stress. J. Dairy Sci. 85:730-737.
Orskov, E. R. and Macleod, N. A., 1990. Dietary-induced thermogenesis and feed evaluation
in ruminants. P. Nutr. Soc. 49:227-237.
Paster, N., Blumenthalyonassi, J., Barkaigolan, R., and Menasherov, M., 1991. Production of
zearalenone in vitro and in corn grains stored under modified atmospheres. Int.
J. Food Microbiol. 12:157-166.
Paterson, R. R. M. and Lima, N., 2010. How will climate change affect mycotoxins in food?
Food Res. Int. 43:1902-1914.
Penner, G. B., Aschenbach, J. R., Gabel, G., and Oba, M., 2009. Technical note: Evaluation
of a continuous ruminal pH measurement system for use in noncannulated
small ruminants. J. Anim. Sci. 87:2363-2366.
Penner, G. B., Beauchemin, K. A., and Mutsvangwa, T., 2006. An evaluation of the accuracy
and precision of a stand-alone submersible continuous ruminal pH
measurement system. J. Dairy Sci. 89:2132-2140.
Philippeau, C. and Michalet-Doreau, B., 1998. Influence of genotype and ensiling of corn
grain on in situ degradation of starch in the rumen. J. Dairy Sci. 81:2178-2184.
Phillips, N., Mottram, T., Poppi, D., Mayer, D., and McGowan, M. R., 2010. Continuous
monitoring of ruminal pH using wireless telemetry. Anim. Prod. Sci. 50:72-77.
Picon-Cochard, C., Teyssonneyre, F., Besle, J. M. and Soussana, J. F., 2004. Effects of
elevated CO2 and cutting frequency on the productivity and herbage quality of
a semi-natural grassland. Eur. J. Agron. 20:363-377.
Porteaus, F., Hill, J., Ball, A. S., Pinter, P. J., Kimball, B. A., Wall, G. W., Adamsen, F. J.,
Hunsaker, D. J., LaMorte, R. L., Leavitt, S. W., Thompson, T. L., Matthias, A.
D., Brooks, T. J., and Morris, C. F., 2009. Effect of Free Air Carbon dioxide
Enrichment (FACE) on the chemical composition and nutritive value of wheat
grain and straw. Anim. Feed Sci. Tech. 149:322-332.
Raisanen, J., Hansson, U., Ullerstig, A., Doscher, R., Graham, L. P., Jones, C., Meier, H. E.
M., Samuelsson, P., and Willen, U., 2004. European climate in the late twenty-
first century: regional simulations with two driving global models and two
forcing scenarios. Clim. Dynam. 22:13-31.
Ravagnolo, O., Misztal, I. and Hoogenboom, G., 2002. Genetic component of heat stress in
dairy cattle, development of heat index function. J. Dairy Sci. 85:2120-2125.

References
154
Raymo, M. E., Grant, B., Horowitz, M., and Rau, G. H., 1996. Mid-Pliocene warmth:
Stronger greenhouse and stronger conveyor. Mar. Micropaleontol. 27:313-326.
Reynolds, C. K., Tyrrell, H. F., and Reynolds, P. J., 1991. Effects of diet forage-to-
concentrate ratio and intake on energy-metabolism in growing beef heifers -
whole-body energy and nitrogen-balance and visceral heat-production. J. Nutr.
121:994-1003.
Rhoads, M. L., Rhoads, R. P., van Baale, M. J., Collier, R. J., Sanders, S. R., Weber, W. J.,
Crooker, B. A. and Baumgard, L. H., 2009. Effects of heat stress and plane of
nutrition on lactating Holstein cows. I. Production, metabolism, and aspects of
circulating somatotropin. J. Dairy Sci. 92:1986-1997.
Riddell, D. O., Bartley, E. E., Arambel, M. J., Nagaraja, T. G., Dayton, A. D., and Miller, G.
W., 1985. Effect of niacin supplementation on ruminal niacin synthesis and
degradation in cattle. Nutr. Rep. Int. 31:407-413.
Roenfeldt, S., 1998. You can`t afford to ignore heat stress. Dairy Manage 35:6-12.
Rosenzweig, C., Karoly, D., Vicarelli, M., Neofotis, P., Wu, Q. G., Casassa, G., Menzel, A.,
Root, T. L., Estrella, N., Seguin, B., Tryjanowski, P., Liu, C. Z., Rawlins, S.,
and Imeson, A., 2008. Attributing physical and biological impacts to
anthropogenic climate change. Nature 453:353-357.
Rotter, B. A., Prelusky, D. B., and Pestka, J. J., 1996. Toxicology of deoxynivalenol
(vomitoxin). J. Toxicol. Env. Health 48:1-34.
Rowell, D. P., 2009. Projected midlatitude continental summer drying: North America versus
Europe. J. Climate 22:2813-2833.
Rowell, D. P. and Jones, R. G., 2006. Causes and uncertainty of future summer drying over
Europe. Clim. Dynam. 27:281-299.
Samad, A., Murdeshwar, P., and Hameed, Z., 2010. High-credibility RFID-based animal data
recording system suitable for small-holding rural dairy farmers. Comput.
Electron. Agr. 73:213-218.
Samapundo, S., De Meulenaer, B., Atukwase, A., Debevere, J., and Devlieghere, F., 2007.
The influence of modified atmospheres and their interaction with water activity
on the radial growth and fumonisin B-1 production of Fusarium verticillioides
and F-proliferatum on corn. Part I: The effect of initial headspace carbon
dioxide concentration. Int. J. Food Microbiol. 114:160-167.

References
155
Santschi, D. E., Berthiaume, R., Matte, J. J., Mustafa, A. F., and Girard, C. L., 2005a. Fate of
supplementary B-vitamins in the gastrointestinal tract of dairy cows. J. Dairy
Sci. 88:2043-2054.
Santschi, D. E., Chiquette, J., Berthiaume, R., Martineau, R., Matte, J. J., Mustafa, A. F., and
Girard, C. L., 2005b. Effects of the forage to concentrate ratio on B-vitamin
concentrations in different ruminal fractions of dairy cows. Can. J. Anim. Sci.
85:389-399.
Schneider, P. L., Beede, D. K., and Wilcox, C. J., 1988. Nycterohemeral patterns of acid-base
status, mineral concentrations and digestive function of lactating cows in
natural or chamber heat-stress environments. J. Anim. Sci. 66:112-125.
Seeling, K., Dänicke, S., Valenta, H., Van Egmond, H. P., Schothorst, R. C., Jekel, A. A.,
Lebzien, P., Schollenberger, M., Razzazi-Fazeli, E., and Flachowsky, G., 2006.
Effects of Fusarium toxin-contaminated wheat and feed intake level on the
biotransformation and carry-over of deoxynivalenol in dairy cows. Food Addit.
Contam. 23:1008-1020.
Shin, S. I., Liu, Z., Otto-Bliesner, B., Brady, E. C., Kutzbach, J. E., and Harrison, S. P., 2003.
A simulation of the last glacial maximum climate using the NCAR-CCSM.
Clim. Dynam. 20:127-151.
Silanikove, N., 2000. Effects of heat stress on the welfare of extensively managed domestic
ruminants. Livest. Prod. Sci. 67:1-18.
Sloan, L. C., Crowley, T. J., and Pollard, D., 1996. Modeling of middle pliocene climate with
the NCAR GENESIS general circulation model. Mar. Micropaleontol. 27:51-
61.
Solomon, S., Plattner, G. K., Knutti, R., and Friedlingstein, P., 2009. Irreversible climate
change due to carbon dioxide emissions. P. Natl. Acad. Sci. USA. 106:1704-
1709.
Somerville, C. and Briscoe, L., 2001. Genetic engineering and water. Science 292: 2217.
Spahni, R., Chappellaz, J., Stocker, T. F., Loulergue, L., Hausammann, G., Kawamura, K.,
Fluckiger, J., Schwander, J., Raynaud, D., Masson-Delmotte, V., and Jouzel,
J., 2005. Atmospheric methane and nitrous oxide of the late Pleistocene from
Antarctic ice cores. Science 310:1317-1321.
Spiehrs, D. E., Spain, J. N., Sampson, J. D. and Rhoads, R. P., 2004. Use of physiological
parameters to predict milk yield and feed intake in heat-stressed dairy cows. J.
Therm. Biol. 29:759-764.

References
156
Stafford, N., 2007. Future crops - The other greenhouse effect. Nature 448:526-528.
Stott, P. A., Mitchell, J. F. B., Allen, M. R., Delworth, T. L., Gregory, J. M., Meehl, G. A.,
and Santer, B. D., 2006. Observational constraints on past attributable warming
and predictions of future global warming. J. Climate 19:3055-3069.
Tafaj, M., Junck, B., Maulbetsch, A., Steingass, H., Piepho, H. P., and Drochner, W., 2004.
Digesta characteristics of dorsal, middle and ventral rumen of cows fed with
different hay qualities and concentrate levels. Arch. Anim. Nutr. 58:325-342.
Terao, T., Miura, S., Yanagihara, T., Hirose, T., Nagata, K., Tabuchi, H., Kim, H. Y.,
Lieffering, M., Okada, M., and Kobayashi, K., 2005. Influence of free-air CO2
enrichment (FACE) on the eating quality of rice. J. Sci. Food Agr. 85:1861-
1868.
Tripati, A. K., Roberts, C. D., and Eagle, R. A., 2009. Coupling of CO2 and ice sheet stability
over major climate transitions of the last 20 million years. Science 326:1394-
1397.
Uyeno, Y., Sekiguchi, Y., Tajima, K., Takenaka, A., Kurihara, M., and Kamagata, Y., 2010.
An rRNA-based analysis for evaluating the effect of heat stress on the rumen
microbial composition of Holstein heifers. Anaerobe 16:27-33.
Vu, J. V. C. and Allen, L. H., 2009. Growth al elevated CO2 delays the adverse effects of
drought stress on leaf photosynthesis of the C4 sugarcane. J. Plant Physiol.
166:107-116.
Waalwijk, C., Kastelein, P., de Vries, I., Kerenyi, Z., van der Lee, T., Hesselink, T., Kohl, J.,
and Kema, G., 2003. Major changes in Fusarium spp. in wheat in the
Netherlands. Eur. J. Plant Pathol. 109:743-754.
Wand, S. J. E., Midgley, G. F., Jones, M. H., and Curtis, P. S., 1999. Responses of wild C4
and C3 grass (Poaceae) species to elevated atmospheric CO2 concentration: a
meta-analytic test of current theories and perceptions. Glob. Change Biol.
5:723-741.
Warren, W. P., Martz, F. A., Asay, K. H., Hilderbr, E. S., Payne, C. G., and Vogt, J. R., 1974.
Digestibility and rate of passage by steers fed tall fescue, alfalfa and
orchardgrass hay in 18 and 32-C ambient-temperatures. J. Anim. Sci. 39:93-96.
Weigel, H. J., Manderscheid, R., Jager, H. J., and Mejer, G. J., 1994. Effects of season-long
CO2 enrichment on cereals .1. Growth-performance and yield. Agr. Ecosyst.
Environ. 48:231-240.

References
157
West, J. W., 1999. Nutritional strategies for managing the heat-stressed dairy cow. J. Anim.
Sci. 77:21-35.
West, J. W., 2003. Effects of heat-stress on production in dairy cattle. J. Dairy Sci. 86:2131-
2144.
Westra, R. and Christopherson, R. J., 1976. Effects of cold on digestibility, eetention time of
digesta, reticulum motility and thyroid-hormones in sheep. Can. J. Anim. Sci.
56:699-708.
Wu, D. X., Wang, G. X., Bai, Y. F., Liao, H. X., and Ren, H. X., 2002. Response of growth
and water use efficiency of spring wheat to whole season CO2 enrichment and
drought. Acta Bot. Sin. 44:1477-1483.
Wu, D. X., Wang, G. X., Bai, Y. F., and Liao, J. X., 2004. Effects of elevated CO2
concentration on growth, water use, yield and grain quality of wheat under two
soil water levels. Agr. Ecosyst. Environ. 104:493-507.
Yang, L. X., Wang, Y. L., Dong, G. C., Gu, H., Huang, J. Y., Zhu, J. G., Yang, H. J., Liu, G.,
and Han, Y., 2007. The impact of free-air CO2 enrichment (FACE) and
nitrogen supply on grain quality of rice. Field Crop. Res. 102:128-140.
Yin, G. H., Shen, Y. J., Tong, N., Gu, J., Hao, L., and Liu, Z. X., 2012. Drought induced
changes of physio-biochemical parameters in maize. J. Food Agric. Environ.
10:853-858.
Zimbelman, R. B., Baumgard, L. H., and Collier, R. J., 2010. Effects of encapsulated niacin
on evaporative heat loss and body temperature in moderately heat-stressed
lactating Holstein cows. J. Dairy Sci. 93:2387-2394.
Zinn, R. A., Owens, F. N., Stuart, R. L., Dunbar, J. R., and Norman, B. B., 1987. B-vitamin
supplementation of diets for feedlot calves. J. Anim. Sci. 65:267-277.
Zinselmeier, C., Jeong, B. R., and Boyer, J. S., 1999. Starch and the control of kernel number
in maize at low water potentials. Plant Physiol. 121:25-35.

158
CURRICULUM VITAE
Malte Lohölter
Born on the 4th of October, 1982
In Frankfurt/M., Germany
July 1999 – June 2002 Goetheschule Wetzlar
Degree: A-levels
October 2002 – September 2006 Bachelor Study of Agriculture and Environmental
Management at the Justus-Liebig-Universität
Gießen, Germany
Degree: B.sc. agr.
October 2006 – March 2007 Master study of Aquaculture and Fisheries
Science at the Humboldt-Universität zu Berlin
April 2007 – June 2009 Master study of Animal Sciences at the Justus-
Liebig-Universität Gießen, Germany
Degree: M.sc. agr.
July 2009 – June 2012 Scientist at the Institute of Animal Nutrition,
Federal Research Institute for Animal Health,
Friedrich-Loeffler-Institute
Braunschweig, Germany

159
EIDESSTATTLICHE ERKLÄRUNG
Hiermit erkläre ich an Eides statt, die vorliegende Dissertation: “Methods for estimation and
nutritional influencing of thermoregulation and heat stress in dairy cows and sheep as well as
impacts of changing climatic conditions on the feed value of maize silage“ selbstständig und
nur unter Verwendung der angegebenen Literatur und Hilfsmittel verfasst zu haben. Die
Arbeit lag bisher in gleicher oder ähnlicher Form keiner Prüfungsbehörde vor.
Halle/Saale, den 24.08.2012 Malte Lohölter

160
DANKSAGUNG
Mein Dank gilt allen, die unmittelbar oder direkt zu dieser Arbeit beigetragen, mich nicht nur
bei ihrer Erstellung beruflich und persönlich unterstützt haben und ohne deren Hilfe diese
Untersuchungen nicht in dieser Form möglich gewesen wären:
Herrn Prof. Dr. Dr. Sven Dänicke für die Möglichkeit, die vorliegende Arbeit am Institut für
Tierernährung in Braunschweig durchführen zu können sowie für die kompetente und stets
freundliche Unterstützung und Begutachtung der Arbeit.
Ferner Herrn Dr. Ulrich Meyer für die wertvollen wissenschaftlichen Hilfestellungen, die
engagierte Betreuung meiner Arbeit und die motivierende Anleitung.
Herrn Prof. Dr. Gerhard Flachowsky und Herrn Dr. Peter Lebzien für die Mitbetreuung der
Arbeit und vielfältige fachliche Anregungen.
Den Mitarbeitern des Institutes für Tierernährung danke ich für die umfangreiche
Unterstützung in allen relevanten Bereichen und die mir stets entgegengebrachte
Hilfsbereitschaft.
Allen Doktoranden danke ich für die Hilfe bei der Versuchsdurchführung und die schönen
gemeinsamen Aktivitäten.
Meiner Freundin Inga, meiner Familie und meinen Freunden danke ich für die wundervolle
gemeinsame Zeit.


