UK Metabolic Biochemistry Network Recommendations for
the Analysis of Urinary Organic Acids by Gas
Chromatography Mass Spectrometry
November 2018
RS Carling1, R Barski2, SL Hogg3, K Witek1 and SJ Moat4
1Biochemical Sciences, Viapath, Guys & St Thomas’ NHSFT, London 2 Biochemical Genetics, Leeds teaching Hospitals NHS, Leeds 3 Biochemical Genetics, Cambridge University Hospitals NHSFT, Cambridge 4Medical Biochemistry, University Hospital Wales, Cardiff
Corresponding authour:[email protected]
Expert review by N Dalton5, C Langhans6 and G Lynes4.
4 Biochemical Sciences, Viapath, Guys & St Thomas’ NHSFT, London 5 Well Child Laboratory, Evelina London Children’s Hospital, Guys & St Thomas’ NHSFT, London
6 Centre for Metabolic Disease, University Children’s Hospital, Heidelberg

Page 2 of 29
Table of Contents
1. Introduction ..................................................................................... 3
1.1 Clinical Indications for Organic Acid Analysis ............................................. 4
1.2 Gas Chromatography Mass Spectrometry (GCMS) ...................................... 4
2. Pre-Analytical Considerations .............................................................. 5
3. Analytical Considerations.................................................................... 6
3.1 Ovrview ............................................................................................ 6
3.2 Qualitative Versus Quantitative Analysis ................................................ 7
3.3 Sample Preparation ............................................................................ 8
3.3.1 Sample Volume ....................................................................... 8
3.3.2 Internal Standards .................................................................. 8
3.3.3 Sample Extraction ...................................................................... 10
3.4 Gas Chromatography Mass Spectrometry (GCMS) ............................ 13
3.4.1 Maintenance of the GCMS ............................................................ 13
4 Post Analytical Considerations .............................................................. 14
6. Performance Characteristics ............................................................. 21
6.1 Reference Intervals .............................................................................. 21
6.2 Traceability ......................................................................................... 21
7. Performance Monitoring ................................................................... 22
7.1 Internal Quality Control ..................................................................... 22
7.2 External Quality Assessment (EQA) .................................................... 22
7.3 Reagent Acceptance Testing .............................................................. 23
8. Pitfalls and Limitations ..................................................................... 25
References ............................................................................................... 29
Page 3 of 29
1. Introduction
Organic acid disorders are a heterogeneous group of disorders. They represent
the largest single group of inborn errors of metabolism. Individually they are rare,
but collectively the incidence is between 1 in 10,000 and 1 in 30,000 live births.
Approximately 150 disorders give rise to a characteristic urine organic acid
profile. In simple terms, profiles can be diagnostic either because there are
excess amounts of abnormal organic acids present, for example pathognomonic
metabolites such as succinylacetone in Tyrosinaemia Type 1, or because one or
more normally occurring organic acids are present in excess. For example, 2-
hydroxyglutarate in 2-hydroxyglutaric aciduria.
Organic acids are water soluble compounds containing one or more carboxyl
groups. They are usually weak acids and tend to be of low molecular weight (<
300). They are the end products of metabolism of a wide range of compounds
including amino acids, sugars, steroids, lipids and drugs. As such there are a
large number of organic acids and a human urine sample can contain more than
250 different organic acids. The most common organic acids are the carboxylic
acids but organic acid analysis also detects a class of compounds known as the
acylglycines, which are formed by conjugation of acylCoA species with glycine. In
addition, drug metabolites, feeds, intestinal bacterial metabolites, exogenous
compounds (soaps, creams, plasticisers etc) and artefacts due to sample storage
can also give rise to detectable compounds.
Metabolic disorders can result in the urinary excretion of a wide range of
compounds, many of which are potentially significant in establishing a diagnosis.
Organic acid profiling by Gas Chromatography Mass Spectrometry (GCMS)
represents one of the more sophisticated screening methods currently available
as a large number of metabolic disorders may be detected either directly or
indirectly by this technique. The compounds that need to be detected comprise
mainly acidic (but some neutral) metabolites, some with additional hydroxyl, oxo,
and conjugated amino functional groups present. Many metabolites also contain
phenolic or heterocyclic rings.
Although organic acids are detectable in blood, plasma, serum, amniotic fluid and
CSF, urine is widely considered the most suitable biological matrix for analysis; it
contains very little protein which simplifies sample preparation and organic acids
are concentrated in the urine by the kidneys.

Page 4 of 29
Organic acid analysis is a complex process which is prone to many limitations and
pitfalls (1). It is important that laboratories understand the limitations of the
methodology so that they can provide a robust and safe organic acid service.
1.1 Clinical Indications for Organic Acid Analysis
The clinical presentation of metabolic disorders may be variable, non-specific and
can occur at any age. Therefore, urine organic acid analysis should be considered
if any of the following are present:
1. Lethargy, coma, seizures or vomiting in a neonate
2. Hyperammonaemia
3. Hypoglycaemia
4. Unexplained metabolic acidosis or lactic acidaemia
5. Unexplained alkalosis
6. Metabolic decompensation
7. Unexplained global developmental delay or developmental regression
8. Unexplained liver dysfunction
9. Unexplained neurological signs/symptoms
10. Abnormal results on newborn screening programme
11. Sibling with similar clinical presentation
Clinical information and a drug/medication history should be supplied when
requesting metabolic investigations.
1.2 Gas Chromatography Mass Spectrometry (GCMS)
GCMS is a powerful analytical technique. Separation of organic acids is achieved
by virtue of the differences in their boiling points as well as their affinity for the
stationary phase in the analytical column. A typical GC system utilises a carrier
gas (usually helium) to transport the analytes from the injection port, through the
column and after separation, into the mass spectrometer. While the injection port
is held at a constant temperature (above the highest boiling point of all
compounds in the sample) the column temperature, after a suitable delay, is
gradually increased. As each organic acid reaches its boiling point it vaporises,
enabling the carrier gas to carry the analyte through the column where it is
differentially retarded by interactions with the stationary phase (to a greater or
lesser extent) determined by its structure, number and type of functional groups
and the chemical composition of the stationary phase itself. Sophisticated
Page 5 of 29
temperature programs enable the separation of closely eluting metabolites to be
controlled.
For organic acid analysis, the GC is usually linked to single quadrupole mass
spectrometer or ion trap operating in positive ion mode. As the organic acids
elute from the GC column, the eluent enters the ion source where a metallic
filament discharges electrons into its path. When these electrons hit the
compounds present, energy is transferred causing the compounds to split into
fragments, the composition and abundance of which will be compound specific.
These fragments are accelerated through an electromagnetic field which
separates the ions on the basis of their mass/charge (m/z) ratio.
Data acquisition: a full scan is typically collected between 50 and 550 amu with a
scan speed of <1 second. Each spectrum is stored along with a summation of all
ions detected in that scan, which allows the data to be reviewed as a total ion
chromatogram. Selective ion monitoring may also be used to monitor specific
ions, allowing greater sensitivity for quantitation of specific organic acids.
2. Pre-Analytical Considerations
Sample Type: Organic acid analysis should be performed on a random urine
sample collected into a sterile, preservative free container. Samples collected in
boric acid are unsuitable.
Sample storage: The urine should be stored frozen prior to analysis. In the
authors’ experience, samples are stable for several years if stored at -20°C,
however the evidence base for this is acknowledged to be weak and one report
relating to ‘total titratable organic acids’ demonstrated a significant decrease in
10 samples stored at -20C (2). It is therefore recommended that for long term
storage samples are kept at -70C and freeze/thaw cycles are kept to the
minimum.
Sample volume: At least 5mL of urine should be collected. The minimum
volume required is approximately 2mL, but this depends on the creatinine
concentration; the more dilute the urine sample, the greater the volume that
must be extracted. Very dilute urine samples (creatinine concentration <
1mmol/L) may not produce valid results.
Timing of sample collection: Samples collected during an acute episode are
likely to be more informative than those collected during the recovery phase,
whilst the patient is receiving I.V. fluids or whilst the patient is well.
Page 6 of 29
Timed urine collections are unnecessary and should be avoided as the diagnostic
metabolites may not be detectable even after partial recovery or if the patient is
receiving I.V. fluids.
Sample pH: Prior to analysis, it is useful to check the pH of each urine sample. A
pH >8.5 is indicative of bacterial contamination which makes the sample
unsuitable for analysis. However, it is recommended that such samples are
analysed regardless to ensure there are no obvious diagnostic markers present
but then reported as “unsuitable for analysis, repeat required”.
Clinical details: It is important that requests for organic acid analysis are
accompanied by clinical information as this can alert the laboratory to look for
specific compounds. Clinical signs and symptoms, the presence of any unusual
odours, and information on family history, medication and choice of feeds may be
pertinent and should be documented. Although this in practice is not the case and
highlights the need for close liaison with clinical teams.
3. Analytical Considerations
3.1 Overview
The interpretation and, where required, quantitation of urine organic acids
requires close attention to the detail of all analytical aspects of the process. In
particular:
The concentration of the urine (creatinine concentration) must be
corrected by extraction of varying volumes of urine to allow for
‘standardisation’ of the amount of organic acids extracted enabling
consistent interpretation and quantitation of organic acids (where
required).
Appropriate internal standards must be added to account for systematic
losses during extraction and derivatisation, to normalise the
chromatogram and allow quantitation of organic acids (where required).
They also enable the sensitivity of the GC-MS to be monitored. Wherever
possible, stable isotope internal standards are recommended as these are
fundamental to the quality control process.
Organic acids must be efficiently extracted from aqueous urine into an
organic phase to allow GC-MS analysis.
Organic acids must be converted to volatile derivatives so that they are
thermally stable and chemically inert allowing GC-MS analysis.
Page 7 of 29
The GC must use an appropriate column, injection volume, oven
temperature, ramp and timing to achieve adequate separation of organic
acids over a suitable run time.
The mass spectrometer should be operated in full scan mode, typically
scanning between 50 and 550 amu. If oximation is performed with
pentafluorobenzyloxylamine (PFBO), succinylacetone produces derivatives
with m/z 620 hence the scan range would need to be increased
accordingly. This enables the data acquired to be reviewed as a total ion
chromatogram (TIC) and a full profile of organic acids to be detected.
The mass spectrometer must be regularly and frequently maintained to
ensure optimum performance.
3.2 Qualitative Versus Quantitative Analysis
There is currently no consensus opinion on whether organic acid analysis should
be qualitative or quantitative. In the absence of evidence to support a specific
approach, individual laboratories need to be aware of the limitations of each
approach. Care should be applied to the term ‘quantitative’ organic acid analysis.
When an MS is acquiring data in full scan mode, organic acid analysis is deemed
qualitative. Qualitative organic acid analysis has the advantages of simplicity and
reduced cost whilst still enabling the diagnosis of most organic acidurias.
Quantitation from full scan data is not recommended.
Laboratories may choose to quantify a number of key compounds by introducing
additional data acquisition in Selective Ion Monitoring (SIM) mode. Previously this
would have necessitated one injection in full scan mode and another in SIM, with
increased run times accordingly. However, modern instruments have the
capability to acquire scan and SIM data simultaneously, negating the need for a
second injection. It is important that laboratories take advantage of such changes
in technology and if quantitation is desired, it is recommended that methods are
updated accordingly. The advantage of quantitation is the ability to provide
additional information which may aid diagnosis and/or be useful for monitoring
treatment e.g. quantification of methylmalonic acid in B12 responsive
Methylmalonic Aciduria.
However, it is also important to understand the limitations as quantitative
measurements are often made under less than ideal circumstances. It is not
practical to establish calibration curves for every organic acid which might be
Page 8 of 29
detected. Daily calibrations can be onerous and as such many laboratories choose
to calibrate periodically. Whilst this may be a legitimate approach provided assay
performance is closely monitored and analysts are aware of the importance of
internal standard consistency, it probably reflects historic practice with less
sophisticated instruments. Since the introduction of GCMS into the clinical
laboratory, quantitative methods have suffered from the limited availability of
stable isotope internal standards with most analytes being linked to a compound
on the basis of availability rather than structural similarity. As the cost of stable
isotopes reduces and availability increases, laboratories that wish to quantitate
are strongly encouraged to purchase appropriate stable isotopes and review and
update these historic methods. Where stable isotopes are used for quantitation it
is recommended that a stable isotope that is at least three mass units higher than
the native compound is used.
Likewise, the ideal quantitative GCMS method would monitor a qualifier ion as
well as a quantifier, an approach rarely utilised in organic acid analysis.
3.3 Sample Preparation
3.3.1 Sample Volume
Generally laboratories perform the extraction on approximately 1mL of urine, for
a sample with a creatinine concentration of 1 mmol/L. The urine creatinine
concentration is used to determine the volume of urine to be extracted;
effectively normalising the results to a creatinine of 1 mmol/L. For example, if
urine creatinine = 1.239 mmol/L then the nominal volume of urine extracted
would be 1/1.239 = 0.807 mL. Where less than the minimum volume is required,
deionised water should be used to make it up to the desired volume.
In recent years, as instrument sensitivity has improved, a number of laboratories
have chosen to reduce the volume of urine extracted to a nominal volume of
0.5mL, for a sample with a creatinine concentration of 1 mmol/L. In this case, for
a sample with a urine creatinine = 1.239 mmol/L, the nominal volume of urine
extracted would be 0.5/1.239 = 0.404mL.
3.3.2 Internal Standards
Addition of an internal standard must be the first step in sample preparation to
account for any losses in subsequent steps. Given the number and variety of
compounds present in urine, no single internal standard is ideal, therefore a
combination of internal standards is recommended. The local laboratory should
determine which combination to use, bearing in mind the following
Page 9 of 29
recommendations as a minimum. If quantitation is to be performed a stable
isotope internal standard is recommended.
Internal standards may be broadly categorised into three groups: exogenous
compounds not seen in urine (often halogenated), analogues of compound groups
seen in urine that are not themselves present (margaric acid, heptanoylglycine)
and stable isotope labelled analogues of compounds that may be seen in urine.
Exogenous compounds are often so chemically different from normal urine
constituents that their use as internal standards is questionable. Stable isotopes
are the ideal internal standard, but may be expensive, in some cases prohibitively
so. Deuterium labelled compounds are most common albeit at the expense of a
slight retention time shift which increases with the number of 2H present. 13C and
15N do not show this shift and consquently are preferred but the costs are much
higher. The main advantage of stable isotope internal standards is that they
provide an additional quality control measure: urine is a complex matrix from
which a wide range of chemical structures is extracted and ultimately introduced
into a high temperature, reactive environment (the liner). The addition of stable
isotope internal standards to every patient sample enables the analyst to monitor
any sporadic losses which may occur. We recommend the following internal
standards as a minimum:
Exogenous compound.
Rationale: Many laboratories choose to include an exogenous compound against
which to normalise the chromatogram, at a concentration which produces a peak
(on total ion chromatogram) that is considered acceptable in abundance. An
exogenous compound that does not co-elute with other compounds can help
achieve consistent normalisation of the chromatogram for interpretation. It is
important that the chosen compound is stable and reproducible.
Examples: 2-phenylbutrate, d3-methylmalonate, d4-4-nitrophenol and 2-
oxocaproate are commonly used. Margaric acid (C17) and chlorobenzoic acid
have also been used but due to the presence of an interfering ion and limited
solubility in aqueous phase respectively, are not recommended.
Stable isotope of orotic acid.
Rationale: assurance that orotic acid has not been lost during analysis of any
individual sample. The exact mechanism for this loss is not known, but recent
evidence from the author’s laboratory suggests that orotic acid is extracted from

Page 10 of 29
the urine sample successfully but becomes unstable once injected into the GC,
potentially decomposing in the injection port/liner of the GC under specific
reaction conditions (3). We would recommend the concentration of the orotic acid
stable isotope to be at the upper limit of the reference range (5 mol/mmol).
Example: 15N2-orotic acid is readily available and should be utilised to monitor
loss of orotic acid however, it is of limited value for quantitation of orotic acid,
because the standard curve is non-linear.
Glycine conjugate.
Rationale: assessment of sensitivity of key diagnostic compounds which may be
excreted at low concentration. Ideally the glycine conjugate should be a stable
isotope, alternatively an exogenous one.
Example: heptanoylglycine or d3-hexanoylglycine. We would recommend the
concentration of the glycine conjugate stable isotope to be 2 mol/mmol
creatinine.
A short chain acid.
Rationale: assurance that short chain acids and ketoacids have not been lost
during the drying down process
Example: stable isotope of lactic acid or 3-hydroxyisovalerate
Ideally stable isotopes of both hydrophilic and hydrophobic compounds should be
used, for example citrate and phenylbutyrate, respectively. Additionally, if
oximation is used, a stable isotope of an oxo acid (e.g. 2-oxocaproate) should be
included to assess completion of oximation.
3.3.3 Sample Extraction
The various steps in the extraction process ensure optimal extraction of organic
acids into the organic phase. It is recommended that high purity chromatography
grade solvents are used for analysis.
Oximation: The first step in sample preparation may be oximation of the urine
sample and a variety of reagents have been used for this purpose,
hydroxylamine, methoxylamine and pentafluorobenzyloxylamine being most
common. Oximation stabilises the oxo form over the enol form by producing
oximes which are chemically more stable. For hydroxylamine and methoxylamine
this is typically achieved by adjusting the pH of the sample to pH 14 with 5M
NaOH, adding aqueous oximating reagent and heating at 60°C for 30 minutes.
Page 11 of 29
For pentafluorobenzyloxylamine the reaction can proceed at pH<2 so the reagent
may be added at the same time as the internal standards and HCl. Although
oximation necessitates an extra step in the sample preparation process, in
addition to stabilising the oxo acids it simplifies the chromatogram as fewer peaks
are present for several compounds eg 2-oxoglutarate. The selective conversion of
oxo acids will alter their retention time relative to other compounds present and
this may also be a consideration when selecting which reagent to use. There is
little published evidence supporting the requirement for oximation. Although a
survey by ERNDIM in 2008 (4) concluded that there was no correlation between
proficiency scheme score and use of oximation, this was overly simplistic and was
at best an indirect assessment of the efficacy of oximation as many other factors
contribute, not least the matrix of the sample. At the time approximately 2/3 of
ERNDIM participants used a method including oximation. In the authors’
experience, the detection of succinyl acetone is improved by oximation hence
oximation is the recommended approach (5).
Urease: Urease can be added during the sample preparation process to remove
urea (incubation at 56˚C for 60 minutes). This is an advantage because urea
may co-elute with other compounds such as methylmalonic and 4-hydroxybutyric
acids. This must be balanced against the need for an extra step in the process.
Addition of excess salt: improves the extraction of organic acids because large
amounts of inorganic salts “bind” water, thus decreasing the solubility of organic
metabolites in aqueous solution. Commonly referred to as ‘salting out’.
Acidification with HCl: aids extraction of acids in the subsequent liquid-liquid
extraction step by converting them to their neutral (protonated) state.
Liquid-liquid extraction: two different organic solvents are recommended since
different acids extract preferentially, with hydroxy acids and low molecular weight
acids being preferentially extracted into ethyl acetate (6). For example, mevalonic
acid, which extracts poorly into diethylether or a mixture of
ethylacetate/diethylether, extracts preferentially into ethylacetate alone.
Sequential extractions with ethylacetate and diethylether are recommended to
maximise recovery across the range of analytes present. Following the addition of
the organic solvent the mixture should be shaken vigorously for 30 seconds,
centrifuged briefly to break any emulsion that has formed, and the top, organic

Page 12 of 29
layer removed to a fresh sample tube then the process is repeated a second time
(with the same or different solvent) combining the extracts into one tube.
Drying of the combined organic layers:
Although solvents such as ethylacetate and diethyl ether are considered
immiscible with water, water will dissolve in them to some extent which has the
potential to hinder the subsequent derivatisation reaction. It is therefore common
at this stage to dry the combined extracts, typically by standing over anhydrous
sodium sulphate with occasional mixing for 30 minutes. After brief centrifugation,
the organic layer is carefully removed to a clean tube. The rationale is that any
residual water present during derivatisation will hinder the derivatisation reaction,
however, this step is not always performed without apparent problems. This may
be due to the fact that both ethylacetate and diethyl ether form azeotropic
mixtures with water making its removal easier than anticipated.
Evaporation to dryness: once the solvent extracts have been combined (and
dried) they should be evaporated to dryness. We would recommend the use of a
centrifugal evaporator to ensure drying is gentle and consistent. In the event that
this is not possible, solvent extracts should be dried under nitrogen at ambient
temperature. Although it is common practice in many laboratories to use heat at
this stage (40˚C), we do not recommend this approach because of the likelihood
that volatile short chain acids will be lost if insufficient attention is paid to this
step (5).
Derivatisation: It is recommended that reagents of the purest grades are used for
derivatisation to avoid extra peaks in the chromatogram. Trimethylsilyl (TMS)
derivatisation is commonly used and is recommended because it is quick and
effective. The TMS groups react with exchangeable hydrogen atoms (e.g. hydroxy
groups on carboxylic acids and alcohols, and amine groups) on the organic acids.
The hydrogen atom(s) is replaced with a TMS group (molecular weight 73 amu)
and resulting in an increase in the organic acid molecular weight of 72 amu
(addition of TMS and a loss of one hydrogen) per TMS group added. TMS
derivatisation is achieved by treating the solvent extract with pyridine and N,O,-
bis-(trimethylsilyl)trifluoroacetamide (BSTFA) containing 1% trimethyl-
chlorosilane (TMCS) and heating to approximately 75C for between 15 and 30
minutes. It is important that the reaction conditions are kept constant between
batches so that the number of TMS derivatives formed is constant for annotation
and interpretative purposes. In addition higher temperatures for longer time
Page 13 of 29
periods may increase the number of less stable derivatives formed. For example;
of the mono and di TMS derivatives of acylglycines formed, the di TMS derivatives
are less stable and have a tendency to breakdown during GC analysis if the
system is not clean.
3.4 Gas Chromatography Mass Spectrometry (GCMS)
It is difficult to be prescriptive of the GC conditions as they will relate to the
specific GC instrument and the column being used. The GC system may be
operated at constant pressure or constant flow. Each laboratory will therefore
need to optimise their instrument and validate their method.
Injection: the injection volume should be of the order of 1L with a split ratio of
at least 1:15 to prevent overloading of the column. Lower split volumes may
result in a loss of sensitivity.
Run times: short run times may lead to overlapping peaks and make annotation
more difficult.
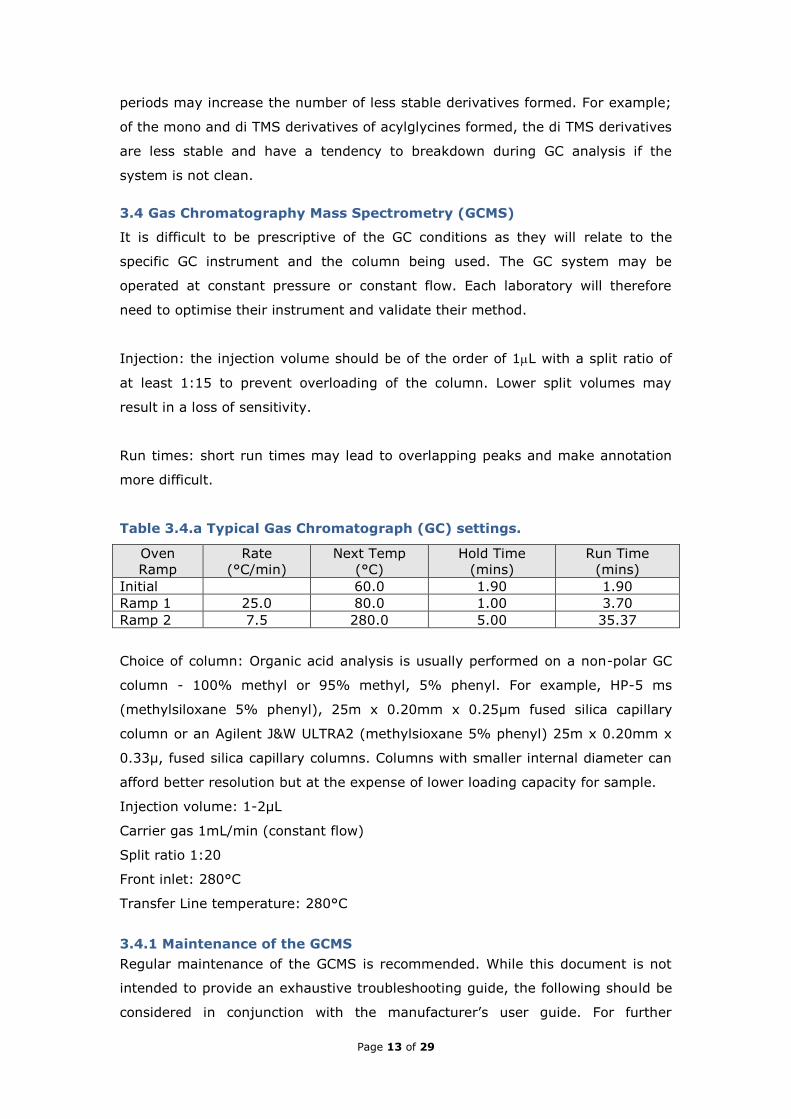
Table 3.4.a Typical Gas Chromatograph (GC) settings.
Oven
Ramp
Rate
(°C/min)
Next Temp
(°C)
Hold Time
(mins)
Run Time
(mins)
Initial 60.0 1.90 1.90
Ramp 1 25.0 80.0 1.00 3.70
Ramp 2 7.5 280.0 5.00 35.37
Choice of column: Organic acid analysis is usually performed on a non-polar GC
column - 100% methyl or 95% methyl, 5% phenyl. For example, HP-5 ms
(methylsiloxane 5% phenyl), 25m x 0.20mm x 0.25µm fused silica capillary
column or an Agilent J&W ULTRA2 (methylsioxane 5% phenyl) 25m x 0.20mm x
0.33µ, fused silica capillary columns. Columns with smaller internal diameter can
afford better resolution but at the expense of lower loading capacity for sample.
Injection volume: 1-2µL
Carrier gas 1mL/min (constant flow)
Split ratio 1:20
Front inlet: 280°C
Transfer Line temperature: 280°C
3.4.1 Maintenance of the GCMS
Regular maintenance of the GCMS is recommended. While this document is not
intended to provide an exhaustive troubleshooting guide, the following should be
considered in conjunction with the manufacturer’s user guide. For further
Page 14 of 29
information on troubleshooting, the reader is referred to ‘GC Troubleshoooting’
(7).
It may be useful to record and monitor certain parameters on the GC-MS system
to help identify when performance is deteriorating and when maintenance is
required. Examples include:
Abundance of the key ions during the autotune
Repeller voltage
EM voltage
Intensity of internal standards key ions including mono and di derivatives
of glycine conjugates
Many systems will now perform an autotune evaluation which provides automatic
guidance on when performance is suboptimal. It is essential that the instrument
is regularly tuned to ensure optimal performance of the MS. This should be
undertaken as a minimum weekly and after any maintenance or engineer visit. A
tuning gas such as perfluorotributylamine (PTFBA) is used because it produces
volatile but chemically stable fragments across the mass range of interest and
contains 13C and 15N isotopes. A range of parameters (number of peaks, peak
width at half height, peak resolution and abundance of key ions) should be
recorded and monitored against locally agreed acceptable limits.
Repeller voltage: the repeller voltage provides an excellent indication of the
cleanliness of the ion source; as the ion source becomes dirty, the potential
required by the repeller to achieve a particular target ion abundance for a tune
mass, will be higher. This effect generally becomes evident in ions with a higher
m/z first because a higher potential is required to eject them from the ion source.
Electron multiplier voltage: the EM voltage should be recorded and monitored to
allow assessment of the need to replace it. The voltage will naturally increase
with age, once it begins to increase more rapidly; this is a sign that it should be
replaced.
Internal standard peak area: Peak area of the internal standard starts to decrease
typically after 500-600 injections, requiring system maintenance (ion source,
column inlet liner etc).
4 Post Analytical Considerations
Organic acid interpretation is complex and should be performed by staff with
sufficient experience and competency. Overall interpretation of organic acid
Page 15 of 29
chromatograms is based on pattern recognition. There are many good references
describing the significance of particular compounds/patterns (8) (9) (10).
Participation in interpretative EQA schemes (see below) is essential. The
following procedures should take place when reviewing a batch of organic acids:
1) Check integrity of the batch:
A process blank should be run with each batch and checked for signs of
analytical contamination. For example, plasticisers, lubricants, resins, column
bleed, septa bleed.
2) Check internal quality control (IQC) samples (see later):
Appropriate action should be taken if locally defined standards are not met. It
is important to remember that IQC samples are of limited value as they will
not account for matrix effects of individual samples.
3) For each individual chromatogram:
a) The TIC abundance of all internal standards must be monitored. If
abundance is too low or internal standards are not present, the sample
should be re-extracted and re-analysed to ensure correct procedure has
been followed and there have been no problems with sample extraction
and/or matrix effects.
b) The chromatogram should be methodically interrogated and the mass
spectrum of each peak on the chromatogram should be reviewed and
compared to an appropriate compound library. It is often useful to break
down the chromatogram into smaller discrete segments to ensure all
peaks are identified. Some co-eluting peaks may make identification
difficult and more sophisticated peak interrogation techniques may be
helpful where software allows (e.g. mass subtraction, peak purity).
Software providing auto peak recognition/annotation are available from
most major instrument manufacturers. These can be used to speed up
the annotation/interpretation process but should not be completely relied
upon. However, it is important that the specifics of a given autoannotation
process and its limitations are understood by the user. Manual
interrogation of peaks should be performed to check accuracy of auto
annotation software where necessary. This is particularly important for
peaks which are known to run at the same retention time and where the
presence of compounds in small quantities is of significant clinical
importance. NB Beware spectral libraries developed in house which may
Page 16 of 29
contain ‘impure’ spectra that can lead to confusion. It is recommended
that NIST is included in any automatic library search. Modern software
allows extracted ion scans to be quickly performed and these should be
utilised to check for key compounds in every patient sample. We
recommend performing extracted ion scans of the following analytes (if
they are not quantitated separately):
4-hydroxybutyrate
butyrylglycine
isovalerylglycine
tiglylglycine
hexanoyl glycine
suberyl glycine
3-hydroxyglutarate
orotic acid
methyl citrate
succinyl acetone
malonic acid
methylmalonic acid
It may be prudent to include additional compounds dependent upon
individual laboratory experience and/or ERNDIM performance.
4) Perform/check quantitation of any metabolites that are analysed
quantitatively (if any).
5) Reporting of results - qualitative reports should be as clear and concise as
possible. Overly complicated and long reports risk confusing users who may
potentially miss key information. As a general guideline reports should:
State key abnormal peaks present (NB in certain circumstances it may not
be helpful to state all abnormal peaks).
Suggest possible causes for abnormal peaks (e.g. possible diagnoses,
dietary factors).
Guidance on what follow up is required (including further testing/referral
to relevant clinical teams).
If a specific condition has been queried, its exclusion should be mentioned.
If clinical details suggest a specific condition associated with diagnostic
difficulty users may choose to comment on this (e.g. 3-hydroxyglutarate in
a patient with non-accidental injury, mevalonate in asymptomatic patients.
Page 17 of 29
Quantitative results should be reported clearly with appropriate units and
reference intervals. Quantitative data should be used to enhance
interpretive analysis and comments.
It is important to note that organic acid analysis will often not provide sole
confirmation of an exact diagnosis. Results of other key analyses (e.g.
acylcarnitine and amino acid analysis) must be taken into account and
reports should recommend any required confirmatory (e.g. enzyme or
molecular) analysis.
In many circumstances urgent communication of results may be
necessary. Details of whom results have been communicated to and when
should be added to the report.
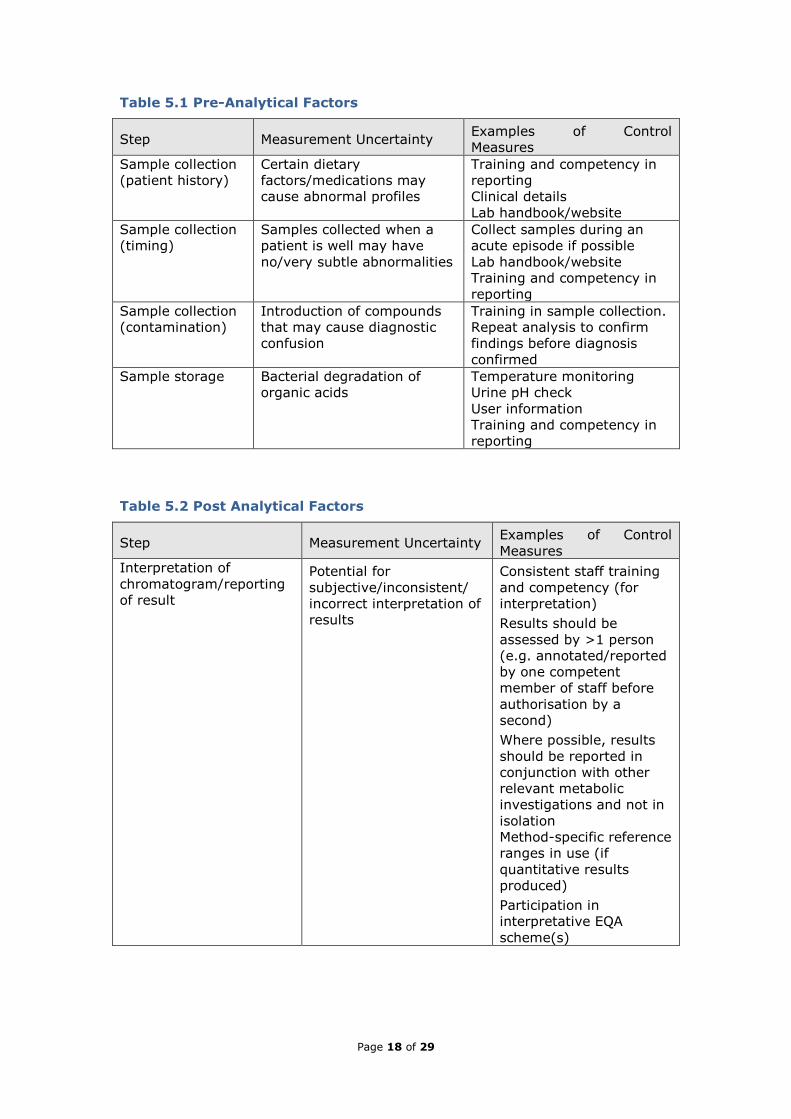
5. Uncertainty of Measurement
Tables 5.1 to 5.3 summarise the critical steps in the analysis of urinary organic
acids. It can be useful to highlight those stages where a significant degree of
control is necessary and ensure the analyst has considered what stated reference
is adequate to ensure the final analytical result obtained and reported is fit for its
intended clinical purpose. In Table 3, the degree of control required is indicated
by (G), (A) and (R) standing for green, amber and red respectively. Green steps
require only a minimal or basic degree of control. Amber steps are those in which
a significant degree of control is required but can be achieved by the use of
properly maintained and calibrated equipment for common measurements e.g.
mass, temperature, volume, instrument response etc. Red steps indicate that a
significant degree of control is required and that the analyst must select a special
stated reference. The reader is referred elsewhere for further information on this
topic (11).
Page 18 of 29
Table 5.1 Pre-Analytical Factors
Step Measurement Uncertainty Examples of Control
Measures
Sample collection
(patient history)
Certain dietary
factors/medications may
cause abnormal profiles
Training and competency in
reporting
Clinical details
Lab handbook/website
Sample collection
(timing)
Samples collected when a
patient is well may have
no/very subtle abnormalities
Collect samples during an
acute episode if possible
Lab handbook/website
Training and competency in
reporting
Sample collection
(contamination)
Introduction of compounds
that may cause diagnostic
confusion
Training in sample collection.
Repeat analysis to confirm
findings before diagnosis
confirmed
Sample storage Bacterial degradation of
organic acids
Temperature monitoring
Urine pH check
User information
Training and competency in
reporting
Table 5.2 Post Analytical Factors
Step Measurement Uncertainty Examples of Control
Measures
Interpretation of
chromatogram/reporting
of result
Potential for
subjective/inconsistent/
incorrect interpretation of
results
Consistent staff training
and competency (for
interpretation)
Results should be
assessed by >1 person
(e.g. annotated/reported
by one competent
member of staff before
authorisation by a
second)
Where possible, results
should be reported in
conjunction with other
relevant metabolic
investigations and not in
isolation
Method-specific reference
ranges in use (if
quantitative results
produced)
Participation in
interpretative EQA
scheme(s)

Page 19 of 29
Table 5.3 Analytical Factors
Critical step MU Control
measure
Degree
of
control
(R,A,G)
Traceability
Determining
concentration
of stable
isotope internal
standard
Molecular weight
used to calculate
concentration of
stock internal
standard. Accuracy
of the assay relates
directly to the
concentration of
internal standard.
MW taken
from
appropriate
resource
material.
R MW taken
from
Chemspider
database
(N.B. ensuring
correct salt)
Preparation of
stock internal
standard
solution
Accuracy of patient
result for
quantitative
analysis
Regular use of
check weight/
used
immediately
prior to
weighing IS
Solution
prepared in
Grade A
volumetric
flask
R Annual
calibration of
balance by
UKAS
accredited
company
Tolerance of
100 mL flask
is ± 0.02% at
20°C
Preparation of
working
internal
standard
solution
Accuracy of patient
result for
quantitative
analysis
Calibrated
Gilson pipette
used to deliver
working IS
solution
Regular
pipette
verification of
precision
R Certificate of
pipette
calibration by
UKAS
accredited
company
Measurement
of urine
creatinine
concentration
Volume of urine
extracted depends
on creatinine
concentration
Creatinine
measured by
UKAS
accredited
method
R Traceability of
method
EQA scheme
participation
Acidification
(pH<2) of
sample with
HCl
Poor extraction of
acids
Excess acid
added
Check pH with
indicator
paper
G

Page 20 of 29
Table 5.3 cont. Analytical Factors
Critical step MU Control measure Degree
of
control
(R,A,G)
Traceability
Solvent
extraction
Complete
extraction of
organic acids
from urine
sample
Different
organic acids
have different
extraction
efficiencies
Solvents present
in excess
Two different
solvents used
and extracts
pooled. Presence
of IS to correct
for recovery
G
G
Evaporation of
solvent extract
Potential loss
of volatile
compounds
resulting in a
missed
diagnosis
Oximation
Use of
centrifugal
evaporator
G
G
Derivatisation
Incomplete
derivatisation
Derivatisation
reaction time
Derivatisation
reaction
temperature
BSTFA and
pyridine present
in excess
Electronic timer
for 30 minutes
Hot block temp
calibrated.
Temperature is
ok up to 10°C
G
A
A
Chromatographic
separation
Separation of
analytes
Visual check of
chromatogram
and retention
times
Profile of QC
checked to
ensure adequate
resolution and
expected peaks
are detected
A
Detection of
specific ions by
MS
Mass
calibration of
MS detector
Weekly autotune
performed
(includes tests
for relative
abundance, m/z,
peak width etc of
target ions)
R Mass
calibration and
electron
multiplier tune
performed by
manufacturer
at annual PM
Identification of
spectra
Interpretation
of patient
results
User defined
libraries
AMDIS
deconvolution
software
R Competency
Spectral library
searching using
NIST database
Page 21 of 29
6. Performance Characteristics
Several EQA schemes exist for urinary organic acids but no single scheme is fully
comprehensive. The European Research Network for evaluation and improvement
of screening, Diagnosis and treatment of Inherited disorders of Metabolism
(ERNDIM) provides the Quantitative Urine Organic Acid scheme which includes 24
organic acids. In 2017, 131 laboratories participated in this scheme. Review of
the intra laboratory CVs for given analytes provides a crude measure of
performance and highlights the difficulties associated with measuring organic
acids. For example, for 3-hydroxyisovaleric acid (HIVA) the average intra-
laboratory CV was 22% and the inter-laboratory CV was 51%. Likewise, for 3-
hydroxyglutaric acid the average intra-laboratory CV was 30% and the inter-
laboratory CV was 181%.
The lack of certified reference materials, availability/choice of stable isotope
internal standard and variation in sample preparation and extraction efficiency
are likely contributing factors. The utility of the scheme is also limited by the
small number of samples distributed annually (n=8) (12).
6.1 Reference Intervals
Due to the inherent limitations associated with the quantitation of organic acids, it
is recommended that any laboratory reporting quantitative results on a given
compound has established in house reference ranges.
6.2 Traceability
For most UK laboratories, with the exception of a small number of analytes which
are reported quantitatively, organic acid analysis is essentially a qualitative
procedure. More than a hundred different organic acids can be detected by this
method and in almost all cases, identification and detection is a qualitative
process based on retention time and the presence of key ions in the
corresponding mass spectrum. Annotation of the chromatogram is performed
using spectral library matching although considerable operator experience is also
required. Although quantitation of key compounds may be performed routinely,
clinical interpretation is based on assessment of the complete urine organic acid
profile, not on the basis of an individual organic acid result. Interpretation should
also take into account clinical details and other available test results.
Page 22 of 29
For those compounds which are quantitated, evaluation of traceability is likely to
identify 4 property values requiring a high degree of control (a property value is
one of the critical steps that directly relates to the final analytical result and
hence one which should be traceable, see Table 5.3) (11). The final analytical
result is derived from the following calculation:
Conc (μmol/L) = [(analyte response) / (IS response)] x M (μM)
where M is concentration of the internal standard added to each sample. The
volume of urine extracted is calculated on the basis of the creatinine
concentration, allowing results to be expressed as µmol/mmol.
7. Performance Monitoring
7.1 Internal Quality Control
It is recommended that two levels of matrix matched IQC are analysed with each
batch of patient samples. It is also recommended that the IQC material should
contain any analytes which are being reported quantitatively. It is also good
practice to include a range of compounds which are only detected qualitatively.
Particular weight might be placed on those which are clinically important and/or
known to be associated with analytical issues (e.g. orotic acid, hexanoyl glycine,
short chain oxo acids).
It is important to reiterate that inclusion of orotic acid in an IQC sample does not
negate the need for a stable isotope of orotic acid to be added to every sample
because the loss of orotic acid is sample specific.
It is important to carefully consider which compounds are present in the IQC
material. The method is capable of detecting >150 different compounds and it is
not practical to include all of these in the IQC material. Labs should make an
informed decision based on their individual requirements.
Commercial IQC material is available which contains a range of useful compounds
and target concentrations. For example, SKML https://www.skml.nl/en/home list
7.2 External Quality Assessment (EQA)
All labs performing organic acid analysis should be enrolled in an appropriate EQA
scheme. It is recommended that all users should be enrolled in an interpretative

Page 23 of 29
scheme and for labs providing quantitative results, appropriate quantitative
schemes. Relevant EQA schemes include:
ERNDIM Qualitative Organic Acids (3 X 3 samples annually)
ERNDIM Diagnostic Proficiency scheme (2 X 3 samples annually)
ERNDIM Quantitative Organic acid analysis (8 samples annually)
ERNDIM special assays urine (8 samples annually)
7.3 Reagent Acceptance Testing
To ensure compliance with UKAS standards, laboratories must be able to
demonstrate reagent acceptance testing.
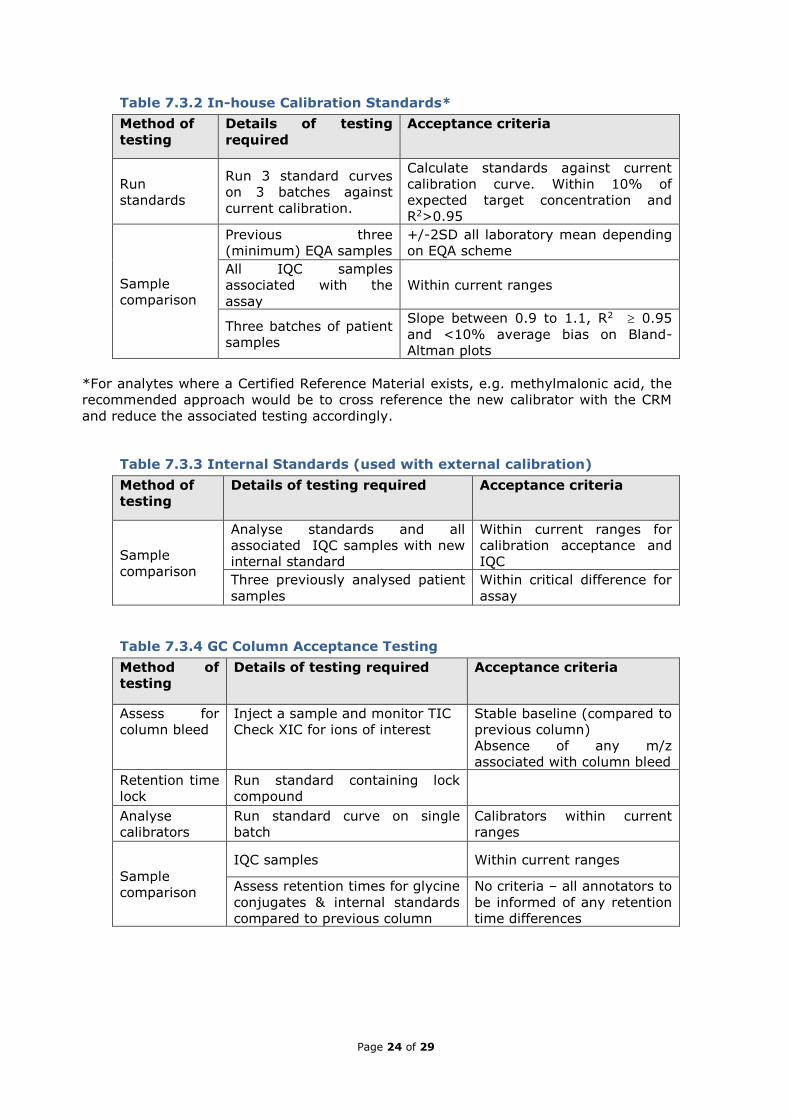
Tables 7.3.1 to 7.3.4 outline such a process as an example. It should be noted
that individual IQC samples, even those which are human urine, are of limited
utility due to sample specific matrix effects. IQC samples will demonstrate that
the system is working but not the effect of an individual sample matrix. Where
small numbers of individual patient samples are used for comparison, the
percentage difference between the previous result and the new result should be
less than the critical difference for the assay. Critical difference at 95%
confidence limit may be calculated using the formula; critical difference = 2.77 ×
√(CVa2 + CVi2) where CVa = analytical coefficient of variation and CVi = CV of
within-subject biological variation. Since within-subject biological variation is not
relevant as the same sample is being analysed, this may be calculated by
multiplying the long-term IQC coefficient of variation by 2.77. (The coefficient of
2.77 is derived from √2 × 1.96; where 1.96 is the probability factor for 95%
probability of a true change in either direction, and multiplication by √2 accounts
for the fact that the critical difference includes variation in two measurements.)
Table 7.3.1 Assay Reagents
Method of
testing
Details of testing required Acceptance criteria
Sample
comparison
All IQC samples associated with
the assay Within current ranges
Three previously analysed
patient samples
Within critical difference for
assay
Page 24 of 29
Table 7.3.2 In-house Calibration Standards*
Method of
testing
Details of testing
required
Acceptance criteria
Run
standards
Run 3 standard curves
on 3 batches against
current calibration.
Calculate standards against current
calibration curve. Within 10% of
expected target concentration and
R2>0.95
Sample
comparison
Previous three
(minimum) EQA samples
+/-2SD all laboratory mean depending
on EQA scheme
All IQC samples
associated with the
assay
Within current ranges
Three batches of patient
samples
Slope between 0.9 to 1.1, R2 0.95
and <10% average bias on Bland-
Altman plots
*For analytes where a Certified Reference Material exists, e.g. methylmalonic acid, the
recommended approach would be to cross reference the new calibrator with the CRM
and reduce the associated testing accordingly.
Table 7.3.3 Internal Standards (used with external calibration)
Method of
testing
Details of testing required Acceptance criteria
Sample
comparison
Analyse standards and all
associated IQC samples with new
internal standard
Within current ranges for
calibration acceptance and
IQC
Three previously analysed patient
samples
Within critical difference for
assay
Table 7.3.4 GC Column Acceptance Testing
Method of
testing
Details of testing required Acceptance criteria
Assess for
column bleed
Inject a sample and monitor TIC
Check XIC for ions of interest
Stable baseline (compared to
previous column)
Absence of any m/z
associated with column bleed
Retention time
lock
Run standard containing lock
compound
Analyse
calibrators
Run standard curve on single
batch
Calibrators within current
ranges
Sample
comparison
IQC samples Within current ranges
Assess retention times for glycine
conjugates & internal standards
compared to previous column
No criteria – all annotators to
be informed of any retention
time differences

Page 25 of 29
8. Pitfalls and Limitations
Organic acid analysis is a complex process which is prone to many limitations and
pitfalls (10). It is important that laboratories understand the limitations of the
methodology so that they are able to provide a robust and safe organic acid
service. The detection rate of IMDs is lower when the diagnostic compound is
prone to analytical issues. Key points to be aware of are listed below.
Solvent extraction:
The efficiency with which organic acids are extracted from the urine sample
varies. Some acids extract relatively well and others less so. It is recommended
that two different solvents are used to maximise the extraction efficiency.
Generally speaking free acids can be extracted into organic solvents from an
acidic solution, acid salts will extract into water and neutral substances will
extract at any pH. Because of the difference in extraction efficiency, peak size
does not correlate with concentration. For example, methylcitrate extracts poorly
from the urine sample so a relatively small peak can correspond to a high
concentration. Likewise, glycerol, a small neutral molecule, is also poorly
extracted.
The solvents are present in excess during the extraction step so the precision
with which the solvent is added is not critical. However, the inherent differences
in extraction efficiency mean it is important to perform this step consistently. It is
recommended that extraction efficiency is monitored by recording the relative
intensities of key compounds in an IQC material.
If the separation of the solvent layer from the aqueous layer is performed poorly,
water soluble compounds are carried over and will be detectable on the
chromatogram. Common examples are urea and phosphate. In addition, when
the organic solvents are evaporated the water-soluble salts may precipitate out of
solution.
Evaporation of solvent extract:
Care is required during the drying down step. If samples are over dried at this
stage the shorter chain, volatile acids and oxo acids may be lost. These include
but are not limited to, lactate, 2-hydroxybutyrate, 3-hydroxybutyrate, 4-
hydroxybutyrate, 2-oxo-isocaproate, acetoacetate, 3-hydroxyisovalerate some of
which are diagnostic.
Page 26 of 29
Derivatisation:
The time and temperature of the derivatisation reaction is important. The
derivatisation step must be done consistently to ensure the products formed are
consistent. Residual moisture (caused by aqueous phase being carried over from
solvent extraction) will result in poor derivatisation of samples. If this is apparent
(samples will be difficult to dry down fully) then they should be re-extracted and
re-analysed.
Co-eluting peaks:
There are many examples of co-eluting compounds and this can lead to
difficulties in correctly identifying the spectra and/or missed peaks. With the
increasing use of sophisticated software this is becoming less of a problem but
analysts should be aware of key compounds that co-elute on their local system.
Common examples include 3-hydroxyisobutyrate and 3-hydroxy-N-butyrate, 2-
hydroxyglutarate, isopropylmalate and 3-hydroxyglutarate, orotic acid and
aconitate, and 2-methylcrotonyl/3-methylcrotonylglycine.
Chiral compounds:
D and L isomers will not be separated by standard columns used in organic acid
analysis. This can be of clinical significance (for example to identify the different
forms of 2-OH-glutaric aciduria, identification of D-lactate) and separate analysis
with a chiral column must be performed in such circumstances.
Interfering compounds with spectra containing the same ions as a compound
being quantitated e.g. isopropylmalate and 3-hydroxyglutarate (m/z 185).
Sporadic loss of key compounds:
The potential to ‘lose’ certain compounds, for example orotic acid, while recovery
of other compounds is unaffected is a known limitation of analysis. Addition of a
stable isotope of orotic acid, to every patient sample, is vital to enable the
sporadic loss of orotic acid to be monitored. The mechanism of this loss has yet to
be ascertained but is hypothesised to be a chemical effect influenced by specific
reaction conditions created in the injection port/liner of the GC, not failure to
extract the orotic acid. The nature of the loss is sample specific hence analysis of
a quality control sample containing orotic acid will not detect this problem in
patient samples. Irrespective of the cause, addition of stable isotope orotic acid is
vital to prevent a missed diagnosis. In the author’s experience other compounds,

Page 27 of 29
for example uracil, are also prone to sporadic losses and the only way to
counteract this is the use of stable isotopes.
General background contamination:
Contaminants such as column bleed, septa bleed, hydrocarbons, and phthalate
plasticizers can result in a large TIC signal during the analytical scan. This
decreases the sensitivity and can prevent the detection of key compounds. Table
8 summarises some common contaminant mass ions which can alert the user to a
problem.
Table 8 Common Contaminant Ions in GCMS.
Mass Ions Compounds Source of contamination
18, 28, 32, 44 H2O, N2, O2, CO2 Air leak
28, 44 CO, CO2 Hydrocarbon fragments
31 Methanol Lens cleaning solvent
43, 58 Acetone Cleaning solvent
69 Fore pump fluid Saturated trap pellets
69, 131, 219, 254,
414, 502 PFTBA Calibration gas leak
73, 207, 281, 327 Polysiloxanes Column bleed
73, 207, 281, 149 Polysiloxanes Septum bleed
73, 147, 207, 221,
295, 355, 429 Dimethylpolysiloxanes Septum breakdown
77 Benzene/xylene Cleaning solvent
77, 94, 115, 141,
168, 170, 262, 354,
446
Diffusion pump oil Improper shut down of
pump heater
91, 92 Toluene/xylene Cleaning solvent
105, 106 Cleaning solvent - xylene Cleaning solvent
151, 153 Cleaning solvent -
trichloroethane Cleaning solvent
149 Plasticisers (phthalates) Vacuum seal damage
14 amu spaced peaks Hydrocarbons Saturated trap pellets,
fingerprints, pump fluid

Page 28 of 29
Drugs and exogenous compounds:
Abnormal peaks may be present due to factors unrelated to metabolic disease.
These are usually due to contamination of the urine with exogenous substances
or metabolites of specific dietary components/drugs. Care must be taken with
interpretation as certain metabolic conditions could wrongly be attributed to
presence of such compounds and similarly a diagnosis could be wrongly assigned
to an unaffected patient (9).
Care should be taken if drug metabolites are to be reported; organic acid
methods are not set up to specifically measure these compounds and it is not
clear how such metabolites relate to plasma concentrations. There may be
certain circumstances, however, where reporting of such metabolites maybe
useful (e.g. paracetamol/antibiotic metabolites in patients with significant
pyroglutamic aciduria (aka 5-oxoprolinuria); presence of paracetamol metabolites
in a patient with acute liver failure where a paracetamol overdose has not been
excluded.
Unknown compounds:
It is not uncommon to detect ‘unknown’ peaks in a urine organic acids
chromatogram. Any compound containing one TMS group will show a significant
ion at mass 73, if more than one TMS group mass 73 and 147 will be present. It
is important to check all relevant/available libraries (e.g. in-house, NIST etc) and
to look for the presence of key ions. Be aware that different nomenclature maybe
used for the same compound in different libraries. If no match for a compound
can be found it is often useful to make a note of key ions and retention times for
future reference (as new biomarkers or drug peaks may later become apparent).
If spectral matches are < 90%, subtracting the baseline spectra may improve the
spectral match factor. When the spectral match is below 50%, baseline subtract
is unlikely to help.
Linearity:
If specific analytes are being reported quantitatively it is important to determine
the linearity. Whilst this is true for any analytical method, capillary GC columns
are particularly prone to overloading and without diluting the sample
appropriately, quantitative results on compounds such as methylmalonic acid, will
not just be inaccurate but can be misleading (potentially by orders of magnitude).

Page 29 of 29
References
(1) Blau N, Duran M, Gibson K editors. Laboratory Guide to the Methods in
Biochemical Genetics, Heidelberg: Springer-Verlag; 2008.
(2) Remer T, Montenegro-Bethancourt G, Shi L.
Long-term urine biobanking: storage stability of clinical chemical parameters
under moderate freezing conditions without use of preservatives. Clin Biochem
2014;47(18):307-311.
(3) Witek K, Turner C, Carling R. Orotic Acid: Lost without trace. British Inherited
Metabolic Disease Annual Symposium: Trainees Meeting 2017.
(4) Peters V, Garbade S, Langhans C, Hoffmann G, Pollitt R, Downing M, et al.
Qualitative urinary organic acid analysis: Methodological approaches and
performance. . J Inherit Metab Dis 2008;31:690-696.
(5) Witek K, Carling R. Personal Communication. 2018.
(6) Tanaka K, Hine D, West-Dull A, Nad Lynn T. Gas Chromatographic method of
analysis for urinary organic acids. Retention indices of 155 metabolically
important compounds. Clin Chem 1980;26:1839-1846.
(7) Phenomonex. GC Troubleshooting Guide. 2014; Available at:
https://www.phenomenex.com/ViewDocument?id=gc+troubleshooting+guide
Accessed 12th September, 2018.
(8) Saudubray J, Baumgartner M, Walter J editors. Inborn Metabolic Diseases,
Diagnosis and Treatment. 6th ed.: Springer; 2016.
(9) Kumps A, Duez P, Mardens Y. Metabolic, nutritional, iatrogenic and artifactual
sources of urinary organic acids: a comprehensive table. . Clin Chem
2002;48(5):708-717.
(10) Rinaldo P. Organic Acids. In: Blau N, Duran M, Gibson K, editors. Laboratory
Guide to the Methods in Biochemical Genetics. : Springer; 2008. p. 137-169.
(11) Meeting the Traceability requirements of ISO17025: An Analyst’s guide. 2nd
Edition, November 2003, LGC Ltd
(12) Roux-Petronelli C, Weykamp C. ERNDIM - Quantitative Schemes Quantitative
Organic Acids Annual Report. 2018; Annual Report ERNDIM-EQAS 2017.


