Download - Merrill Lynch conference 2010

Your partner in Insurance
Competing in the Age of AusterityBart De Smet,CEO AgeasBoA Merrill LynchBanking & Insurance Conference28-30 September 2010
29 September 2010 | 1BOA Merrill Lynch CEO Conference - London
Balanced insurance portfolio Life vs Non-Life Europe vs Asia Mature vs emerging markets
Strong market positions Market leader in Belgium Strong distribution partnerships in
Europe & Asia
Solid & de-risked balance sheet Southern European sovereign debt
significantly down Strong & high quality capital base
General Account managed for value Incl management oustanding liabilities
Ageas, a company benefiting from strong fundamentals
29 September 2010 | 2BOA Merrill Lynch CEO Conference - London
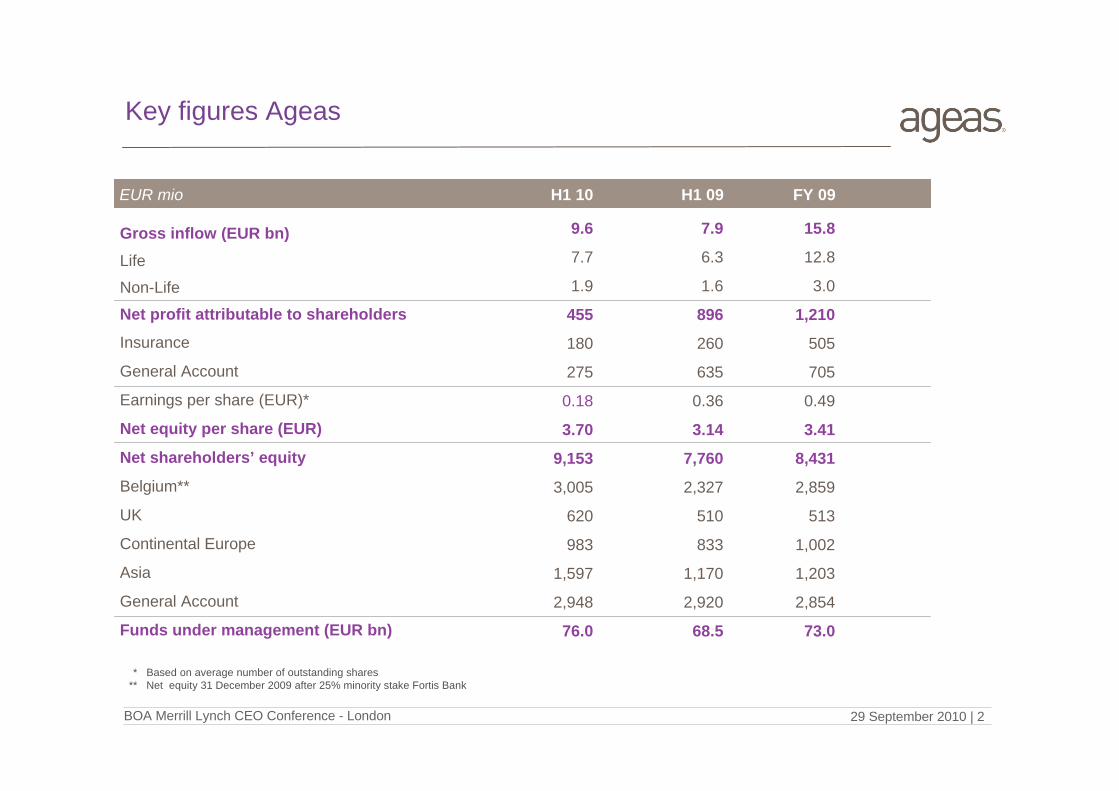
Key figures Ageas
H1 10 H1 09 FY 09
Gross inflow (EUR bn)Life
Non-Life
Net profit attributable to shareholders
Insurance
General Account
Earnings per share (EUR)*
Net equity per share (EUR)
Net shareholders’ equity
Belgium**
UK
Continental Europe
Asia
General Account
Funds under management (EUR bn)
9.6
7.7
1.9
455
180
275
0.18
3.70
9,153
3,005
620
983
1,597
2,948
76.0
7.9
6.3
1.6
896
260
635
0.36
3.14
7,760
2,327
510
833
1,170
2,920
68.5
15.8
12.8
3.0
1,210
505
705
0.49
3.41
8,431
2,859
513
1,002
1,203
2,854
73.0
EUR mio
* Based on average number of outstanding shares** Net equity 31 December 2009 after 25% minority stake Fortis Bank
10/03/2010 I page 2
29 September 2010 | 3BOA Merrill Lynch CEO Conference - London
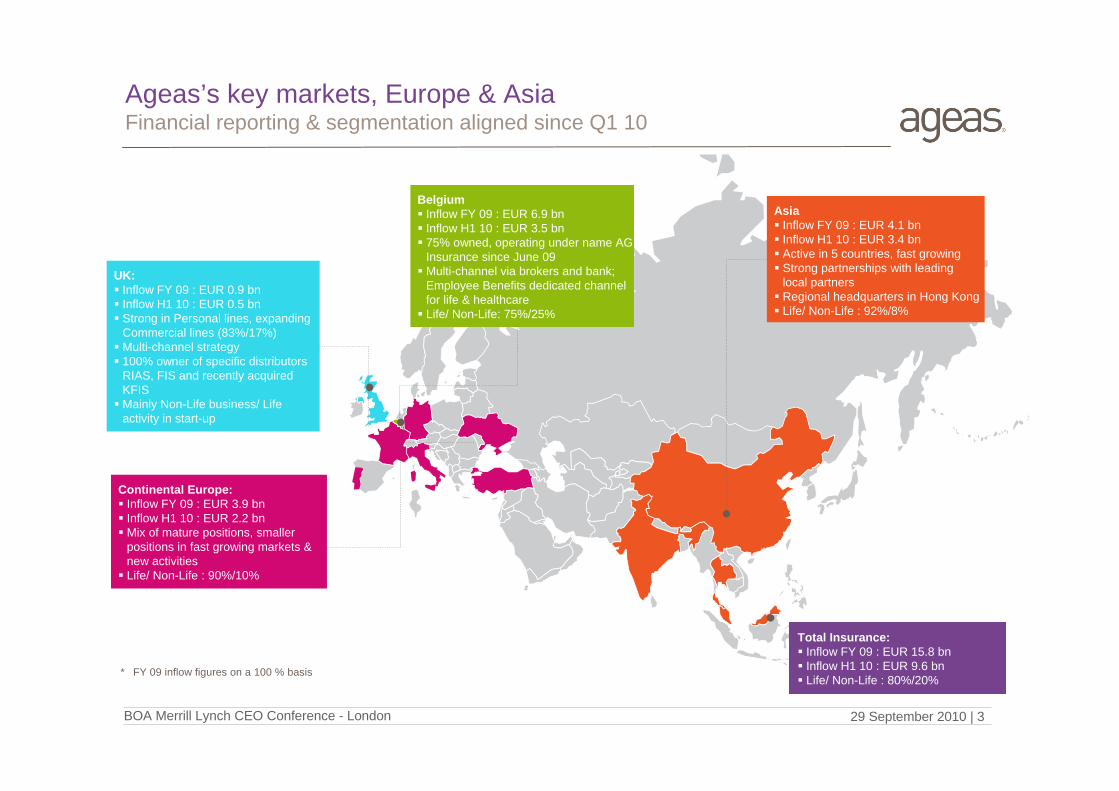
Ageas’s key markets, Europe & AsiaFinancial reporting & segmentation aligned since Q1 10
Continental Europe: Inflow FY 09 : EUR 3.9 bn Inflow H1 10 : EUR 2.2 bn Mix of mature positions, smaller
positions in fast growing markets & new activities Life/ Non-Life : 90%/10%
UK: Inflow FY 09 : EUR 0.9 bn Inflow H1 10 : EUR 0.5 bn Strong in Personal lines, expanding
Commercial lines (83%/17%) Multi-channel strategy 100% owner of specific distributors
RIAS, FIS and recently acquiredKFIS Mainly Non-Life business/ Life
activity in start-up
Asia Inflow FY 09 : EUR 4.1 bn Inflow H1 10 : EUR 3.4 bn Active in 5 countries, fast growing Strong partnerships with leading
local partners Regional headquarters in Hong Kong Life/ Non-Life : 92%/8%
Belgium Inflow FY 09 : EUR 6.9 bn Inflow H1 10 : EUR 3.5 bn 75% owned, operating under name AG
Insurance since June 09 Multi-channel via brokers and bank;
Employee Benefits dedicated channel for life & healthcare Life/ Non-Life: 75%/25%
* FY 09 inflow figures on a 100 % basis
Total Insurance: Inflow FY 09 : EUR 15.8 bn Inflow H1 10 : EUR 9.6 bn Life/ Non-Life : 80%/20%
29 September 2010 | 4BOA Merrill Lynch CEO Conference - London
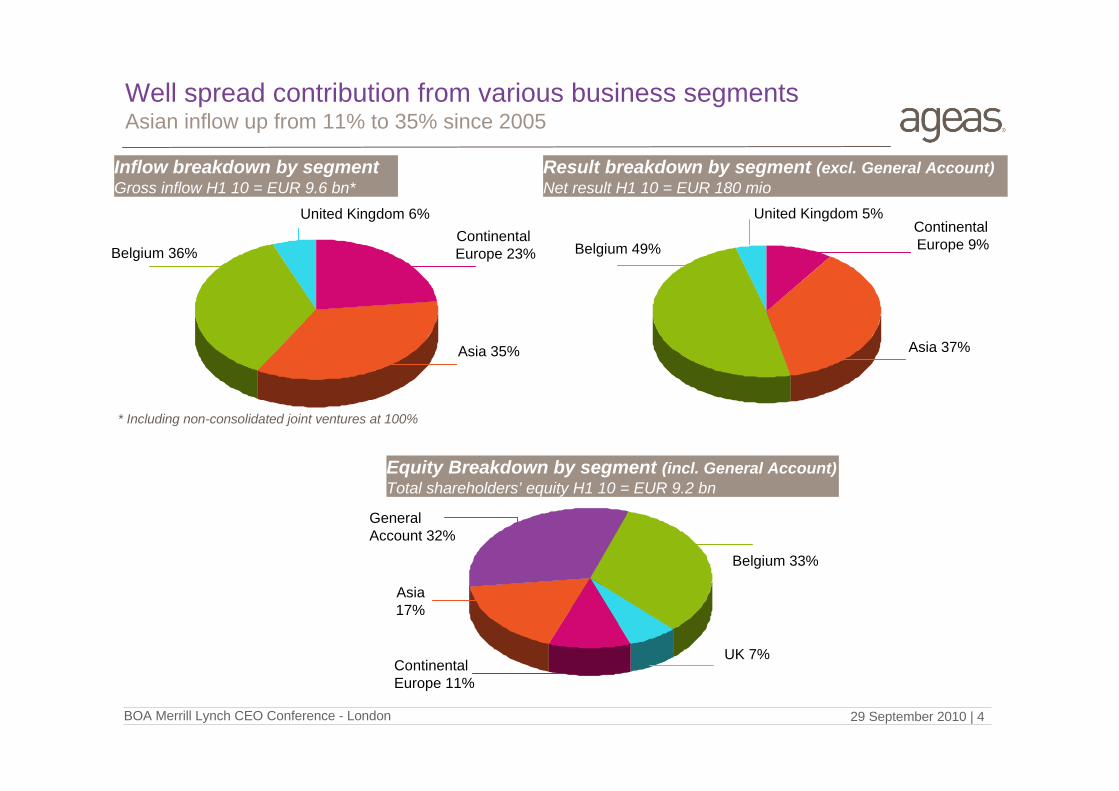
Well spread contribution from various business segmentsAsian inflow up from 11% to 35% since 2005
Inflow breakdown by segmentGross inflow H1 10 = EUR 9.6 bn*
Result breakdown by segment (excl. General Account)Net result H1 10 = EUR 180 mio
Equity Breakdown by segment (incl. General Account)Total shareholders’ equity H1 10 = EUR 9.2 bn
Asia 35%
Belgium 36%ContinentalEurope 23%
Belgium 33%
GeneralAccount 32%
ContinentalEurope 11%
Asia17%
* Including non-consolidated joint ventures at 100%
United Kingdom 6%
Asia 37%
Belgium 49%ContinentalEurope 9%
United Kingdom 5%
UK 7%
29 September 2010 | 5BOA Merrill Lynch CEO Conference - London
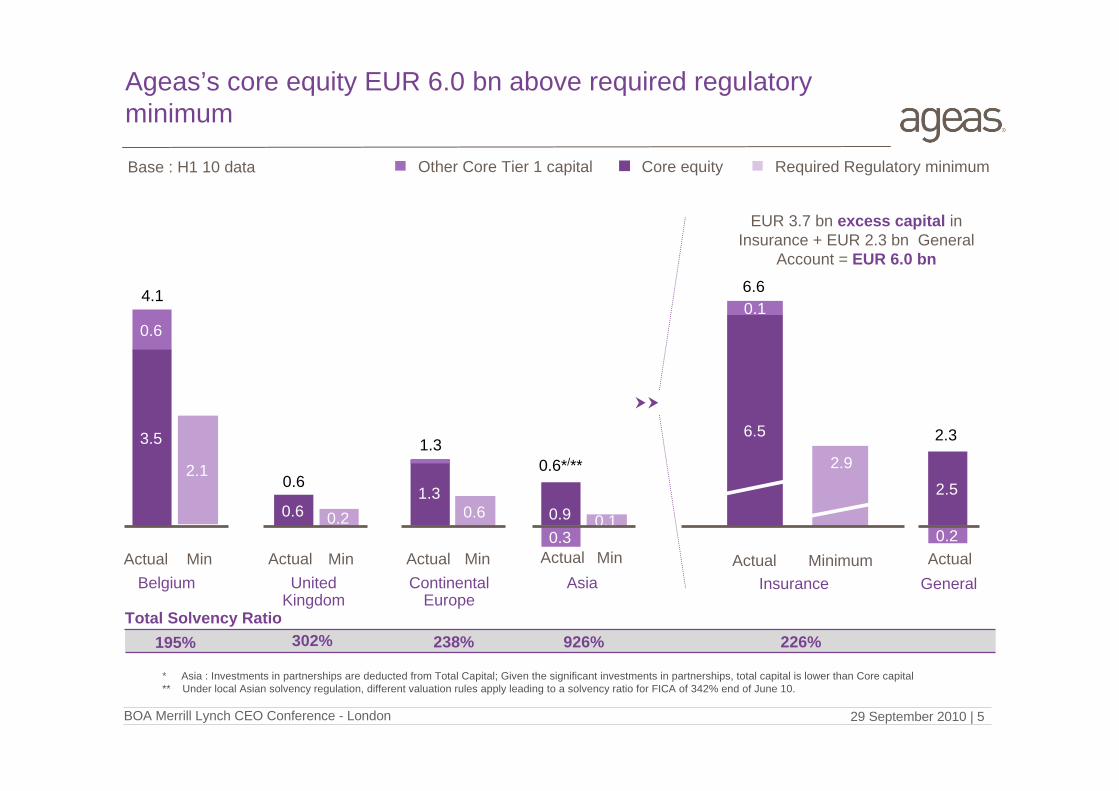
Ageas’s core equity EUR 6.0 bn above required regulatory minimum
* Asia : Investments in partnerships are deducted from Total Capital; Given the significant investments in partnerships, total capital is lower than Core capital** Under local Asian solvency regulation, different valuation rules apply leading to a solvency ratio for FICA of 342% end of June 10.
Belgium United Kingdom
Other Core Tier 1 capital
Insurance
Required Regulatory minimum
EUR 3.7 bn excess capital in Insurance + EUR 2.3 bn General
Account = EUR 6.0 bn
ActualActual Min
0.6
0.6
2.1
3.5
0.6 0.2
6.64.1
6.5
0.1
2.9
Minimum
Core equity
195% 302%Total Solvency Ratio
1.30.6
Actual Min Actual MinContinental
EuropeAsia
0.90.3
0.1
1.30.6*/**
Actual Min
238% 926%
2.5
0.2
2.3
ActualGeneral
226%
Base : H1 10 data
29 September 2010 | 6BOA Merrill Lynch CEO Conference - London
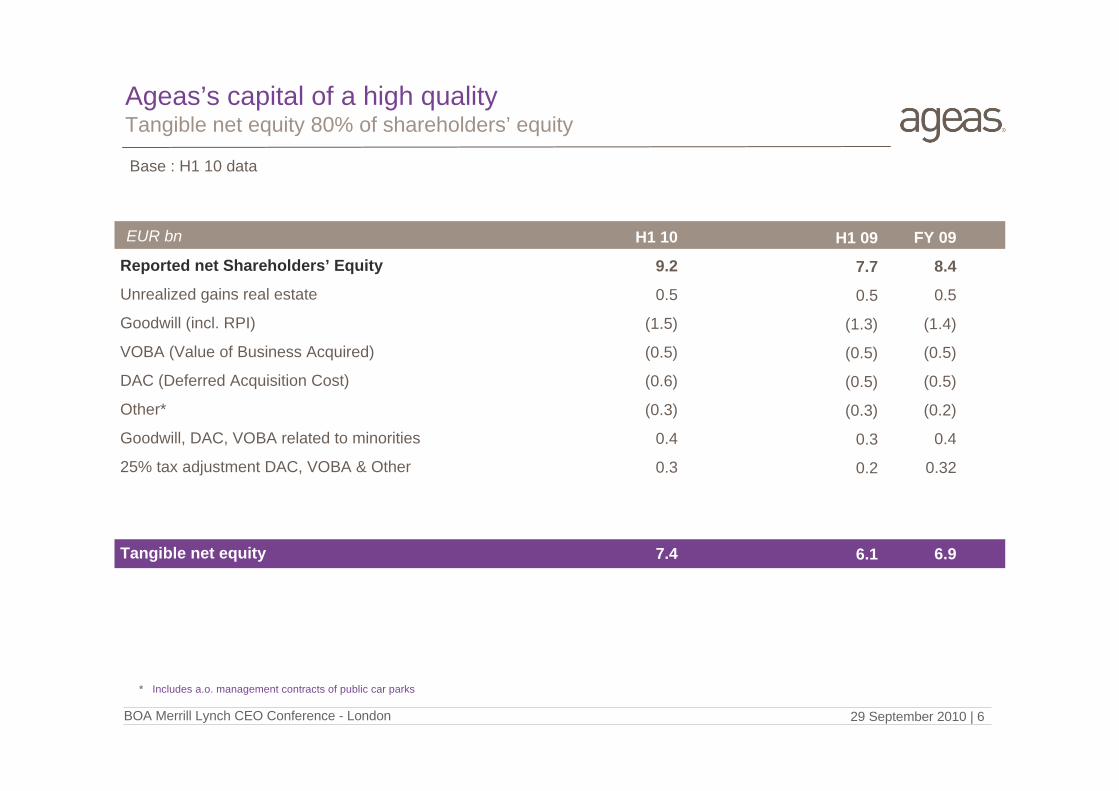
Ageas’s capital of a high qualityTangible net equity 80% of shareholders’ equity
10/03/2010 I page 6
Reported net Shareholders’ Equity
Unrealized gains real estate
Goodwill (incl. RPI)
VOBA (Value of Business Acquired)
DAC (Deferred Acquisition Cost)
Other*
Goodwill, DAC, VOBA related to minorities
25% tax adjustment DAC, VOBA & Other
Tangible net equity
EUR bn
* Includes a.o. management contracts of public car parks
H1 10
9.2
0.5
(1.5)
(0.5)
(0.6)
(0.3)
0.4
0.3
7.4
H1 09
7.7
0.5
(1.3)
(0.5)
(0.5)
(0.3)
0.3
0.2
6.1
FY 09
8.4
0.5
(1.4)
(0.5)
(0.5)
(0.2)
0.4
0.32
6.9
Base : H1 10 data
29 September 2010 | 7BOA Merrill Lynch CEO Conference - London
Operational performance
Economic outlook
Strategic positioning
Regulatory changes
Challenges for the insurance sector
29 September 2010 | 8BOA Merrill Lynch CEO Conference - London
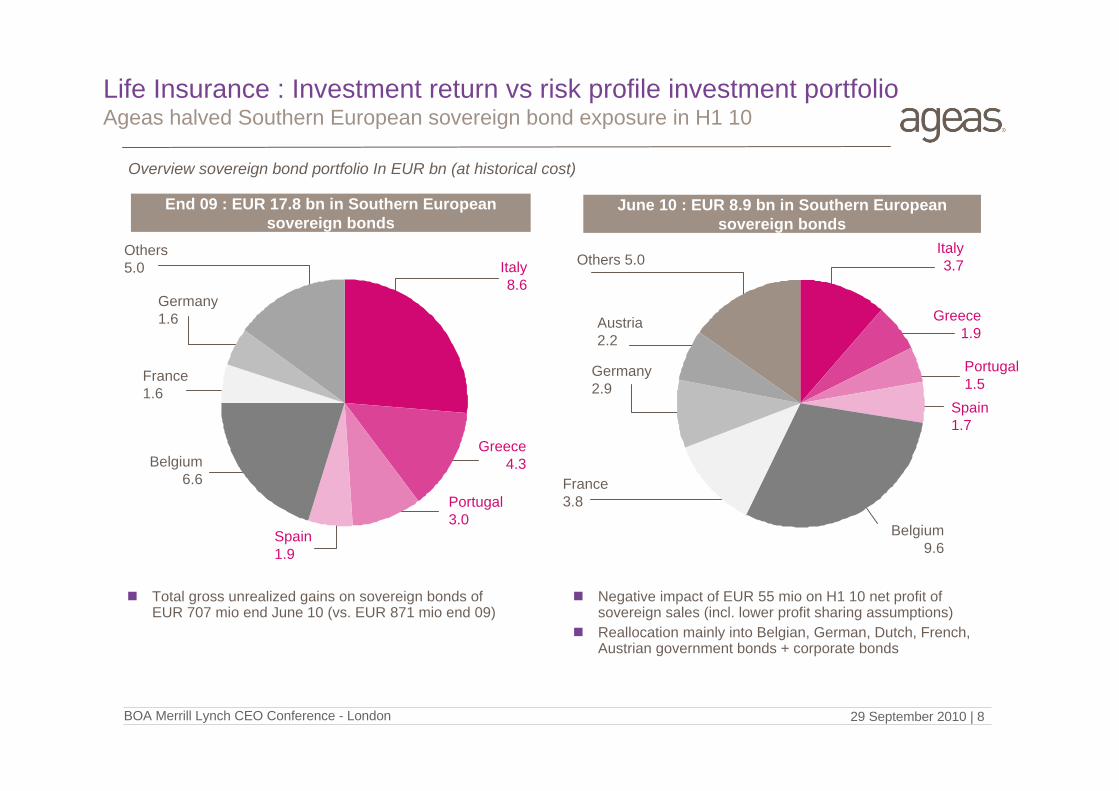
Life Insurance : Investment return vs risk profile investment portfolio Ageas halved Southern European sovereign bond exposure in H1 10
Total gross unrealized gains on sovereign bonds of EUR 707 mio end June 10 (vs. EUR 871 mio end 09)
Overview sovereign bond portfolio In EUR bn (at historical cost)
Negative impact of EUR 55 mio on H1 10 net profit of sovereign sales (incl. lower profit sharing assumptions)
Reallocation mainly into Belgian, German, Dutch, French, Austrian government bonds + corporate bonds
End 09 : EUR 17.8 bn in Southern Europeansovereign bonds
June 10 : EUR 8.9 bn in Southern Europeansovereign bonds
Spain1.9
Spain1.7
Portugal1.5
Others 5.0
Greece4.3Belgium
6.6 Portugal3.0
Italy 8.6
France1.6
Others5.0
Germany1.6
Italy 3.7
Belgium9.6
Greece1.9
France3.8
Germany2.9
Austria2.2
29 September 2010 | 9BOA Merrill Lynch CEO Conference - London
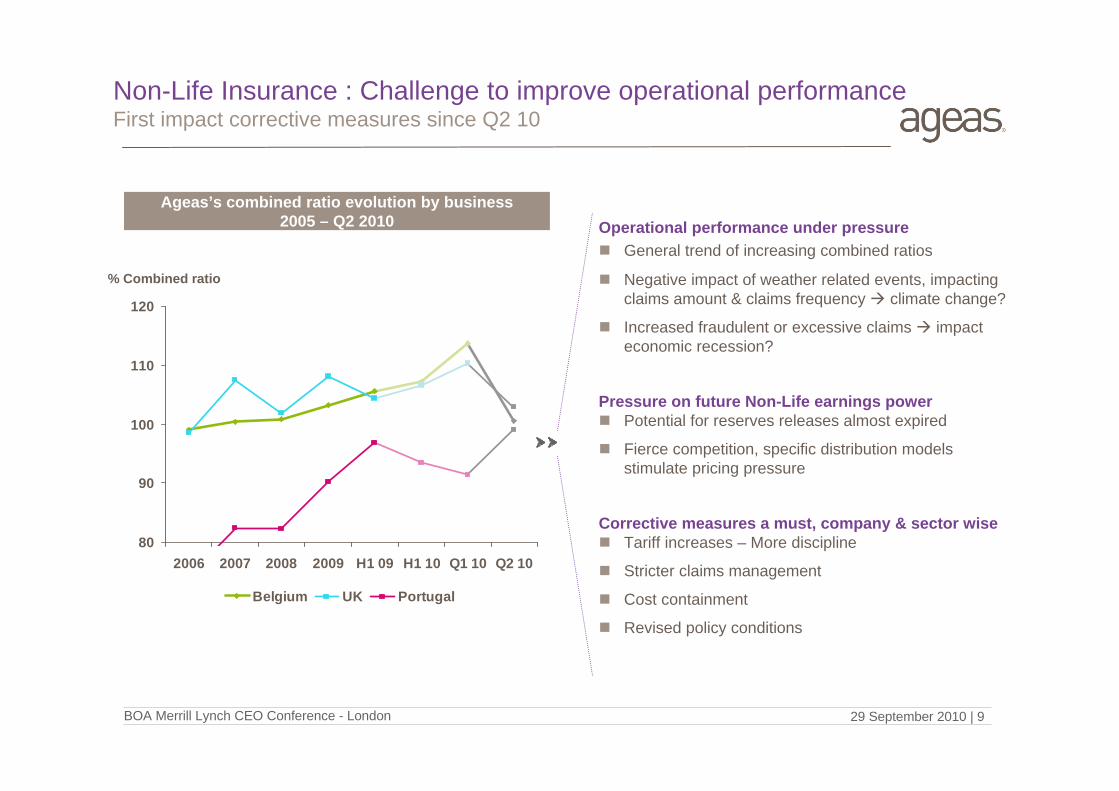
Operational performance under pressure General trend of increasing combined ratios
Negative impact of weather related events, impacting claims amount & claims frequency climate change?
Increased fraudulent or excessive claims impact economic recession?
Pressure on future Non-Life earnings power Potential for reserves releases almost expired
Fierce competition, specific distribution models stimulate pricing pressure
Corrective measures a must, company & sector wise Tariff increases – More discipline
Stricter claims management
Cost containment
Revised policy conditions
10/03/2010 I page 9
Non-Life Insurance : Challenge to improve operational performanceFirst impact corrective measures since Q2 10
Ageas’s combined ratio evolution by business 2005 – Q2 2010
80
90
100
110
120
2006 2007 2008 2009 H1 09 H1 10 Q1 10 Q2 10
Belgium UK Portugal
% Combined ratio
29 September 2010 | 10BOA Merrill Lynch CEO Conference - London
0
2
4
6
8
10
12
1/07/0
41/0
1/05
1/07/0
51/0
1/06
1/07/0
61/0
1/07
1/07/0
71/0
1/08
1/07/0
81/0
1/09
1/07/0
91/0
1/10
1/07/1
0
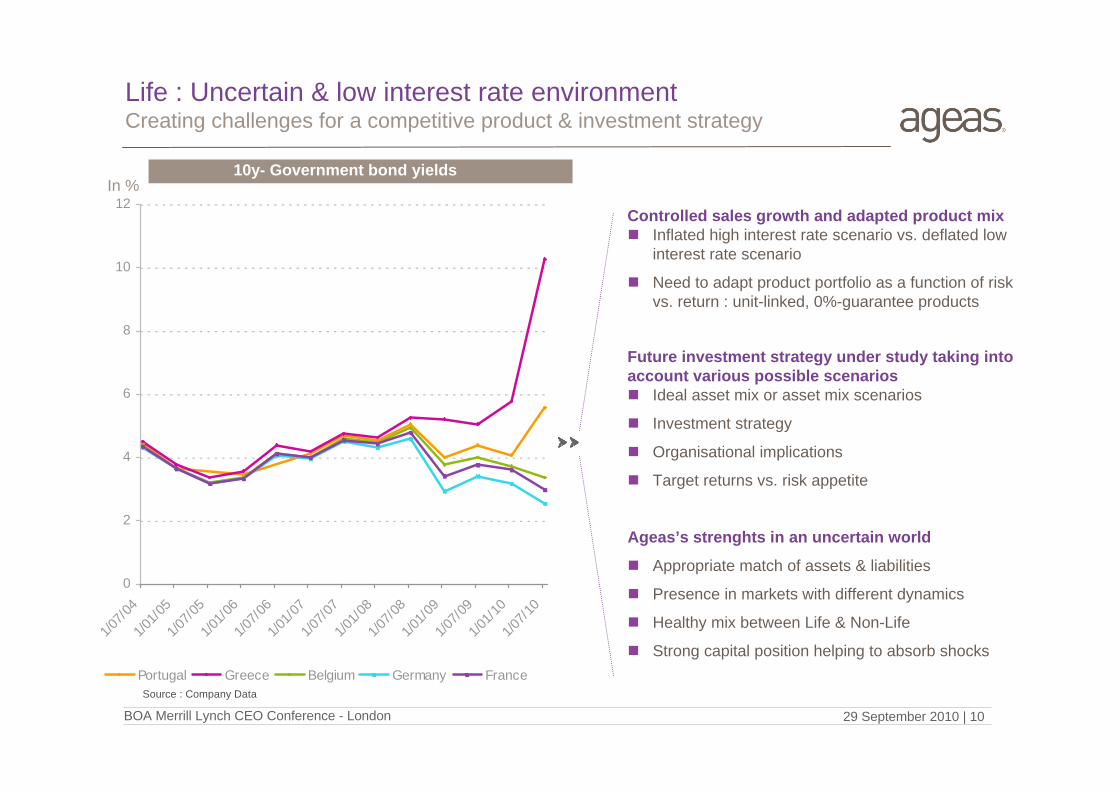
Portugal Greece Belgium Germany France
Life : Uncertain & low interest rate environment Creating challenges for a competitive product & investment strategy
Controlled sales growth and adapted product mix Inflated high interest rate scenario vs. deflated low
interest rate scenario
Need to adapt product portfolio as a function of risk vs. return : unit-linked, 0%-guarantee products
Future investment strategy under study taking into account various possible scenarios Ideal asset mix or asset mix scenarios
Investment strategy
Organisational implications
Target returns vs. risk appetite
Ageas’s strenghts in an uncertain world
Appropriate match of assets & liabilities
Presence in markets with different dynamics
Healthy mix between Life & Non-Life
Strong capital position helping to absorb shocks
10/03/2010 I page 10
In %10y- Government bond yields
Source : Company Data
29 September 2010 | 11BOA Merrill Lynch CEO Conference - London
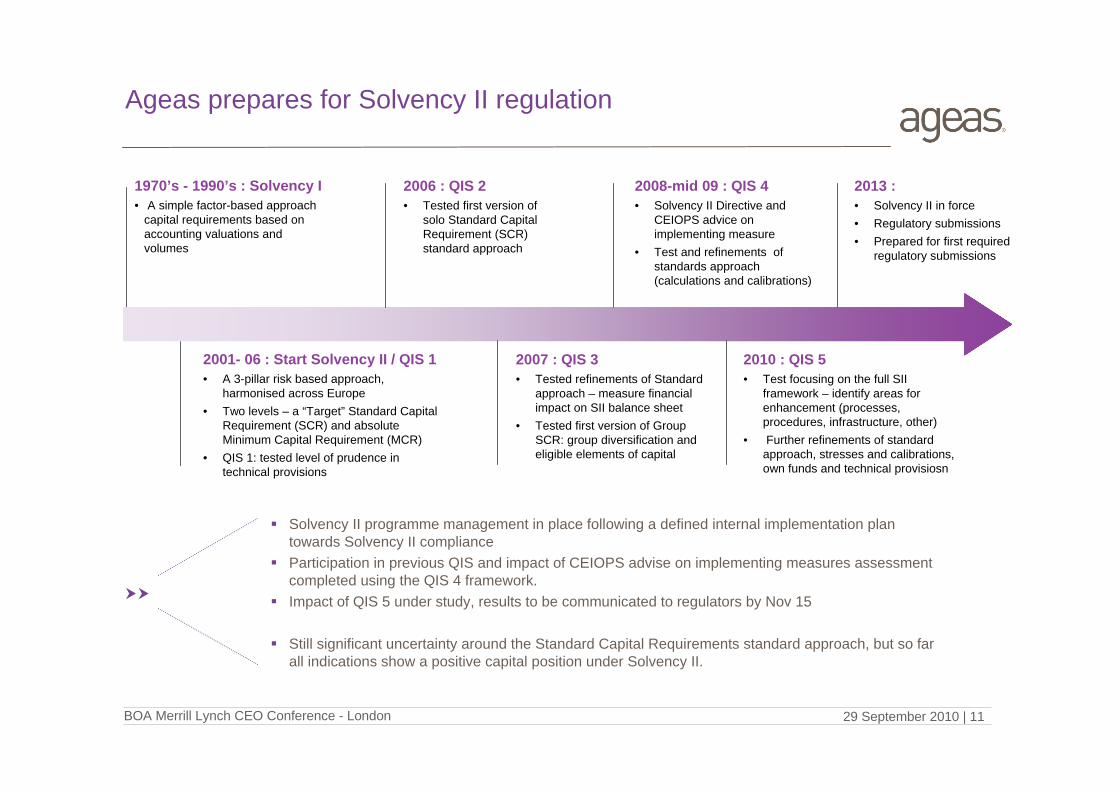
Ageas prepares for Solvency II regulation
2001- 06 : Start Solvency II / QIS 1• A 3-pillar risk based approach,
harmonised across Europe• Two levels – a “Target” Standard Capital
Requirement (SCR) and absolute Minimum Capital Requirement (MCR)
• QIS 1: tested level of prudence in technical provisions
2006 : QIS 2• Tested first version of
solo Standard Capital Requirement (SCR) standard approach
1970’s - 1990’s : Solvency I• A simple factor-based approach
capital requirements based on accounting valuations and volumes
2007 : QIS 3• Tested refinements of Standard
approach – measure financial impact on SII balance sheet
• Tested first version of Group SCR: group diversification and eligible elements of capital
2008-mid 09 : QIS 4• Solvency II Directive and
CEIOPS advice on implementing measure
• Test and refinements of standards approach (calculations and calibrations)
2010 : QIS 5• Test focusing on the full SII
framework – identify areas for enhancement (processes, procedures, infrastructure, other)
• Further refinements of standard approach, stresses and calibrations, own funds and technical provisiosn
Solvency II programme management in place following a defined internal implementation plan towards Solvency II compliance
Participation in previous QIS and impact of CEIOPS advise on implementing measures assessment completed using the QIS 4 framework.
Impact of QIS 5 under study, results to be communicated to regulators by Nov 15
Still significant uncertainty around the Standard Capital Requirements standard approach, but so far all indications show a positive capital position under Solvency II.
2013 :• Solvency II in force• Regulatory submissions• Prepared for first required
regulatory submissions
29 September 2010 | 12BOA Merrill Lynch CEO Conference - London
Significant operational challenges ahead for insurance companies
Conclusions
Future Life business model influenced by new regulation & economic outlook
Solvency II should contribute to a betterbalance between risk & return
Return to pure insurers -> Flexible partnerships & new business models
29 September 2010 | 13BOA Merrill Lynch CEO Conference - London
Cautionary Statements
Certain of the statements contained herein are statements of future expectations and other forward-looking statements that are based on management's current views and assumptions and involve known andunknown risks and uncertainties that could cause actual results,performance or events to differ materially from those expressed or implied in such statements. Future actual results, performance or events may differ materially from those in such statements due to, without limitation, (i) general economic conditions, including in particular economic conditions in Ageas’ core markets, (ii) performance of financial markets, (iii) the frequency and severity of insured loss events, (iv) mortality and morbidity levels and trends, (v) persistency levels, (vi) interest rate levels, (vii) currency exchange rates, (viii) increasing levels of competition, (ix) changes in laws and regulations, including monetary convergence and the Economic and Monetary Union, (x) changes in the policies of central banks and/or foreign governments and (xi) general competitive factors, in each case on a global, regional and/or national basis.
In addition, the financial information contained in this presentation, including the pro forma information contained herein, is unaudited and is provided for illustrative purposes only. It does not purport to be indicative of what the actual results of operations or financial condition of Ageas and its subsidiaries would have been had these events occurred or transactions been consummated on or as of the dates indicated, nor does it purport to be indicative of the results of operations or financial condition that may be achieved in the future.

29 September 2010 | 14BOA Merrill Lynch CEO Conference - London
Investor Relations
Tel:
E-mail:
Website:
+ 32 2 557 57 34+ 31 30 2525 305
www.ageas.com


