
VALUE FOCUSLaboratory Services Industry
www.mercercapital.com
Executive Summary Inside
The Laboratory Services industry has experi-
enced favorable performance over the last five
years as the industry’s revenue increased at an
average annual rate of 2.3% between 2010 and
2015, reaching an estimated $17.1 billion in 2015.
As defined by IBIS World, the laboratory ser-
vices industry comprises the following segments:
Product Performance & Safety Testing (42.6%),
Product Certification (27.2%), Environmental
Testing (14.9%), Agriculture & Food Testing
(7.0%), Biological and Chemical Testing (6.3%),
Other (2.0%). In addition to these segments, we
will focus on medical testing laboratories.
The industry’s performance is sensitive to changes
in the general economic environment both inside
the U.S. and internationally. General economic
conditions may impact demand for products and
services which, in turn, trigger demand for labo-
ratory services. Most recently, the industry has
been the beneficiary of increasing environmental,
industrial, and medical regulatory standards pro-
moting demand for lab services. In addition to
expanding regulatory regimes, influential growth
factors include the aging population, industry
consolidation, pharmacogenomics/companion
diagnostics, cost pressures, and regulation.
Year-End 2015
Benchmarking Data
for Testing Laboratories 1
Industry Specific
Macroeconomic Overview 3
M&A Transactions 5
Guideline Company Pricing 9
Valuation Trends 10
Macroeconomic Overview 12
About Mercer Capital 15

Mercer Capital’s Value Focus: Laboratory Services Industry Year-End 2015
© 2016 Mercer Capital 1 www.mercercapital.com
Benchmarking Data for Testing Laboratories
Benchmarking to peer performance is a
valuable tool for business managers. In our
valuation practice, we routinely examine peer
data published by Risk Management Asso-
ciation (“RMA”). In this issue, we present a
summary of the data presented by RMA for
testing laboratories. The 2015-2016 Annual
Statement Studies published by RMA com-
piles average percentage income statements
and balance sheets and key financial ratios
of Testing Laboratories classified under
the North American Industry Classification
System (“NAICS”) #54138. We compared
three sales categories within this industry:
$5-10 million (48 companies), $10-25 million
(25 companies), and $25 million and over (55
companies). The percentage balance sheet,
percentage income statement, and selected
financial ratios are summarized in the table
to the right.
From a balance sheet perspective, the smaller
companies carry larger debt balances (23%
of total assets) than their larger peers (12%
of total assets). The smaller firms tend to be
more efficient with regard to asset utilization,
generating sales of $11.50 per dollar of fixed
assets, compared to just $6.50 for the larger
companies. On a pre-tax basis, return on
equity for the industry composites range from
20% to 30%, suggesting that tradenames,
customer relationships and other intangible
assets are important components of the
value of such labs.
Peer Performance
Percentage Balance Sheets
Sales $5-10M
Sales $10-25M
Sales $25M+
Total Current Assets 53.7% 54.6% 55.8%
Net Fixed Assets 31.3% 30.7% 27.4%
Other Assets 15.10% 14.70% 16.80%
Total Assets 100.0% 100.0% 100.0%
Total Current Liabilities 27.6% 24.0% 32.0%
Long-Term Debt 23.2% 12.2% 11.9%
Other Liabilities 5.3% 3.9% 5.1%
Total Liabilities 56.1% 40.1% 49.0%
Total Equity 43.9% 59.9% 51.0%
Total Liabilities & Equity 100.0% 100.0% 100.0%
Percentage Income Statements
Sales $5-10M
Sales $10-25M
Sales $25M+
Operating Income 10.3% 8.6% 9.6%
Other Income/(Expense) -1.5% 0.1% -1.5%
Pre-Tax Income 8.8% 8.7% 8.1%
+ Depreciation & Amortization 1.5% 1.5% 1.2%
EBITDA 10.3% 10.2% 9.3%
Ratio Analysis
Sales $5-10M
Sales $10-25M
Sales $25M+
Sales/Receivables 7.4 6.8 5.5
Sales/Working Capital 9.9 6.7 7.3
Sales/Net Fixed Assets 11.5 6.3 6.5
Pre-tax Return on Equity 20.5% 28.2% 29.6%
Source: 2015-2016 RMA Annual Statement Studies

Mercer Capital’s Value Focus: Laboratory Services Industry Year-End 2015
© 2016 Mercer Capital 2 www.mercercapital.com
The chart at right summarizes EBITDA margin
by year for the middle size cohort. Over the
period analyzed, margins have fluctuated
between 8.2% and 11.7%.
The peer group data from RMA can help lab
managers benchmark their operations against
a diverse group of other labs and help identify
opportunities for improvement.
EBITDA Margins
Benchmarking Data for Testing Laboratories (continued)
0%
2%
4%
6%
8%
10%
12%
14%
2011-2012 2012-2013 2013-2014 2014-2015 2015-2016
EBIT
DA
Mar
gin
RMA Publication Year Note - NAICS 541380 (Sales of $10-25 million) Source: 2015-2016 RMA Annual Statement Studies
Mercer Capital’s Value Focus: Laboratory Services Industry Year-End 2015
© 2016 Mercer Capital 3 www.mercercapital.com
Industry Specific Macroeconomic Overview
2 U.S. Census Bureau
same as those used in the Middle series. The three alternative series are useful for analyzing potential outcomes of different levels of net international migration.
According to the Middle series pro-jections, between 2012 and 2050,
the U.S. population is projected to grow from 314 million in 2012 to 400 million in 2050, an increase of 27 percent. The nation will also become more racially and ethni-cally diverse, with the aggregate minority population projected to
become the majority in 2043.6 The population is also expected to become much older. By 2030, more
6 In this report, the term minority popula-tion refers to everyone other than the non-Hispanic White alone population. The Census Bureau recognizes that there are many dimensions of ethnicity not captured in this distinction.
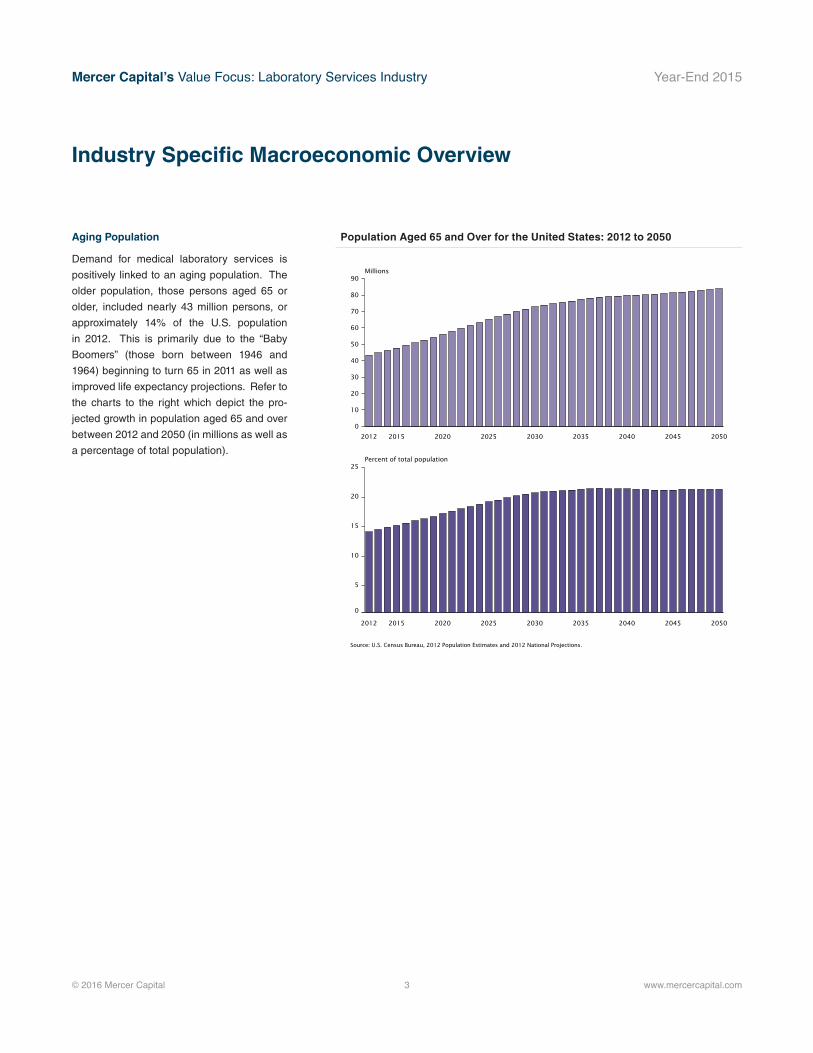
Figure 1.Population Aged 65 and Over for the United States: 2012 to 2050
0
10
20
30
40
50
60
70
80
90
205020452040203520302025202020152012
0
5
10
15
20
25
205020452040203520302025202020152012
Source: U.S. Census Bureau, 2012 Population Estimates and 2012 National Projections.
Millions
Percent of total population
Keyboxtext
Aging Population
Demand for medical laboratory services is
positively linked to an aging population. The
older population, those persons aged 65 or
older, included nearly 43 million persons, or
approximately 14% of the U.S. population
in 2012. This is primarily due to the “Baby
Boomers” (those born between 1946 and
1964) beginning to turn 65 in 2011 as well as
improved life expectancy projections. Refer to
the charts to the right which depict the pro-
jected growth in population aged 65 and over
between 2012 and 2050 (in millions as well as
a percentage of total population).
Population Aged 65 and Over for the United States: 2012 to 2050
Mercer Capital’s Value Focus: Laboratory Services Industry Year-End 2015
© 2016 Mercer Capital 4 www.mercercapital.com
Industry Specific Macroeconomic Overview (continued)
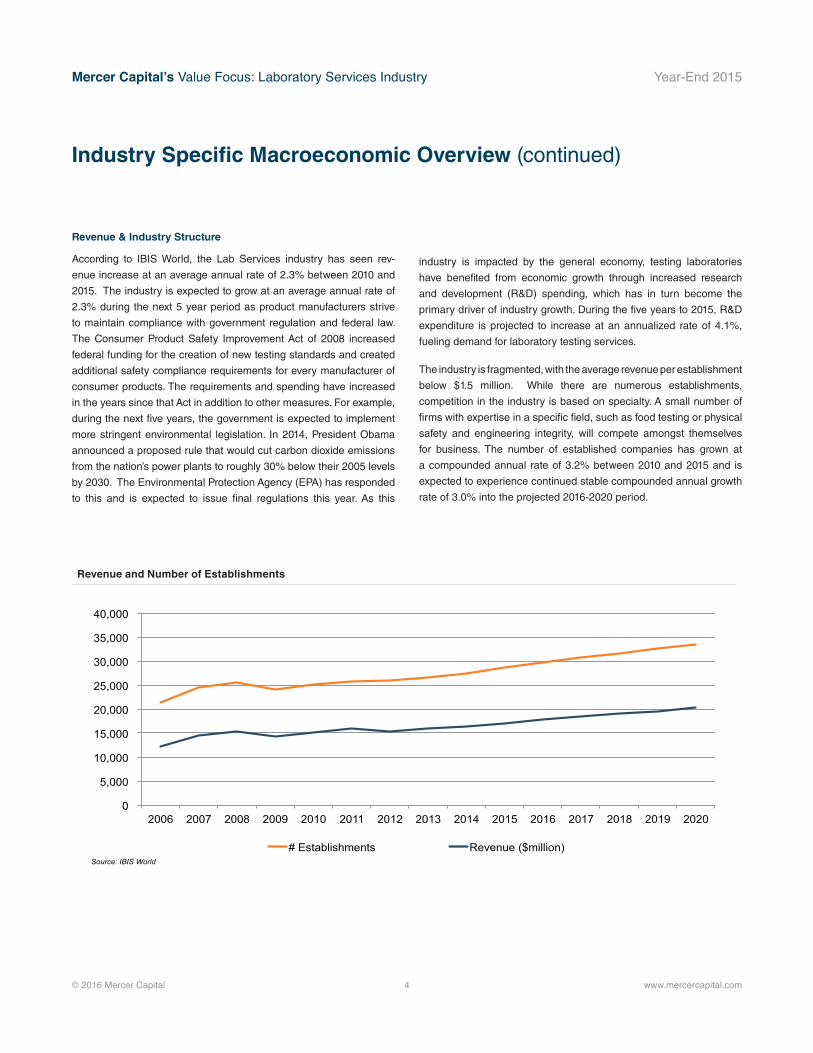
0
5,000
10,000
15,000
20,000
25,000
30,000
35,000
40,000
2006 2007 2008 2009 2010 2011 2012 2013 2014 2015 2016 2017 2018 2019 2020
# Establishments Revenue ($million) Source: IBIS World
Revenue & Industry Structure
According to IBIS World, the Lab Services industry has seen rev-
enue increase at an average annual rate of 2.3% between 2010 and
2015. The industry is expected to grow at an average annual rate of
2.3% during the next 5 year period as product manufacturers strive
to maintain compliance with government regulation and federal law.
The Consumer Product Safety Improvement Act of 2008 increased
federal funding for the creation of new testing standards and created
additional safety compliance requirements for every manufacturer of
consumer products. The requirements and spending have increased
in the years since that Act in addition to other measures. For example,
during the next five years, the government is expected to implement
more stringent environmental legislation. In 2014, President Obama
announced a proposed rule that would cut carbon dioxide emissions
from the nation’s power plants to roughly 30% below their 2005 levels
by 2030. The Environmental Protection Agency (EPA) has responded
to this and is expected to issue final regulations this year. As this
Revenue and Number of Establishments
industry is impacted by the general economy, testing laboratories
have benefited from economic growth through increased research
and development (R&D) spending, which has in turn become the
primary driver of industry growth. During the five years to 2015, R&D
expenditure is projected to increase at an annualized rate of 4.1%,
fueling demand for laboratory testing services.
The industry is fragmented, with the average revenue per establishment
below $1.5 million. While there are numerous establishments,
competition in the industry is based on specialty. A small number of
firms with expertise in a specific field, such as food testing or physical
safety and engineering integrity, will compete amongst themselves
for business. The number of established companies has grown at
a compounded annual rate of 3.2% between 2010 and 2015 and is
expected to experience continued stable compounded annual growth
rate of 3.0% into the projected 2016-2020 period.

Mercer Capital’s Value Focus: Laboratory Services Industry Year-End 2015
© 2016 Mercer Capital // Source: Capital IQ 5 www.mercercapital.com
M&A Transactions
Announced Date Target / Issuer
Trans. Types
Trans. Status
Total Trans. Value
($USD mm)
Total Rev. [LTM]
($USDmm) [Target /
Issuer]Buyers / Investors
Geographic Locations [Target/Issuer]
Geographic Region [Buyer/Investor] Business Description [Target/Issuer]
07/02/2015 Emerging Fuels Technology, Inc.
Private Placement
Closed 0.556 - - United States and Canada
- Emerging Fuels Technology, Inc. provides catalyst development research services and related synthesis gas and hydroprocessing chemistry. It offers catalyst development and testing, analytical, hydroprocessing/hydrotreating and sample handling, engineering, and consulting services. The Company was founded in 2008 and is based in Tulsa, Oklahoma.
07/07/2015 Spectrum Analytical, Inc.
Merger/ Acquisition
Closed 5.0 - Eurofins Scientific, Inc.
United States and Canada
United States and Canada
Spectrum Analytical, Inc., an environmental testing laboratory, engages in the performance of organic, inorganic, wet chemistry, and microbi-ological testing in various matrices. The company serves consulting companies, industries, municipalities, universities, and the public sector. Spectrum Analytical, Inc. was founded in 1990 and is based in Agawam, Massachusetts.
07/23/2015 Signal Bay, Inc. (OTCPK:SGBY)
Private Placement
Announced 0.075 0.125 St. George Investments, LLC
United States and Canada
United States and Canada
Signal Bay, Inc., together with its subsidiaries, provides advisory, management, and analytical testing services to the legalized cannabis industry in the United States. The company is headquartered in Las Vegas, Nevada.
07/31/2015 Signal Bay, Inc. (OTCPK:SGBY)
Private Placement
Closed 1.0 0.125 Kodiak Capital Group LLC
United States and Canada
United States and Canada
Signal Bay, Inc., together with its subsidiaries, provides advisory, management, and analytical testing services to the legalized cannabis industry in the United States. The company is headquartered in Las Vegas, Nevada.
08/11/2015 Qualtest, Inc. Merger/ Acquisition
Closed - 4.8 National Technical Systems Inc.
United States and Canada
United States and Canada
Qualtest, Inc. provides testing laboratory services to aerospace, defense, military, medical, and other commercial industries. The company was founded in 1986 and is based in Orlando, Florida. As of August 11, 2015, Qualtest, Inc. operates as a subsidiary of National Technical Systems Inc.
08/17/2015 THELEN ASSOCIATES, INC.
Merger/ Acquisition
Closed - 16.5 Geotechnology, Inc.
United States and Canada
United States and Canada
THELEN ASSOCIATES, INC. provides geotechnical-testing engineering and construction materials testing services. The company was founded in 1971 and is based in Erlanger, Kentucky, with locations in St. Louis, Missouri; Erlanger and Lexington, Kentucky; Memphis, Tennessee; Overland Park, Kansas; Fairview Heights, Illinois; Cincinnati and Dayton, Ohio; Oxford, Mississippi; and Jonesboro, Arkansas. As of August 17, 2015, THELEN ASSOCIATES, INC. operates as a subsidiary of Geotechnology, Inc.
09/21/2015 CR Labs, Inc. Merger/ Acquisition
Closed 0.439 0.098 Signal Bay, Inc. (OTCPK:SGBY)
United States and Canada
United States and Canada
CR Labs, Inc., a marijuana testing laboratory, provides marijuana compliance testing services to the cannabis industry. The company was founded in 2014 and is based in Bend, Oregon. As of September 18, 2015, CR Labs, Inc. operates as a subsidiary of Signal Bay, Inc.

Mercer Capital’s Value Focus: Laboratory Services Industry Year-End 2015
© 2016 Mercer Capital // Source: Capital IQ 6 www.mercercapital.com
M&A Transactions (continued)
Announced Date Target / Issuer
Trans. Types
Trans. Status
Total Trans. Value
($USD mm)
Total Rev. [LTM]
($USDmm) [Target /
Issuer]Buyers / Investors
Geographic Locations [Target/Issuer]
Geographic Region [Buyer/Investor] Business Description [Target/Issuer]
09/28/2015 Apex Geoscience Inc.
Merger/ Acquisition
Closed - 30.1 Braun Intertec Corporation
United States and Canada
United States and Canada
Apex Geoscience Inc. provides testing laboratory, and geotechnical and environmental consulting services in the United States. The Company was founded in 1995 and is based in Tyler, Texas with additional offices in the Amarillo, Dallas-Fort Worth Metroplex, the Houston area, Longview, Lufkin, Oklahoma City, Paris, Texarkana, Tyler, and Wichita Falls, Texas. As of September 25, 2015, Apex Geoscience Inc. operates as a subsid-iary of Braun Intertec Corporation.
11/13/2015 ATC Group Services, Inc.
Merger/ Acquisition
Closed 63.41 - Bernhard Capital Partners Manage-ment LP
United States and Canada
United States and Canada
ATC Group Services, Inc. operates as an environmental consulting, engineering, and testing company. It serves clients in petroleum, real estate, retail, manufacturing, financial services, insurance, construc-tion, telecommunication, education government, and hospitality industries in the United States and internationally. The company was founded in 1982 and is based in Lafayette, Louisiana with additional offices in the United States. ATC Group Services, Inc. is a former subsidiary of Cardno USA, Inc.
11/16/2015 Lawrence Ripak Co., Inc. and Ripak Aerospace Processing LLC
Merger/ Acquisition
Closed 23.7 - Magellan Aero-space Processing Long Island Inc.
United States and Canada
United States and Canada
Lawrence Ripak Co., Inc. and Ripak Aerospace Processing LLC represents the combined operations of Lawrence Ripak Co., Inc. and Ripak Aerospace Processing LLC in their sale to Magellan Aerospace Processing Long Island Inc. As of November 16, 2015, Lawrence Ripak Co., Inc. and Ripak Aerospace Processing LLC were acquired by Magellan Aerospace Processing Long Island Inc. Lawrence Ripak Co., Inc. and Ripak Aerospace Processing LLC provide nondestructive testing and metal finishing services. The companies are based in West Babylon, New York.
12/02/2015 Emerging Fuels Technology, Inc.
Private Placement
Closed 3.0 - - United States and Canada
- Emerging Fuels Technology, Inc. provides catalyst development research services and related synthesis gas and hydroprocessing chemistry. It offers catalyst development and testing, analytical, hydroprocessing/hydrotreating and sample handling, engineering, and consulting services. The company was founded in 2008 and is based in Tulsa, Oklahoma.
12/15/2015 Whitehouse Laboratories, Inc.
Merger/ Acquisition
Closed 56.0 - Albany Molecular Research Inc. (NasdaqGS:AMRI)
United States and Canada
United States and Canada
Whitehouse Laboratories, Inc. provides analytical laboratory testing ser-vices for materials, finished products, containers, and package systems. It serves pharmaceutical, medical device, and personal and consumer product manufacturing companies in the United States and internationally. The company was founded in 2002 and is based in Lebanon, New Jersey. As of December 15, 2015, Whitehouse Laboratories, Inc. operates as a subsidiary of Albany Molecular Research Inc.

Mercer Capital’s Value Focus: Laboratory Services Industry Year-End 2015
© 2016 Mercer Capital 7 www.mercercapital.com
As noted in the transactions tables on the previous pages, the two
largest acquisitions reported during the second half of 2015 were
Bernhard Capital Partners Management LP purchase of ATC
Group Services, Inc. ($63.4 million transaction value) and Albany
Molecular Research Inc. purchase of Whitehouse Laboratories,
Inc. ($56.0 million transaction value).
The joining of Bernhard Capital Partners Management LP with
ATC Group Services, Inc. will enhance the partnership’s experience
within the environmental services market, and the companies expect
steady forecasted growth. Financial details of the deal have not yet
been disclosed.
Albany Molecular Research Inc. (“AMRI”) acquired 100% equity
interest of Whitehouse Laboratories, Inc. (“Whitehouse”) for total
consideration of $54.0 million cash and an additional $2.0 million in
AMRI common stock shares contingent upon Whitehouse meeting
2015 targets. As Whitehouse Laboratories specializes in testing
services including chemical and material analysis, the acquisition
will augment AMRI’s discovery, development, and manufacturing
services. Historical financial results for Whitehouse are summarized
below.
Whitehouse is a highly profitable (EBITDA margins in excess of
50%) and fast-growing (25% year-over-year revenue growth in 2015)
specialty lab. If the maximum earnout payment is made, the total
purchase price represents 10.5x EBITDA for the twelve months
ended September 30, 2015. While no earnings estimates for 2016
are available, recent growth suggests that the multiple of forward
EBITDA is likely lower than the trailing multiple. This transaction is a
great example of the importance of profitability and earnings growth
to the value of a specialty lab. See the table below.
Transaction Discussion
Historical Financials for Whitehouse Laboratories, Inc.
LTM
Sept-15
Fiscal
2014
9 mos.
Sept-15
9 mos.
Sept-14
Y-o-Y
Growth
Revenue $10,013.8 $8,417.3 $7,910.3 $6,313.7 25.3%
Cost of Revenue 3,788.2 3,160.8 2,822.8 2,195.4 28.6%
Selling, General & Admin 1,040.7 909.4 763.6 632.3 20.8%
Operating Income $5,185.0 $4,347.1 $4,323.9 $3,486.0 24.0%
Depreciation & Amortization 173.0 134.8 115.5 77.3 49.4%
EBITDA $5,358.0 $4,482.0 $4,439.4 $3,563.4 24.6%
Revenue 100.0% 100.0% 100.0% 100.0%
Cost of Revenue 37.8% 37.6% 35.7% 34.8%
Selling, General & Admin 10.4% 10.8% 9.7% 10.0%
Operating Income 51.8% 51.6% 54.7% 55.2%
Depreciation & Amortization 1.7% 1.6% 1.5% 1.2%
EBITDA 53.5% 53.2% 56.1% 56.4%
Source: AMRI SEC filings
Mercer Capital’s Value Focus: Laboratory Services Industry Year-End 2015
© 2016 Mercer Capital 8 www.mercercapital.com
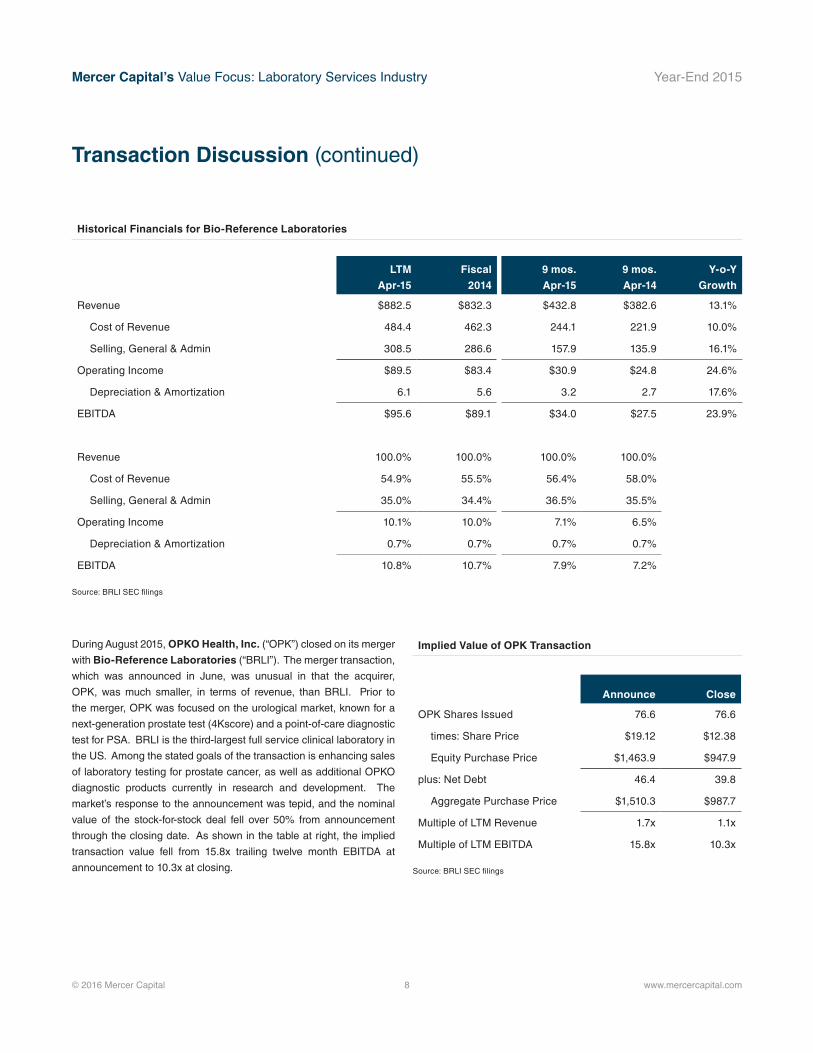
During August 2015, OPKO Health, Inc. (“OPK”) closed on its merger
with Bio-Reference Laboratories (“BRLI”). The merger transaction,
which was announced in June, was unusual in that the acquirer,
OPK, was much smaller, in terms of revenue, than BRLI. Prior to
the merger, OPK was focused on the urological market, known for a
next-generation prostate test (4Kscore) and a point-of-care diagnostic
test for PSA. BRLI is the third-largest full service clinical laboratory in
the US. Among the stated goals of the transaction is enhancing sales
of laboratory testing for prostate cancer, as well as additional OPKO
diagnostic products currently in research and development. The
market’s response to the announcement was tepid, and the nominal
value of the stock-for-stock deal fell over 50% from announcement
through the closing date. As shown in the table at right, the implied
transaction value fell from 15.8x trailing twelve month EBITDA at
announcement to 10.3x at closing.
Transaction Discussion (continued)
Announce Close
OPK Shares Issued 76.6 76.6
times: Share Price $19.12 $12.38
Equity Purchase Price $1,463.9 $947.9
plus: Net Debt 46.4 39.8
Aggregate Purchase Price $1,510.3 $987.7
Multiple of LTM Revenue 1.7x 1.1x
Multiple of LTM EBITDA 15.8x 10.3x
Source: BRLI SEC filings
Historical Financials for Bio-Reference Laboratories
Implied Value of OPK Transaction
LTM
Apr-15
Fiscal
2014
9 mos.
Apr-15
9 mos.
Apr-14
Y-o-Y
Growth
Revenue $882.5 $832.3 $432.8 $382.6 13.1%
Cost of Revenue 484.4 462.3 244.1 221.9 10.0%
Selling, General & Admin 308.5 286.6 157.9 135.9 16.1%
Operating Income $89.5 $83.4 $30.9 $24.8 24.6%
Depreciation & Amortization 6.1 5.6 3.2 2.7 17.6%
EBITDA $95.6 $89.1 $34.0 $27.5 23.9%
Revenue 100.0% 100.0% 100.0% 100.0%
Cost of Revenue 54.9% 55.5% 56.4% 58.0%
Selling, General & Admin 35.0% 34.4% 36.5% 35.5%
Operating Income 10.1% 10.0% 7.1% 6.5%
Depreciation & Amortization 0.7% 0.7% 0.7% 0.7%
EBITDA 10.8% 10.7% 7.9% 7.2%
Source: BRLI SEC filings

Mercer Capital’s Value Focus: Laboratory Services Industry Year-End 2015
© 2015 Mercer Capital // Source: Bloomberg 9 www.mercercapital.com
Selected Financial Data
$Millions, as of December 31, 2015
Company Name Ticker Exchange SalesLTM
EBITDA
LTM EBITDA Margin
Enterprise Value (EV)
EV / Sales
EV / LTM EBITDA
Medical Testing Labs
Laboratory Corp of America Holdings LH New York 8,680.1 1,460.5 16.8% 12,524.7 1.4 8.6
Clinical laboratory company serving the medical profession
Quest Diagnostics Inc DGX New York 7,493.0 1,703.0 22.7% 10,116.3 1.4 5.9
Provides diagnostic testing information services
Life Sciences Tools & Services
Waters Corp WAT New York 2,042.3 657.4 32.2% 10,964.5 5.4 16.7
Provides liquid chromatography products & services for pharm, chemicals, & environmental
Agilent Technologies Inc A New York 4,038.0 775.0 19.2% 13,880.9 3.4 17.9
Provides bio-analytical and electronic measurement solutions and services
PerkinElmer Inc PKI New York 2,262.6 356.0 15.7% 5,986.1 2.6 16.8
Provides products, services, and solutions to diagnostics, research, environmental, industrial and lab services
Thermo Fisher Scientific Inc TMO New York 16,965.4 4,024.4 23.7% 56,687.5 3.3 14.1
Provides analytical instruments, equipment, reagents and consumables, software, and services
Environmental & Facilities Services
Republic Services Inc RSG New York 9,115.0 2,608.8 28.6% 15,202.9 1.7 5.8
Provides non-hazardous solid waste collection, transfer, and recycling and disposal services
Stericycle Inc SRCL NASDAQ GS 2,985.9 615.0 20.6% 10,249.2 3.4 16.7
Provides regulated and compliance solutions to the healthcare and commercial businesses
Waste Management Inc WM New York 12,961.0 3,290.0 25.4% 23,865.8 1.8 7.3
Provides waste management environmental services
Other Labs & Related Services
Danaher Corp DHR New York 20,908.6 4,536.2 21.7% 63,790.0 3.1 14.1
Provides environmental, life sciences, & industrial technologies services to medical, industrial and commercial
Ecology and Environment Inc EEI NASDAQ GM 123.6 9.8 7.9% 43.9 0.4 4.5
Environmental consulting firm
IDEXX Laboratories Inc IDXX NASDAQ GS 1,601.9 368.9 23.0% 6,562.4 4.1 17.8
Provides diagnostic, detection, and information systems for veterinary, food, and water testing
Clean Harbors Inc CLH New York 3,275.1 461.8 14.1% 2,398.5 0.7 5.2
Provides a variety of environmental remediation and industrial waste management services
Average (of above) 7,111.7 1,605.1 20.9% 17,867.1 2.5 11.6
Median (of above) 4,038.0 775.0 21.7% 10,964.5 2.6 14.1
Guideline Company Pricing

Mercer Capital’s Value Focus: Laboratory Services Industry Year-End 2015
Historical Valuation Trends for Guideline Comparable Companies
Enterprise Value/LTM EBITDA Multiple
Company Name 12/31/15 9/30/15 6/30/15 3/31/15 12/31/14 9/30/14 6/30/14 3/31/14 12/31/13
Medical Testing Labs
Laboratory Corp of
America Holdings8.6 7.9 9.7 9.2 10.6 10.1 10.2 9.7 8.9
Quest Diagnostics Inc 5.9 5.1 7.7 8.5 10.4 9.7 9.8 9.6 8.5
Life Sciences Tools & Services
Waters Corp 16.7 15.0 16.4 16.9 17.5 15.7 17.2 18.2 16.4
Agilent Technologies Inc 17.9 12.1 13.6 12.9 13.5 11.9 12.3 12.0 12.3
PerkinElmer Inc 16.8 14.4 17.5 17.5 15.0 14.5 15.8 16.5 15.8
Thermo Fisher Scientific Inc 14.1 12.3 12.7 12.8 16.9 17.0 18.6 20.3 19.4
Environmental & Facilities Services
Republic Services Inc 5.8 5.9 5.9 6.4 8.7 8.5 8.5 8.7 8.7
Stericycle Inc 16.7 20.3 18.2 18.0 19.5 17.9 18.2 17.6 18.2
Waste Management Inc 7.3 6.2 6.0 6.9 13.7 13.0 12.2 11.9 12.7
Other Labs & Related Services
Danaher Corp 14.1 13.3 15.6 13.7 14.5 12.9 13.3 13.2 13.7
Ecology and Environment Inc 4.5 5.4 6.3 8.4 11.3 12.0 nm nm 27.0
IDEXX Laboratories Inc 17.8 20.3 17.9 22.9 22.9 18.6 21.7 20.3 18.4
Clean Harbors Inc 5.2 5.1 8.7 8.6 11.2 12.2 10.5 9.7 10.4
Average (of above) 11.6 11.0 12.0 12.5 14.3 13.4 14.0 14.0 14.6
Median (of above) 14.1 12.1 12.7 12.8 13.7 12.9 12.8 12.6 13.7
Valuation Trends
© 2016 Mercer Capital // Source: Bloomberg 10 www.mercercapital.com
We assessed the historical valuation trends of the above 13 companies by comparing each company’s enterprise value divided by LTM
EBITDA over the last two years at each quarter-end. The median multiple increased from 12.1x to 14.1x during 4Q15, primarily as a
result of multiple expansion among medical testing labs and life sciences tools & services companies. Companies focused on the life
sciences tools and services garner the highest multiple (median of 15.9x) on the strength of more robust growth expectations.

Mercer Capital’s Value Focus: Laboratory Services Industry Year-End 2015
© 2016 Mercer Capital 11 www.mercercapital.com
Valuation Trends (continued)
In addition, we created an index based on the above 13 companies and compared the performance to the S&P 500 over the last year as
well as the last three years. As previously, mentioned, the laboratory services industry is influenced by general macroeconomic conditions.
Shares of lab services and related companies trailed the broader equity markets throughout much of the second half of 2015, although the
sector’s relative performance recovered by the end of the year.
-10%
0%
10%
20%
30%
40%
50%
60%
Jan-13 Jan-14 Jan-15
% Change Index % Change S&P 500
Source: Bloomberg
Historical Market Trends
Last 3 Years
-20.0%
-10.0%
0.0%
10.0%
20.0%
Jan-15 Feb-15 Mar-15 Apr-15 May-15 Jun-15 Jul-15 Aug-15 Sep-15 Oct-15 Nov-15 Dec-15
% Change Index % Change S&P 500 Source: Bloomberg
Historical Market Trends
LTM

Mercer Capital’s Value Focus: Laboratory Services Industry Year-End 2015
© 2016 Mercer Capital 12 www.mercercapital.com
Macroeconomic Overview
$0
$2,000
$4,000
$6,000
$8,000
$10,000
$12,000
$14,000
$16,000
$18,000
$20,000
-10.0%
-8.0%
-6.0%
-4.0%
-2.0%
0.0%
2.0%
4.0%
6.0%
2008
20
09
2010
20
11
2012
20
13
2014
20
15
GD
P (in Billions)
Ann
ualiz
ed R
eal G
row
th R
ate
Quarterly Annualized Real Growth Rate Annual Real Growth Rate GDP (Current Dollars) GDP (Chained 2009 Dollars)
Source: Bureau of Economic Analysis
-6.0%
-4.0%
-2.0%
0.0%
2.0%
4.0%
6.0%
8.0%
10.0%
2008
Q1 Q2 Q3 Q4
2009
Q1 Q2 Q3 Q4
2010
Q1 Q2 Q3 Q4
2011
Q1 Q2 Q3 Q4
2012
Q1 Q2 Q3 Q4
2013
Q1 Q2 Q3 Q4
2014
Q1 Q2 Q3 Q4
2015
Q1 Q2 Q3 Q4
Annualized Quarterly Change Annual Change Source: Bureau of Labor Statistics
Gross Domestic Product
According to advance estimates released
by the Department of Commerce’s Bureau
of Economic Analysis (BEA), Real Gross
Domestic Product (GDP), the output of
goods and services produced by labor
and property located in the United States,
increased at an annualized rate of 0.7%
during the fourth quarter of 2015. The
increase was attributable to gains in per-
sonal consumption expenditures, residential
fixed investment, and federal government
spending. Private inventory investment,
exports, and nonresidential fixed investment
decreased. Imports (which are subtracted
from the national income and product
accounts used in the calculation of GDP)
increased.
Business & Manufacturing Productivity
According to the Bureau of Labor Statistics
(BLS), seasonally adjusted nonfarm busi-
ness productivity decreased at an annual
rate of 3.0% in the fourth quarter of 2015.
The decrease was a function of relatively flat
output growth combined with an increase of
3.3% in hours worked. Hourly compensation,
real hourly compensation, and unit labor costs
also experienced increases. The produc-
tivity decrease in the fourth quarter follows
increases of 3.5% and 2.1% in the second and
third quarters, respectively. Annual average
productivity increased 0.3% in the fourth
quarter of 2015 relative to the fourth quarter
of 2014.
Productivity decreased 2.7% for the business
sector (inclusive of farming activity) in the
fourth quarter of 2015. This was the result of
a 3.4% increase in hours worked and a 0.6%
increase in output. Manufacturing productivity,
generally more volatile in its quarterly mea-
Gross Domestic Product
Change in Nonfarm Business Productivity
sures, decreased 0.4% during the quarter. In the second quarter of 2015, BLS issued revised
productivity measures for all periods since 2010, reflecting revisions in source data, which resulted
in weaker productivity growth than previously thought.

Mercer Capital’s Value Focus: Laboratory Services Industry Year-End 2015
© 2016 Mercer Capital 13 www.mercercapital.com
Macroeconomic Overview (continued)
-100.0%
-50.0%
0.0%
50.0%
100.0%
150.0%
Dec
-05
Mar
-06
Jun-
06
Sep-
06
Dec
-06
Mar
-07
Jun-
07
Sep-
07
Dec
-07
Mar
-08
Jun-
08
Sep-
08
Dec
-08
Mar
-09
Jun-
09
Sep-
09
Dec
-09
Mar
-10
Jun-
10
Sep-
10
Dec
-10
Mar
-11
Jun-
11
Sep-
11
Dec
-11
Mar
-12
Jun-
12
Sep-
12
Dec
-12
Mar
-13
Jun-
13
Sep-
13
Dec
-13
Mar
-14
Jun-
14
Sep-
14
Dec
-14
Mar
-15
Jun-
15
Sep-
15
Dec
-15
Dow Jones Industrial Average S&P 500 NASDAQ Composite Source: Bloomberg L.P.
0.0%
0.5%
1.0%
1.5%
2.0%
2.5%
3.0%
3.5%
1-M
onth
1-Ye
ar
2-Ye
ar
3-Ye
ar
5-Ye
ar
7-Ye
ar
10-Y
ear
20-Y
ear
30-Y
ear
4Q15 (Current) 3Q15 (Previous) 4Q14 (Previous Year) Source: Federal Reserve Statistical Release H.15 Note: Figures shown are the average yield for the last month of the quarter.
The Financial Markets
December 2015 marked the end of a volatile
year in the financial markets. After losses in
the third quarter, four major indices exhibited
growth during the fourth quarter of 2015. Most
Treasury yields improved during the quarter,
due largely to the actions of the Federal
Reserve. The Dow Jones Industrial Average
ended the fourth quarter of 2015 up 7.0% for
the quarter, though down 2.2% during 2015.
The S&P 500 Index also increased 6.5%
during the fourth quarter and down 0.7% in
2015. The NASDAQ Composite Index rose
8.4% during the fourth, and overall, rose
5.7% during 2015.The following chart shows
the relative price performance of the Dow
Jones Industrial Average, S&P 500, and
NASDAQ Composite Indices.
Yield Curve
Driven by higher interest rates, bond yields
either rose or remained constant throughout
the fourth quarter of 2015. Bond prices
are negatively correlated with their respec-
tive yields, which can shift abruptly due to
investor reactions to major variances in
reported economic data versus market
expectations (e.g., expected inflation,
growth, monetary policy, and other Federal
Reserve actions).
Economists surveyed by The Wall Street
Journal anticipate yields to rise over the next
several years.
Equity Index Price Return
U.S. Treasury Yield Curve

Mercer Capital’s Value Focus: Laboratory Services Industry Year-End 2015
© 2016 Mercer Capital 14 www.mercercapital.com
Macroeconomic Overview (continued)
Housing Market
Home building activity has traditionally been
a primary driver of overall economic activity
because new home construction stimulates
a broad range of industrial, commercial,
and consumer spending and investment.
According to the U.S. Census Bureau, new
privately owned housing starts were at a sea-
sonally adjusted annualized rate of 1,149,000
units in December 2015, 2.5% below the
revised November rate of 1,179,000 units
but 6.4% above the December 2014 level.
The seasonally adjusted annual rate of pri-
vate housing units authorized by building
permits (considered the best indicator of
future housing starts) was 1,232,000 units
in December 2015, 3.9% below the revised
November estimate of 1,282,000 but 14.4%
above the December 2014 level.
0.2
0.3
0.4
0.5
0.6
0.7
0.8
0.9
1.0
1.1
1.2
1.3
1.4
1.5
1.6
1.7
1.8
1.9
2.0
2.1
2.2
2.3
2.4
Dec
-99
Mar
-00
Jun-
00
Sep-
00
Dec
-00
Mar
-01
Jun-
01
Sep-
01
Dec
-01
Mar
-02
Jun-
02
Sep-
02
Dec
-02
Mar
-03
Jun-
03
Sep-
03
Dec
-03
Mar
-04
Jun-
04
Sep-
04
Dec
-04
Mar
-05
Jun-
05
Sep-
05
Dec
-05
Mar
-06
Jun-
06
Sep-
06
Dec
-06
Mar
-07
Jun-
07
Sep-
07
Dec
-07
Mar
-08
Jun-
08
Sep-
08
Dec
-08
Mar
-09
Jun-
09
Sep-
09
Dec
-09
Mar
-10
Jun-
10
Sep-
10
Dec
-10
Mar
-11
Jun-
11
Sep-
11
Dec
-11
Mar
-12
Jun-
12
Sep-
12
Dec
-12
Mar
-13
Jun-
13
Sep-
13
Dec
-13
Mar
-14
Jun-
14
Sep-
14
Dec
-14
Mar
-15
Jun-
15
Sep-
15
Dec
-15
Single Family Starts Private Building Permits Single Family Building Permits
Source: U.S. Census Bureau Note: Permits at a given date are generally a leading indicator of future starts. Beginning with January 2004, building permit data reflects the change to the 20,000 place series.
Private Housing
Single Family Housing
Seasonally Adjusted Annualized Rates of New Housing Starts and Building Permits
(millions of units)
0.0%
1.0%
2.0%
3.0%
4.0%
5.0%
6.0%
7.0%
8.0%
9.0%
10.0%
11.0%
Dec
-99
Mar
-00
Jun-
00
Sep-
00
Dec
-00
Mar
-01
Jun-
01
Sep-
01
Dec
-01
Mar
-02
Jun-
02
Sep-
02
Dec
-02
Mar
-03
Jun-
03
Sep-
03
Dec
-03
Mar
-04
Jun-
04
Sep-
04
Dec
-04
Mar
-05
Jun-
05
Sep-
05
Dec
-05
Mar
-06
Jun-
06
Sep-
06
Dec
-06
Mar
-07
Jun-
07
Sep-
07
Dec
-07
Mar
-08
Jun-
08
Sep-
08
Dec
-08
Mar
-09
Jun-
09
Sep-
09
Dec
-09
Mar
-10
Jun-
10
Sep-
10
Dec
-10
Mar
-11
Jun-
11
Sep-
11
Dec
-11
Mar
-12
Jun-
12
Sep-
12
Dec
-12
Mar
-13
Jun-
13
Sep-
13
Dec
-13
Mar
-14
Jun-
14
Sep-
14
Dec
-14
Mar
-15
Jun-
15
Sep-
15
Dec
-15
Source: Bureau of Labor Statistics
Unemployment and Payroll Jobs
According to the BLS, the unemployment rate
was 5.0% in December 2015, unchanged from
October and November. Unemployment rates
increased steadily throughout 2008 and into
2009, peaking at 10% in October 2009. The
October 2009 unemployment rate represented
the highest level since 1983. Pre-reces-
sion unemployment levels were reached in
December 2014. While unemployment has con-
sistently fallen throughout the past several years,
the labor force participation rate is also lower
relative to pre-recession levels. In December
2015, the labor force participation rate stood at
62.6% (relative to mid- to high- 60s prior to the
recession). The labor force participation rate in
the third quarter was generally lower than the
rate in the second quarter of 2015. Excluding
the recent trend, the last time the labor force
participation rate was lower than its current
level was 1977. As job availability increases the
labor force could increase due to individuals
re-entering the workforce, which could lead to
periodic increases in the unemployment rate in
the foreseeable future. Economists surveyed
Civilian Unemployment Rate
by The Wall Street Journal anticipate an unemployment rate of 4.8% by mid-2016 and a further
decline to 4.7% by December 2016. The number of nonfarm payroll jobs increased by 292,000 in
December 2015. December’s gain follows increases of 307,000 and 252,000 jobs in October and
November, respectively. During 2008 and 2009, the economy lost nearly 8.7 million nonfarm payroll
jobs. Experts believe the economy is still short nearly 2.7 million jobs. Economists surveyed by The
Wall Street Journal anticipate payroll gains of approximately 191,000 jobs per month over the next
year. Population growth adds approximately 102,000 individuals to the workforce per month.
Mercer CapitalLaboratory Services Industry
Contact Us
Copyright © 2016 Mercer Capital Management, Inc. All rights reserved. It is illegal under Federal law to reproduce this publication or any portion of its contents without the publisher’s permission. Media
quotations with source attribution are encouraged. Reporters requesting additional information or editorial comment should contact Barbara Walters Price at 901.685.2120. Mercer Capital’s Industry
Focus does not constitute legal or financial consulting advice. It is offered as an information service to our clients and friends. Those interested in specific guidance for legal or accounting matters should
seek competent professional advice. Inquiries to discuss specific valuation matters are welcomed. To add your name to our mailing list to receive this complimentary publication, visit our web site at
www.mercercapital.com.
Mercer Capital has expertise providing business valuation and financial advisory services to companies in the laboratory services industry.
Mercer Capital provides business valuation and financial advisory services to laboratory
service companies throughout the nation. We provide valuation services for tax purposes,
buy-sell agreements, partner buyouts, and other corporate planning purposes. Mercer Capital
also works with owners who are considering the sale of their dealership or the acquisition of
other laboratories.
Services Provided
• Valuation of laboratory services industry companies
• Transaction advisory for acquisitions and divestitures
• Valuations for purchase accounting and impairment testing
• Fairness and solvency opinions
• Litigation support for economic damages and valuation and shareholder disputes
Contact a Mercer Capital professional to discuss your needs in confidence.
Travis W. Harms, CFA, CPA/[email protected]
Timothy R. Lee, [email protected]
Nicholas J. Heinz, [email protected]
Karolina Calhoun, CPA/[email protected]
MERCER CAPITAL
Memphis5100 Poplar Avenue, Suite 2600Memphis, Tennessee 38137901.685.2120
Dallas12201 Merit Drive, Suite 480Dallas, Texas 75251214.468.8400
Nashville102 Woodmont Blvd., Suite 231Nashville, Tennessee 37205615.345.0350
www.mercercapital.com
BUSINESS VALUATION & FINANCIAL ADVISORY SERVICES


