
Meeting the Challenges of Secondary Education in East Asian and Latin American Countries
Presentation for Kuala Lumpur Secondary Education Conference – September 19-21, 2005 (Emanuela di Gropello)

Objectives of the Study
1) Examine the key challenges in the delivery of secondary education in EAP and LAC;
2) Suggest a broad range of innovative strategies to expand and improve secondary education, with focus on:
a) Resource mobilization; and b) Efficiency of service delivery.

Outline of the Report
1. Chapter 1: Diagnostic of Secondary Education in LAC and EAP countries
2. Chapter 2: Understanding Demand-side Constraints
3. Chapter 3: Improving Governance and Management Structures
4. Chapter 4: Mobilizing Resources 5. Chapter 5: Improving the Efficiency of
Service Delivery
Diagnostic of Secondary Education in EAP and LAC countries – Chapter 1
The chapter:
1. describes the stock of and flow of the quantity and quality of education in East Asia and Latin America countries; and
2. analyzes demand and supply-side constraints and opportunities (laying the ground for further analysis in chapters 2 and 3).

Structure of Secondary Education
Secondary education varies considerably across the countries studied. These differences include:
- the age of entrance into secondary education (lower in LAC);
- the duration of compulsory schooling (longer in LAC and upper-middle income countries);
- the length of study (longer in EAP, with an average of 3.18 years in lower secondary and 3 years in upper secondary).
Secondary Enrollment in EAP and LAC
Latin American and East Asian countries have rapidly increased primary school enrollment rates to achieve near universal coverage. Average primary NER in LAC: 94%; EAP: 92%.
But secondary enrollment levels in many Latin American and East Asian countries are below typical levels given national income.

Secondary Enrollment Gap
Zimbabwe
Zambia
Yemen, Rep.
Vietnam
Venezuela, RB
Vanuatu
Uzbekistan
Uruguay
United States
Uganda
Trinidad and Tobago
Tonga
ThailandTajikistan
Switzerland
Sweden
St. Lucia
Spain
Slovenia
Sierra Leone
Saudi Arabia
Russian Federation
Philippines
Peru
Paraguay
Panama
Oman
Norway
Niger
Nicaragua
New Zealand
Netherlands
Nepal
Morocco
Mongolia
MoldovaMexico
Mali
Malaysia
Malawi
Macao, China
Luxembourg
Lesotho
Latvia
Lao PDR
Kyrgyz RepublicKorea, Rep.
Kenya
Jordan
Japan
Jamaica
ItalyIsrael
Ireland
Indonesia
India
Iceland
Hungary
Hong Kong, China
Guyana
Guatemala
Greece
Ghana
Germany
Georgia
Gambia, The
Gabon
France
Finland
Fiji
Ethiopia
Estonia
Equatorial Guinea
El SalvadorEcuador Dominican Republic
Dominica
Denmark
Costa Rica
Colombia
China
Chile
Chad
Cameroon
Cambodia
Burundi Burkina Faso
Brazil
Bolivia
Benin
Belize
Belgium
Barbados
Bangladesh
Australia
Argentina
0
20
40
60
80
100
120
140
160
180
6 7 8 9 10 11 12
Log of per capita GDP, 2000 (PPP$)
Gro
ss s
eco
nd
ary
enro
llmen
t ra
te, 2
002
or
mo
st r
ecen
t ye
ar

Lower Enrollment in Secondary
2002 Enrollment in Thailand, by age and sex
100 90 80 70 60 50 40 30 20 10 0 10 20 30 40 50 60 70 80 90 100
Never enrolled Dropout/Finished Tertiary Secondary PrimaryNever enrolled Dropout/Finished Tertiary Secondary Primary
19181716151413121110 9 8 7
Male Female
2003 Enrollment in Colombia, by age and sex
100 90 80 70 60 50 40 30 20 10 0 10 20 30 40 50 60 70 80 90 100
Never Enrolled Dropout / Finished Tertiary Secondary PrimaryNever Enrolled Dropout / Finished Tertiary Secondary Primary
Male Female19181716151413121110 9 8 7

Differences among Income Groups
GE
R2
GE
R2
GE
R2
NE
R2
NE
R2
NE
R2
Change in GER2
Change in NER 2
0%
10%
20%
30%
40%
50%
60%
70%
80%
90%
100%
Low income Lower middle income Upper middle income
Gro
ss a
nd
Net
En
roll
men
t R
ates
0%
1%
2%
3%
4%
5%
6%
7%
8%
9%
An
nu
al C
han
ge
in e
nro
llm
ent
rate
s

Internal Efficiency in EAP and LAC: Over-age is an Issue
Over-age enrollment is a problem in all countries, but more so in LAC than EAP, as indicated by the GER/NER gap:
LAC: GER = 80%; NER = 62%; EAP: GER = 70%; NER= 58%.
Over-age enrollment is related to income levels, more so in EAP than LAC.

Over-age is Pervasive in LAC
2001 Enrollment in Brazil, by age and sex
100 90 80 70 60 50 40 30 20 10 0 10 20 30 40 50 60 70 80 90 100
Never Enrolled Dropout / Finished Tertiary Secondary PrimaryNever Enrolled Dropout / Finished Tertiary Secondary Primary
19181716151413121110 9 8 7
Male Female
2000 Enrollment in Guatemala by age and sex
100 90 80 70 60 50 40 30 20 10 0 10 20 30 40 50 60 70 80 90 100
Neverenrolled Dropout/Finished Tertiary Secondary PrimaryNeverenrolled Dropout/Finished Tertiary Secondary Primary
19181716151413121110 9 8 7
Male Female

Over-age Lower at Higher Income Levels in EAP
1998 Enrollment in Philippines, by age and sex
100 90 80 70 60 50 40 30 20 10 0 10 20 30 40 50 60 70 80 90 100
Never Enrolled Dropout/Finish Tertiary Secondary Primary Never Enrolled Dropout/Finish Tertiary Secondary Primary
Male Female
19181716151413121110 9 8 7
2004 Enrollment in Korea, by age and sex
100 90 80 70 60 50 40 30 20 10 0 10 20 30 40 50 60 70 80 90 100
not enrolled tertiary secondary primarynot enrolled tertiary secondary primary
19181716151413121110 9 8 7
Male Female

Internal Efficiency in EAP and LAC: Low Completion Rates
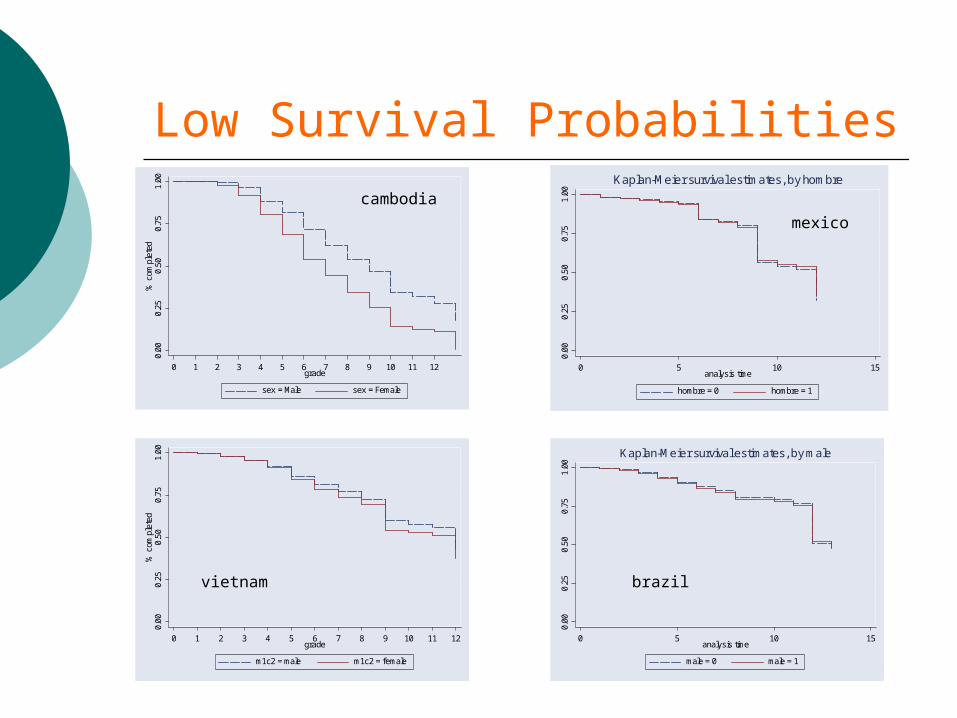
Survival plots show that the likelihood of completing secondary varies substantially across countries, but is generally low, indicating further inefficiencies:
Cambodia: 10%; Guatemala: 25%; Indonesia, the Philippines, Vietnam,
Mexico, Brazil: about 50%; Thailand and Colombia: about 60%.
Low Survival Probabilities0.
000.
250.
500.
751.
00%
com
plet
ed
0 1 2 3 4 5 6 7 8 9 10 11 12grade
m1c2 = male m1c2 = female
0.00
0.25
0.50
0.75
1.00
% c
ompl
eted
0 1 2 3 4 5 6 7 8 9 10 11 12grade
sex = Male sex = Female
0.00
0.25
0.50
0.75
1.00
0 5 10 15analysis time
male = 0 male = 1
Kaplan-Meier survival estimates, by male
cambodia
0.00
0.25
0.50
0.75
1.00
0 5 10 15analysis time
hombre = 0 hombre = 1
Kaplan-Meier survival estimates, by hombre
mexico
vietnam brazil

Quality of Secondary Education: Varies across Regions and Income Group, Higher Percentage in Lower Proficiency Levels in Middle and Lower-Middle Income Countries
PISA 2000 Reading Results
0%
20%
40%
60%
80%
100%P
eru
Bra
zil
Arg
entin
a
Chi
le
Mex
ico
Indo
nesi
a
Tha
iland
Japa
nH
ong
Kon
g
Kor
ea
Latin America East Asia OECDAvg
Per
cen
tag
e o
f S
tud
ents
in E
ach
P
rofi
cien
cy L
evel
0
100
200
300
400
500
600Level 5
Level 4
Level 3
Level 2
Level 1
Below Level 1
Mean

Quality of Secondary Education: Varies across Regions and Income Group, Higher Percentage in Lower Proficiency Levels in Middle and Lower-Middle Income Countries
PISA 2003 Math Results
0%
20%
40%
60%
80%
100%B
razi
l
Mex
ico
Uru
guay
Indo
nesi
a
Tha
iland
Japa
n
Hon
gK
ong
-
Kor
ea
Mac
ao-
Chi
na
Latin America East Asia OECDAvg
Per
cen
tag
e o
f S
tud
ents
in E
ach
P
rofi
cien
cy L
evel
0
100
200
300
400
500
600Level 6
Level 5
Level 4
Level 3
Level 2
Level 1
Below Level 1
Mean

Scores tend to be Lower in TVET Schools
300
350
400
450
500
550
600

Inequities in Educational Outcomes
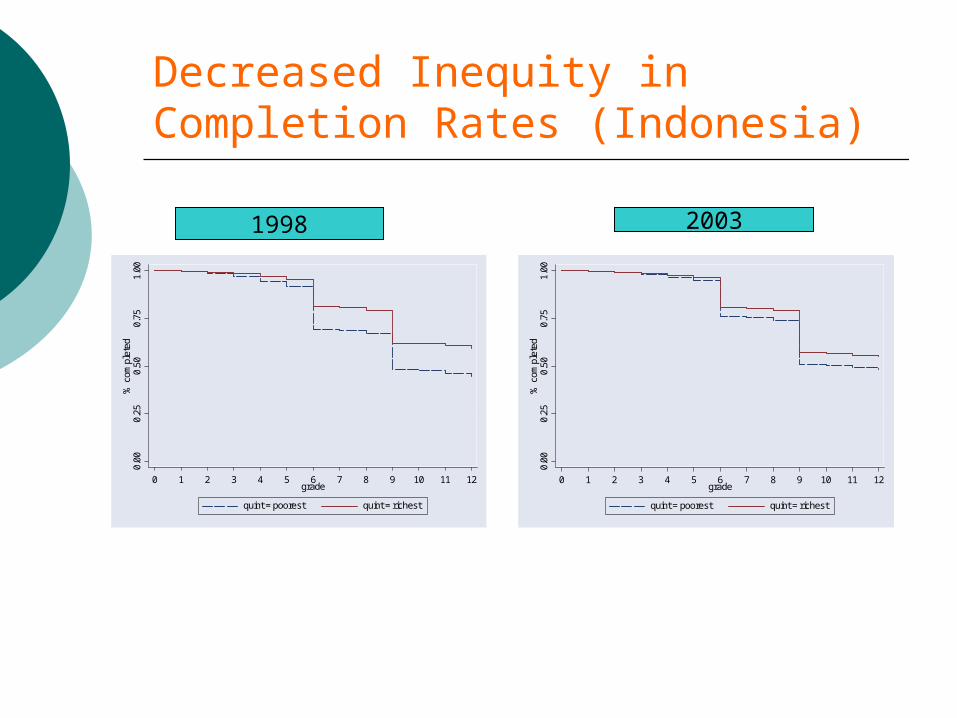
Inequities between urban-rural location and income quintile exist in all countries, in terms of enrollment, timely enrollment and completion.
Inequities tend to be higher in LAC countries, with about three times as many youth completing secondary in the upper quintile than in the lower one in Mexico and Guatemala (almost comparable to Cambodia in EAP).
As enrollment increases, inequities have had a tendency to decrease in EAP countries, the evidence is less clear-cut in LAC.
Decreased Inequity in Completion Rates (Indonesia)
0.00
0.25
0.50
0.75
1.00
% c
ompl
eted
0 1 2 3 4 5 6 7 8 9 10 11 12grade
quint = poorest quint = richest
0.00
0.25
0.50
0.75
1.00
% c
ompl
eted
0 1 2 3 4 5 6 7 8 9 10 11 12grade
quint = poorest quint = richest
1998 2003

Persistent Inequity in Completion Rates (Mexico)
0.00
0.25
0.50
0.75
1.00
0 5 10 15analysis time
topquint = 0 topquint = 1
Kaplan-Meier survival estimates, by topquint
0.00
0.25
0.50
0.75
1.00
0 5 10 15analysis time
topquint = 0 topquint = 1
Kaplan-Meier survival estimates, by topquint
1998 2002

Main Challenges
Two inter-related objectives:
Expand Gross Secondary Enrollment, Net Secondary Enrollment and Completion, in an equitable way; and
Improve Quality and Relevance of Secondary Education.

Supply-side Constraints and Opportunities at the Macro Level
Primary graduates (a constraint in low-income countries). Primary completion rates < 70%. An opportunity in the others.
Timely primary completion (a constraint in all countries).
Quality of primary graduates (a constraint in several countries).
Demographic trends (favourable in most countries). Over the next decade, in all but five countries, total population will increase faster than the secondary school age population. For half the countries the secondary school age population will decline in absolute terms.

Demand-side Constraints and Opportunities at the Macro Level
Increasing demand for secondary education from labor markets:
With globalization comes a change in the type of labor demand, favoring those workers who have the skill sets developed through secondary education.
Innovation and technological advancement require a labor force with sufficiently advanced skills.

Demand-side Constraints and Opportunities: Labor Market Structures
o A preliminary analysis of household surveys suggests that:
In most LAC and EAP countries, labor market composition is increasingly based on services/sales/trade (more true of middle-income countries), which require relevant skills learnt in secondary.
Share of wage employment is also increasing and associated with more than 9 years of schooling in all countries.
High rates of return (see Chapter 2).

Demand-side and Supply-side Constraints at the Micro Level
Low transitions between primary and secondary and sub-cycles of secondary in several LAC and EAP countries can suggest supply-side (access and quality) constraints. Transitions are more marked in rural than urban areas.
In all countries, between 20% and 50% of the youth are out of school at 15, suggesting demand-related issues, aggravated by over-age.

Understanding Demand-side Constraints - Chapter 2
This chapter analyzes household demand for secondary education, with focus on the two main determinants of householddemand:
a. expected benefits (labor market returns to education); and
b. costs (with a focus on opportunity costs).

Demand for Education and Private Rates of Return: Substantial Returns
Private rates of return are higher than 8% in all EAP and LAC countries, slightly higher in EAP.
Rates of return increase with the education level in all selected countries, with higher returns for technical education and very substantial in tertiary.
Incentives to enroll vary according to the secondary modality. Rates of return are higher in TVET, but high returns in tertiary make general secondary attractive in middle-income countries. Importance of secondary-tertiary transition.
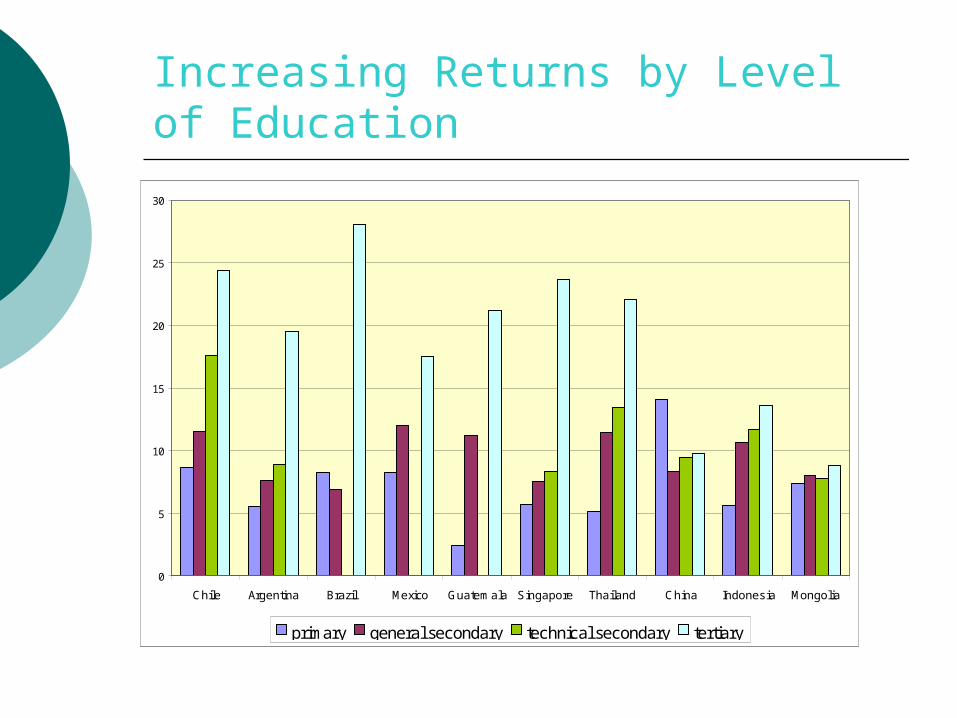
Increasing Returns by Level of Education
0
5
10
15
20
25
30
Chile Argentina Brazil Mexico Guatemala Singapore Thailand China Indonesia Mongolia
primary general secondary technical secondary tertiary
Demand for Education and Private Rates of Return: Heterogeneity in Rates of Return
Rates of return decrease with earning quintiles in lower-income or lower-middle income EAP countries, but increase across earning quintiles in upper-middle-income EAP countries and most LAC countries (providing little incentive to enroll for lower income people).
The differences per development stage can be explained by different labor market structure.
Increasing returns in LAC could be explained by lower quality of the education received by the lower quintile. Investing in quality education for the poor will be key to expand secondary enrollment of the poor in the region.

Rates of Return Vary per Income Quintile
Chart 3a: Return to One More Year of Education by Quantile and Gender: Wage Earners 25-65 years, Vietnam
2001-02
0
2
4
6
8
10
12
Q10 Q25 Q50 Q75 Q90
Quantile
Ret
urn
(%
)
MALES FEMALES
Chart 4a: Return to One More Year of Education by Quantile and Gender: Wage Earners 25-65 years,
Indonesia 2003
0
5
10
15
20
Q10 Q25 Q50 Q75 Q90
Quantile
Ret
urn
(%
)
MALES FEMALES
Chart 13a: Return to One More Year of Education by Quantile and Gender: Wage Earners 25-65 years,
Venezuela 2002
0
2
4
6
8
10
12
14
Q10 Q25 Q50 Q75 Q90
Quantile
Ret
urn
(%
)
MALES FEMALES
Chart 16a: Return to One More Year of Education by Quantile and Gender: Wage Earners 25-65 years, Brazil
2001
0
5
10
15
20
Q10 Q25 Q50 Q75 Q90
Quantile
Ret
urn
(%
)
MALES FEMALES

Demand for Education and School to Work Transition
Opportunity costs can be a strong disincentive to continue and/or do well in school. Using detailed household survey data, the study will explore:
a. the extent, intensity, nature, remuneration of work in teenagers;
b. the interaction between schooling and work (age of transition to work, school and work, work only, school only, neither);
c. a characterization of working teenagers and their families.

Demand for Education and Private Costs of Schooling
Initial evidence shows that fees and indirect costs of schooling can be prohibitive for low-income households across the two regions.
Regional and development patterns will be identified and innovative interventions discussed. The LAC case has shown that demand-side financing has good potential to address opportunity and private costs (e.g. Oportunidades in Mexico, Bolsa Escola in Brazil or PACES in Colombia).

Improving Governance and Management Structures - Chapter 3
The chapter analyzes:
1. Structure of Secondary Education2. Allocation of Functions and
Decisions across Governments and Institutions
3. Impact of Governance Structures
Structure of Secondary Education and Implicit Governance Issues
1. Cycles (one vs. lower and upper, basic vs. lower and upper)
2. Public and/or Private Schools3. General and Vocational Education
a. review the status and literature—developing countries & LAC/EAP;
b. analyze practices in light of the literature review and conceptual framework;
c. connect to demand side of the youth employment equation
i. structure of labor markets ii. match of demand for skills and what education
system supplies iii. does demand justify significant increased
investment and separate general and TVET cycles?

General and Vocational Education: Enrollment Shares
The average enrollment share in vocational-technical schooling for LAC is 9% (decreasing), while for EAP it is 11%.
Enrollment share relatively homogeneous
in EAP, but large differences within LAC.
In high income countries, 27% of secondary schools students are enrolled in vocational education, vs. 2% in low income countries.

General and Vocational Education: New Trends
Traditionally, in LAC as in EAP, vocational schools have been separated out from general secondary schools. However, there is an increasing focus towards broader and more integrated curricula.
In LAC, vocational secondary education is decreasing but there is growth at the post-secondary level and an increase in industry based training, together with better integration secondary-tertiary (Colombia, Chile, etc).
EAP countries have put more emphasis on modernizing existing secondary vocational systems.

General and Vocational Education: Basic Labor Market Facts
With the exception of Argentina and Indonesia, unemployment rates for secondary graduates are below 20% in all countries (< average rate).
Unemployment rates tend to be lower for technical secondary graduates.
Between 30 and 70% of secondary graduates are wage employed. Shares are higher in middle-income countries.
A deeper analysis of demand for skills is needed as well as a cost analysis of alternative modalities.

Secondary Graduate ProfilesVietnam general secondary
wage employed self-employed unemployed
Vietnam technical secondary
wage employed self-employed unemployed
Bolivia general secondary
wage employed self-employedunpaid employment unemployed
Bolivia technical secondary
wage employed self-employedunpaid employment unemployed

Allocation of Functions and Decisions Across Governments and Institutions
1. Relative spectrum of decentralizationa. Legal Framework & Historyb. Different Models of Decentralization: to
governments and/or schoolsc. Government relations to private schools
2. Locus of Decision-making: focus on administration, personnel, & quality control
3. Implementation Issues: a. de jure vs. de factob. Weak links in accountability chain

Relative Spectrum of Decentralization
In general, education systems in LAC are organized regionally or locally. In contrast, in EAP countries there is a tendency towards centralized administration of education.
Schools are decentralized responsibilities in both regions (more so in lower income LAC countries and middle or upper income EAP countries).

Locus of Decision-Making
Impact of Governance Structures: Focus on Decentralization and School Organization
1. Assessment of Accountability Relationships
2. School-Based Mgmt & School Committees
a. Legal Framework, powers & member selection
b. Analysis of decision-making
3. Impact of Decentralization on Outcomesa. Cross-country setting b. Individual case studies

Evidence on School Based Management from PISA 2000 and 2003 Analysis
School autonomy generally higher in Honk-Kong and Thailand than in the selected sample of LAC countries.
School boards have slightly larger roles in LAC. Principals and teachers have slightly larger roles in EAP.

Decision-Making Autonomy within Schools: Varying Role of the Different Actors
0
20
40
60
80
100
120
140
160
180
Ove
rall b
udge
t:
No
auto
nom
y
Sch
ool B
oard
Prin
cipal
Tea
cher
s
Budge
t allo
catio
ns:
No
auto
nom
y
Sch
ool B
oard
Prin
cipal
Tea
cher
s
Asses
smen
t:
No
auto
nom
y
Sch
ool B
oard
Prin
cipal
Tea
cher
s
Textb
ooks
:
No
auto
nom
y
Sch
ool B
oard
Prin
cipal
Tea
cher
s
Cours
e Con
tent
:
No
auto
nom
y
Sch
ool B
oard
Prin
cipal
Tea
cher
s
EAP LAC

Evidence on School Based Management from PISA 2000 and 2003 Analysis
Autonomy in teacher management positively related to achievement in LAC, but not EAP.
Autonomy in texts and course contents positively related to achievement in EAP, but not LAC.
Accountability argument more important in LAC; but local informational advantage argument more important in EAP.
Mobilizing Resources – Chapter 4
This chapter: 1. estimates resources needed to expand
secondary education coverage and financing gaps given current expenditure levels, secondary targets and growth prospects;
2. analyzes rationale for public versus private intervention in financing the expansion of secondary education; and
3. analyzes alternative options to raise resources for secondary education.

Lack of Priority on Secondary Education, more so in LAC than EAP
Within each region countries differ drastically, but the two regions are facing similar types of challenges: increasing gross enrollment rates and expenditure on secondary education.
Expenditure on secondary education is low in terms
of GDP and per student in both regions (more so in LAC than EAP).
It is low for expenditure per student as a percent of GDP per capita in LAC, while high in EAP.
These ratios are lower in low income countries.

Secondary Education Shares in terms of GDP are still Low
Sec
on
dar
y, 1
.45%
Sec
on
dar
y, 1
.91
%
Sec
on
dar
y, 1
.74
%
Sec
on
dar
y, 1
.64
%
Sec
on
dar
y, 0
.96%
All
ed
uca
tio
n,
4.85
%
All
Ed
uca
tio
n,
6.0
3%
All
ed
uca
tio
n,
4.8
1%
All
Ed
uca
tio
n,
4.38
%
All
Ed
uca
tio
n,
5.87
%
-
1.00
2.00
3.00
4.00
5.00
6.00
7.00
Low income Lower middleincome
Upper middleincome
EAP LAC

Expenditure per Student in Secondary is much Lower than OECD average
-
1,000.00
2,000.00
3,000.00
4,000.00
5,000.00
6,000.00
7,000.00
Low
income
Lower-
middle
income
Upper-
middle income
EAP LAC OECD
Average
Primary
Secondary

But Secondary Expenditure per Student in Percent of GDP per capita is High in EAP
$0
$1,000
$2,000
$3,000
$4,000
$5,000
$6,000
$7,000
$8,000
Low incomeLower middle
income
Upper
middle
income
EAP LAC OECD
Average
PP
P
-
5
10
15
20
25
30
% o
f G
DP
per
cap
ita
Per Student Expenditure
Per Student expenditure as % of percapita income

Estimated Fiscal Gap for a given GER target and at current Unit Costs in percent of GDP: Higher Gaps for Lower Middle Income and EAP countries
GER Target Resources needed as % of GDP Fiscal gap as % of GDP Low income 1.07 0.55
Lower middle income 2.82 1.04 Upper middle income 1.87 0.22
EAP 3.28 1.58 LAC 1.66 0.24
75%
Two regions combined 2.23 0.71 Low income 1.53 0.55
Lower middle income 2.92 0.98 Upper middle income 2.15 0.34
EAP 3.60 1.41 LAC 1.87 0.34
85%
Two regions combined 2.47 0.72 Low income 1.71 0.73
Lower middle income 3.24 1.24 Upper middle income 3.00 1.00
EAP 3.92 1.52 LAC 2.15 0.52
95%
Two regions combined 2.80 0.89 Low income (68%) 1.30 0.32
Lower middle income (86%) 2.50 0.52 Upper middle income (106%) 2.59 0.52
EAP 2.79 0.47 LAC 2.21 0.51
15% above current rates
Two regions combined 2.40 0.50

Estimated Fiscal Gap for a given GER target and at OECD Unit Costs in percent of GDP: Higher Gaps for Lower Income Countries, increasing gaps for LAC countries
GER Target Resources needed as % of GDP Fiscal gap as % of GDP Low income 2.73 1.74
Lower middle income 2.46 1.37 Upper middle income 2.40 0.73
EAP 2.55 1.49 LAC 2.45 1.07
75%
Two regions combined 2.47 1.18 Low income 3.10 2.11
Lower middle income 2.77 1.46 Upper middle income 2.60 0.83
EAP 2.73 1.29 LAC 2.74 1.27
85%
Two regions combined 2.74 1.28 Low income 3.46 2.47
Lower middle income 3.09 1.78 Upper middle income 2.91 1.13
EAP 3.06 1.62 LAC 3.07 1.59
95%
Two regions combined 3.06 1.60 Low income (68%) 2.52 1.53
Lower middle income (86%) 2.96 1.65 Upper middle (106%) 3.27 1. 29
EAP 2.74 1.30 LAC 3.16 1.54
Increase by 15%
Two regions combined 3.04 1.48

Alternative Options to Raise Resources
Alternative options to raise resources are analyzed, looking at:
1. Public sources:a. taxing capacity (LAC and EAP lag behind
world average on revenue effort even controlling for income levels)
b. fiscal decentralization c. revenue earmarked to secondary education
(lotteries, targeted taxes)d. cross-sectoral sources e. re-allocation across education levels

Alternative Options to Raise Resources
2. Public-private cost sharing schemes:a. household and community contributionsb. private contributions (firms)c. public-private cost sharing in private schools
3. Private resources:a. privately funded/managed formal education
(private schools, private companies funding TVET, etc)
b. completing financial markets (savings accounts, scholarships to poor students, etc)
c. informal education: tutoring4. International funding.

Mobilizing Resources: Some Lessons
Countries that achieved significant expansion of secondary education share the following characteristics:
Use multiple resource mobilizing schemes Have moved towards more decentralized systems Have incorporated more private funding in secondary education
delivery Have successfully and innovatively mixed public and private
resources Kept per pupil costs under control
A few case studies of countries which successfully expanded secondary enrollment will be analyzed to learn on effective resource mobilization strategies in specific contexts.

Improving the Efficiency of Service Delivery – Chapter 5
Countries could substantially expand and improve secondary education with less resource mobilization efforts by being more efficient. This chapter:
1. measures cost-effectiveness levels in LAC and EAP (output and input efficiency);
2. explains efficiency results;3. reviews interventions which can be
efficiency enhancing.

Measurement of Cost-Effectiveness
Cost-effectivenes is measured through DEA non-parametric techniques, relating selected outputs to one or more inputs (expenditure, or physical/human inputs).
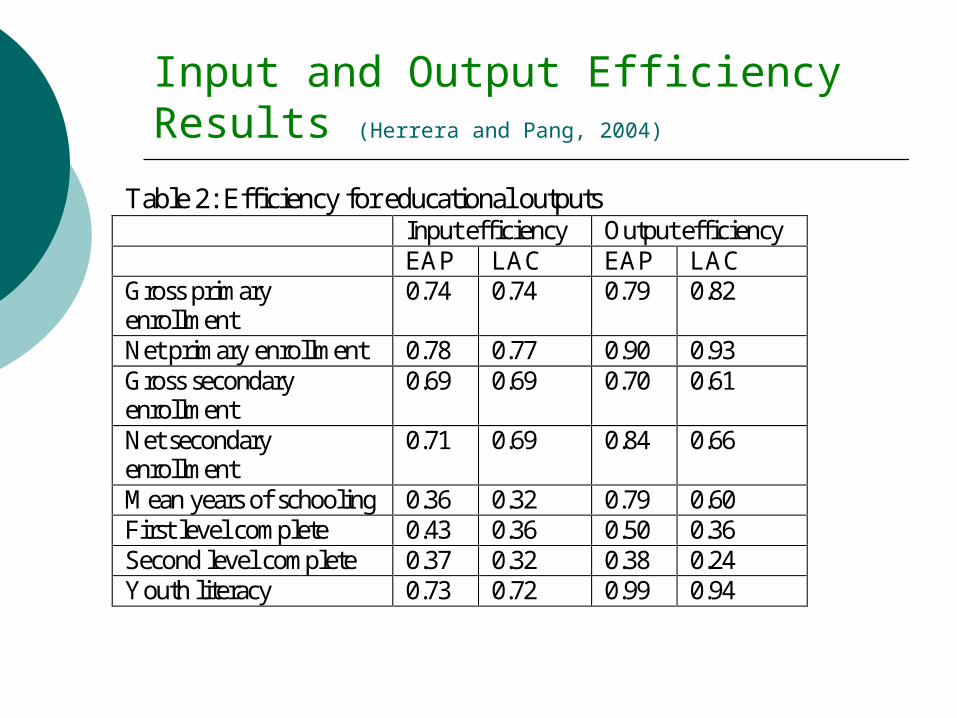
Existing analysis shows no clear difference between EAP and LAC countries in input-efficiency, but that EAP countries tend to be more output efficient in terms of secondary enrollment and completion.
Input and Output Efficiency Results (Herrera and Pang, 2004)
Table 2: Efficiency for educational outputs Input efficiency Output efficiency EAP LAC EAP LAC Gross primary enrollment
0.74 0.74 0.79 0.82
Net primary enrollment 0.78 0.77 0.90 0.93 Gross secondary enrollment
0.69 0.69 0.70 0.61
Net secondary enrollment
0.71 0.69 0.84 0.66
Mean years of schooling 0.36 0.32 0.79 0.60 First level complete 0.43 0.36 0.50 0.36 Second level complete 0.37 0.32 0.38 0.24 Youth literacy 0.73 0.72 0.99 0.94

DEA/FDH Estimation on PISA 2000: Input Efficiency
Main Findings:
1. more heterogeneity across LAC countries in terms of input-efficiency (low efficiency in Argentina, high in Chile and Mexico);
2. more homogeneous, but on average slightly lower, in EAP countries;
3. in Argentina and Indonesisa, results are also particularly heterogeneous within countries.

PISA 2000: Input Efficiency Scores (higher score is associated with lower input efficiency)
0
0.5
1
1.5
2
2.5
3
3.5
ARG BRA CHL MEX PER HKG IDN JPN KOR THA

DEA/FDH Estimation on PISA 2000: Output Efficiency
Main Findings:
1. results are more homogeneous in terms of output-efficiency, with slightly higher results for EAP;
2. Chile and Mexico do well also in output-efficiency terms, while Brazil does poorly;
3. there is generally more variability within countries in LAC than EAP, and variability is particularly high in Brazil and Indonesia.

PISA 2000: Output Efficiency Scores (higher score is associated with higher output efficiency)
0.76
0.78
0.8
0.82
0.84
0.86
0.88
0.9
0.92
0.94
1
ARG BRA CHL MEX PER HKG IDN JPN KOR THA
Gains from Efficiency Improvements
Initial evidence suggests large potential gains from input-efficiency improvements. Potential gains from output-efficiency improvements are smaller, although substantial in some countries such as Brazil and Indonesia (by eliminating inefficiency, outcomes could be scaled up by about 20% in both countries).

What Explains Efficiency Results and How to Enhance Input Productivity?
Impact of different budget shares; Impact of general vs technical secondary
education; Impact of management reforms (school-based
management, public/private schools, public-private partnerships);
Impact of flexible and innovative delivery models of secondary education;
Impact of pedagogical and curricular practices; Impact of repetition and internal efficiency
improvements.
Impact of General vs Technical Secondary Education
Vocational and technical education is more expensive than general academic school in secondary education (by from 1.14 times to 7.20 times, due to lower pupil-teacher ratios, more equipment, etc).
Technical and vocational schools appear generally less input efficient in the PISA analysis.

Impact of Flexible Delivery Models
Alternative models tend to have lower per student costs than conventional schools even while providing access to populations and areas that are typically more expensive to serve.
Three main types of alternative secondary models are: Distance Education; Open Learning; and Group Study.
International evidence suggests that these models can work for specific target populations. Successful cases in LAC and EAP will be more thoroughly analyzed and some systematic lessons extracted.

Impact of Management Structures
Initial evidence suggests that schools with higher decision-making autonomy in human resources are more output efficient in LAC countries.
Private schools tend to be more efficient, although more so in LAC countries.

Impact of Pedagogical/Curricular Practices
Initial evidence suggests that schools using external assessment practices are more output efficient in Brazil, Thailand and Honk Kong.
Improving the alignment between different parts of the system to ensure smooth transitions between sub-cycles and cycles (case study on Malaysia) is another promising intervention.

Impact of Reduced Repetition
By decreasing repetition in primary and secondary, over-age decreases, early drop-out decreases and educational attainment increases. The NER increases as well.
Reducing repetition can also, potentially, provide important savings:
initial evidence suggests that repetition, and the cost of repetition, are higher in LAC than EAP and in primary than secondary education. In total, LAC countries could save over US$ 2 billion per year by eliminating repetition at the secondary level, savings are less substantial in EAP.

Cost of Repetition: High in LAC
Cost of repetition as percent of recurrent education expenditure
2.6%
5.5%
0.2%
4.3%
0.0%
1.0%
2.0%
3.0%
4.0%
5.0%
6.0%
EAP LAC
Primary
Secondary

Impact of Reduced Repetition
Issues: how can repetition be reduced ? What is an advisable repetition level ? What is the likelihood that reductions in repetition translate into actual cost savings ?
A case study is being undertaken on two countries in EAP and LAC (Cambodia and Chile) which have successfully decreased repetition in secondary. The policy combinations to achieve this reduction are analyzed, as well as the consequences of this decrease on coverage and quality indicators, and on costs.

Some Emerging Messages
Several challenges have emerged in secondary education in both EAP and LAC, related to low coverage, completion and quality.
Coverage and quality challenges are inter-related.
Challenges are more acute in lower income countries.

Some Emerging Messages
Significant demand for secondary graduates (both general and technical), although household demand is still constrained, in particular for lower income youth in LAC (contributing to explain higher inequalities in LAC).
Technical-vocational secondary education can be effective but is more costly. More analysis is needed on relevance of TVET and general education to labor market needs and relative costing.
Some Emerging Messages
There is scope for mobilizing more resources for secondary education, while also improving the efficiency of service delivery in both EAP and LAC:
Secondary education in under-funded in both EAP and LAC (more so in LAC and in lower-income countries). Fiscal gaps are substantial for lower-income and lower-middle income countries and for both EAP and LAC;
Scope for input-efficiency improvements in all countries, although more so in EAP than LAC;
Also scope, although less so, for output-efficiency improvements, more so in LAC than EAP and in lower-middle income countries.

Some Emerging Messages
A broad range of options need to be looked at to mobilize resources and improve efficiency:
Options to mobilize resources include using multiple resource mobilization schemes, decentralized financing, and innovative public-private resource mixes.
Possible options to improve output and input efficiency include school autonomy, flexible delivery models, use of assessment practices and a decrease in repetition (more so for LAC).


