
Ana Lòpez–De Fede, PhDResearch Professor and DirectorDivision of Medicaid Policy ResearchInstitute for Families in SocietyUniversity of South Carolina
September 24, 2015
1
Measuring the Impact of the Healthy Outcomes Plan: Preliminary Evaluation

2
“All things are created twice; first mentally; then physically. The key to creativity is to begin with the end in mind, with a vision and a blueprint of the desired result.”— Stephen Covey
Preventable Inpatient Visits
Preventable ED Visits
Reduction of Avoidable ED and Readmission
Care Plan Executed
Identification of Behavioral Health Needs
Patient Engagement
Reduction on Total Charges –Inpatient and ED Visits

Hospital and Clinic Proviso Evaluation Framework
Technical Assistance Proviso Context: Healthcare Reform
Sustaining Activities
CollaborationsInterventions Targeted At:Interventions Targeted At: Intermediate
Outcomes• Improved care
coordination within and across providers
• Heightened patient activation and compliance
• Improved patient outcomes
• Diffusion of best practices• Patient satisfaction • Community engagement
Long-termOutcomes
• Community improvement in quality measures
• Improvement in health status
• Reduction in costs trends
• Reduction in disparities • Ongoing collaboration
to improve healthcare
Feedback on implementation and results
Public Reporting
Consumer and
Community Engagement
Quality Improvement
Payment Reform
Proviso Stakeholders
Alliance development, setting vision and strategies
Disparity Reduction
3
TIMELINE
Programmatic alignment

Evaluation Questions and Data Elements –Part 1 Presentation – September 24, 2015
– How does participation in HOP improve the quality of participants health? Hospital Discharge Data
– How does participation in HOP impact total charges for inpatient and ED stays? Hospital Discharge Data
– How does participation in HOP increase consumer engagement? Patient Activation Measure
– How does participation in HOP result in greater program alignment to meet the needs of uninsured? GAINS (Behavioral Health)
4
INTERVENTIONS

Evaluation Questions and Data Elements –Part 2 Presentation TBD
– Does HOP increase collaboration across service delivery entities serving the uninsured? Collaboration Index with Case Study Interviews; Hospital and Community Partnerships; Development of Common Reporting
– Does HOP participation result in enhanced public reporting? Hospital Reports; Participation/Enrollment; Adoption of Common Reporting Tools and Measurements
– Does HOP facilitate the reduction of health disparities by addressing social and cultural determinants as a component of the care plan? SDOH Standardized Tool
5
COLLABORATION

Evaluation Time Period
EvaluationReport
BASELINEJune 2012 –June 2013
FEASIBILITY/RECRUITMENT
July 2013 –June 2014
IMPLEMENTATIONJuly 2014 –June 2015
6
PHASE 1 PHASE 2
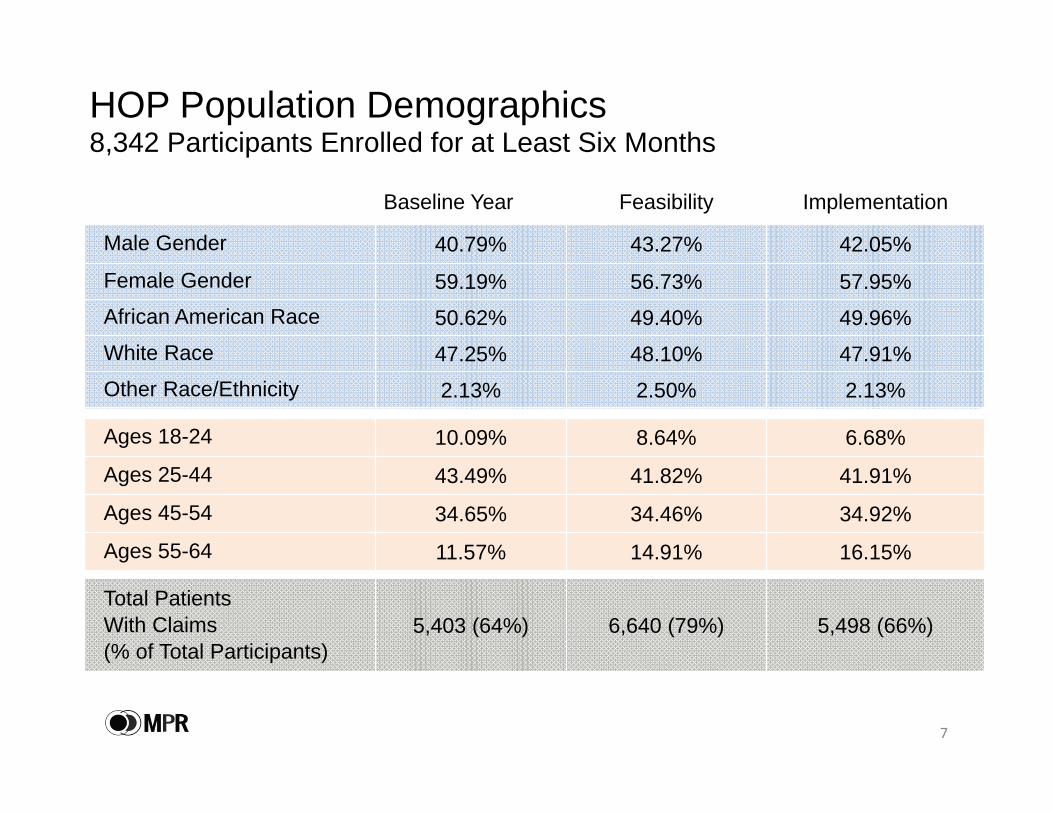
HOP Population Demographics 8,342 Participants Enrolled for at Least Six Months
7
Ages 18-24 10.09% 8.64% 6.68%
Ages 25-44 43.49% 41.82% 41.91%
Ages 45-54 34.65% 34.46% 34.92%
Ages 55-64 11.57% 14.91% 16.15%
Baseline Year Feasibility Implementation
Male Gender 40.79% 43.27% 42.05%
Female Gender 59.19% 56.73% 57.95%African American Race 50.62% 49.40% 49.96%White Race 47.25% 48.10% 47.91%Other Race/Ethnicity 2.13% 2.50% 2.13%
Total Patients With Claims(% of Total Participants)
5,403 (64%) 6,640 (79%) 5,498 (66%)

HOP Inpatient and ED Utilization8,342 Participants Enrolled for at Least Six Months
8
Time PeriodTotal
Patients Total InpatientsInpatients With 2+ Discharges
Total Emergency Department
Patients
Emergency Department
Patients With 2+ Discharges
Baseline Year 5,403 1,337 481 5,196 3,819
Feasibility Year 1 6,640 2,171 794 6,293 4,864
Implementation Year 1 –To Date
5,498 1,640 627 5,192 3,810

9
EVALUATION QUESTION 1“How does participation in HOP improve the quality of participants’ health?”

10
PHASE I: COMPARISON OF BASELINE (FY 13) TO FEASIBILITY YEAR 1 (FY 14)

• Preventable inpatient stays continued to drop during the first full year of implementation (FY 15).
• The monthly overall and chronic visits also decreased, as well as the average acute prevention composite visits.
11
25.5
4.37
21.1324.79
3.91
20.8822.54
3.61
18.92
05
1015202530
Overall CompositeDischarge Rate
Acute PreventionComposite Discharge Rate
Chronic PreventionComposite Discharge Rate
Baseline Feasibility Implementation
Key Findings:Preventable Inpatient Stays

• Preventable inpatient readmission rates decreased during implementation.
12
5.75
9.27
15.2
5.89
10.56
17.58
5.66
10.64
17.25
0
5
10
15
20
7 Day InpatientReadmissions Rate
14 Day InpatientReadmissions Rate
30 Day InpatientReadmissions Rate
Baseline Feasibility Implementation
Key Findings:Preventable Inpatient Stays

Key Findings:Preventable Inpatient Stays• Lower overall (-0.71%, rel. change -2.78%), acute (-0.46%, rel. change -
10.53%), and chronic preventable inpatient stay rates (-0.25%, rel. change -1.18%).
• Average overall and chronic prevention composite visits and monthly overall and acute prevention composite visits also decreased.
• Significant differences in favor of the HOP participants existed for the overall (p<.001) and acute (p = 0.011) prevention composite rates.
13
25.50%
4.37%
21.13%24.79%
3.91%
20.88%
0.00%
5.00%
10.00%
15.00%
20.00%
25.00%
30.00%
Overall Prevention CompositeDischarges Rate
Acute Prevention CompositeDischarges Rate
Chronic Prevention CompositeDischarges Rate
Statewide HOPBaselineStatewide HOPFeasibility Year 1

Initial Areas for Improvement:Preventable Inpatient Stays
• Average inpatient visits, patients with 2+ discharges inpatient Average visits, Average acute prevention composite visits, monthly chronic prevention composite visits rate, and 7-, 14-, and 30-day readmission rates
• The increases in all three readmission rates were statistically significant compared to the matched comparison group (p <.001).
14
5.75%
9.27%
15.20%
5.89%
10.56%
17.58%
0.00%2.00%4.00%6.00%8.00%
10.00%12.00%14.00%16.00%18.00%20.00%
Rate 7 Day InpatientReadmissions
Rate 14 Day InpatientReadmissions
Rate 30 Day InpatientReadmissions
Statewide HOP BaselineStatewide HOP Feasibility Year 1

• HOP participants had lower monthly emergent primary care treatable (-2.51%, rel. change -3.87%) and non-emergent ED visits (-1.41%, rel. change -3.02%)
15
64.96%
46.82%
62.44%
45.41%
0.00%
10.00%
20.00%
30.00%
40.00%
50.00%
60.00%
70.00%
Monthly EmergentPrimary Care Treatable
ED Visits Rate
Monthly Non-EmergentED Visits Rate
Statewide HOPBaselineStatewide HOPFeasibility Year 1
Key Findings:ED Stays

Initial Areas for Improvement: ED Stays
• With the exception of the two monthly measured presented on the previous slide, all the ED measures increased between Baseline Year and Feasibility Year 1 for the HOP participants. [Again, this was not surprising given that HOP recruited patients with high ED utilization.]
• For HOP participants, the increases in Average overall ED visits(p = 0.001) and Average alcohol ED visits (0.006) were statistically significant compared to the matched comparison group. For the Average injury ER visits, Statewide HOP did not show a significant change, but the comparison group actually had a significant decrease (p = 0.012).
• Our preliminary cost analysis revealed that reducing these three measures would equal at least a cost savings of .04 standard deviations of the total cost for services rendered.
16

17
PHASE II: COMPARISON OF FEASIBILITY YEAR (FY14) TO IMPLEMENTATION YEAR 1 TO DATE(FY15) [PRELIMINARY RESULTS]

Key Findings: Decrease in ED Visits 4.68
1.78 1.8
1.2
4.32
1.67 1.8
1.32
0
0.5
1
1.5
2
2.5
3
3.5
4
4.5
5
Average EDVisits
AverageInjury ED
Visits
AverageAlcohol ED
Visits
AverageSubstanceAbuse ED
Visits
FeasibilityImplementation
• Overall decrease in 12 of 17 measures associated with ED visits during implementation Year.
• It is estimated that a decrease in average overall, injury, and alcohol ED visits would result in measurable cost savings —$40 for every $1,000 charged.
18

Total Charges Comparison of Feasibility and Implementation Periods
19
Overall,18% decrease in total charges for inpatient staysand ED visits between feasibility and implementation periods
Measure Feasibility Year 1Implementation
Year 1 Difference Relative Change
Total Charges $66,793,561 $54,817,923 -$11,975,638 -17.93%19

Overall Inpatient and ED Findings
• The number of measures with a relative decrease increased from 9 to 20 with the greatest impact seen for preventable inpatient stays.
• Our initial cost savings analysis predicted that a reduction in average total, alcohol, and injury ED visits would result in measurable cost savings. Two of these measures (total and injury visits) did decrease.
• Further cost analyses once FY 15 claims data close with a matched comparison group will be necessaryto confirm.
20

21
“Does Care Plan Make a Difference on Inpatient and ED Measures? Total Charges?”

Key Findings:Preventable Inpatient Stays (Care Plan)
22
• Having a care plan made the biggest difference for inpatient stays that could have been prevented by coordinating care for patients with diabetes, COPD, asthma, hypertension, congestive heart failure, and angina without procedure (chronic prevention composite rate). For patients with a care plan, this measure had the largest relative decrease (-16.12%) of any measure, but for patients without a care plan there was a 1.10% relative increase.
26.44%22.91%
3.17%4.75%
23.27%
18.16%
23.53%21.60%
4.00% 3.25%
19.52% 18.36%
0.00%
5.00%
10.00%
15.00%
20.00%
25.00%
30.00%
OverallPrevention
Composite CarePlan
OverallPrevention
Composite NoCare Plan
Acute PreventionComposite Care
Plan
Acute PreventionComposite No
Care Plan
ChronicPrevention
Composite CarePlan
ChronicPrevention
Composite NoCare Plan
Feasibility Year 1
Implementation Year 1 to date

23
• All three inpatient readmission rates decreased for patients with a care plan.
5.84% 5.88%
10.40% 10.63%
17.28% 17.65%
5.27%6.03%
10.18%11.07%
17.13% 17.36%
0.00%
2.00%
4.00%
6.00%
8.00%
10.00%
12.00%
14.00%
16.00%
18.00%
20.00%
7-Day Care Plan 7-Day No CarePlan
14-Day Care Plan 14-Day No CarePlan
30-Day Care Plan 30-Day No CarePlan
Feasibility Year 1
Implementation Year 1 to date
Key Findings:Inpatient Readmissions (Care Plan)

24
• 9 of the 12 average ED measures decreased for patients with a care plan: total, emergent, emergent not preventable avoidable, emergent preventable avoidable, emergent primary care treatable, patients with 2+ discharges.
• The only average measures that did not decrease were the unclassified, substance abuse, and alcohol visits. The monthly emergent ED visits rate and monthly emergent primary care treatable ED visits rate also increased.
4.70
2.451.60 1.84 2.07
5.77
4.20
2.311.46 1.81 1.94
5.42
0.001.002.003.004.005.006.007.00
Average EDVisits
AverageEmergent ED
Visits
AverageEmergent Not
Prevent.Avoidable ED
Visits
AverageEmergentPrevent.
Avoidable EDVisits
AverageEmergent
Primary CareTreatable ED
Visits
Average EDVisits Among
Patients with 2+ED Discharges
Feasibility Year 1
Implementation Year 1 to date
Key Findings:ED Stays (Care Plan)

Overall Key Findings: Care Plan
• For 16 measures tracked by the Initiative, HOP patients enrolled for at least six months with a care plan saw a greater relative decrease than HOP patients without a care plan.
• As expected, the care plan made the biggest difference for inpatient stays related to chronic conditions. This may be why there was also a greater decrease of 7- and 14-day inpatient readmissions rates and average primary care treatable ED visits.
• There was also an 11.01% relative decrease in overall preventable inpatient stays for patients with a care plan.
25

HOP Care Plan Impacts onTotal Cost Charges
Care Plan Status Feasibility Implementation Difference
Relative Change
Total Charges
Plan $35,489,471 $28,419,689 ($7,069,782) -19.92%
No Plan $31,304,090 $26,398,234 ($4,905,856) -15.67%
26

27
EVALUATION QUESTIONS “How does participation in HOP result in greater program alignment to meet the needs of uninsured? [GAIN-SS]”
“How does participation in HOP increase consumer engagement? [PAM]”

PAM and GAIN-SS Samples
28
• As of March, 2014, during Feasibility Year 1, 3,201 patients had been screened with PAM and 3,317 had been screened with GAIN-SS, which represented 38% and 39% of active members, respectively.
• Due to increased enrollment in HOP and improved HOP implementation during Implementation Year 1, by the end of February, 2015, screening had more than doubled with 8,377 PAM patients and 9,005 GAIN-SS patients.
• 90% of active HOP members had been administered the PAM, and 97% had been administered the GAIN-SS.

Statewide HOP PAM Results: Percentage by PAM Level
19.6521.24
33.46
25.65
17.9820.86
34.42
26.72
0
5
10
15
20
25
30
35
40
Level 1 NotEngaged
Level 2 BecomingAware
Level 3 TakingAction
Level 4 Engaged
2014 2015
29

Statewide HOP GAIN-SS Results
30
20.8 18.51
60.57
23.97
17.25
58.75
0
10
20
30
40
50
60
70
Low Percent Moderate Percent High Percent
2014 2015

31
Subscreenand Risk Level
Feb. 2014 Feb. 2015 Difference Relative Change
Low Risk 84.38% 84.92% 0.54% 0.64%
Moderate Risk 14.14% 13.74% -0.40% -2.83%
High Risk 1.39% 1.30% -0.09% -6.47%
Statewide HOP GAIN-SS Subscreen Results
Substance Disorder SubscreenLow Risk 72.41% 73.88% 1.47% 2.03%
Moderate Risk 18.63% 18.13% -0.50% -2.68%
High Risk 8.86% 8.46% -0.40% -4.51%
Internalizing Disorder SubscreenLow Risk 25.23% 28.22% 2.99% 11.85%
Moderate Risk 24.27% 22.24% -2.03% -8.36%
High Risk 50.38% 49.51% -0.87% -1.73%
Externalizing Disorder SubscreenLow Risk 54.18% 55.41% 1.23% 2.27%
Moderate Risk 26.98% 25.43% -1.55% -5.74%
High Risk 18.75% 19.13% 0.38% 2.03%

Statewide HOP PAM and GAIN-SSImplications and Next Steps
32
• Stability of population
• HOP patients are diverse in their readiness for patient engagement.
• Future reporting of PAM and GAIN-SS consistent and timely
• High need for further assessment and referral for behavioral health – mental health and substance abuse

Acknowledgments
• The HOP members who provided the data to frame this evaluation
• The external members of the Data Committee –SCHA and RFA
• Members of the HOP Vision Council for guidance
• The IFS, Division of Medicaid Policy Research and our colleagues at SCDHHS
33
“You can have data without information, but you cannot have information without data.” -- Daniel Keys Moran

Next Presentation Data Elements
• Collaborative Index
• Social and Cultural Determinants of Health
• Web Portal for Data Entry
34


