
MHI Show Pro
Managing Leads and Measuring Results Webinar Workbook
Copyright 2016. Competitive Edge and MHI. All rights reserved.
No portion of this workbook may be reproduced without permission of Competitive Edge.
For questions or permission call 800-700-6174 or 704-814-7355.
Measuring Leads and
Measuring Results
How to Improve Lead Quality,
Sales Conversion and Measure
Performance and ROI
Custom
Present
Webinar Discussion Points
1. Key insights on lead management.
2. Defining what is and isn’t a lead. 3. The four phases of closed-loop lead management. 4. Setting realistic lead goals.
5. Identifying the best information to capture to qualify leads.
6. Four generations of lead capture devices. 7. How to develop an Opportunity Card.
8. Creating an easy to apply lead grading system. 9. How to build a culture of lead reporting. 10. Best practices for lead response management.
11. Lead follow-up techniques. 12. Tradeshow performance and financial metrics.
13. How to create an Exhibiting Performance & ROI report.
MHI Show Pro
Managing Leads and Measuring Results Webinar Workbook
Copyright 2016. Competitive Edge and MHI. All rights reserved.
No portion of this workbook may be reproduced without permission of Competitive Edge.
For questions or permission call 800-700-6174 or 704-814-7355.
1. How important are leads to the success of your exhibit program?
Critical Important Somewhat Important Not Important
2. Do you…
a. Capture leads? Yes No Unsure
If yes, how? _____________________
b. Know what becomes of your leads? Yes No Unsure
c. Set specific lead goals? Yes No Unsure
Key Insights on Lead Management
1. If you’re not writing orders at the show, the REAL product is leads.
2. _____% of show leads are never followed-up.
3. _____% of sales people view show leads as cold calls.
4. _____% of buyers receive information after they have made a buying decision.
5. The problem starts with perception of tradeshow lead value and the CAPTURE process.
6. Most exhibitors don’t know what becomes of show leads.
Why is This Happening?
Perceived ___________ of tradeshow leads.
Marketing and Sales “disconnect”.
Lack of exhibit staff _____________.
_____% of booth staff have never received one single hour of professional training
on how to work an exhibit.
Lack of “clarity” on what a lead really is.
Lack of a “Closed-Loop” lead management system.
MHI Show Pro
Managing Leads and Measuring Results Webinar Workbook
Copyright 2016. Competitive Edge and MHI. All rights reserved.
No portion of this workbook may be reproduced without permission of Competitive Edge.
For questions or permission call 800-700-6174 or 704-814-7355.
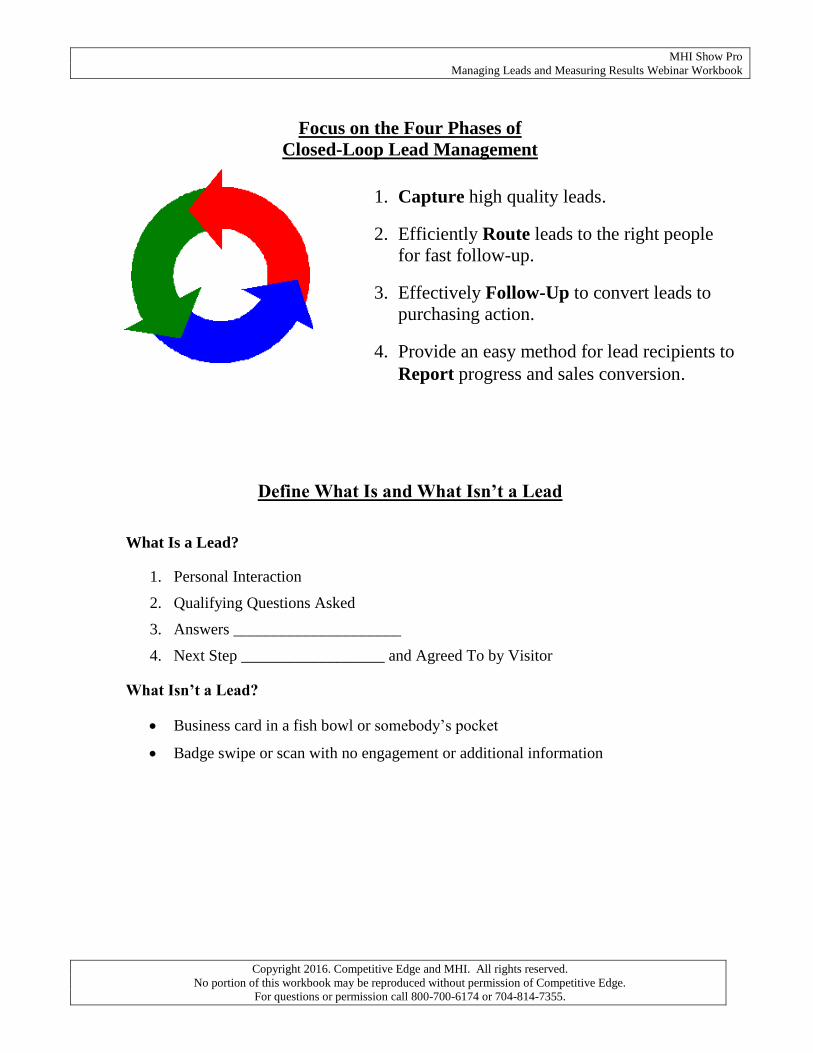
Focus on the Four Phases of
Closed-Loop Lead Management
Define What Is and What Isn’t a Lead
What Is a Lead?
1. Personal Interaction
2. Qualifying Questions Asked
3. Answers _____________________
4. Next Step __________________ and Agreed To by Visitor
What Isn’t a Lead?
Business card in a fish bowl or somebody’s pocket
Badge swipe or scan with no engagement or additional information
1. Capture high quality leads.
2. Efficiently Route leads to the right people
for fast follow-up.
3. Effectively Follow-Up to convert leads to
purchasing action.
4. Provide an easy method for lead recipients to
Report progress and sales conversion.

MHI Show Pro
Managing Leads and Measuring Results Webinar Workbook
Copyright 2016. Competitive Edge and MHI. All rights reserved.
No portion of this workbook may be reproduced without permission of Competitive Edge.
For questions or permission call 800-700-6174 or 704-814-7355.
How to Set Realistic Lead Goals
Exhibit Interaction Capacity formula calculates the number of face-to-face interactions you can execute in your exhibit.
Use Exhibit Interaction Capacity formula to Set Lead Goals:
Example Participant
# of exhibiting hours 26 26
# of booth staff x 2* x_______
Total staff hours 52 ________
Interactions/hr/staffer x 4** x_______
Total target interactions 208 ________
% of visitors to lead x.25 x_______
Lead goal 52 ________
* 50 sq. feet/staffer ** 3/conservative, 4/moderate, 5/aggressive
It’s About What’s Next!
Clarity of and commitment to _________________________ are critical leverage points to
improve lead quality… Ask and ye shall receive!
Determine the Best Information to Capture to Qualify Leads
* Typical information areas might include:
Email Address
Product Interest & Level of Interest
Buying Role and/or Influence
Evaluation and/or Decision Team
Competitors Buying From or Looking At
Purchase Timeframe or Season
Next Action Step
Other?
* Customize your lead capture device to make sure you get this information!

MHI Show Pro
Managing Leads and Measuring Results Webinar Workbook
Copyright 2016. Competitive Edge and MHI. All rights reserved.
No portion of this workbook may be reproduced without permission of Competitive Edge.
For questions or permission call 800-700-6174 or 704-814-7355.
Four Generations of Lead Capture Devices
1. Collect business cards
2. Use a paper lead form
3. Use show lead capture system
Use and customize with qualifiers
4. Buy a universal lead capture system
Be sure to discuss with show’s lead capture
company to determine how to capture encrypted data
How to Develop an Opportunity Card

MHI Show Pro
Managing Leads and Measuring Results Webinar Workbook
Copyright 2016. Competitive Edge and MHI. All rights reserved.
No portion of this workbook may be reproduced without permission of Competitive Edge.
For questions or permission call 800-700-6174 or 704-814-7355.
Develop an Easy-to-Apply Lead Grading System
Assign a Lead Captain
Responsibilities of the Lead Captain:
1. ____________ and communicates lead goal.
2. Ensures availability and functionality of capture devices.
3. __________________ lead goals versus actual.
4. Acknowledges performance & corrects non-performance.
5. Ensures data entry into CRM system and routing.
6. Possibly, the point of contact for reporting.
Build a Culture of Lead Reporting
1. Create Culture of Reporting
Communicate Cost Per Lead.
Inform or cc lead recipient’s manager.
Use ______________ to kick-off the program.
2. Hold End of Shift or Day Lead Review Meeting
3. Close of Show Report
Number of leads captured versus goal.
Cost Per Lead.
Number of Leads and % by Priority Code.
Potential revenue value of leads.

MHI Show Pro
Managing Leads and Measuring Results Webinar Workbook
Copyright 2016. Competitive Edge and MHI. All rights reserved.
No portion of this workbook may be reproduced without permission of Competitive Edge.
For questions or permission call 800-700-6174 or 704-814-7355.
How to Get Your Sales Team and/or Distributors
to Support Your Lead Management Process
1. Communicate how you are improving lead ________________
2. Calculate and share your Cost Per Lead
3. Set three firm lead reporting dates
4. Consider contests to build accountability
5. Consider charging for leads to dealers/distributors and independent reps who don’t follow-
up or report
Best Practices for Lead Response Management
1. Speed of response – fast information delivery equals higher conversion rate
2. Best days to make follow-up calls: Wednesday and Thursday
3. Best times to make follow-up calls: Between _____ pm and ______ pm
4. Average follow-up stops after two attempts.
5. Persistence – by making a few more call attempts, you can increase contact and conversion
rate by 70%
Source: Harvard Business Review
Use Follow-Up Techniques to “Wow”
and Be There When They’re Ready to Buy
1. Prepare lead follow-up plan by priority _____________ show.
2. Follow-up FAST or in line with visitor request.
3. Plan for 6 to 12 touches over the next 3 to 6 months.
4. Integrate multiple media:
Telephone
In-person visits
Social media

MHI Show Pro
Managing Leads and Measuring Results Webinar Workbook
Copyright 2016. Competitive Edge and MHI. All rights reserved.
No portion of this workbook may be reproduced without permission of Competitive Edge.
For questions or permission call 800-700-6174 or 704-814-7355.
Use Follow-Up Techniques to “Wow”
and Be There When They’re Ready to Buy
5. Deliver real value… don’t just sell!
Social media posts and groups
_________________
Product samples
Promotional products (refillable)
Testimonial letters and videos
Tradeshow Performance Metrics
1. Exhibit Interaction Capacity/Utilization
2. Exhibit Attraction Efficiency
3. Cost Per Interaction (CPI)
4. Cost Per Lead (CPL)
5. Lead Goal, Quantity and Quality
6. Potential Value of Leads Captured
7. Hard Dollar ROI
8. Soft Dollar ROI
Example Participant
1. Exhibit Interaction Capacity/Utilization
Exhibiting Hours 26 _____________
Times Full-Time Exhibit Staff 2 _____________
Total Staff Hours 52 _____________
Times Interactions per Hour per Staffer 3-5 * _____________
Exhibit Interaction Capacity 156-260 _____________
Actual # of Exhibit Interactions 185
Divide by Exhibit Interaction Capacity 208 _____________
Exhibit Capacity Utilization 89% _____________
Target: 80 to 100%
* 3 conservative/4 moderate/5 aggressive

MHI Show Pro
Managing Leads and Measuring Results Webinar Workbook
Copyright 2016. Competitive Edge and MHI. All rights reserved.
No portion of this workbook may be reproduced without permission of Competitive Edge.
For questions or permission call 800-700-6174 or 704-814-7355.
Tradeshow Performance Metrics
Example Participant
2. Exhibit Attraction Efficiency
Actual # of Exhibit Interactions 185 _____________
Divide by Profile Matches in
Show Audience 500 _____________
Company Type, Job function/Title, Geography
Exhibit Attraction Efficiency 37% _____________
Benchmark: 45% (Source: Exhibit Surveys)
3. Cost Per Interaction (CPI)
Total Show Investment $15,000 $____________
Divide by # of Interactions 185 _____________
Cost Per Interaction $81 $____________
Average cost of field sales call: $596 (Source: CEIR, 2009)
4. Cost Per Lead (CPL)
Total Show Investment $15,000 $____________
Divide by # Leads 50 _____________
Cost Per Lead $300 $____________
Average cost of a B2B tradeshow lead:
$165 (Source: Exhibitor Magazine’s 2015 Sales Lead Survey)
$283 (Source: Exhibit Surveys, 2013)
5. Lead Goal, Quantity and Quality
Lead Goal 52 _____________
Total Leads Captured 50 _____________
Achievement 96% of goal _____________
% - A Leads 23 - 45% _____________
% - B Leads 20 - 40% _____________
% - C Leads 7 - 15% _____________
6. Potential Value of Leads/ROI
Total # A Leads 23 _____________
Times Average Sale Amount $5,000 $____________
Potential Lead Value $115,000 $____________
Divided by Show Investment $15,000 $____________
Soft Dollar ROI $8 to $1 $____________

MHI Show Pro
Managing Leads and Measuring Results Webinar Workbook
Copyright 2016. Competitive Edge and MHI. All rights reserved.
No portion of this workbook may be reproduced without permission of Competitive Edge.
For questions or permission call 800-700-6174 or 704-814-7355.
Setting Exhibiting ROI Targets
GOOD: 1-1 payback or 100% ROI
BETTER: 3-5 payback or 300-500% ROI
BEST: As high as you can go!
Two Types of ROI
Hard Dollar ROI: _______________ received that can be credited in full or in part to the
show, typically in the form of at-show and/or post-show sales.
Can be measured in top line revenue or gross margin.
Soft Dollar ROI: ________________ received that can be quantified/expressed in numeric
terms, typically in the form of money saved.
Return on Investment HARD Dollar Gross Margin Formula & Example*
Example Participant
Revenue From At/Post Show Sales $200,000 $___________
Less Cost of Sales (30% Gross Margin) - 140,000 $___________
Gross Margin $ 60,000 $___________
Less Exhibiting Investment - 15,000 $___________
Net Exhibit Profit $ 45,000 $___________
Net Exhibit Profit $ 45,000 $___________
Divided by Exhibiting Investment $ 15,000 $___________
Equals 3 ____________
Multiplied by 100 x 100 x 100
Return on Investment 300% ROI ___________%
*These sample calculations are not a promise of a specific ROI, but simply an illustration of a method for calculating exhibiting ROI.
MHI Show Pro
Managing Leads and Measuring Results Webinar Workbook
Copyright 2016. Competitive Edge and MHI. All rights reserved.
No portion of this workbook may be reproduced without permission of Competitive Edge.
For questions or permission call 800-700-6174 or 704-814-7355.
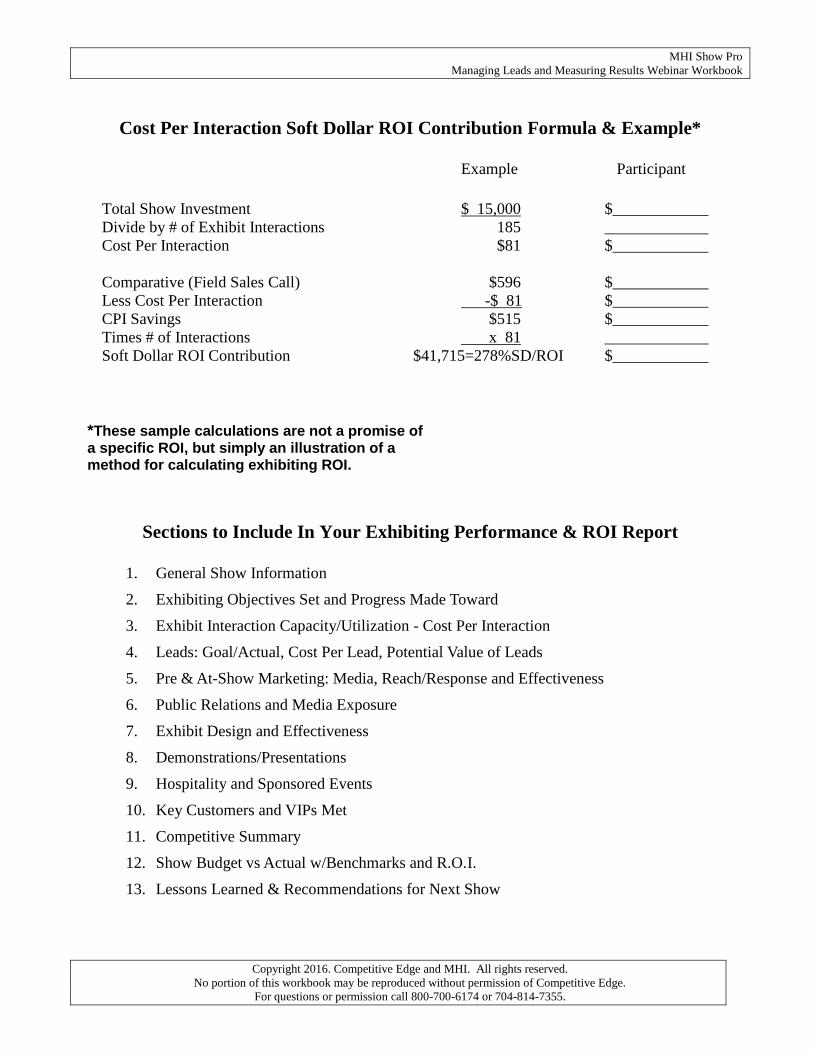
Cost Per Interaction Soft Dollar ROI Contribution Formula & Example*
Example Participant
Total Show Investment $ 15,000 $____________
Divide by # of Exhibit Interactions 185 _____________
Cost Per Interaction $81 $____________
Comparative (Field Sales Call) $596 $____________
Less Cost Per Interaction -$ 81 $____________
CPI Savings $515 $____________
Times # of Interactions x 81 _____________
Soft Dollar ROI Contribution $41,715=278%SD/ROI $____________
Sections to Include In Your Exhibiting Performance & ROI Report
1. General Show Information
2. Exhibiting Objectives Set and Progress Made Toward
3. Exhibit Interaction Capacity/Utilization - Cost Per Interaction
4. Leads: Goal/Actual, Cost Per Lead, Potential Value of Leads
5. Pre & At-Show Marketing: Media, Reach/Response and Effectiveness
6. Public Relations and Media Exposure
7. Exhibit Design and Effectiveness
8. Demonstrations/Presentations
9. Hospitality and Sponsored Events
10. Key Customers and VIPs Met
11. Competitive Summary
12. Show Budget vs Actual w/Benchmarks and R.O.I.
13. Lessons Learned & Recommendations for Next Show
*These sample calculations are not a promise of a specific ROI, but simply an illustration of a method for calculating exhibiting ROI.

MHI Show Pro
Managing Leads and Measuring Results Webinar Workbook
Copyright 2016. Competitive Edge and MHI. All rights reserved.
No portion of this workbook may be reproduced without permission of Competitive Edge.
For questions or permission call 800-700-6174 or 704-814-7355.
What were the three most important ideas you learned in this webinar?
1. ________________________________________________________
2. ________________________________________________________
3. ________________________________________________________
MHI Commitment to Exhibitor Value, Knowledge & Success
ShowPro Pre-show Exhibitor Webinar Series
– Fast Track to MODEX Exhibiting Success
* Selective Attraction: November 17, 2015
* Managing the Visitor Experience: January 5, 2016
* Managing Leads & Measuring Results: February 16, 2016
ShowPro Live Exhibitor Workshop held in Chicago on December 9, 2015
http://www.modexshow.com/showpro.aspx


