
Measuring key components of executive function in Down syndrome
Liz Smith & Chris Jarrold

Dementia in Down syndrome
• Individuals with Down syndrome (DS) are at a greatly increased risk of developing dementia, specifically early onset Alzheimer’s disease (AD), (Crayton et al., 1998)
• The onset of dementia can occur exceptionally early in DS

Chromosome 21
• Estimated 1.5-2% of humans’ genetic material found on chromosome 21
• Including the amyloid precursor protein gene (APP)
• Amyloid-beta forms the plaques seen in the brains of people with Alzheimer's disease

Chromosome 21
• The gene DYRK1A is also located on chromosome 21
• DYRK1A adds phosphate groups to tau: this has a role in producing the tangles seen in the brains of those with AD
• Amyloid-beta leads to more activity of DYRK1A. As people with Down syndrome produce more amyloid-beta, DYRK1A will become more active

Dementia in Down syndrome
• Neuropathological signs of AD, are thought to be present in the brains of all individuals with DS beyond the age of 40 (Cork, 1990)
• Clinical signs of AD are present in only a proportion of these individuals

Alzheimer’s disease: Behavioural traits
• Individuals without DS who have AD display various cognitive difficulties, such as memory and attentional problems.
• AD also affects their behaviour and mood, with some individuals experiencing depression, among other symptoms (Hodges, Salmon, & Butters, 1992; Perry & Hodges, 1999; Rovner, Broadhead, Spencer, Carson, & Folstein, 1989).

Executive function (EF)
• EF decline is one of the most consistent early signs of dementia in individuals with Down syndrome (Ball et al., 2006; Das & Mishra, 1995)
• A number of different tasks are used to test the various components of executive functions; such differences can lead to different results.
• Findings mixed (e.g., Borella et al., 2013;
Lanfranchi et al., 2010; Pennington et al.,
2003; Rowe et al., 2006).
• Verbal vs visual particularly relevant

• It is vital to obtain reliable baseline measures of executive functions for individuals with Down syndrome such that it is possible to determine meaningful decline

• There are various components of executive function, e.g.,
Components of Executive function
Updating in working memory
Shifting between different tasks
Inhibition of prepotentresponses
Miyake et al (2000)
• Other perspectives linked to EF’s such as proactive and reactive control

Methodology to extract measures of 3 components of EF using one simple framework
Allowing for controlled comparisons of performance across different components of EF
Memory: maintain the task goals/rules
Inhibition: prevent inappropriate responses to external stimuli
Temporal aspect: Moving from reactive control to proactive control over time (anticipating change).

Updating in working memory
No load

Updating in working memory
Low load
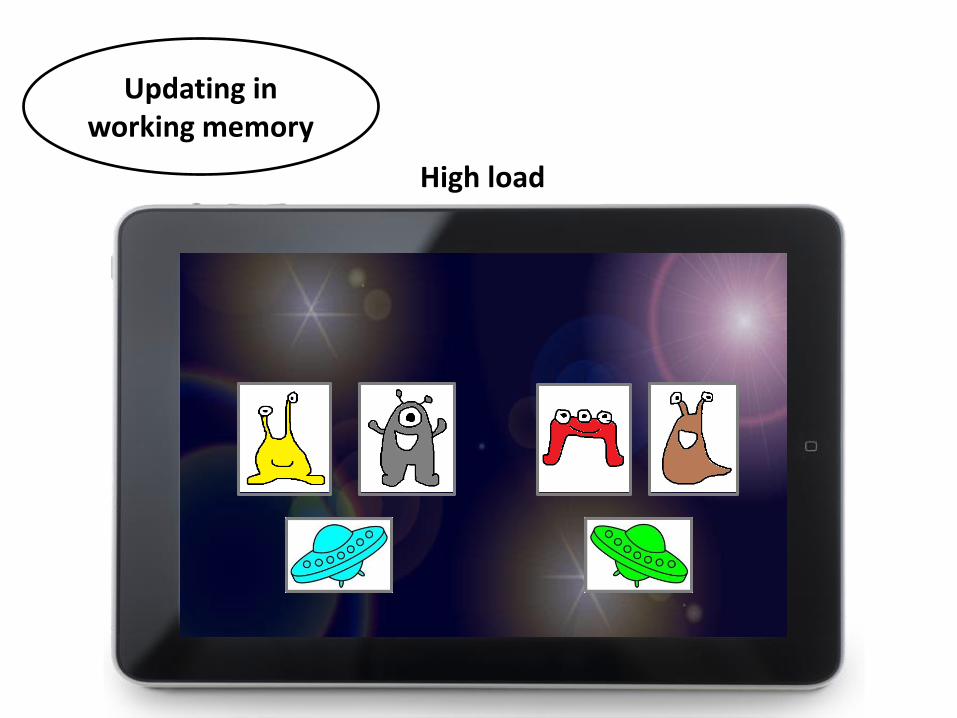
Updating in working memory
High load

Low load: congruent locationHigh load: incongruent location
Button A
Button B
Inhibition of prepotentresponses

• Delay between the onset of the stimuli and the appearance of the response buttons
• Able to respond immediately (Reactive)
• Or forced to delay response (proactive)
Reactive and Proactive control

• Can individuals with Down syndrome complete this task?
• Does this task obtain independent measures of each component?
• Differences between those with vs without Down syndrome?
• Are these measures reliable for assessing changes over time in the Down syndrome population?
Research Questions

Down syndrome group aged 25-45, N = 16
Mental age matched control group aged 6-11, N = 16
Retest to determine reliability of measure as baseline
4 weeks

Results: Accuracy
Memory: p < .01, Inhibition: p = .051, population: p = .230; Delay: p < .01;
Memory x population: p < .01; Memory x delay x population: p < .01
Immediate responses Proactive responses
60
65
70
75
80
85
90
95
100
105
Cong Incong Cong Incong Cong Incong
No load Low load High load
Mean DS Mean TD
60
65
70
75
80
85
90
95
100
105
Cong Incong Cong Incong Cong Incong
No load Low load High load
Mean DS Mean TD

Results: RTs
0.4
0.6
0.8
1
1.2
1.4
1.6
1.8
Cong Incong Cong Incong Cong Incong
No load Low load High load
Mean DS Mean TD
Memory: p < .01, Inhibition: p < .05, Delay: p < .01, Population: p = .085; Memory x delay: p < .01, Population x delay: p < .01
0.4
0.6
0.8
1
1.2
1.4
1.6
1.8
Cong Incong Cong Incong Cong Incong
No load Low load High load
Mean DS Mean TD
Immediate responses Proactive responses

• Are these measures reliable for assessing changes over time in the Down syndrome population?

Test-Retest Reliability
-0.2
-0.1
0
0.1
0.2
0.3
0.4
0.5
0.6
-0.3 -0.2 -0.1 0 0.1 0.2 0.3 0.4 0.5 0.6
Tim
e 2
Time 1
Inhibition cost
r = .83, p < .01

Test-Retest Reliability
-0.6
-0.4
-0.2
0
0.2
0.4
0.6
0.8
1
-0.8 -0.6 -0.4 -0.2 0 0.2 0.4 0.6 0.8 1 1.2
Tim
e 2
Time 1
memory cost (high load-low load)
r = .62, p = .01

Test-Retest Reliability
0
0.1
0.2
0.3
0.4
0.5
0.6
0.7
0 0.1 0.2 0.3 0.4 0.5 0.6 0.7 0.8
Tim
e 2
Time 1
No delay - delay cost
r = .48, p = .06

Summary (1)
• Individuals with Down syndrome are able to complete this task
• Overall difference between populations does not reach sig.
• Increases in memory load, inhibitory load, and temporal demands, lead to significant increases in RT and decreases in accuracy, for both populations
• Thus, the expected effects of each of these manipulations can be detected with this framework

Summary (2)
• Memory does not appear to be independent from the temporal manipulation, with memory load influencing the extent to which individuals experienced accuracy and RT benefits from the preparation time
• However, inhibition did appear to be an independent component
• Most importantly: Framework appears to capture reliable individual differences in those with DS for each measure extracted

Conclusion
These findings so far suggest these measures have the potential to capture reliable individual differences in executive function. This framework could be further adapted to provide a simplified, fast baseline screening measure to assess decline in executive functions in those with DS


