Measure 37 and the Economic Illusions of Takings
William Jaeger
Department of Agricultural and Resource EconomicsOregon State University

Measure 37 as passed in 2004
• If enactment/enforcement of a land use regulation has the effect of reducing a property’s value: – Government must pay compensation– Or waive the offending regulation
• Determining if a land use regulation has reduced a property’s value imposes an enormous burden on government.

Hypothetical Illustration used by Oregonians In Action in state Supreme Court brief
$2500 $1500 $500
Before (Regulation enacted) After
Regulated land (use A only)
Unregulated land (use B)

Hypothetical Illustration -- more plausible version
$2500 $1500 $500
Before (Regulation enacted) After
Regulated land (use A only)
Unregulated land (use B)

Hypothetical Illustration -- another plausible version
$2500 $1500 $500
Before (Regulation enacted) After
Regulated land (use A only)
Unregulated land (use B)

Hypothetical Illustration – one more plausible version
$2500 $1500 $500
Before (Regulation enacted) After
Regulated land (use A only)
Unregulated land (use B)
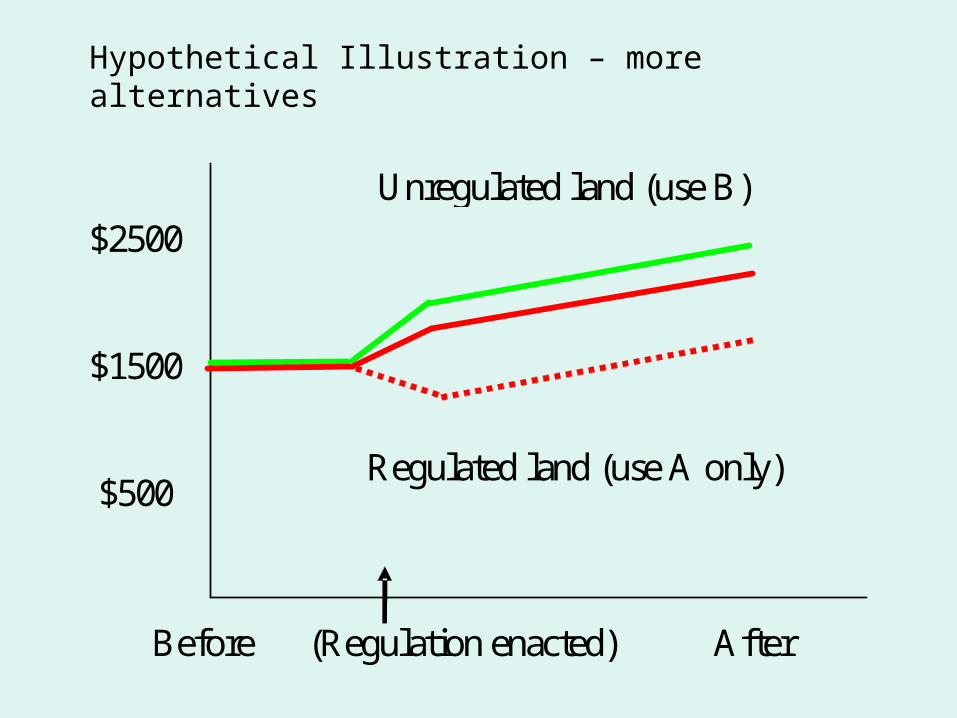
Hypothetical Illustration – more alternatives
$2500 $1500 $500
Before (Regulation enacted) After
Regulated land (use A only)
Unregulated land (use B)
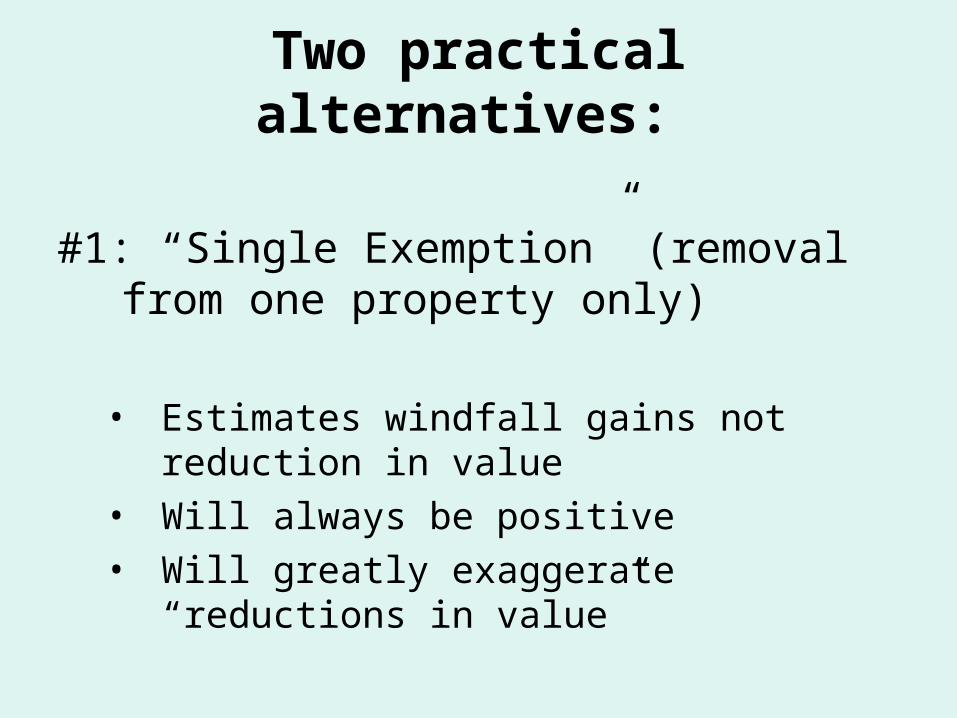
Two practical alternatives:
#1: “Single Exemption” (removal from one property only)
• Estimates windfall gains not reduction in value
• Will always be positive• Will greatly exaggerate “reductions in value”


Taking Portland claims at face value:
If you removed these regulations: • Developed area grows to 3.6 times current size
• 650,000 new acres are developed
• New developed land bought at $40,000/acre
• Total new land value: $26 billion

Alternative method:
#2 “Before-and-After” (compare value before with value after)
• Based on valid economic reasoning• Will produce “correct result” most of the time• Will produce incorrect result in some cases
• Solution? -- “Just-before and just-after”

“Our planning system lowers the value of private property in Oregon by $5.4 billion a year.”
– Oregonians in Action, 2004
Over 25 years, that would add up to
losses of $5000/acre
Surely that would be observable in data
on land values in Oregon!

Empirical Study
• Samples of vacant parcels of land – in three Oregon counties, two Washington counties
• Traced land values back in time to before land use regulations (1970-2002)
• Compared trends for regulated, unregulated lands within counties, between states


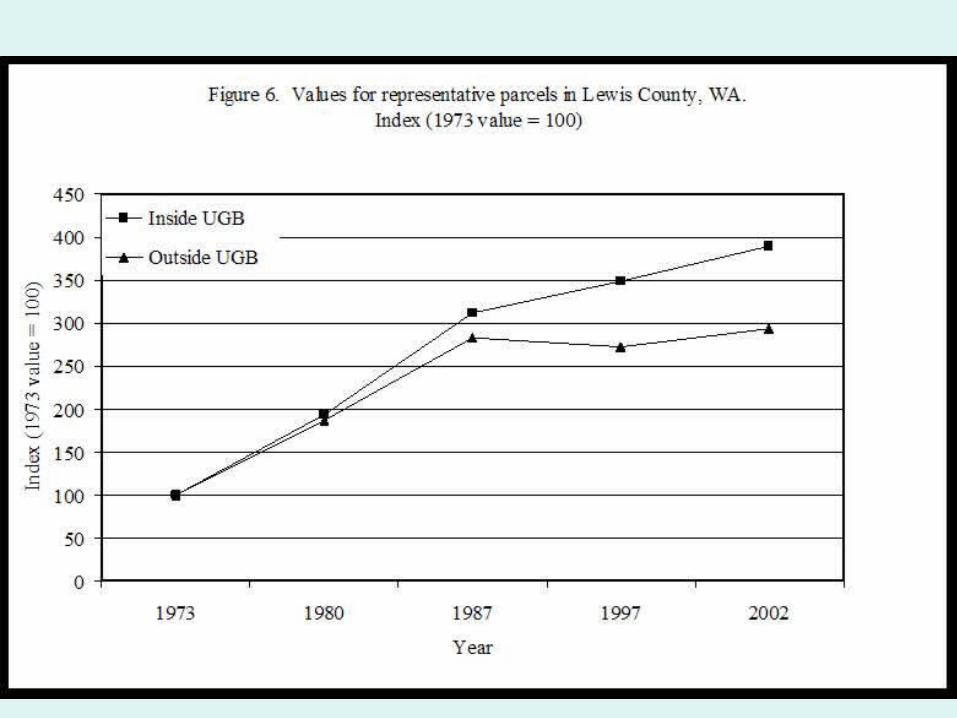

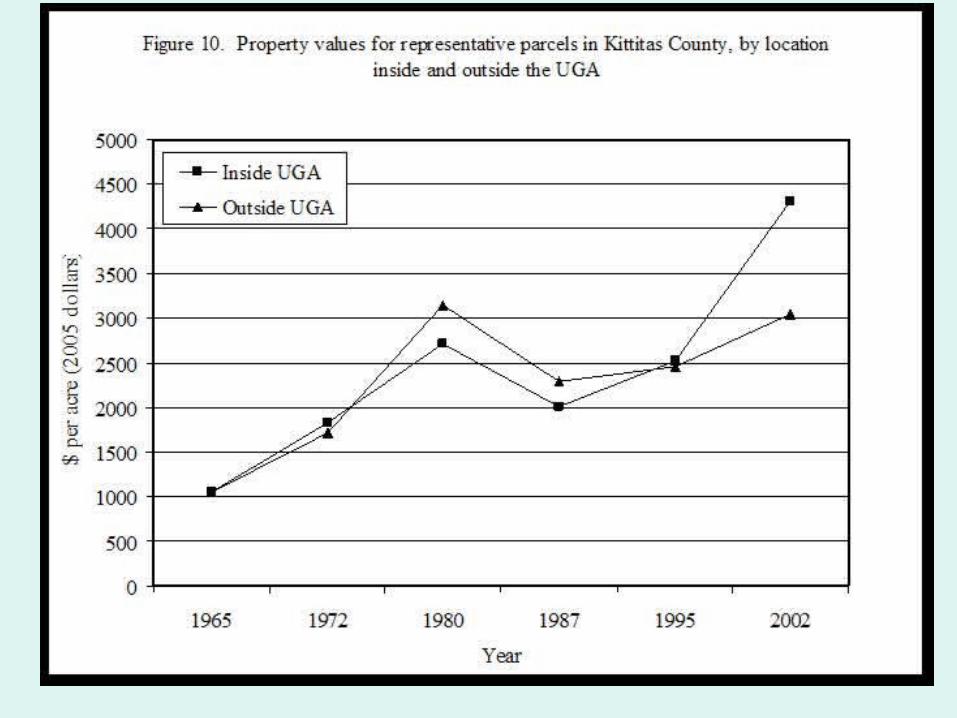
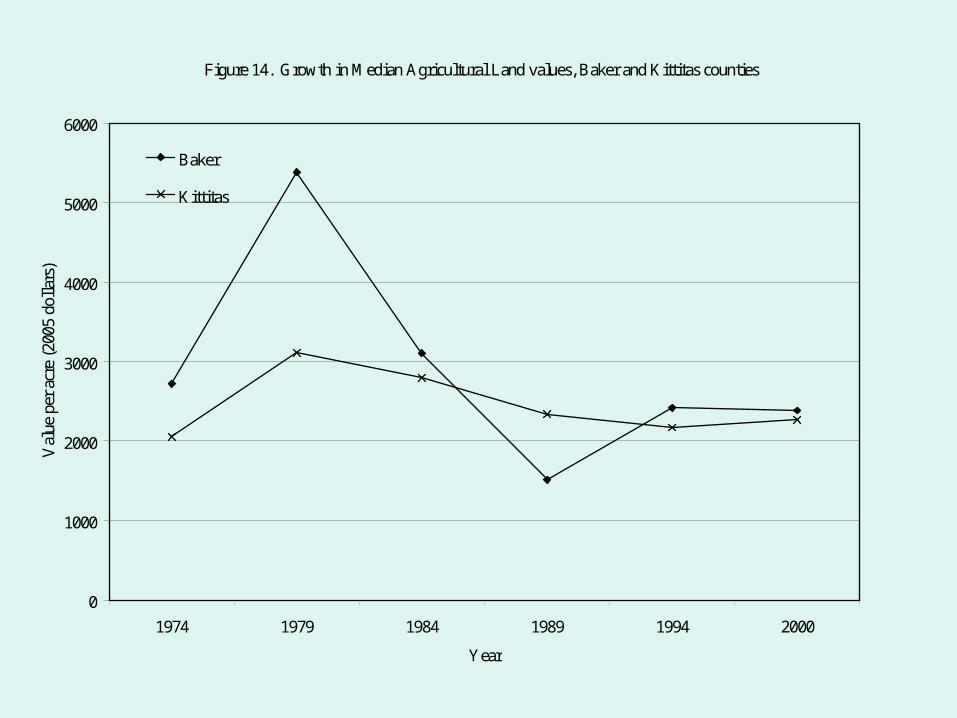
Figure 14. Growth in Median Agricultural Land values, Baker and Kittitas counties
0
1000
2000
3000
4000
5000
6000
1974 1979 1984 1989 1994 2000
Year
Val
ue p
er a
cre
(200
5 do
llar
s)
Baker
Kittitas

Summary• The “single exemption” approach to Measure 37 is not a
valid way to determine “reduction in value.” It will indicate a reduction in value even if none has occurred.
• This same “single exemption” way of thinking may be the reason many landowners believe they have been harmed.
• Data on land value trends to not support the claims that Oregon’s land use system has systematically reduced the value of lands subject to these regulations.
• Oregon’s land use system, has however, created many tempting opportunities for “windfall” gains for those who can secure waivers.


