
T H I R DQ U A R T E R
2011 CHICAGOMARKET OVERVIEW

The Chicago Market Overv iew is publ ished quar ter ly by MB Real Estate.
To obta in addi t iona l copies or for fur ther in format ion, p lease contact :
KRYSTA BAVLSIKManager of Research and Analy t ics
or JACK GAVINResearch Coord inator
181 West Madison Street , Su i te 4700 Chicago, I l l ino is 60602
(312) 726-1700
w w w . m b r e s . c o m
SECTION TWO
CHICAGO CENTRAL BUSINESS DISTRICT
02 CBD Executive Summary
SUPPLY
03 New Developments04 Sublease Space05 Large Blocks of Direct Availability
DEMAND
06 Vacancy Rates07 Large Deals08 Absorption
FEATURES
09 Lease Comparables10 Investment Sales11 Forecast12 Submarket Map13 Market Statistics
TABLE OF CONTENTS
SECTION THREE
SUBURBAN CHICAGO
14 Suburban Chicago Executive Summary
SUPPLY
15 New Developments16 Sublease Space17 Large Blocks of Direct Availability
DEMAND
18 Vacancy Rates19 Large Deals20 Absorption
FEATURES
21 Gross Asking Rents22 Investment Sales23 Forecast24 Submarket Map25 Market Statistics
SECTION FOUR
ADDITIONAL INFORMATION
SECTION ONE
CHICAGO ECONOMY
01 Economic Analysis
26 Glossary27 About MB Real Estate
CHICAGO
THIRD QUARTER
2011MARKET OVERVIEW

CH
ICA
GO
EC
ON
OM
IC A
NA
LYS
IS
1T H I R D Q U A R T E R 2 0 1 1 | C H I C A G O M A R K E T O V E R V I E W
SECTION ONE
CHICAGO ECONOMYECONOMIC ANALYSIS
The Chicago-Joliet-Naperville, IL-IN-WI Metropolitan Statistical Area (MSA) recovery continues, though it lags the national recovery.While the MSA is the business center of the Midwest, has a well-educated workforce, and has been recently successful in attractingtech startups, it is highly dependent on slow-growing and mature industries. A survey by Development Counsellors Internationalranks Illinois third in terms of worst business climate in the U.S. among states, with high tax rates affecting corporate relocationsindefinitely.
The obstacles facing the nation could be detrimental. According to Moody's Analytics' chief economist Mark Zandi, the probabilityof a U.S. recession in the next six to 12 months is at 40 percent. The S&P 500 fell 14 percent in the third quarter. The governmentis discussing a third round of stimulus. The fallout of Europe’s debt crisis threatens to spill into the U.S. While most of these factorsare based on fear, their influence on confidence is crucial to the Chicago CBD and Suburban office markets.
Cash accounted for a historically high 7.1 percent of all public company assets as of the end of June according to the FederalReserve. Companies are unwilling to invest, but their strong reserves may have kept them from shedding office space quickly.Excess cash is one positive among the headlines because companies are in a good position to weather economic storms.
National economic news may force employment losses to impact the office marketEconomic headlines have finally caught up to the employment reality that the MBRE Chicago Market Overview has been bringingto light over the last year: the area is not creating enough jobs to sustain the recovery that has mounted in the Central BusinessDistrict (CBD). Total employment in the Chicago MSA declined 7.5 percent peak-to-trough and has only rebounded 0.8 percent sincehitting its low in December 2009. Employment has posted a much larger decline than the last recession with a slower rebound.While Suburban Chicago has shed occupancy at its typical rapid pace, the CBD has been resilient.
While the economy is now the biggest risk to the office market, several other factors weigh heavily on its future performance.Underutilized space, often termed “shadow vacancy,” remains a risk as evidenced by many tenants’ plans to lessen their footprintupon renewal. High tax rates in Illinois will influence corporate location decisions. With confidence evaporating, the positiveexpansion news that had a domino effect on the CBD market may disappear.
MB Real Estate’s baseline office forecast still expects a substantial decline in occupancy over several upcoming quarters to correlatewith job losses. An alternative scenario is that occupancy will be volatile but still trend negatively over time in the CBD, while lossesin Suburban Chicago will be steadily negative. An optimistic scenario points to recent positive absorption in the CBD as a turningpoint, where rental rates have fallen enough to warrant expansion for some tenants before it is justified by employee headcountand waning confidence will not have an impact.
CHICAGO EMPLOYMENT WELL BELOW PEAK AND FAILING TO REBOUND QUICKLYSources: MBRE Research, BLS, Chicago Sun-Times, Crain’s Chicago Business, Financial Times, Moody’s Economy.com
CE
NTR
AL B
US
INE
SS
DIS
TRIC
T
2
SECTION TWO
CENTRAL BUSINESS DISTRICTEXECUTIVE SUMMARY
CBD VACANCY AND YEAR-TO-DATE ABSORPTION SUMMARY
Direct Vacancy3Q2011
AChange from
2Q2011B
Change from 2Q2011
CChange from
2Q2011Total
Change from 2Q2011
Central Loop 9.7% -0.1% 16.8% -1.1% 16.8% 0.4% 14.2% -0.3%East Loop 21.9% -5.3% 24.1% 2.2% 13.9% 0.1% 19.9% 0.1%N. Michigan Ave. 20.0% -0.1% 24.4% 0.4% 13.2% 0.0% 19.2% 0.0%River North 16.4% 0.7% 7.0% -0.5% 11.9% -1.1% 12.0% -0.3%South Loop 14.7% 0.8% 25.3% 0.4% 20.6% 0.5%West Loop 14.8% -0.1% 12.7% -0.1% 17.1% -0.2% 14.6% -0.2%CBD Chicago Total 14.5% -0.5% 17.6% 0.1% 15.2% -0.1% 15.7% -0.2%
Net Absorption3Q2011
A B C Total
Central Loop 17,509 177,074 (41,196) 1153,387
East Loop 219,660 (215,231) (26,241) ((21,812)
N. Michigan Ave. 5,098 (7,925) (16,754) ((19,582)
River North (31,655) 9,101 54,712 332,157
South Loop (8,286) (20,039) ((28,325)
West Loop 88,773 15,016 (18,802) 884,986
CBD Chicago Total 291,099 (21,965) (68,321) 200,813
Numbers in parentheses are negative
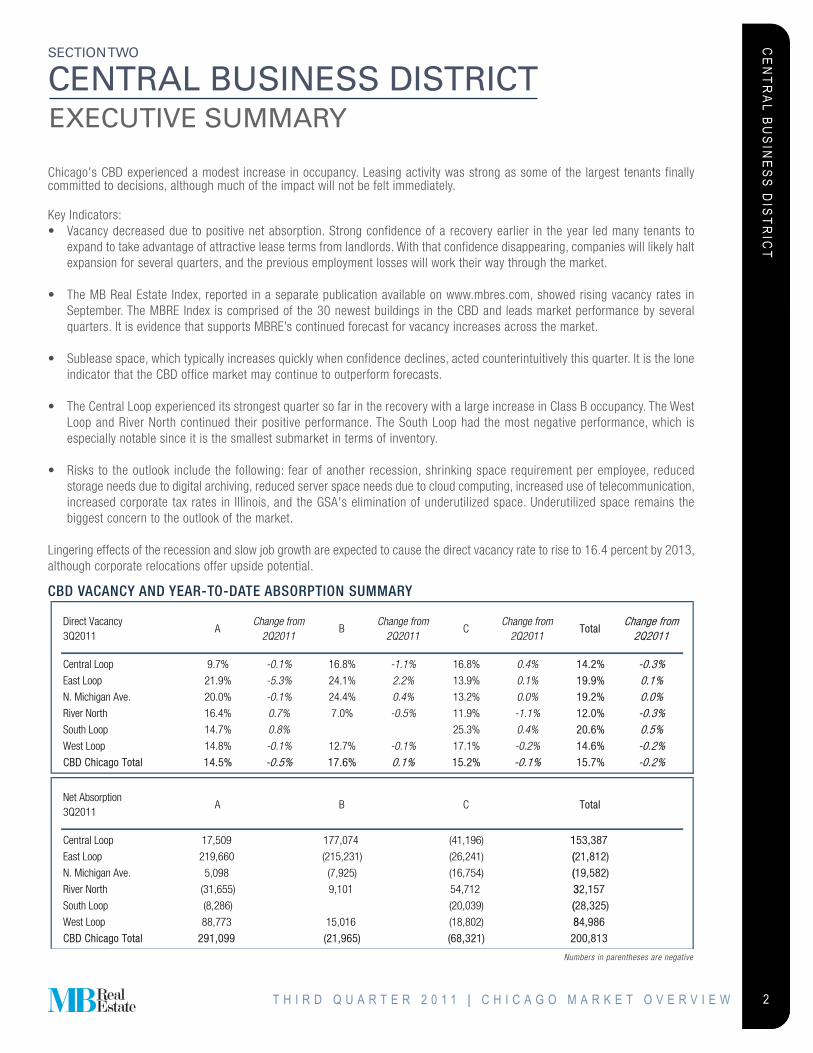
Chicago's CBD experienced a modest increase in occupancy. Leasing activity was strong as some of the largest tenants finallycommitted to decisions, although much of the impact will not be felt immediately.
Key Indicators:• Vacancy decreased due to positive net absorption. Strong confidence of a recovery earlier in the year led many tenants to
expand to take advantage of attractive lease terms from landlords. With that confidence disappearing, companies will likely haltexpansion for several quarters, and the previous employment losses will work their way through the market.
• The MB Real Estate Index, reported in a separate publication available on www.mbres.com, showed rising vacancy rates inSeptember. The MBRE Index is comprised of the 30 newest buildings in the CBD and leads market performance by severalquarters. It is evidence that supports MBRE’s continued forecast for vacancy increases across the market.
• Sublease space, which typically increases quickly when confidence declines, acted counterintuitively this quarter. It is the loneindicator that the CBD office market may continue to outperform forecasts.
• The Central Loop experienced its strongest quarter so far in the recovery with a large increase in Class B occupancy. The WestLoop and River North continued their positive performance. The South Loop had the most negative performance, which isespecially notable since it is the smallest submarket in terms of inventory.
• Risks to the outlook include the following: fear of another recession, shrinking space requirement per employee, reducedstorage needs due to digital archiving, reduced server space needs due to cloud computing, increased use of telecommunication,increased corporate tax rates in Illinois, and the GSA's elimination of underutilized space. Underutilized space remains thebiggest concern to the outlook of the market.
Lingering effects of the recession and slow job growth are expected to cause the direct vacancy rate to rise to 16.4 percent by 2013,although corporate relocations offer upside potential.
T H I R D Q U A R T E R 2 0 1 1 | C H I C A G O M A R K E T O V E R V I E W
CE
NTR
AL B
US
INE
SS
DIS
TRIC
T
3
SU
PP
LYNEW DEVELOPMENTSDevelopment push has ebbed, but prior projects are still searching for anchor tenants
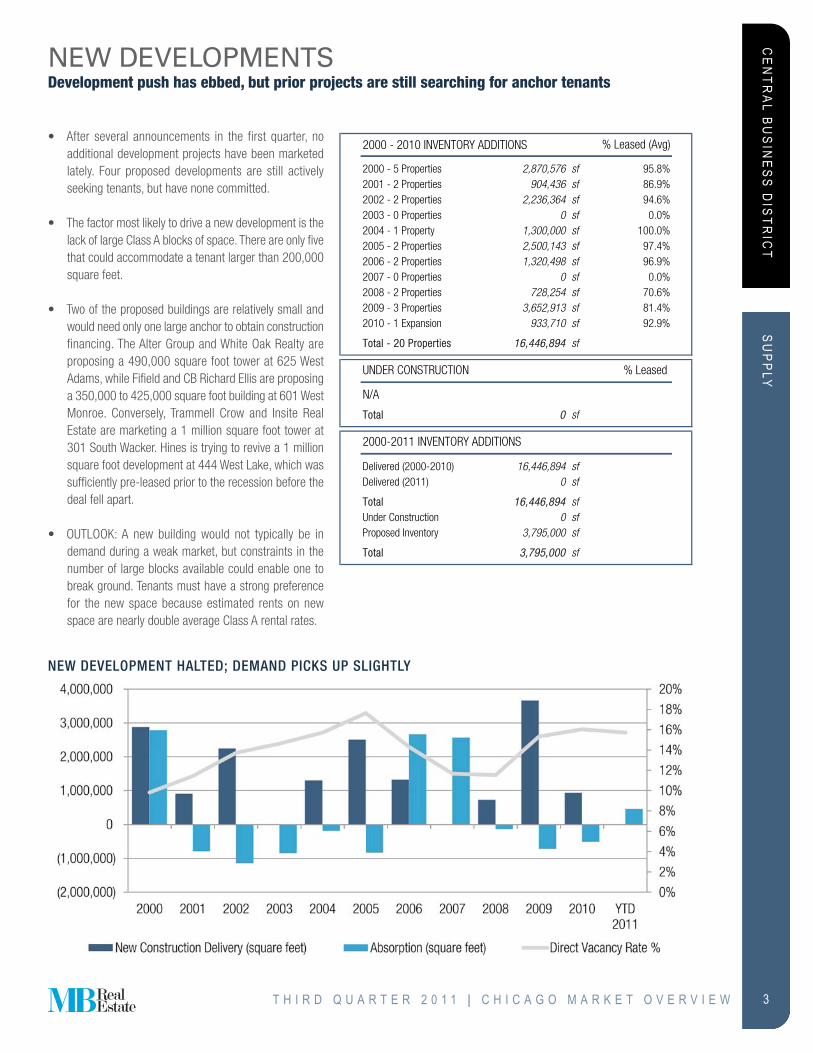
• After several announcements in the first quarter, noadditional development projects have been marketedlately. Four proposed developments are still activelyseeking tenants, but have none committed.
• The factor most likely to drive a new development is thelack of large Class A blocks of space. There are only fivethat could accommodate a tenant larger than 200,000square feet.
• Two of the proposed buildings are relatively small andwould need only one large anchor to obtain constructionfinancing. The Alter Group and White Oak Realty areproposing a 490,000 square foot tower at 625 WestAdams, while Fifield and CB Richard Ellis are proposinga 350,000 to 425,000 square foot building at 601 WestMonroe. Conversely, Trammell Crow and Insite RealEstate are marketing a 1 million square foot tower at301 South Wacker. Hines is trying to revive a 1 millionsquare foot development at 444 West Lake, which wassufficiently pre-leased prior to the recession before thedeal fell apart.
• OUTLOOK: A new building would not typically be indemand during a weak market, but constraints in thenumber of large blocks available could enable one tobreak ground. Tenants must have a strong preferencefor the new space because estimated rents on newspace are nearly double average Class A rental rates.
NEW DEVELOPMENT HALTED; DEMAND PICKS UP SLIGHTLY
2000 - 2010 INVENTORY ADDITIONS % Leased (Avg)
2000 - 5 Properties 2,870,576 sf 95.8%2001 - 2 Properties 904,436 sf 86.9%2002 - 2 Properties 2,236,364 sf 94.6%2003 - 0 Properties 0 sf 0.0%2004 - 1 Property 1,300,000 sf 100.0%2005 - 2 Properties 2,500,143 sf 97.4%2006 - 2 Properties 1,320,498 sf 96.9%2007 - 0 Properties 0 sf 0.0%2008 - 2 Properties 728,254 sf 70.6%2009 - 3 Properties 3,652,913 sf 81.4%2010 - 1 Expansion 933,710 sf 92.9%
Total - 20 Properties 16,446,894 sf
UNDER CONSTRUCTION % Leased
N/A
Total 0 sf
2000-2011 INVENTORY ADDITIONS
Delivered (2000-2010) 16,446,894 sfDelivered (2011) 0 sf
Total 16,446,894 sfUnder Construction 0 sfProposed Inventory 3,795,000 sf
Total 3,795,000 sf
T H I R D Q U A R T E R 2 0 1 1 | C H I C A G O M A R K E T O V E R V I E W
CE
NTR
AL B
US
INE
SS
DIS
TRIC
T
4
SU
PP
LYSUBLEASE SPACESublease availability decreases significantly
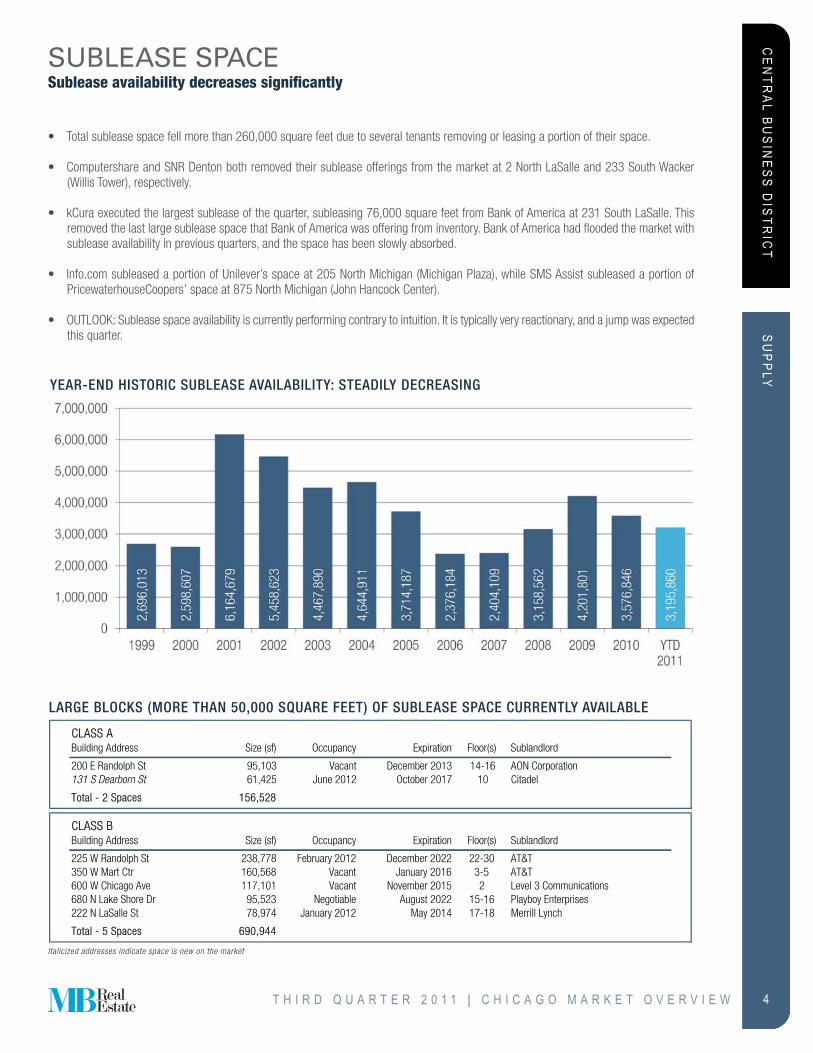
• Total sublease space fell more than 260,000 square feet due to several tenants removing or leasing a portion of their space.
• Computershare and SNR Denton both removed their sublease offerings from the market at 2 North LaSalle and 233 South Wacker(Willis Tower), respectively.
• kCura executed the largest sublease of the quarter, subleasing 76,000 square feet from Bank of America at 231 South LaSalle. Thisremoved the last large sublease space that Bank of America was offering from inventory. Bank of America had flooded the market withsublease availability in previous quarters, and the space has been slowly absorbed.
• Info.com subleased a portion of Unilever’s space at 205 North Michigan (Michigan Plaza), while SMS Assist subleased a portion ofPricewaterhouseCoopers’ space at 875 North Michigan (John Hancock Center).
• OUTLOOK: Sublease space availability is currently performing contrary to intuition. It is typically very reactionary, and a jump was expectedthis quarter.
YEAR-END HISTORIC SUBLEASE AVAILABILITY: STEADILY DECREASING
LARGE BLOCKS (MORE THAN 50,000 SQUARE FEET) OF SUBLEASE SPACE CURRENTLY AVAILABLE
CLASS ABuilding Address Size (sf) Occupancy Expiration Floor(s) Sublandlord
200 E Randolph St 95,103 Vacant December 2013 14-16 AON Corporation131 S Dearborn St 61,425 June 2012 October 2017 10 Citadel
TTotal - 2 Spaces 156,528
CLASS BBuilding Address Size (sf) Occupancy Expiration Floor(s) Sublandlord
225 W Randolph St 238,778 February 2012 December 2022 22-30 AT&T350 W Mart Ctr 160,568 Vacant January 2016 3-5 AT&T600 W Chicago Ave 117,101 Vacant November 2015 2 Level 3 Communications680 N Lake Shore Dr 95,523 Negotiable August 2022 15-16 Playboy Enterprises222 N LaSalle St 78,974 January 2012 May 2014 17-18 Merrill Lynch
Total - 5 Spaces 690,944
Italicized addresses indicate space is new on the market
T H I R D Q U A R T E R 2 0 1 1 | C H I C A G O M A R K E T O V E R V I E W
CE
NTR
AL B
US
INE
SS
DIS
TRIC
T
5
SU
PP
LYLARGE BLOCKS OF DIRECT AVAILABILITYNet change is minimal; contiguous blocks more than 200,000 square feet remain scarce
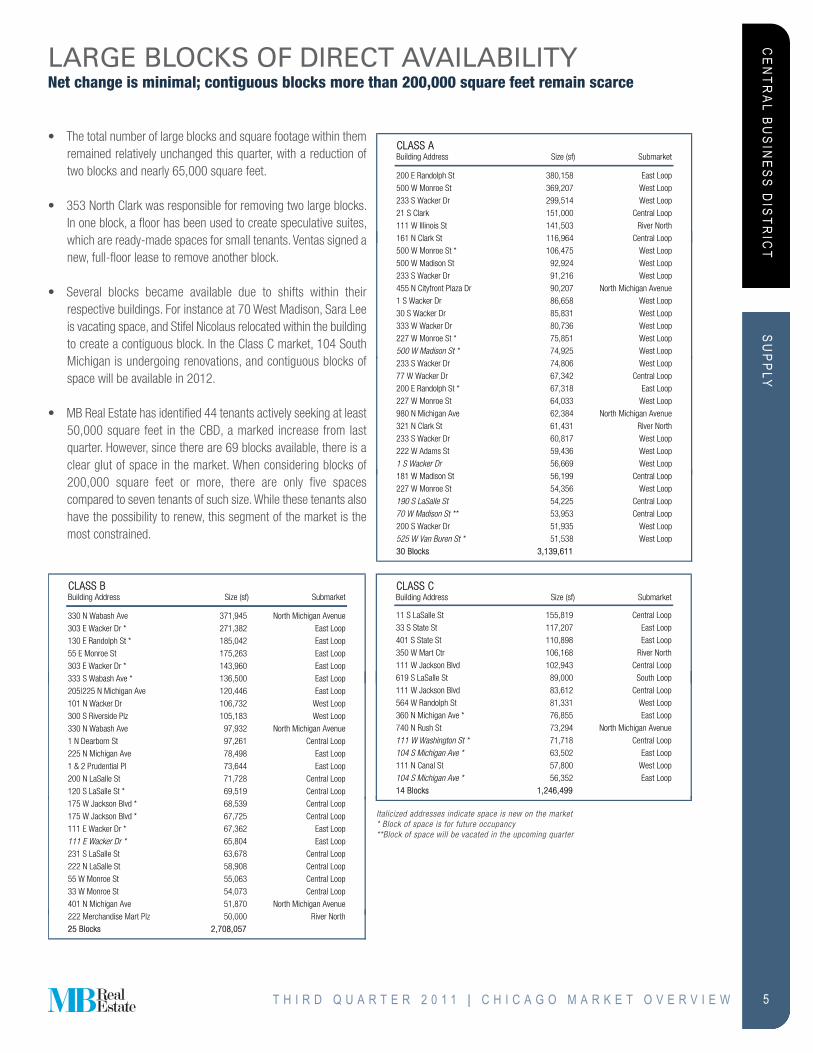
• The total number of large blocks and square footage within themremained relatively unchanged this quarter, with a reduction oftwo blocks and nearly 65,000 square feet.
• 353 North Clark was responsible for removing two large blocks.In one block, a floor has been used to create speculative suites,which are ready-made spaces for small tenants. Ventas signed anew, full-floor lease to remove another block.
• Several blocks became available due to shifts within theirrespective buildings. For instance at 70 West Madison, Sara Leeis vacating space, and Stifel Nicolaus relocated within the buildingto create a contiguous block. In the Class C market, 104 SouthMichigan is undergoing renovations, and contiguous blocks ofspace will be available in 2012.
• MB Real Estate has identified 44 tenants actively seeking at least50,000 square feet in the CBD, a marked increase from lastquarter. However, since there are 69 blocks available, there is aclear glut of space in the market. When considering blocks of200,000 square feet or more, there are only five spacescompared to seven tenants of such size. While these tenants alsohave the possibility to renew, this segment of the market is themost constrained.
CLASS BBuilding Address Size (sf) Submarket
330 N Wabash Ave 371,945 North Michigan Avenue
303 E Wacker Dr * 271,382 East Loop
130 E Randolph St * 185,042 East Loop
55 E Monroe St 175,263 East Loop
303 E Wacker Dr * 143,960 East Loop
333 S Wabash Ave * 136,500 East Loop
205|225 N Michigan Ave 120,446 East Loop
101 N Wacker Dr 106,732 West Loop
300 S Riverside Plz 105,183 West Loop
330 N Wabash Ave 97,932 North Michigan Avenue
1 N Dearborn St 97,261 Central Loop
225 N Michigan Ave 78,498 East Loop
1 & 2 Prudential Pl 73,644 East Loop
200 N LaSalle St 71,728 Central Loop
120 S LaSalle St * 69,519 Central Loop
175 W J k Bl d * 68 539 C t l L175 W Jackson Blvd * 68,539 Central Loop
175 W Jackson Blvd * 67,725 Central Loop
111 E Wacker Dr * 67,362 East Loop
111 E Wacker Dr * 65,804 East Loop
231 S LaSalle St 63,678 Central Loop
222 N LaSalle St 58,908 Central Loop
55 W Monroe St 55,063 Central Loop
33 W Monroe St 54,073 Central Loop
401 N Michigan Ave 51,870 North Michigan Avenue
222 Merchandise Mart Plz 50 000 River North222 Merchandise Mart Plz 50,000 River North
225 Blocks 2,708,057
CLASS ABuilding Address Size (sf) Submarket
200 E Randolph St 380,158 East Loop
500 W Monroe St 369,207 West Loop
233 S Wacker Dr 299,514 West Loop
21 S Clark 151,000 Central Loop
111 W Illinois St 141,503 River North
161 N Clark St 116,964 Central Loop
500 W Monroe St * 106,475 West Loop
500 W Madison St 92,924 West Loop
233 S Wacker Dr 91,216 West Loop
455 N Cityfront Plaza Dr 90,207 North Michigan Avenue
1 S Wacker Dr 86,658 West Loop
30 S Wacker Dr 85,831 West Loop
333 W Wacker Dr 80,736 West Loop
227 W Monroe St * 75,851 West Loop
500 W Madison St * 74,925 West Loop
233 S W k D 74 806 W t L233 S Wacker Dr 74,806 West Loop
77 W Wacker Dr 67,342 Central Loop
200 E Randolph St * 67,318 East Loop
227 W Monroe St 64,033 West Loop
980 N Michigan Ave 62,384 North Michigan Avenue
321 N Clark St 61,431 River North
233 S Wacker Dr 60,817 West Loop
222 W Adams St 59,436 West Loop
1 S Wacker Dr 56,669 West Loop
181 W Madison St 56 199 Central Loop181 W Madison St 56,199 Central Loop
227 W Monroe St 54,356 West Loop
190 S LaSalle St 54,225 Central Loop
70 W Madison St ** 53,953 Central Loop
200 S Wacker Dr 51,935 West Loop
525 W Van Buren St * 51,538 West Loop
30 Blocks 3,139,611
CLASS CBuilding Address Size (sf) Submarket
11 S LaSalle St 155,819 Central Loop
33 S State St 117,207 East Loop
401 S State St 110,898 East Loop
350 W Mart Ctr 106,168 River North
111 W Jackson Blvd 102,943 Central Loop
619 S LaSalle St 89,000 South Loop
111 W Jackson Blvd 83,612 Central Loop
564 W Randolph St 81,331 West Loop
360 N Michigan Ave * 76,855 East Loop
740 N Rush St 73,294 North Michigan Avenue
111 W Washington St * 71,718 Central Loop
104 S Michigan Ave * 63,502 East Loop
111 N Canal St 57,800 West Loop
104 S Michigan Ave * 56,352 East Loop
14 Blocks 1,246,499
Italicized addresses indicate space is new on the market* Block of space is for future occupancy**Block of space will be vacated in the upcoming quarter
T H I R D Q U A R T E R 2 0 1 1 | C H I C A G O M A R K E T O V E R V I E W
CE
NTR
AL B
US
INE
SS
DIS
TRIC
T
6
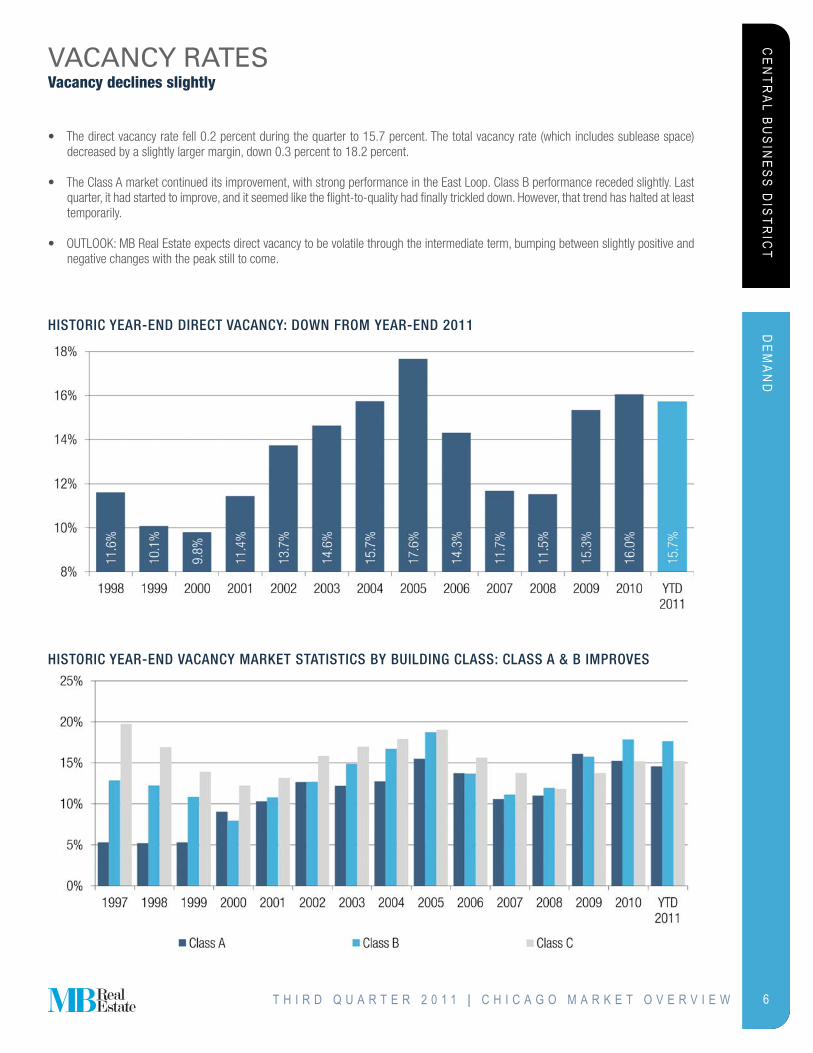
VACANCY RATESVacancy declines slightly
• The direct vacancy rate fell 0.2 percent during the quarter to 15.7 percent. The total vacancy rate (which includes sublease space)decreased by a slightly larger margin, down 0.3 percent to 18.2 percent.
• The Class A market continued its improvement, with strong performance in the East Loop. Class B performance receded slightly. Lastquarter, it had started to improve, and it seemed like the flight-to-quality had finally trickled down. However, that trend has halted at leasttemporarily.
• OUTLOOK: MB Real Estate expects direct vacancy to be volatile through the intermediate term, bumping between slightly positive andnegative changes with the peak still to come.
HISTORIC YEAR-END VACANCY MARKET STATISTICS BY BUILDING CLASS: CLASS A & B IMPROVES
HISTORIC YEAR-END DIRECT VACANCY: DOWN FROM YEAR-END 2011 DE
MA
ND
T H I R D Q U A R T E R 2 0 1 1 | C H I C A G O M A R K E T O V E R V I E W
CE
NTR
AL B
US
INE
SS
DIS
TRIC
T
7
DE
MA
ND
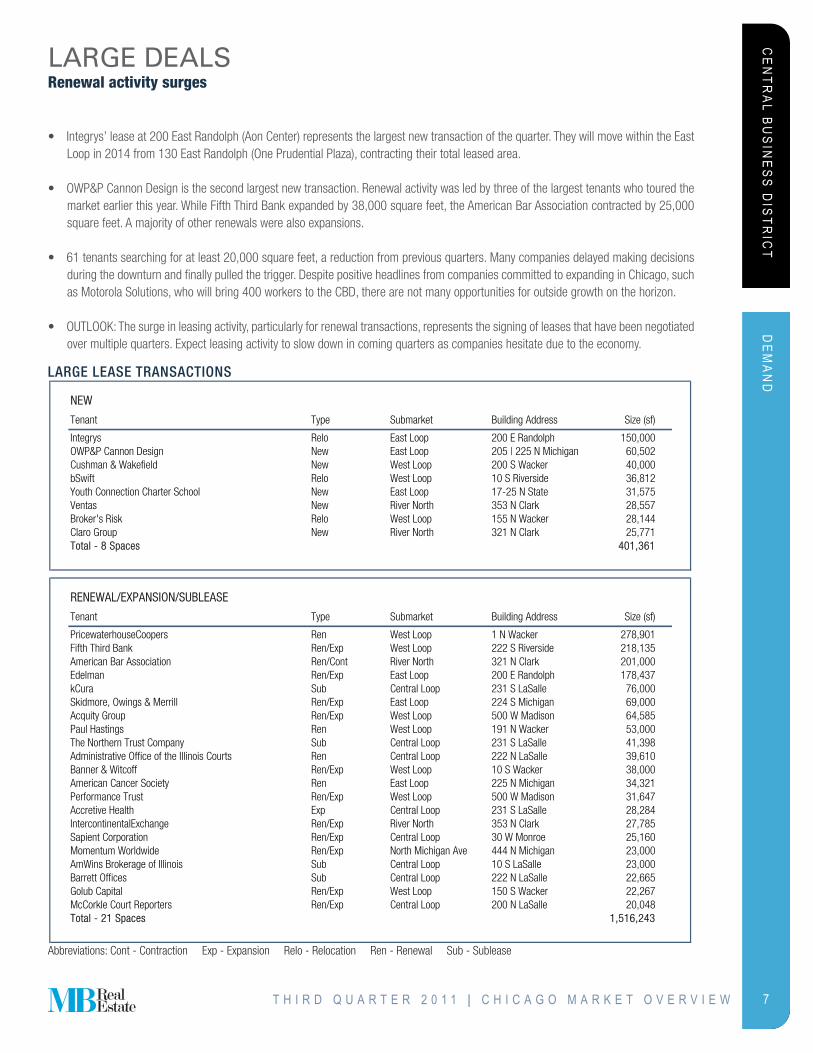
LARGE DEALSRenewal activity surges
• Integrys’ lease at 200 East Randolph (Aon Center) represents the largest new transaction of the quarter. They will move within the EastLoop in 2014 from 130 East Randolph (One Prudential Plaza), contracting their total leased area.
• OWP&P Cannon Design is the second largest new transaction. Renewal activity was led by three of the largest tenants who toured themarket earlier this year. While Fifth Third Bank expanded by 38,000 square feet, the American Bar Association contracted by 25,000square feet. A majority of other renewals were also expansions.
• 61 tenants searching for at least 20,000 square feet, a reduction from previous quarters. Many companies delayed making decisionsduring the downturn and finally pulled the trigger. Despite positive headlines from companies committed to expanding in Chicago, suchas Motorola Solutions, who will bring 400 workers to the CBD, there are not many opportunities for outside growth on the horizon.
• OUTLOOK: The surge in leasing activity, particularly for renewal transactions, represents the signing of leases that have been negotiatedover multiple quarters. Expect leasing activity to slow down in coming quarters as companies hesitate due to the economy.
NEW
Tenant Type Submarket Building Address Size (sf)
Integrys Relo East Loop 200 E Randolph 150,000OWP&P Cannon Design New East Loop 205 | 225 N Michigan 60,502Cushman & Wakefield New West Loop 200 S Wacker 40,000bSwift Relo West Loop 10 S Riverside 36,812Youth Connection Charter School New East Loop 17-25 N State 31,575Ventas New River North 353 N Clark 28,557Broker's Risk Relo West Loop 155 N Wacker 28,144Claro Group New River North 321 N Clark 25,771Total - 8 Spaces 401,361
RENEWAL/EXPANSION/SUBLEASE
Tenant Type Submarket Building Address Size (sf)
PricewaterhouseCoopers Ren West Loop 1 N Wacker 278,901Fifth Third Bank Ren/Exp West Loop 222 S Riverside 218,135American Bar Association Ren/Cont River North 321 N Clark 201,000Edelman Ren/Exp East Loop 200 E Randolph 178,437kCura Sub Central Loop 231 S LaSalle 76,000Skidmore, Owings & Merrill Ren/Exp East Loop 224 S Michigan 69,000Acquity Group Ren/Exp West Loop 500 W Madison 64,585Paul Hastings Ren West Loop 191 N Wacker 53,000The Northern Trust Company Sub Central Loop 231 S LaSalle 41,398Administrative Office of the Illinois Courts Ren Central Loop 222 N LaSalle 39,610Banner & Witcoff Ren/Exp West Loop 10 S Wacker 38,000American Cancer Society Ren East Loop 225 N Michigan 34,321Performance Trust Ren/Exp West Loop 500 W Madison 31,647Accretive Health Exp Central Loop 231 S LaSalle 28,284IntercontinentalExchange Ren/Exp River North 353 N Clark 27,785Sapient Corporation Ren/Exp Central Loop 30 W Monroe 25,160Momentum Worldwide Ren/Exp North Michigan Ave 444 N Michigan 23,000AmWins Brokerage of Illinois Sub Central Loop 10 S LaSalle 23,000Barrett Offices Sub Central Loop 222 N LaSalle 22,665Golub Capital Ren/Exp West Loop 150 S Wacker 22,267McCorkle Court Reporters Ren/Exp Central Loop 200 N LaSalle 20,048Total - 21 Spaces 1,516,243
LARGE LEASE TRANSACTIONS
Abbreviations: Cont - Contraction Exp - Expansion Relo - Relocation Ren - Renewal Sub - Sublease
T H I R D Q U A R T E R 2 0 1 1 | C H I C A G O M A R K E T O V E R V I E W
CE
NTR
AL B
US
INE
SS
DIS
TRIC
T
8
DE
MA
ND
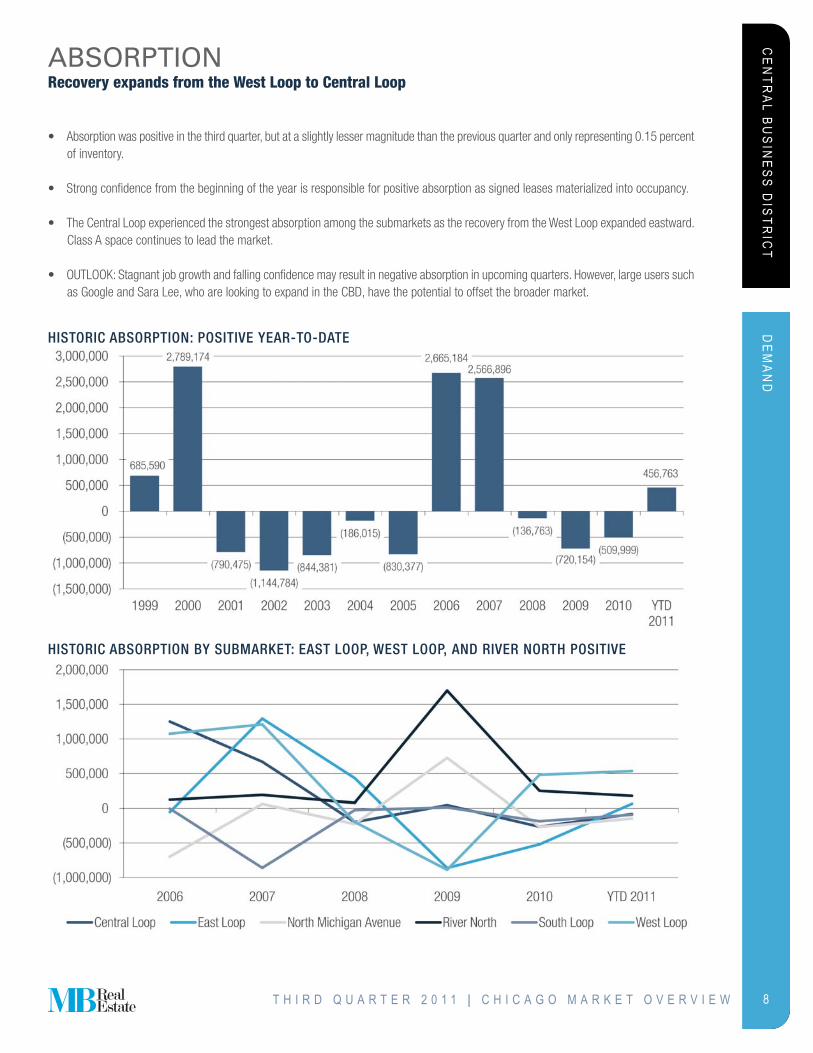
ABSORPTIONRecovery expands from the West Loop to Central Loop
• Absorption was positive in the third quarter, but at a slightly lesser magnitude than the previous quarter and only representing 0.15 percentof inventory.
• Strong confidence from the beginning of the year is responsible for positive absorption as signed leases materialized into occupancy.
• The Central Loop experienced the strongest absorption among the submarkets as the recovery from the West Loop expanded eastward.Class A space continues to lead the market.
• OUTLOOK: Stagnant job growth and falling confidence may result in negative absorption in upcoming quarters. However, large users suchas Google and Sara Lee, who are looking to expand in the CBD, have the potential to offset the broader market.
HISTORIC ABSORPTION: POSITIVE YEAR-TO-DATE
HISTORIC ABSORPTION BY SUBMARKET: EAST LOOP, WEST LOOP, AND RIVER NORTH POSITIVE
T H I R D Q U A R T E R 2 0 1 1 | C H I C A G O M A R K E T O V E R V I E W
CE
NTR
AL B
US
INE
SS
DIS
TRIC
T
9
FEATU
RE
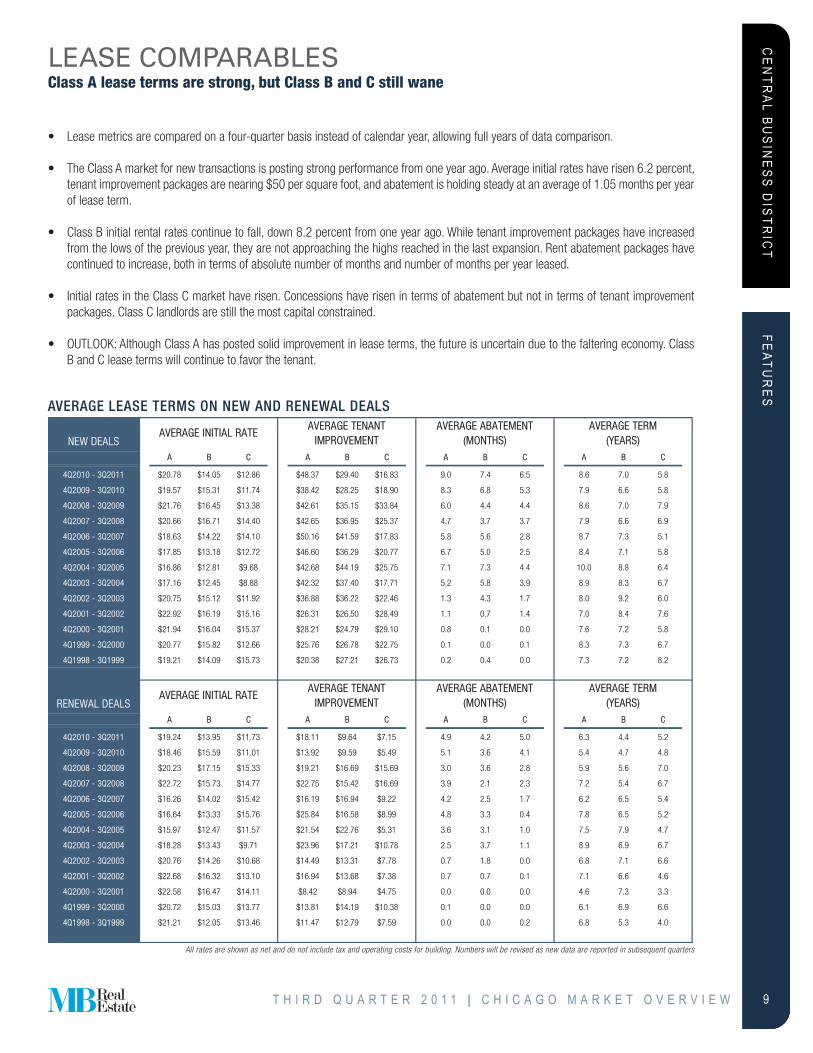
SLEASE COMPARABLESClass A lease terms are strong, but Class B and C still wane
NEW DEALSA B C A B C A B C A B C
4Q2010 - 3Q2011 $20.78 $14.05 $12.86 $48.37 $29.40 $16.83 9.0 7.4 6.5 8.6 7.0 5.8
4Q2009 - 3Q2010 $19.57 $15.31 $11.74 $38.42 $28.25 $18.90 8.3 6.8 5.3 7.9 6.6 5.8
4Q2008 - 3Q2009 $21.76 $16.45 $13.38 $42.61 $35.15 $33.84 6.0 4.4 4.4 8.6 7.0 7.9
4Q2007 - 3Q2008 $20.66 $16.71 $14.40 $42.65 $36.95 $25.37 4.7 3.7 3.7 7.9 6.6 6.9
4Q2006 - 3Q2007 $18.63 $14.22 $14.10 $50.16 $41.59 $17.83 5.8 5.6 2.8 8.7 7.3 5.1
4Q2005 - 3Q2006 $17.85 $13.18 $12.72 $46.60 $36.29 $20.77 6.7 5.0 2.5 8.4 7.1 5.8
4Q2004 - 3Q2005 $16.86 $12.81 $9.68 $42.68 $44.19 $25.75 7.1 7.3 4.4 10.0 8.8 6.4
4Q2003 - 3Q2004 $17.16 $12.45 $8.88 $42.32 $37.40 $17.71 5.2 5.8 3.9 8.9 8.3 6.7
4Q2002 - 3Q2003 $20.75 $15.12 $11.92 $36.88 $36.22 $22.46 1.3 4.3 1.7 8.0 9.2 6.0
4Q2001 - 3Q2002 $22.92 $16.19 $15.16 $26.31 $26.50 $28.49 1.1 0.7 1.4 7.0 8.4 7.6
4Q2000 - 3Q2001 $21.94 $16.04 $15.37 $28.21 $24.79 $29.10 0.8 0.1 0.0 7.6 7.2 5.8
4Q1999 - 3Q2000 $20.77 $15.82 $12.66 $25.76 $26.78 $22.75 0.1 0.0 0.1 8.3 7.3 6.7
4Q1998 - 3Q1999 $19.21 $14.09 $15.73 $20.38 $27.21 $26.73 0.2 0.4 0.0 7.3 7.2 8.2
RENEWAL DEALSA B C A B C A B C A B C
4Q2010 - 3Q2011 $19.24 $13.95 $11.73 $18.11 $9.64 $7.15 4.9 4.2 5.0 6.3 4.4 5.2
4Q2009 - 3Q2010 $18.46 $15.59 $11.01 $13.92 $9.59 $5.49 5.1 3.6 4.1 5.4 4.7 4.8
4Q2008 - 3Q2009 $20.23 $17.15 $15.33 $19.21 $16.69 $15.69 3.0 3.6 2.8 5.9 5.6 7.0
4Q2007 - 3Q2008 $22.72 $15.73 $14.77 $22.75 $15.42 $16.69 3.9 2.1 2.3 7.2 5.4 6.7
4Q2006 - 3Q2007 $16.26 $14.02 $15.42 $16.19 $16.94 $9.22 4.2 2.5 1.7 6.2 6.5 5.4
4Q2005 - 3Q2006 $16.64 $13.33 $15.76 $25.84 $16.58 $8.99 4.8 3.3 0.4 7.8 6.5 5.2
4Q2004 - 3Q2005 $15.97 $12.47 $11.57 $21.54 $22.76 $5.31 3.6 3.1 1.0 7.5 7.9 4.7
4Q2003 - 3Q2004 $18.28 $13.43 $9.71 $23.96 $17.21 $10.78 2.5 3.7 1.1 8.9 6.9 6.7
4Q2002 - 3Q2003 $20.76 $14.26 $10.68 $14.49 $13.31 $7.78 0.7 1.8 0.0 6.8 7.1 6.6
4Q2001 - 3Q2002 $22.68 $16.32 $13.10 $16.94 $13.68 $7.38 0.7 0.7 0.1 7.1 6.6 4.6
4Q2000 - 3Q2001 $22.58 $16.47 $14.11 $8.42 $8.94 $4.75 0.0 0.0 0.0 4.6 7.3 3.3
4Q1999 - 3Q2000 $20.72 $15.03 $13.77 $13.81 $14.19 $10.38 0.1 0.0 0.0 6.1 6.9 6.6
4Q1998 - 3Q1999 $21.21 $12.05 $13.46 $11.47 $12.79 $7.59 0.0 0.0 0.2 6.8 5.3 4.0
AVERAGE INITIAL RATE
AVERAGE INITIAL RATEAVERAGE ABATEMENT
(MONTHS)AVERAGE TERM
(YEARS)
AVERAGE ABATEMENT(MONTHS)
AVERAGE TERM(YEARS)
AVERAGE TENANT IMPROVEMENT
AVERAGE TENANT IMPROVEMENT
• Lease metrics are compared on a four-quarter basis instead of calendar year, allowing full years of data comparison.
• The Class A market for new transactions is posting strong performance from one year ago. Average initial rates have risen 6.2 percent,tenant improvement packages are nearing $50 per square foot, and abatement is holding steady at an average of 1.05 months per yearof lease term.
• Class B initial rental rates continue to fall, down 8.2 percent from one year ago. While tenant improvement packages have increasedfrom the lows of the previous year, they are not approaching the highs reached in the last expansion. Rent abatement packages havecontinued to increase, both in terms of absolute number of months and number of months per year leased.
• Initial rates in the Class C market have risen. Concessions have risen in terms of abatement but not in terms of tenant improvementpackages. Class C landlords are still the most capital constrained.
• OUTLOOK: Although Class A has posted solid improvement in lease terms, the future is uncertain due to the faltering economy. ClassB and C lease terms will continue to favor the tenant.
AVERAGE LEASE TERMS ON NEW AND RENEWAL DEALS
All rates are shown as net and do not include tax and operating costs for building. Numbers will be revised as new data are reported in subsequent quarters
T H I R D Q U A R T E R 2 0 1 1 | C H I C A G O M A R K E T O V E R V I E W
CE
NTR
AL B
US
INE
SS
DIS
TRIC
T
10
FEATU
RE
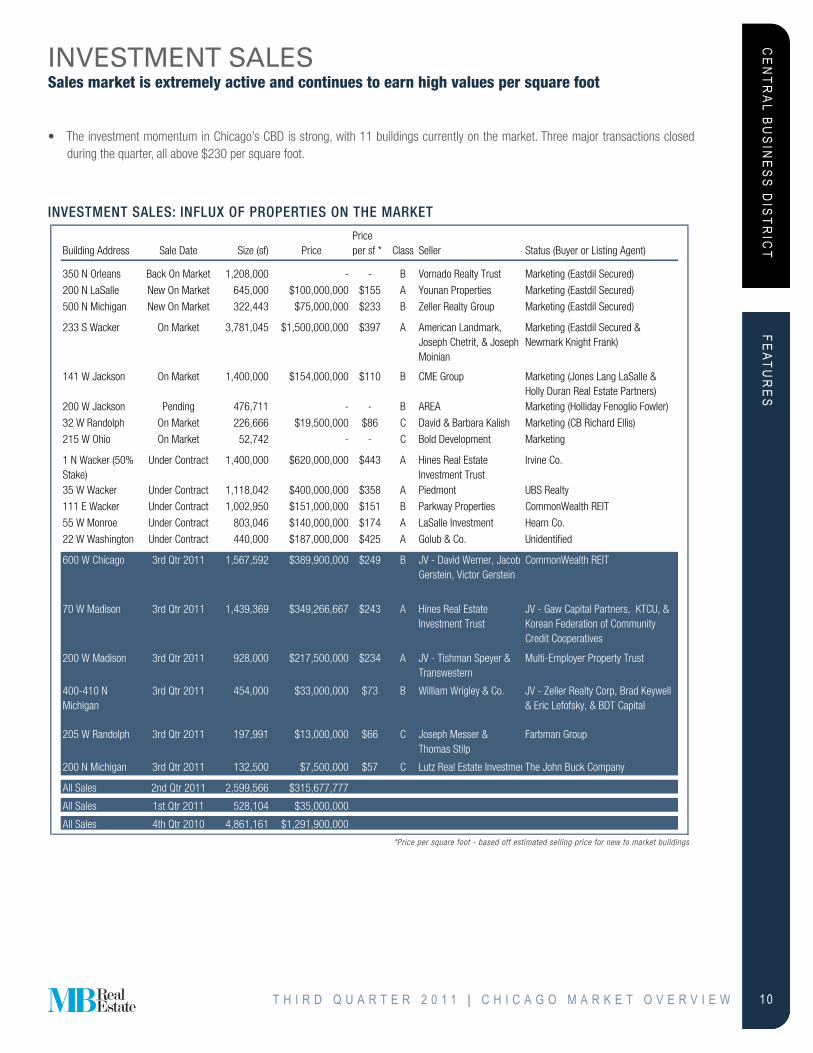
SINVESTMENT SALESSales market is extremely active and continues to earn high values per square foot
• The investment momentum in Chicago’s CBD is strong, with 11 buildings currently on the market. Three major transactions closedduring the quarter, all above $230 per square foot.
INVESTMENT SALES: INFLUX OF PROPERTIES ON THE MARKET
Building Address Sale Date Size (sf) PricePrice per sf * Class Seller Status (Buyer or Listing Agent)
350 N Orleans Back On Market 1,208,000 - - B Vornado Realty Trust Marketing (Eastdil Secured)
200 N LaSalle New On Market 645,000 $100,000,000 $155 A Younan Properties Marketing (Eastdil Secured)
500 N Michigan New On Market 322,443 $75,000,000 $233 B Zeller Realty Group Marketing (Eastdil Secured)
233 S Wacker On Market 3,781,045 $1,500,000,000 $397 A American Landmark, Joseph Chetrit, & Joseph Moinian
Marketing (Eastdil Secured & Newmark Knight Frank)
141 W Jackson On Market 1,400,000 $154,000,000 $110 B CME Group Marketing (Jones Lang LaSalle & Holly Duran Real Estate Partners)
200 W Jackson Pending 476,711 - - B AREA Marketing (Holliday Fenoglio Fowler)
32 W Randolph On Market 226,666 $19,500,000 $86 C David & Barbara Kalish Marketing (CB Richard Ellis)
215 W Ohio On Market 52,742 - - C Bold Development Marketing
1 N Wacker (50% Stake)
Under Contract 1,400,000 $620,000,000 $443 A Hines Real Estate Investment Trust
Irvine Co.
35 W Wacker Under Contract 1,118,042 $400,000,000 $358 A Piedmont UBS Realty
111 E Wacker Under Contract 1,002,950 $151,000,000 $151 B Parkway Properties CommonWealth REIT
55 W Monroe Under Contract 803,046 $140,000,000 $174 A LaSalle Investment Hearn Co.
22 W Washington Under Contract 440,000 $187,000,000 $425 A Golub & Co. Unidentified
600 W Chicago 3rd Qtr 2011 1,567,592 $389,900,000 $249 B JV - David Werner, Jacob Gerstein, Victor Gerstein
CommonWealth REIT
70 W Madison 3rd Qtr 2011 1,439,369 $349,266,667 $243 A Hines Real Estate Investment Trust
JV - Gaw Capital Partners, KTCU, & Korean Federation of Community Credit Cooperatives
200 W Madison 3rd Qtr 2011 928,000 $217,500,000 $234 A JV - Tishman Speyer & Transwestern
Multi-Employer Property Trust
400-410 N Michigan
3rd Qtr 2011 454,000 $33,000,000 $73 B William Wrigley & Co. JV - Zeller Realty Corp, Brad Keywell & Eric Lefofsky, & BDT Capital
205 W Randolph 3rd Qtr 2011 197,991 $13,000,000 $66 C Joseph Messer & Thomas Stilp
Farbman Group
200 N Michigan 3rd Qtr 2011 132,500 $7,500,000 $57 C Lutz Real Estate InvestmenThe John Buck Company
All Sales 2nd Qtr 2011 2,599,566 $315,677,777
All Sales 1st Qtr 2011 528,104 $35,000,000
All Sales 4th Qtr 2010 4,861,161 $1,291,900,000
*Price per square foot - based off estimated selling price for new to market buildings
T H I R D Q U A R T E R 2 0 1 1 | C H I C A G O M A R K E T O V E R V I E W
CE
NTR
AL B
US
INE
SS
DIS
TRIC
T
11
FEATU
RE
SFORECASTFear of a second recession will pause office market recovery
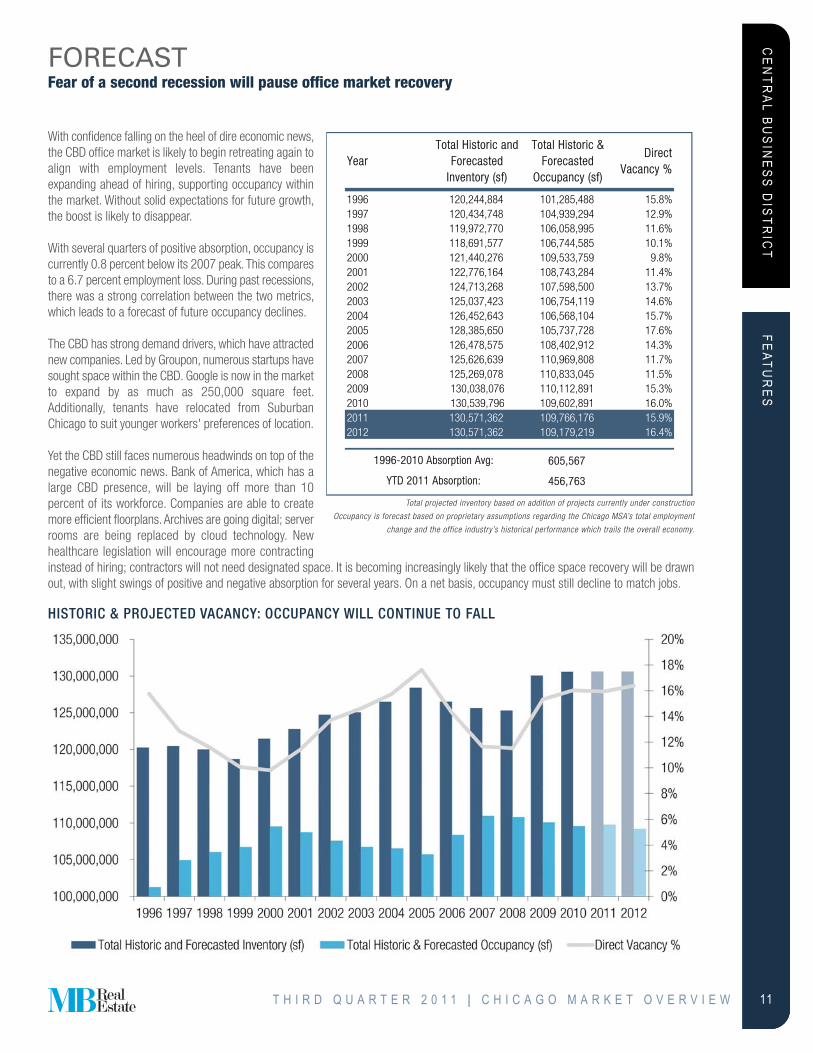
With confidence falling on the heel of dire economic news,the CBD office market is likely to begin retreating again toalign with employment levels. Tenants have beenexpanding ahead of hiring, supporting occupancy withinthe market. Without solid expectations for future growth,the boost is likely to disappear.
With several quarters of positive absorption, occupancy iscurrently 0.8 percent below its 2007 peak. This comparesto a 6.7 percent employment loss. During past recessions,there was a strong correlation between the two metrics,which leads to a forecast of future occupancy declines.
The CBD has strong demand drivers, which have attractednew companies. Led by Groupon, numerous startups havesought space within the CBD. Google is now in the marketto expand by as much as 250,000 square feet.Additionally, tenants have relocated from SuburbanChicago to suit younger workers' preferences of location.
Yet the CBD still faces numerous headwinds on top of thenegative economic news. Bank of America, which has alarge CBD presence, will be laying off more than 10percent of its workforce. Companies are able to createmore efficient floorplans. Archives are going digital; serverrooms are being replaced by cloud technology. Newhealthcare legislation will encourage more contracting
HISTORIC & PROJECTED VACANCY: OCCUPANCY WILL CONTINUE TO FALL
YearTotal Historic and
Forecasted Inventory (sf)
Total Historic & Forecasted
Occupancy (sf)
Direct Vacancy %
1996 120,244,884 101,285,488 15.8%1997 120,434,748 104,939,294 12.9%1998 119,972,770 106,058,995 11.6%1999 118,691,577 106,744,585 10.1%2000 121,440,276 109,533,759 9.8%2001 122,776,164 108,743,284 11.4%2002 124,713,268 107,598,500 13.7%2003 125,037,423 106,754,119 14.6%2004 126,452,643 106,568,104 15.7%2005 128,385,650 105,737,728 17.6%2006 126,478,575 108,402,912 14.3%2007 125,626,639 110,969,808 11.7%2008 125,269,078 110,833,045 11.5%2009 130,038,076 110,112,891 15.3%2010 130,539,796 109,602,891 16.0%2011 130,571,362 109,766,176 15.9%2012 130,571,362 109,179,219 16.4%
605,567
456,763
1996-2010 Absorption Avg:
YTD 2011 Absorption:
Total projected inventory based on addition of projects currently under construction
Occupancy is forecast based on proprietary assumptions regarding the Chicago MSA’s total employment
change and the office industry’s historical performance which trails the overall economy.
T H I R D Q U A R T E R 2 0 1 1 | C H I C A G O M A R K E T O V E R V I E W
instead of hiring; contractors will not need designated space. It is becoming increasingly likely that the office space recovery will be drawnout, with slight swings of positive and negative absorption for several years. On a net basis, occupancy must still decline to match jobs.
CE
NTR
AL B
US
INE
SS
DIS
TRIC
T
12
FEATU
RE
SSUBMARKET MAP
T H I R D Q U A R T E R 2 0 1 1 | C H I C A G O M A R K E T O V E R V I E W
CE
NTR
AL B
US
INE
SS
DIS
TRIC
T
13
FEATU
RE
SMARKET STATISTICS
CENTRAL LOOPRBA(sf)
YTDAbsorption (sf)
3rd QuarterAbsorption (sf)
Direct Vacancy(sf)
Direct Vacancy
%
Occupancy(sf)
Sublease Vacancy
(sf)
Total Vacancy Rate (Direct + Sublease) %
Class A 13,554,346 85,930 17,509 1,317,085 9.7% 12,237,262 317,342 12.1%
Class B 14,030,785 85,487 177,074 2,356,779 16.8% 11,674,006 360,304 19.4%
Class C 8,613,255 (254,379) (41,196) 1,449,595 16.8% 7,163,660 141,998 18.5%
TTotal 36,198,386 (82,962) 153,387 5,123,458 14.2% 31,074,928 819,644 16.4%
EAST LOOPRBA(sf)
YTDAbsorption (sf)
3rd QuarterAbsorption (sf)
Direct Vacancy(sf)
Direct Vacancy
%
Occupancy(sf)
Sublease Vacancy
(sf)
Total Vacancy Rate (Direct + Sublease) %
Class A 4,014,487 148,082 219,660 880,783 21.9% 3,133,704 217,761 27.4%
Class B 10,207,612 (3,055) (215,231) 2,460,598 24.1% 7,747,014 244,222 26.5%
Class C 8,457,711 (79,224) (26,241) 1,173,242 13.9% 7,284,469 25,960 14.2%
Total 22,679,811 65,802 (21,812) 4,514,623 19.9% 18,165,188 487,943 22.1%
N. MICHIGAN AVE.RBA(sf)
YTDAbsorption (sf)
3rd QuarterAbsorption (sf)
Direct Vacancy(sf)
Direct Vacancy
%
Occupancy(sf)
Sublease Vacancy
(sf)
Total Vacancy Rate (Direct + Sublease) %
Class A 3,952,669 (44,835) 5,098 791,269 20.0% 3,161,400 99,955 22.5%
Class B 4,634,167 (51,535) (7,925) 1,129,255 24.4% 3,504,912 134,986 27.3%
Class C 4,425,684 (49,636) (16,754) 582,279 13.2% 3,843,405 39,184 14.0%
Total 13,012,520 (146,006) (19,582) 2,502,803 19.2% 10,509,717 274,125 21.3%
RIVER NORTHRBA(sf)
YTDAbsorption (sf)
3rd QuarterAbsorption (sf)
Direct Vacancy(sf)
Direct Vacancy
%
Occupancy(sf)
Sublease Vacancy
(sf)
Total Vacancy Rate (Direct + Sublease) %
Class A 4,003,546 (41,288) (31,655) 654,626 16.4% 3,348,920 132,732 19.7%
Class B 3,538,948 151,168 9,101 248,940 7.0% 3,290,008 371,221 17.5%
Class C 5,764,476 67,972 54,712 687,161 11.9% 5,077,315 221,153 15.8%
Total 13,306,970 177,852 32,157 1,590,727 12.0% 11,716,243 725,106 17.4%
SOUTH LOOPRBA(sf)
YTDAbsorption (sf)
3rd QuarterAbsorption (sf)
Direct Vacancy(sf)
Direct Vacancy
%
Occupancy(sf)
Sublease Vacancy
(sf)
Total Vacancy Rate (Direct + Sublease) %
Class A 1,019,325 (53,752) (8,286) 149,788 14.7% 869,537 12,809 16.0%
Class C 1,271,908 (39,500) (20,039) 322,427 25.3% 949,481 2,005 25.5%
Total 2,291,233 (93,252) (28,325) 472,215 20.6% 1,819,018 14,814 21.3%
WEST LOOPRBA(sf)
YTDAbsorption (sf)
3rd QuarterAbsorption (sf)
Direct Vacancy(sf)
Direct Vacancy
%
Occupancy(sf)
Sublease Vacancy
(sf)
Total Vacancy Rate (Direct + Sublease) %
Class A 26,891,979 402,928 88,773 3,967,012 14.8% 22,924,967 675,258 17.3%
Class B 9,723,404 101,773 15,016 1,231,847 12.7% 8,491,557 132,808 14.0%
Class C 6,467,059 30,629 (18,802) 1,109,023 17.1% 5,358,036 66,162 18.2%
Total 43,082,442 535,330 84,986 6,307,882 14.6% 36,774,560 874,228 16.7%
TOTALSRBA(sf)
YTDAbsorption (sf)
3rd QuarterAbsorption (sf)
Direct Vacancy(sf)
Direct Vacancy
%
Occupancy(sf)
Sublease Vacancy
(sf)
Total Vacancy Rate (Direct + Sublease) %
Class A 53,436,352 497,064 291,099 7,760,562 14.5% 45,675,790 1,455,857 17.2%
Class B 42,134,916 283,838 (21,965) 7,427,419 17.6% 34,707,497 1,243,541 20.6%
Class C 35,000,094 (324,139) (68,321) 5,323,727 15.2% 29,676,367 496,462 16.6%
Total CBD 130,571,362 456,763 200,813 20,511,708 15.7% 110,059,654 3,195,860 18.2%
T H I R D Q U A R T E R 2 0 1 1 | C H I C A G O M A R K E T O V E R V I E W

SU
BU
RB
AN
CH
ICA
GO
14
SECTION THREE
SUBURBAN CHICAGOEXECUTIVE SUMMARY
Absent a large boost next quarter, 2011 is shaping up to show greater occupancy losses than 2010. While losses now match with employmentmarket losses on a percentage basis, Suburban Chicago stands to see more negativity as numerous factors weigh against its recovery.
Key Indicators: • The East-West submarket is recovering ahead of its peers. The North submarket, which has held steadiest through the downturn,
is starting to see significant occupancy losses.
• In contrast to the previous flight-to-quality trend, Class A performance was weakest during the quarter with large negativeabsorption in that segment in both the North and Northwest submarkets.
• AT&T continues to impact the sublease market, listing a 239,000 square foot building for sublease in addition to its 1.2 millionsquare foot corporate campus. The potential for formerly single-tenant corporate campuses to enter the multi-tenant marketweighs on Suburban Chicago. With United Airlines leaving for the CBD, Sara Lee exploring a similar move, AT&T and Motorolashedding space, and Sears looking to relocate out of state, the potential for numerous vacant corporate campuses is high.
• Leasing activity continued to be muted, with no new deals greater than 80,000 square feet. On a positive note, severaltransactions will result in increased occupancy in Suburban Chicago for the tenants.
• Asking rents have held fairly steady. Landlords must increase concessions to entice tenants to stay or relocate within thesuburbs.
• While the CBD earns enough demand from its talented labor pool to counteract an increased tax burden, Suburban Chicago lackssimilar drivers.
• Unlike the CBD, there are no potential office developments making headlines. The only project underway is the build-to-suitheadquarters for Astellas Pharma US in Glenview, which has created a large block of sublease availability at its former locationin Deerfield.
Occupancy has decreased 7.4 percent in Suburban Chicago compared to a 7.5 percent peak-to-trough total employment loss. Corporatedefections, as well as underutilized space, remain the biggest risks to the market; companies have leased more space than they need andwill reduce square footage upon lease expirations.
SUBURBAN VACANCY AND YEAR-TO-DATE ABSORPTION SUMMARY
Direct Vacancy3Q2011
AChange from
2Q2011B
Change from 2Q2011
CChange from
2Q2011Total
Change from 2Q2011
East-West 19.6% -1.2% 23.9% 0.1% 23.1% 0.1% 21.6% -0.6%North 20.5% 1.3% 20.6% -1.5% 22.5% 0.8% 20.7% 0.5%Northwest 23.0% 2.0% 35.0% 0.6% 31.3% 1.3% 27.5% 1.5%O'Hare 21.7% 1.3% 31.3% -1.1% 35.7% -0.7% 26.9% 0.2%Suburban Chicago Total 21.1% 0.7% 27.1% -0.2% 27.1% 0.3% 23.7% 1.0%
Net Absorption3Q2011
A B C Total
East-West 243,444 (2,340) (10,370) 2230,735
North (219,273) 60,789 (30,473) ((188,957)
Northwest (369,035) (62,474) (24,371) ((455,880)
O'Hare (99,083) 49,943 16,488 ((32,651)
Suburban Chicago Total (443,946) 45,918 (48,726) (446,753)
T H I R D Q U A R T E R 2 0 1 1 | C H I C A G O M A R K E T O V E R V I E W
SU
BU
RB
AN
CH
ICA
GO
15
SU
PP
LYNEW DEVELOPMENTSNo new multitenant construction on the horizon
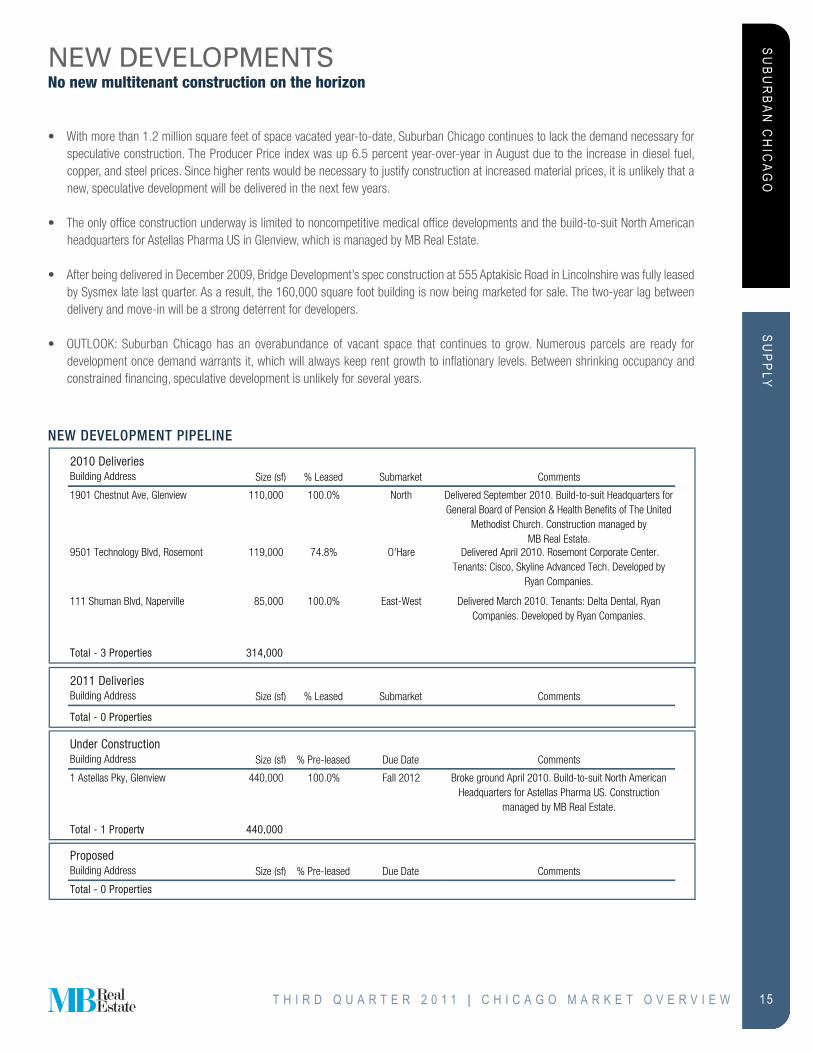
• With more than 1.2 million square feet of space vacated year-to-date, Suburban Chicago continues to lack the demand necessary forspeculative construction. The Producer Price index was up 6.5 percent year-over-year in August due to the increase in diesel fuel,copper, and steel prices. Since higher rents would be necessary to justify construction at increased material prices, it is unlikely that anew, speculative development will be delivered in the next few years.
• The only office construction underway is limited to noncompetitive medical office developments and the build-to-suit North Americanheadquarters for Astellas Pharma US in Glenview, which is managed by MB Real Estate.
• After being delivered in December 2009, Bridge Development’s spec construction at 555 Aptakisic Road in Lincolnshire was fully leasedby Sysmex late last quarter. As a result, the 160,000 square foot building is now being marketed for sale. The two-year lag betweendelivery and move-in will be a strong deterrent for developers.
• OUTLOOK: Suburban Chicago has an overabundance of vacant space that continues to grow. Numerous parcels are ready fordevelopment once demand warrants it, which will always keep rent growth to inflationary levels. Between shrinking occupancy andconstrained financing, speculative development is unlikely for several years.
2010 DeliveriesBuilding Address Size (sf) % Leased Submarket Comments
1901 Chestnut Ave, Glenview 110,000 100.0% North Delivered September 2010. Build-to-suit Headquarters for General Board of Pension & Health Benefits of The United
Methodist Church. Construction managed by MB Real Estate.
9501 Technology Blvd, Rosemont 119,000 74.8% O'Hare Delivered April 2010. Rosemont Corporate Center. Tenants: Cisco, Skyline Advanced Tech. Developed by
Ryan Companies.
111 Shuman Blvd, Naperville 85,000 100.0% East-West Delivered March 2010. Tenants: Delta Dental, Ryan Companies. Developed by Ryan Companies.
TTotal - 3 Propperties 314,,000
2011 DeliveriesBuilding Address Size (sf) % Leased Submarket Comments
Total - 0 Propperties
Under ConstructionBuilding Address Size (sf) % Pre-leased Due Date Comments
1 Astellas Pky, Glenview 440,000 100.0% Fall 2012 Broke ground April 2010. Build-to-suit North American Headquarters for Astellas Pharma US. Construction
managed by MB Real Estate.
Total - 1 Proppertyy 440,,000
ProposedBuilding Address Size (sf) % Pre-leased Due Date Comments
Total - 0 Properties
NEW DEVELOPMENT PIPELINE
T H I R D Q U A R T E R 2 0 1 1 | C H I C A G O M A R K E T O V E R V I E W

SU
BU
RB
AN
CH
ICA
GO
16
SU
PP
LYSUBLEASE SPACESublease availability is reduced as large blocks roll to direct availability
• Four large sublease blocks became directly available this quarter, leading to a significant a drop in vacant sublease space. Since theend of 2010, sublease vacancy has decreased by 16.3 percent to 3.4 million square feet.
• In addition to its 1.2 million square foot campus, AT&T is now listing a 239,000 square foot space at 2001 Lakewood Blvd in HoffmanEstates as available for sublease. Both properties were fully occupied by AT&T and therefore are not competitive with the multi-tenantproperties that MB Real Estate tracks. However, this demonstrates how single-tenant properties can impact the multi-tenant market.
• OUTLOOK: When the market is at equilibrium, roughly 3 million square feet of sublease space is available, meaning there is still roomfor reduction. As leases expire and switch to direct availability, sublease availability will decrease.
HISTORIC YEAR-END SUBLEASE AVAILABILITY: FALLING RAPIDLY
Class ABuilding Address Size (sf) Occupancy Expiration Submarket Sublandlord
2000 W AT&T Dr, Hoffman Estates 1,207,245 Vacant August 2016 Northwest AT&T3 Overlook Pt, Lincolnshire 290,143 Vacant February 2017 North Hewitt Associates4201 Winfield Rd, Warrenville 249,996 January 2012 - East-West Navistar3 Parkway Blvd N, Deerfield 232,836 July 2012 December 2014 North Astellas Pharma US1000 Milwaukee Ave, Glenview 130,403 Vacant April 2017 North AON Warranty Group1450 American Ln, Schaumburg 65,259 Negotiable October 2016 Northwest Zurich American Insurance Company410 Warrenville Rd, Lisle 60,434 Vacant May 2013 East-West IKON Office Solutions
Total - 7 Spaces 2,236,316
Class BBuilding Address Size (sf) Occupancy Expiration Submarket Sublandlord
6200 S Route 53, Lisle 360,000 Vacant July 2012 East-West Telcordia Technologies2001 Lakewood Blvd, Hoffman Estates 239,250 Negotiable - Northwest AT&T5450 N Cumberland Ave, Chicago 118,666 Negotiable February 2020 O'Hare Océ-USA Holding Inc750 N Commons Dr, Aurora 60,000 Negotiable September 2017 East-West Westell Technologies
Total - 4 Spaces 777,916
LARGE BLOCKS (MORE THAN 50,000 SQUARE FEET) OF SUBLEASE SPACE CURRENTLY AVAILABLE
Italicized addresses indicate space is new on the market
T H I R D Q U A R T E R 2 0 1 1 | C H I C A G O M A R K E T O V E R V I E W
SU
BU
RB
AN
CH
ICA
GO
17
SU
PP
LYLARGE BLOCKS OF DIRECT AVAILABILITY87 contiguous blocks greater than 50,000 square feet are available for lease
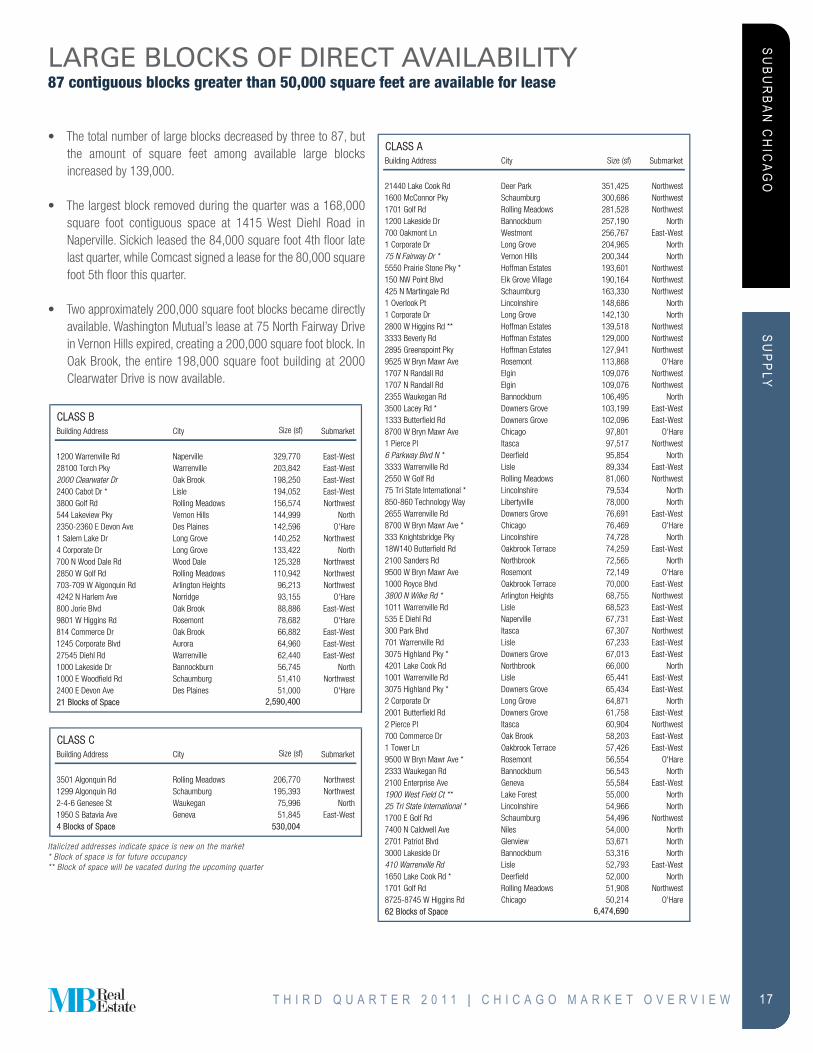
• The total number of large blocks decreased by three to 87, butthe amount of square feet among available large blocksincreased by 139,000.
• The largest block removed during the quarter was a 168,000square foot contiguous space at 1415 West Diehl Road inNaperville. Sickich leased the 84,000 square foot 4th floor latelast quarter, while Comcast signed a lease for the 80,000 squarefoot 5th floor this quarter.
• Two approximately 200,000 square foot blocks became directlyavailable. Washington Mutual’s lease at 75 North Fairway Drivein Vernon Hills expired, creating a 200,000 square foot block. InOak Brook, the entire 198,000 square foot building at 2000Clearwater Drive is now available.
CLASS CBuilding Address City Size (sf) Submarket
3501 Algonquin Rd Rolling Meadows 206,770 Northwest1299 Algonquin Rd Schaumburg 195,393 Northwest2-4-6 Genesee St Waukegan 75,996 North1950 S Batavia Ave Geneva 51,845 East-West4 Blocks of Space 530,004
CLASS BBuilding Address City Size (sf) Submarket
1200 Warrenville Rd Naperville 329,770 East-West28100 Torch Pky Warrenville 203,842 East-West2000 Clearwater Dr Oak Brook 198,250 East-West2400 Cabot Dr * Lisle 194,052 East-West3800 Golf Rd Rolling Meadows 156,574 Northwest544 Lakeview Pky Vernon Hills 144,999 North2350-2360 E Devon Ave Des Plaines 142,596 O'Hare1 Salem Lake Dr Long Grove 140,252 Northwest4 Corporate Dr Long Grove 133,422 North700 N Wood Dale Rd Wood Dale 125,328 Northwest2850 W Golf Rd Rolling Meadows 110,942 Northwest703-709 W Algonquin Rd Arlington Heights 96,213 Northwest4242 N Harlem Ave Norridge 93,155 O'Hare800 Jorie Blvd Oak Brook 88,886 East-West9801 W Higgins Rd Rosemont 78,682 O'Hare814 Commerce Dr Oak Brook 66,882 East-West1245 Corporate Blvd Aurora 64,960 East-West27545 Diehl Rd Warrenville 62,440 East-West1000 Lakeside Dr Bannockburn 56,745 North1000 E Woodfield Rd Schaumburg 51,410 Northwest2400 E Devon Ave Des Plaines 51,000 O'Hare21 Blocks of Space 2,590,400
Italicized addresses indicate space is new on the market* Block of space is for future occupancy** Block of space will be vacated during the upcoming quarter
CLASS ABuilding Address City Size (sf) Submarket
21440 Lake Cook Rd Deer Park 351,425 Northwest1600 McConnor Pky Schaumburg 300,686 Northwest1701 Golf Rd Rolling Meadows 281,528 Northwest1200 Lakeside Dr Bannockburn 257,190 North700 Oakmont Ln Westmont 256,767 East-West1 Corporate Dr Long Grove 204,965 North75 N Fairway Dr * Vernon Hills 200,344 North5550 Prairie Stone Pky * Hoffman Estates 193,601 Northwest150 NW Point Blvd Elk Grove Village 190,164 Northwest425 N Martingale Rd Schaumburg 163,330 Northwest1 Overlook Pt Lincolnshire 148,686 North1 Corporate Dr Long Grove 142,130 North2800 W Higgins Rd ** Hoffman Estates 139,518 Northwest3333 Beverly Rd Hoffman Estates 129,000 Northwest2895 Greenspoint Pky Hoffman Estates 127,941 Northwest9525 W Bryn Mawr Ave Rosemont 113,868 O'Hare1707 N Randall Rd Elgin 109,076 Northwest1707 N Randall Rd Elgin 109,076 Northwest2355 Waukegan Rd Bannockburn 106,495 North3500 Lacey Rd * Downers Grove 103,199 East-West1333 Butterfield Rd Downers Grove 102,096 East-West8700 W Bryn Mawr Ave Chicago 97,801 O'Hare1 Pierce Pl Itasca 97,517 Northwest6 Parkway Blvd N * Deerfield 95,854 North3333 Warrenville Rd Lisle 89,334 East-West2550 W Golf Rd Rolling Meadows 81,060 Northwest75 Tri State International * Lincolnshire 79,534 North850-860 Technology Way Libertyville 78,000 North2655 Warrenville Rd Downers Grove 76,691 East-West8700 W Bryn Mawr Ave * Chicago 76,469 O'Hare333 Knightsbridge Pky Lincolnshire 74,728 North18W140 Butterfield Rd Oakbrook Terrace 74,259 East-West2100 Sanders Rd Northbrook 72,565 North9500 W Bryn Mawr Ave Rosemont 72,149 O'Hare1000 Royce Blvd Oakbrook Terrace 70,000 East-West3800 N Wilke Rd * Arlington Heights 68,755 Northwest1011 Warrenville Rd Lisle 68,523 East-West535 E Diehl Rd Naperville 67,731 East-West300 Park Blvd Itasca 67,307 Northwest701 Warrenville Rd Lisle 67,233 East-West3075 Highland Pky * Downers Grove 67,013 East-West4201 Lake Cook Rd Northbrook 66,000 North1001 Warrenville Rd Lisle 65,441 East-West3075 Highland Pky * Downers Grove 65,434 East-West2 Corporate Dr Long Grove 64,871 North2001 Butterfield Rd Downers Grove 61,758 East-West2 Pierce Pl Itasca 60,904 Northwest700 Commerce Dr Oak Brook 58,203 East-West1 Tower Ln Oakbrook Terrace 57,426 East-West9500 W Bryn Mawr Ave * Rosemont 56,554 O'Hare2333 Waukegan Rd Bannockburn 56,543 North2100 Enterprise Ave Geneva 55,584 East-West1900 West Field Ct ** Lake Forest 55,000 North25 Tri State International * Lincolnshire 54,966 North1700 E Golf Rd Schaumburg 54,496 Northwest7400 N Caldwell Ave Niles 54,000 North2701 Patriot Blvd Glenview 53,671 North3000 Lakeside Dr Bannockburn 53,316 North410 Warrenville Rd Lisle 52,793 East-West1650 Lake Cook Rd * Deerfield 52,000 North1701 Golf Rd Rolling Meadows 51,908 Northwest8725-8745 W Higgins Rd Chicago 50,214 O'Hare62 Blocks of Space 6,474,690
T H I R D Q U A R T E R 2 0 1 1 | C H I C A G O M A R K E T O V E R V I E W
SU
BU
RB
AN
CH
ICA
GO
18
DE
MA
ND
VACANCY RATESVacancy continues to climb as tenants shed space, relocate from the suburbs
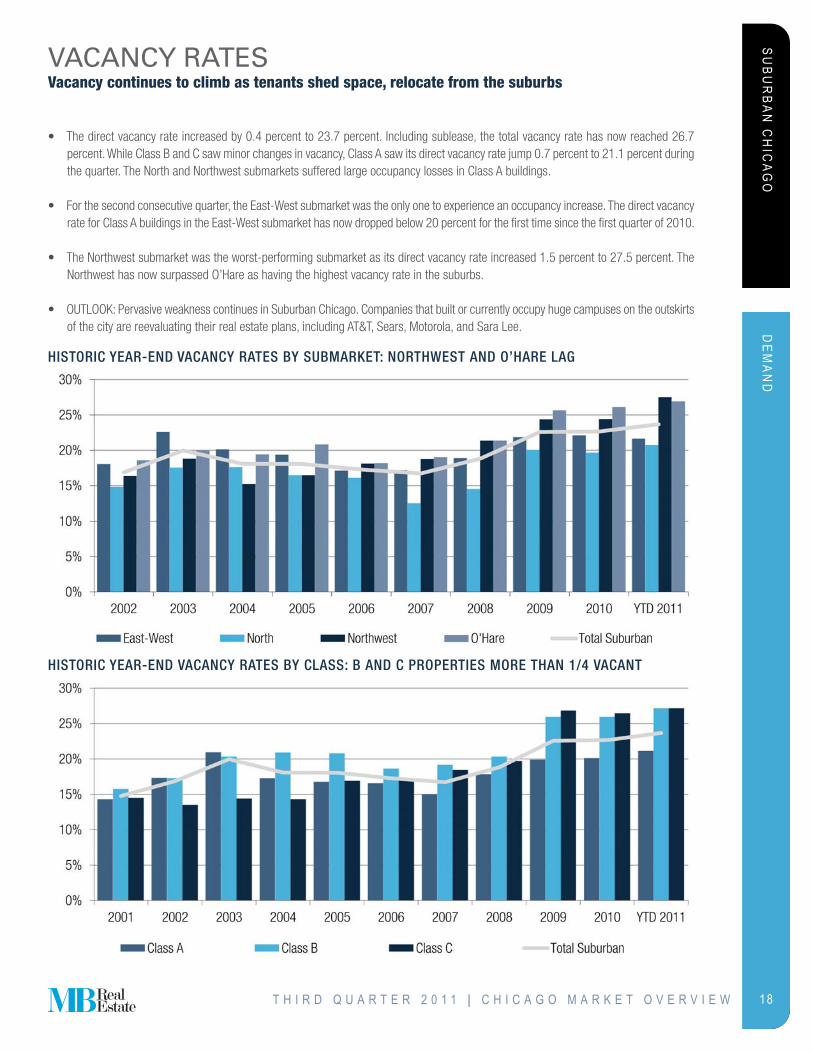
• The direct vacancy rate increased by 0.4 percent to 23.7 percent. Including sublease, the total vacancy rate has now reached 26.7percent. While Class B and C saw minor changes in vacancy, Class A saw its direct vacancy rate jump 0.7 percent to 21.1 percent duringthe quarter. The North and Northwest submarkets suffered large occupancy losses in Class A buildings.
• For the second consecutive quarter, the East-West submarket was the only one to experience an occupancy increase. The direct vacancyrate for Class A buildings in the East-West submarket has now dropped below 20 percent for the first time since the first quarter of 2010.
• The Northwest submarket was the worst-performing submarket as its direct vacancy rate increased 1.5 percent to 27.5 percent. TheNorthwest has now surpassed O’Hare as having the highest vacancy rate in the suburbs.
• OUTLOOK: Pervasive weakness continues in Suburban Chicago. Companies that built or currently occupy huge campuses on the outskirtsof the city are reevaluating their real estate plans, including AT&T, Sears, Motorola, and Sara Lee.
HISTORIC YEAR-END VACANCY RATES BY SUBMARKET: NORTHWEST AND O’HARE LAG
HISTORIC YEAR-END VACANCY RATES BY CLASS: B AND C PROPERTIES MORE THAN 1/4 VACANT
T H I R D Q U A R T E R 2 0 1 1 | C H I C A G O M A R K E T O V E R V I E W
SU
BU
RB
AN
CH
ICA
GO
19
DE
MA
ND
LARGE DEALSEast-West sees the majority of large lease transactions as other submarkets lag behind
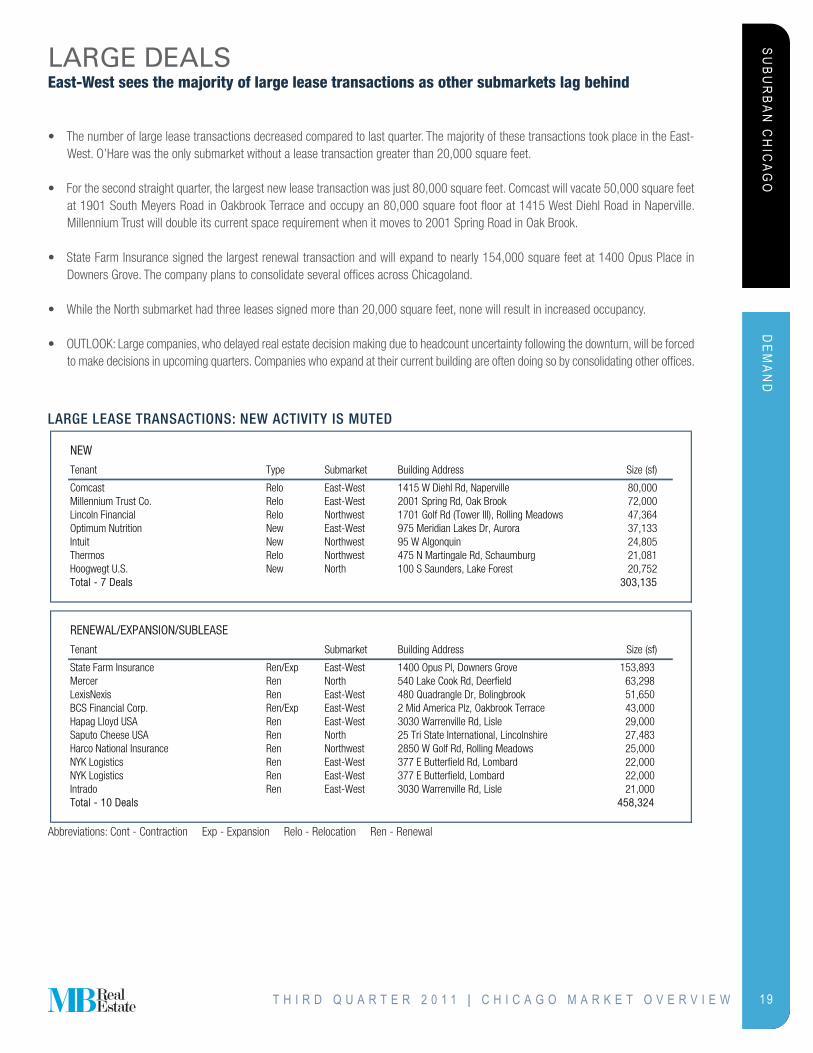
• The number of large lease transactions decreased compared to last quarter. The majority of these transactions took place in the East-West. O’Hare was the only submarket without a lease transaction greater than 20,000 square feet.
• For the second straight quarter, the largest new lease transaction was just 80,000 square feet. Comcast will vacate 50,000 square feetat 1901 South Meyers Road in Oakbrook Terrace and occupy an 80,000 square foot floor at 1415 West Diehl Road in Naperville.Millennium Trust will double its current space requirement when it moves to 2001 Spring Road in Oak Brook.
• State Farm Insurance signed the largest renewal transaction and will expand to nearly 154,000 square feet at 1400 Opus Place inDowners Grove. The company plans to consolidate several offices across Chicagoland.
• While the North submarket had three leases signed more than 20,000 square feet, none will result in increased occupancy.
• OUTLOOK: Large companies, who delayed real estate decision making due to headcount uncertainty following the downturn, will be forcedto make decisions in upcoming quarters. Companies who expand at their current building are often doing so by consolidating other offices.
NEW
Tenant Type Submarket Building Address Size (sf)
Comcast Relo East-West 1415 W Diehl Rd, Naperville 80,000Millennium Trust Co. Relo East-West 2001 Spring Rd, Oak Brook 72,000Lincoln Financial Relo Northwest 1701 Golf Rd (Tower III), Rolling Meadows 47,364Optimum Nutrition New East-West 975 Meridian Lakes Dr, Aurora 37,133Intuit New Northwest 95 W Algonquin 24,805Thermos Relo Northwest 475 N Martingale Rd, Schaumburg 21,081Hoogwegt U.S. New North 100 S Saunders, Lake Forest 20,752Total - 7 Deals 303,135
RENEWAL/EXPANSION/SUBLEASE
Tenant Submarket Building Address Size (sf)
State Farm Insurance Ren/Exp East-West 1400 Opus Pl, Downers Grove 153,893 Mercer Ren North 540 Lake Cook Rd, Deerfield 63,298 LexisNexis Ren East-West 480 Quadrangle Dr, Bolingbrook 51,650 BCS Financial Corp. Ren/Exp East-West 2 Mid America Plz, Oakbrook Terrace 43,000 Hapag Lloyd USA Ren East-West 3030 Warrenville Rd, Lisle 29,000 Saputo Cheese USA Ren North 25 Tri State International, Lincolnshire 27,483 Harco National Insurance Ren Northwest 2850 W Golf Rd, Rolling Meadows 25,000 NYK Logistics Ren East-West 377 E Butterfield Rd, Lombard 22,000 NYK Logistics Ren East-West 377 E Butterfield, Lombard 22,000 Intrado Ren East-West 3030 Warrenville Rd, Lisle 21,000 Total - 10 Deals 458,324
LARGE LEASE TRANSACTIONS: NEW ACTIVITY IS MUTED
Abbreviations: Cont - Contraction Exp - Expansion Relo - Relocation Ren - Renewal
T H I R D Q U A R T E R 2 0 1 1 | C H I C A G O M A R K E T O V E R V I E W
SU
BU
RB
AN
CH
ICA
GO
20
DE
MA
ND
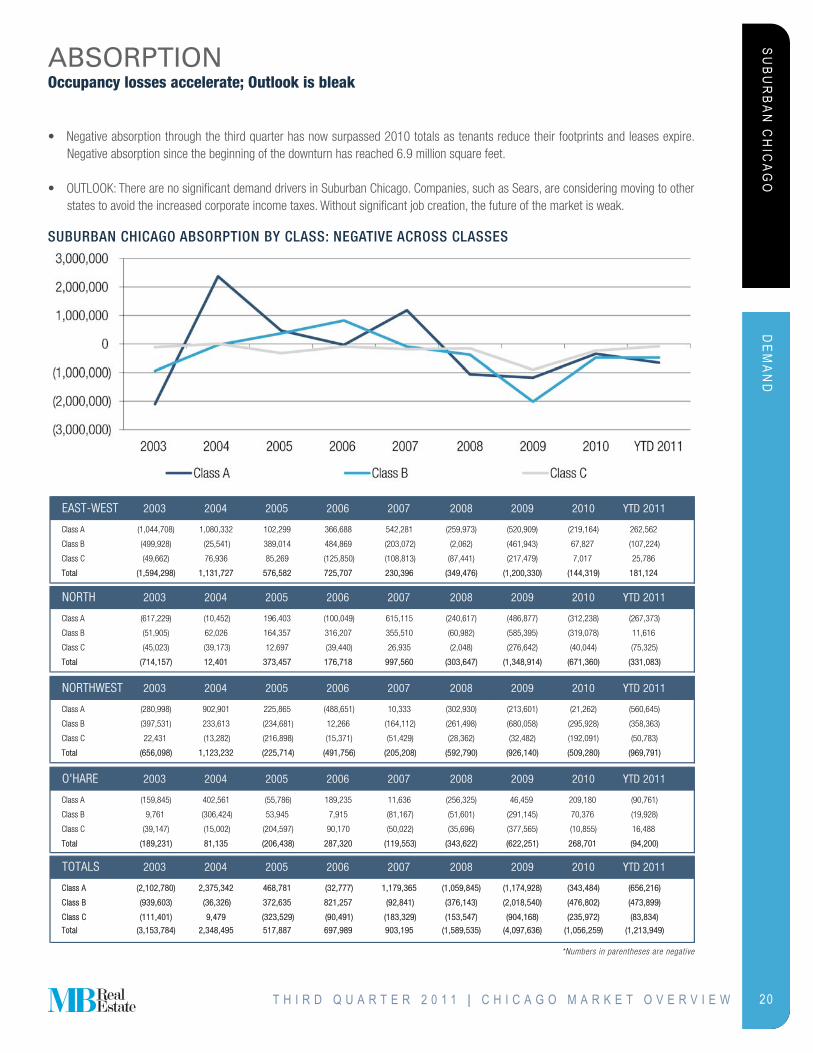
ABSORPTIONOccupancy losses accelerate; Outlook is bleak
• Negative absorption through the third quarter has now surpassed 2010 totals as tenants reduce their footprints and leases expire.Negative absorption since the beginning of the downturn has reached 6.9 million square feet.
• OUTLOOK: There are no significant demand drivers in Suburban Chicago. Companies, such as Sears, are considering moving to otherstates to avoid the increased corporate income taxes. Without significant job creation, the future of the market is weak.
SUBURBAN CHICAGO ABSORPTION BY CLASS: NEGATIVE ACROSS CLASSES
EAST-WEST 2003 2004 2005 2006 2007 2008 2009 2010 YTTD 2011
Class A (1,044,708) 1,080,332 102,299 366,688 542,281 (259,973) (520,909) (219,164) 262,562
Class B (499,928) (25,541) 389,014 484,869 (203,072) (2,062) (461,943) 67,827 (107,224)
Class C (49,662) 76,936 85,269 (125,850) (108,813) (87,441) (217,479) 7,017 25,786
Total (1,594,298) 1,131,727 576,582 725,707 230,396 (349,476) (1,200,330) (144,319) 181,124
NORTH 2003 2004 2005 2006 2007 2008 2009 2010 YYTD 2011
Class A (617,229) (10,452) 196,403 (100,049) 615,115 (240,617) (486,877) (312,238) (267,373)
Class B (51,905) 62,026 164,357 316,207 355,510 (60,982) (585,395) (319,078) 11,616
Class C (45,023) (39,173) 12,697 (39,440) 26,935 (2,048) (276,642) (40,044) (75,325)
Total (714,157) 12,401 373,457 176,718 997,560 (303,647) (1,348,914) (671,360) (331,083)
NORTHWEST 2003 2004 2005 2006 2007 2008 2009 2010 YYTD 2011
Class A (280,998) 902,901 225,865 (488,651) 10,333 (302,930) (213,601) (21,262) (560,645)
Class B (397,531) 233,613 (234,681) 12,266 (164,112) (261,498) (680,058) (295,928) (358,363)
Class C 22,431 (13,282) (216,898) (15,371) (51,429) (28,362) (32,482) (192,091) (50,783)
Total (656,098) 1,123,232 (225,714) (491,756) (205,208) (592,790) (926,140) (509,280) (969,791)
O'HARE 2003 2004 2005 2006 2007 2008 2009 2010 YYTD 2011
Class A (159,845) 402,561 (55,786) 189,235 11,636 (256,325) 46,459 209,180 (90,761)
Class B 9,761 (306,424) 53,945 7,915 (81,167) (51,601) (291,145) 70,376 (19,928)
Class C (39,147) (15,002) (204,597) 90,170 (50,022) (35,696) (377,565) (10,855) 16,488
Total (189,231) 81,135 (206,438) 287,320 (119,553) (343,622) (622,251) 268,701 (94,200)
TOTALS 2003 2004 2005 2006 2007 2008 2009 2010 YYTD 2011
Class A (2,102,780) 2,375,342 468,781 (32,777) 1,179,365 (1,059,845) (1,174,928) (343,484) (656,216)
Class B (939,603) (36,326) 372,635 821,257 (92,841) (376,143) (2,018,540) (476,802) (473,899)
Class C (111,401) 9,479 (323,529) (90,491) (183,329) (153,547) (904,168) (235,972) (83,834)
Total (3,153,784) 2,348,495 517,887 697,989 903,195 (1,589,535) (4,097,636) (1,056,259) (1,213,949)
*Numbers in parentheses are negative
T H I R D Q U A R T E R 2 0 1 1 | C H I C A G O M A R K E T O V E R V I E W
SU
BU
RB
AN
CH
ICA
GO
21
FEATU
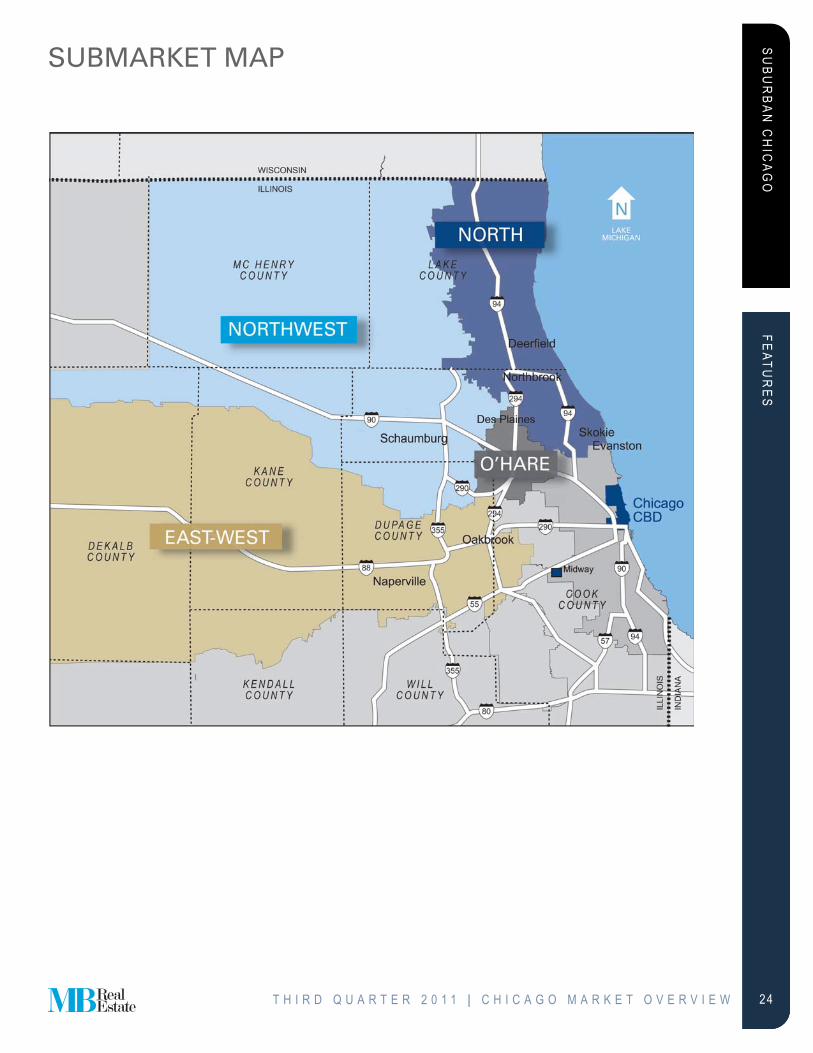
RE
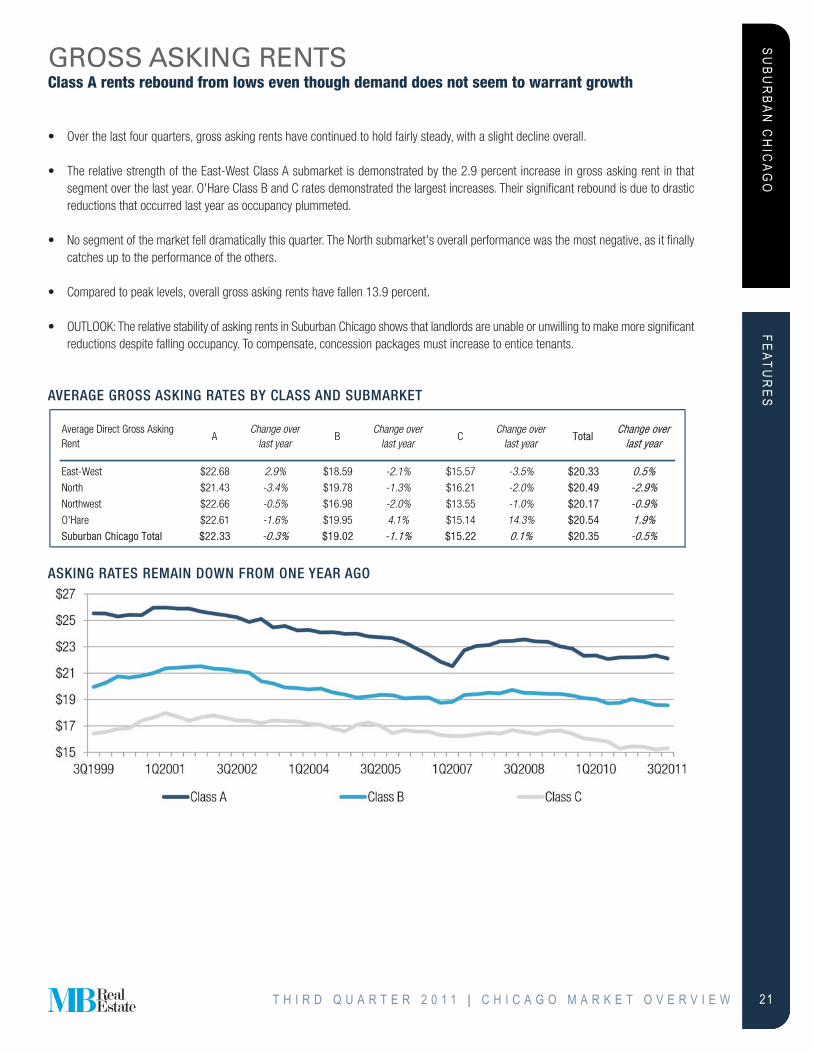
SGROSS ASKING RENTSClass A rents rebound from lows even though demand does not seem to warrant growth
• Over the last four quarters, gross asking rents have continued to hold fairly steady, with a slight decline overall.
• The relative strength of the East-West Class A submarket is demonstrated by the 2.9 percent increase in gross asking rent in thatsegment over the last year. O'Hare Class B and C rates demonstrated the largest increases. Their significant rebound is due to drasticreductions that occurred last year as occupancy plummeted.
• No segment of the market fell dramatically this quarter. The North submarket's overall performance was the most negative, as it finallycatches up to the performance of the others.
• Compared to peak levels, overall gross asking rents have fallen 13.9 percent.
• OUTLOOK: The relative stability of asking rents in Suburban Chicago shows that landlords are unable or unwilling to make more significantreductions despite falling occupancy. To compensate, concession packages must increase to entice tenants.
Average Direct Gross Asking Rent
AChange over
last yearB
Change over last year
CChange over
last yearTotal
Change over last year
East-West $22.68 2.9% $18.59 -2.1% $15.57 -3.5% $20.33 0.5%North $21.43 -3.4% $19.78 -1.3% $16.21 -2.0% $20.49 -2.9%Northwest $22.66 -0.5% $16.98 -2.0% $13.55 -1.0% $20.17 -0.9%O'Hare $22.61 -1.6% $19.95 4.1% $15.14 14.3% $20.54 1.9%Suburban Chicago Total $22.33 -0.3% $19.02 -1.1% $15.22 0.1% $20.35 -0.5%
AVERAGE GROSS ASKING RATES BY CLASS AND SUBMARKET
ASKING RATES REMAIN DOWN FROM ONE YEAR AGO
T H I R D Q U A R T E R 2 0 1 1 | C H I C A G O M A R K E T O V E R V I E W
SU
BU
RB
AN
CH
ICA
GO
22
FEATU
RE
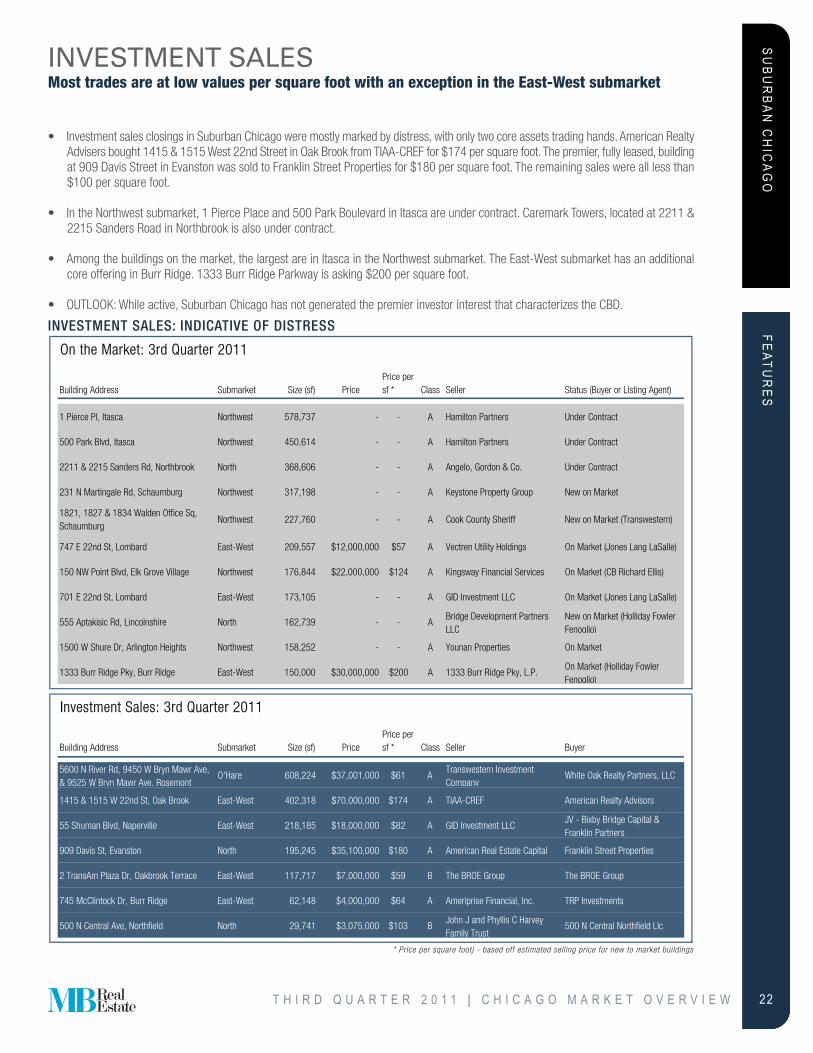
SINVESTMENT SALESMost trades are at low values per square foot with an exception in the East-West submarket
On the Market: 3rd Quarter 2011
Building Address Submarket Size (sf) PricePrice per sf * Class Seller Status (Buyer or Listing Agent)
1 Pierce Pl, Itasca Northwest 578,737 - - A Hamilton Partners Under Contract
500 Park Blvd, Itasca Northwest 450,614 - - A Hamilton Partners Under Contract
2211 & 2215 Sanders Rd, Northbrook North 368,606 - - A Angelo, Gordon & Co. Under Contract
231 N Martingale Rd, Schaumburg Northwest 317,198 - - A Keystone Property Group New on Market
1821, 1827 & 1834 Walden Office Sq, Schaumburg
Northwest 227,760 - - A Cook County Sheriff New on Market (Transwestern)
747 E 22nd St, Lombard East-West 209,557 $12,000,000 $57 A Vectren Utility Holdings On Market (Jones Lang LaSalle)
150 NW Point Blvd, Elk Grove Village Northwest 176,844 $22,000,000 $124 A Kingsway Financial Services On Market (CB Richard Ellis)
701 E 22nd St, Lombard East-West 173,105 - - A GID Investment LLC On Market (Jones Lang LaSalle)
555 Aptakisic Rd, Lincolnshire North 162,739 - - ABridge Development Partners LLC
New on Market (Holliday Fowler Fenoglio)
1500 W Shure Dr, Arlington Heights Northwest 158,252 - - A Younan Properties On Market
1333 Burr Ridge Pky, Burr Ridge East-West 150,000 $30,000,000 $200 A 1333 Burr Ridge Pky, L.P.On Market (Holliday Fowler Fenoglio)
IInvestment Sales: 3rd Quarter 2011
Building Address Submarket Size (sf) PricePrice per sf * Class Seller Buyer
5600 N River Rd, 9450 W Bryn Mawr Ave, & 9525 W Bryn Mawr Ave, Rosemont
O'Hare 608,224 $37,001,000 $61 ATranswestern Investment Company
White Oak Realty Partners, LLC
1415 & 1515 W 22nd St, Oak Brook East-West 402,318 $70,000,000 $174 A TIAA-CREF American Realty Advisors
55 Shuman Blvd, Naperville East-West 218,185 $18,000,000 $82 A GID Investment LLCJV - Bixby Bridge Capital & Franklin Partners
909 Davis St, Evanston North 195,245 $35,100,000 $180 A American Real Estate Capital Franklin Street Properties
2 TransAm Plaza Dr, Oakbrook Terrace East-West 117,717 $7,000,000 $59 B The BROE Group The BROE Group
745 McClintock Dr, Burr Ridge East-West 62,148 $4,000,000 $64 A Ameriprise Financial, Inc. TRP Investments
500 N Central Ave, Northfield North 29,741 $3,075,000 $103 BJohn J and Phyllis C Harvey Family Trust
500 N Central Northfield Llc
* Price per square foot) - based off estimated selling price for new to market buildings
• Investment sales closings in Suburban Chicago were mostly marked by distress, with only two core assets trading hands. American RealtyAdvisers bought 1415 & 1515 West 22nd Street in Oak Brook from TIAA-CREF for $174 per square foot. The premier, fully leased, buildingat 909 Davis Street in Evanston was sold to Franklin Street Properties for $180 per square foot. The remaining sales were all less than$100 per square foot.
• In the Northwest submarket, 1 Pierce Place and 500 Park Boulevard in Itasca are under contract. Caremark Towers, located at 2211 &2215 Sanders Road in Northbrook is also under contract.
• Among the buildings on the market, the largest are in Itasca in the Northwest submarket. The East-West submarket has an additionalcore offering in Burr Ridge. 1333 Burr Ridge Parkway is asking $200 per square foot.
• OUTLOOK: While active, Suburban Chicago has not generated the premier investor interest that characterizes the CBD.
INVESTMENT SALES: INDICATIVE OF DISTRESS
T H I R D Q U A R T E R 2 0 1 1 | C H I C A G O M A R K E T O V E R V I E W
SU
BU
RB
AN
CH
ICA
GO
23
FEATU
RE
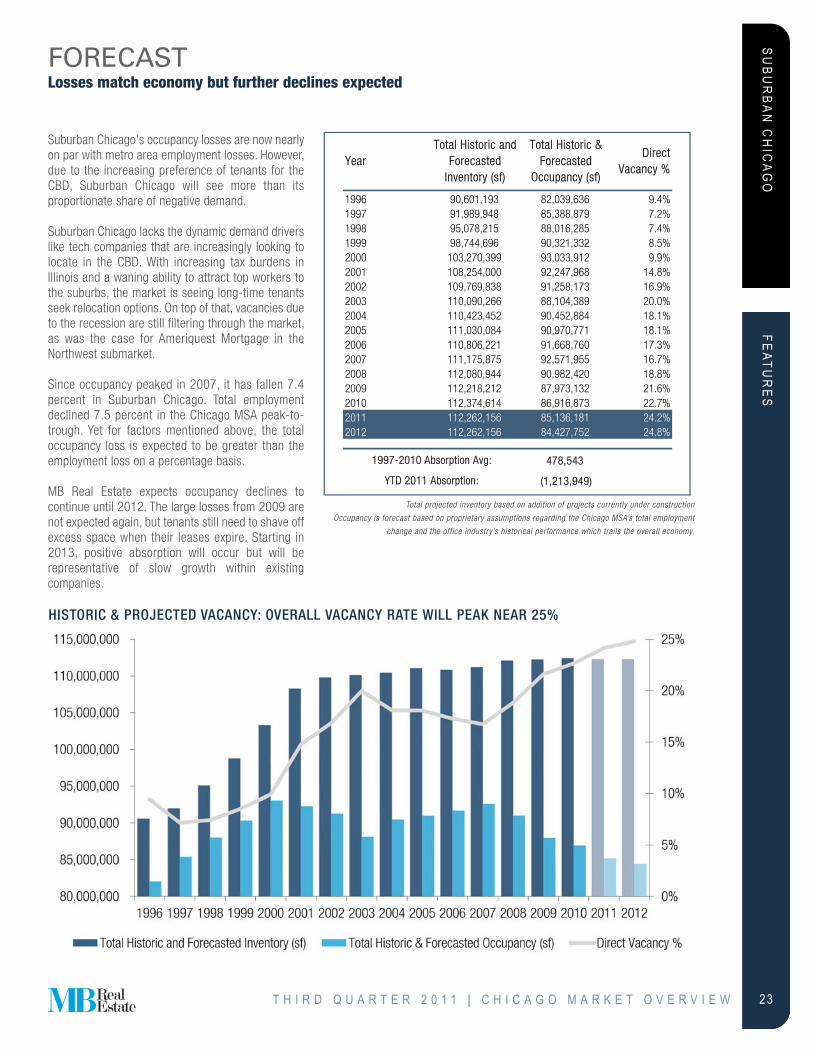
SFORECASTLosses match economy but further declines expected
Suburban Chicago's occupancy losses are now nearlyon par with metro area employment losses. However,due to the increasing preference of tenants for theCBD, Suburban Chicago will see more than itsproportionate share of negative demand.
Suburban Chicago lacks the dynamic demand driverslike tech companies that are increasingly looking tolocate in the CBD. With increasing tax burdens inIllinois and a waning ability to attract top workers tothe suburbs, the market is seeing long-time tenantsseek relocation options. On top of that, vacancies dueto the recession are still filtering through the market,as was the case for Ameriquest Mortgage in theNorthwest submarket.
Since occupancy peaked in 2007, it has fallen 7.4percent in Suburban Chicago. Total employmentdeclined 7.5 percent in the Chicago MSA peak-to-trough. Yet for factors mentioned above, the totaloccupancy loss is expected to be greater than theemployment loss on a percentage basis.
MB Real Estate expects occupancy declines tocontinue until 2012. The large losses from 2009 arenot expected again, but tenants still need to shave offexcess space when their leases expire. Starting in2013, positive absorption will occur but will berepresentative of slow growth within existingcompanies.
HISTORIC & PROJECTED VACANCY: OVERALL VACANCY RATE WILL PEAK NEAR 25%
YearTotal Historic and
Forecasted Inventory (sf)
Total Historic & Forecasted
Occupancy (sf)
Direct Vacancy %
1996 90,601,193 82,039,636 9.4%1997 91,989,948 85,388,879 7.2%1998 95,078,215 88,016,285 7.4%1999 98,744,696 90,321,332 8.5%2000 103,270,399 93,033,912 9.9%2001 108,254,000 92,247,968 14.8%2002 109,769,838 91,258,173 16.9%2003 110,090,266 88,104,389 20.0%2004 110,423,452 90,452,884 18.1%2005 111,030,084 90,970,771 18.1%2006 110,806,221 91,668,760 17.3%2007 111,175,875 92,571,955 16.7%2008 112,080,944 90,982,420 18.8%2009 112,218,212 87,973,132 21.6%2010 112,374,614 86,916,873 22.7%2011 112,262,156 85,136,181 24.2%2012 112,262,156 84,427,752 24.8%
478,543
(1,213,949)
1997-2010 Absorption Avg:
YTD 2011 Absorption:
Total projected inventory based on addition of projects currently under construction
Occupancy is forecast based on proprietary assumptions regarding the Chicago MSA’s total employment
change and the office industry’s historical performance which trails the overall economy.
T H I R D Q U A R T E R 2 0 1 1 | C H I C A G O M A R K E T O V E R V I E W
SU
BU
RB
AN
CH
ICA
GO
24
FEATU
RE
SSUBMARKET MAP
T H I R D Q U A R T E R 2 0 1 1 | C H I C A G O M A R K E T O V E R V I E W

SU
BU
RB
AN
CH
ICA
GO
25
FEATU
RE
SMARKET STATISTICS
EAST-WESTRBA(sf)
YTDAbsorption (sf)
3rd QuarterAbsorption (sf)
Direct Vacancy(sf)
Direct Vacancy
%
Occupancy(sf)
Sublease Vacancy
(sf)
Total Vacancy Rate (Vacancy +
Sublease) %
Class A 20,618,272 262,562 243,444 4,050,836 19.6% 16,567,436 887,120 23.9%
Class B 14,542,179 (107,224) (2,340) 3,471,390 23.9% 11,070,790 517,424 27.4%
Class C 4,910,365 25,786 (10,370) 1,133,974 23.1% 3,776,391 2,865 23.2%
TTotal 40,070,816 181,124 230,735 8,656,199 21.6% 31,414,617 1,407,409 25.1%
NORTHRBA(sf)
YTDAbsorption (sf)
3rd QuarterAbsorption (sf)
Direct Vacancy(sf)
Direct Vacancy
%
Occupancy(sf)
Sublease Vacancy
(sf)
Total Vacancy Rate (Vacancy +
Sublease) %
Class A 16,873,552 (267,373) (219,273) 3,460,510 20.5% 13,413,042 988,201 26.4%
Class B 7,442,387 11,616 60,789 1,535,925 20.6% 5,906,462 96,351 21.9%
Class C 2,560,495 (75,325) (30,473) 575,303 22.5% 1,985,192 13,858 23.0%
Total 26,876,434 (331,083) (188,957) 5,571,738 20.7% 21,304,696 1,098,410 24.8%
NORTHWESTRBA(sf)
YTDAbsorption (sf)
3rd QuarterAbsorption (sf)
Direct Vacancy(sf)
Direct Vacancy
%
Occupancy(sf)
Sublease Vacancy
(sf)
Total Vacancy Rate (Vacancy +
Sublease) %
Class A 18,526,958 (560,645) (369,035) 4,265,520 23.0% 14,261,438 302,014 24.7%
Class B 9,759,079 (358,363) (62,474) 3,412,449 35.0% 6,346,629 126,253 36.3%
Class C 2,312,562 (50,783) (24,371) 722,702 31.3% 1,589,860 31,596 32.6%
Total 30,598,599 (969,791) (455,880) 8,400,671 27.5% 22,197,928 459,863 29.0%
O'HARERBA(sf)
YTDAbsorption (sf)
3rd QuarterAbsorption (sf)
Direct Vacancy(sf)
Direct Vacancy
%
Occupancy(sf)
Sublease Vacancy
(sf)
Total Vacancy Rate (Vacancy +
Sublease) %
Class A 7,826,174 (90,761) (99,083) 1,696,289 21.7% 6,129,885 215,254 24.4%
Class B 4,347,075 (19,928) 49,943 1,358,542 31.3% 2,988,534 190,656 35.6%
Class C 2,543,059 16,488 16,488 907,883 35.7% 1,635,176 2,695 35.8%
Total 14,716,308 (94,200) (32,651) 3,962,714 26.9% 10,753,594 408,605 29.7%
TOTALSRBA(sf)
YTDAbsorption (sf)
3rd QuarterAbsorption (sf)
Direct Vacancy(sf)
Direct Vacancy
%
Occupancy(sf)
Sublease Vacancy
(sf)
Total Vacancy Rate (Vacancy +
Sublease) %
Class A 63,844,955 (656,216) (443,946) 13,473,155 21.1% 50,371,801 2,392,589 24.9%
Class B 36,090,720 (473,899) 45,918 9,778,305 27.1% 26,312,415 930,684 29.7%
Class C 12,326,481 (83,834) (48,726) 3,339,862 27.1% 8,986,619 51,014 27.5%
Total Suburban 112,262,156 (1,213,949) (446,753) 26,591,322 23.7% 85,670,835 3,374,287 26.7%
T H I R D Q U A R T E R 2 0 1 1 | C H I C A G O M A R K E T O V E R V I E W
CH
ICA
GO
MA
RK
ET O
VE
RV
IEW
26
SECTION FOUR
ADDITIONAL INFORMATIONGLOSSARY
Absorption: The net change in occupied space over a given period of time. Unless otherwise noted, Net Absorption includes direct and sublease space.
Asking Rent: The published rental rate for a space in a building, which mayvary from the rent which is negotiated upon by the tenant and landlord.
Central Business District: The designations of Central Business District (CBD)and Suburban refer to a particular geographic area within a metropolitanstatistical area (MSA) describing the level of real estate development foundthere. The CBD is characterized by a high density, well organized core withinthe largest city of a given MSA.
Class: A classification used to describe buildings, with Class A reflectingthe highest quality and Class C reflecting the lowest quality.
Direct Vacant Space: Space that is being offered for lease directly from thelandlord or owner of a building, as opposed to space being offered in abuilding by another tenant (or broker of a tenant) trying to sublet a space thathas already been leased.
Initial Rate: The contracted starting rental rate for the first term of a lease.
Inventory: The square footage of buildings that have received a certificateof occupancy and are able to be occupied by tenants. Calculated by addingthe Rentable Building Area (RBA) of all properties in a market or submarket.
Large Block: The amount of contiguous space available in a building interms of square footage. Contiguous spaces over 50,000 square feet areconsidered large by MB Real Estate.
Lease Comparable: Comparables are properties with characteristics thatare similar in nature. Their signing lease rates and other contracted elements are aggregated to analyze contracted market conditions as opposed to asking market conditions.
Market: Geographic boundaries that serve to delineate core areas that are competitive with each other and constitute a generally accepted primarycompetitive set of areas. Markets are building type specific and are non-overlapping contiguous geographic designations. Markets can be furthersubdivided into Submarkets.
Net Rental Rate: A rental rate that excludes certain expenses that a tenantcould incur in occupying office space. Such expenses are expected to bepaid directly by the tenant and may include janitorial costs, electricity, utilities, taxes, insurance and other related costs.
Preleased Space: The amount of space in a building that has been leasedprior to its construction completion date, or certificate of occupancy date.
Price/SF: Calculated by dividing the price of a building (either sales price or asking sales price) by the Rentable Building Area (RBA).
Rentable Building Area (RBA): The total building square footage that can beoccupied by or assigned to a tenant for the purpose of determining atenant’s rental obligation. Generally, RBA includes a percentage of common areas including all hallways, main lobbies, bathrooms, and telephone closets.
Rental Rates: The annual costs of occupancy for a particular space quotedon a per square foot basis.
Sales Price: The total dollar amount paid for a particular property at a particular point in time.
SF: Abbreviation for Square Feet.
Sublease Space: Space that has been leased by a tenant and is beingoffered for lease back to the market by the tenant with the lease obligation.Sublease space is sometimes referred to as sublet space.
Submarkets: Specific geographic boundaries that serve to delineate a coregroup of buildings that are competitive with each other and constitute a generally accepted primary competitive set, or peer group. Submarkets arebuilding type specific (office, industrial, retail, etc.), with distinct boundariesdependent on different factors relevant to each building type. Submarketsare non-overlapping, contiguous geographic designations having a cumulative sum that matches the boundaries of the Market they arelocated within.
Suburban: The Suburban and Central Business District (CBD) designationsrefer to a particular geographic area within a metropolitan statistical area(MSA). Suburban is defined as including all office inventory not located inthe CBD.
Tenant Improvement: Those changes to property to accommodate specificneeds of a tenant. TIs include installation or relocation of interior walls orpartitions, carpeting or other floor covering, shelves, windows, toilets, etc.The cost of these is negotiated in the lease.
Total Vacant Space: Direct plus sublease vacant space.
Under Construction: The status of a building that is in the process of being developed, assembled, built or constructed. A building is considered to beunder construction after it has begun construction and until it receives a certificate of occupancy.
Vacancy Rate: A measurement expressed as a percentage of the totalamount of physically vacant space divided by the total amount of existing inventory. Under construction space generally is not included in vacancy calculations. Vacancy rate can be based on direct, sublease, or total vacantspace.
Vacant Space: Space that is not currently occupied by a tenant, regardlessof any lease obligation that may be on the space. Vacant space could bespace that is either available or not available. For example, sublease spacethat is currently being paid for by a tenant but not occupied by that tenant,would be considered vacant space. Likewise, space that has been leasedbut not yet occupied because of finish work being done, would also be considered vacant space.
YTD: Abbreviation for Year-to-Date. Describes statistics that are cumulativefrom the beginning of a calendar year through whatever time period is beingstudied.
T H I R D Q U A R T E R 2 0 1 1 | C H I C A G O M A R K E T O V E R V I E W

MB
RE
AL E
STATE
27
ABOUT MB REAL ESTATEOur mission is to provide clients and investors with extraordinary real estate value and unlimited support
MB REAL ESTATE HEADQUARTERS181 West Madison, Suite 4700Chicago, Illinois 60602phone: 312.726.1700fax: 312.807.3853
EAST COAST REGIONAL HEADQUARTERS335 Madison Avenue, 14th FloorNew York, New York 10017phone: 212.350.2300fax: 212.350.2301
COMPANY LEADERSHIPPETER E. RICKERChairman & CEO
JOHN T. MURPHYPresident
DEPARTMENT LEADERSHIP
MARK A. BUTH Senior Vice President & Managing Director of Leasing Services
ANDREW J. DAVIDSON Executive Vice President & Managing Director of Corporate Services & Tenant Advisory
GARY A. DENENBERG Executive Vice President & Managing Director of Leasing Services
DAVID R. GRAFF Senior Vice President of Project Services
MAUREEN G. GROVE Vice President & Managing Director of Accounting Services
DANIEL J. NIKITAS Executive Vice President of Corporate Services & Tenant Advisory Services
KEV IN M. PURCELL Executive Vice President & Managing Director of Asset Management
PATRICIA ALUISI Senior Vice President & Managing Director of Administration
At MB Real Estate, our corporate mission is to maximize the value of our clients’real estate by creating timely and innovative solutions that meet their unique needsand objectives.
We offer the highest level of real estate support with our team of committed, results-driven experts in asset and facilities management, leasing, tenant representation,development, project management, and investment services.
Supported by dedicated accounting, marketing, human resources, and informationtechnology teams, our unique full-service firm is an industry leader in local and national corporate real estate.
T H I R D Q U A R T E R 2 0 1 1 | C H I C A G O M A R K E T O V E R V I E W


