
Welcome to our e-Seminar:
Maximizing HPLC Speed and Resolution with the new 1100 DAD SL
Presenter: Dr. Stefan Schuette

Slide 2
Outline
• Part 1
What do I need to do to maximize HPLC speed?
• Part 2
What is the performance level I can achieve using the new 1100 DAD SL?
• Part 3
How does the new DAD SL help to increase data security and traceability?

Slide 3
Part 1
What do I need to do to maximize HPLC Speed?
Slide 4
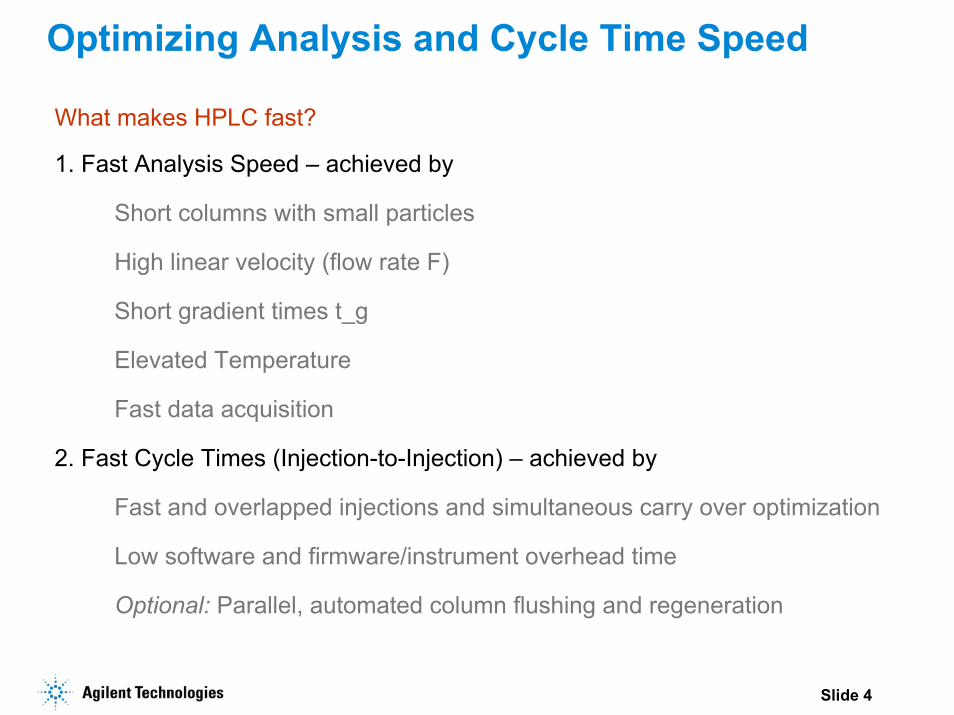
Optimizing Analysis and Cycle Time Speed
What makes HPLC fast?
1. Fast Analysis Speed – achieved by
Short columns with small particles
High linear velocity (flow rate F)
Short gradient times t_g
Elevated Temperature
Fast data acquisition
2. Fast Cycle Times (Injection-to-Injection) – achieved by
Fast and overlapped injections and simultaneous carry over optimization
Low software and firmware/instrument overhead time
Optional: Parallel, automated column flushing and regeneration

Slide 5
1100 System Configuration for Ultra-fast LC
• 1100 Series Binary Pump – for precise, high-pressure mixing gradient formation and low delay volume
• 1100 Series WPS – for precise, high-speed injection with lowest delay volume and carry over
• 1100 Series TCC – for precise, peltier-controlled high-temperature LC up to 80C
• 1100 Series DAD/MWD SL – for highest chromatographic resolution by 80Hz data rate
• Zorbax RRHT 1.8um Columns –for highest efficiency at high linear flows

Slide 6
1100 System Configuration for Ultra-fast LC Recommendations for System Setup and Connecting Capillaries
Replace standard mixer of Binary Pump with 80 µL filter(p/n 5064-8273) to reduce delay volumneUse low volume, 3ul heat exchanger of TCC G1316A to thermostatt the eluentFor 4.6 and 3mm columns use shortest possible 0.17mm ID connecting capillaries
Note: In ultra-fast applications the typical flow rate range using 4.6 and 3mm ID columns is 1-5ml/min. At such higher flow rates the larger delay volume of 0.17mm ID capillaries doesn’t have a measurable negative impact on chromatographic performance.
For 2.1 and 1mm columns use shortest possible 0.12 or 0.1mm ID capillaries
Note: In ultra-fast application the typical flow rate range using 2.1 and 1mm ID columns is between 0.1-1ml/min. At these lower flow rates smaller ID connecting capillaries should be used to minimize system delay volume and extra column peak dispersion/band broadening.
Inlet tubing of the flow cell should be directly connected to the column.
Note: If this is not possible an appropriate low-volumeconnection should be used (capillary of small ID, i.e. 0.12mm or 0.17mm and ZDV-union).
1100 Binary Pump (G1312A)
1100 WPS(G1367A)
4.6mm ID, 1.8um
Waste
3 µL heat exchanger
1100 TCC(G1316A)
RRHT Column
1100 DAD SL(G1315C)

Slide 7
How to achieve Maximum Analysis Speed
1. Decrease the column length Advantages:
• Proportional decrease of analysis time • Proportional decrease of solvent consumption
Draw back: Drop of Resolution: R ~ SQRT(L)
2. Decrease the particle sizeAdvantage: Increase of Resolution R ~ SQRT(1/d_particle)Draw back: Increase of backpressure
3. Increase the flow rate F Advantage: Decrease of analysis time
• Isocratic: Analysis Time ~ F• Gradient: For Analysis Time ~ F decrease t_g such that F x t_g = const
Draw back: Further increase of backpressure
4. Increase the temperatureAdvantages:
• Decrease of backpressure• Decrease of analysis time• Decrease of solvent consumption

Slide 8
Van Deemter CurvesEfficiency of 1.8um Columns
-0.0005
0.0000
0.0005
0.0010
0.0015
0.0020
0.0025
0.0030
0.0035
0.0040
0.0045
0.0 0.2 0.4 0.6 0.8 1.0 1.2 1.4 1.6
ZORBAX Eclipse XDB-C184.6 x 50mm (30mm)85:15 ACN:Water1.0µL Octanophenone0.05 – 5.0 mL/min20°C 5.0 µm
3.5 µm
1.8 µm
260,740 N/m @ 2mL/min 5.0 mL/min
Efficiency gain of 1.8µm versus 5µm columns:
3.2x @ 2ml/min4.4x @ 5ml/min
HET
P (c
m/p
late
)
Interstitial linear velocity (ue- cm/sec)
Particle H_min5µm 9.3µm3.5µm 6.0µm1.8µm 3.8µm
Note: Efficiency of 1.8µm columns is virtually flow-rate independent.
⇒ Up to 2.1x Resolution⇒ Up to 4.4x Speed

Slide 9
Column Recommendations
Zorbax 4.6mm ID RRHT columns for best LC/UV results (speed, resolution, sensitivity)As starting point 4.6 x 50mm is recommended (maximum resolution). If resolution is higher than necessary column length can be reduce for further speed gains.
Use SB-C18 for highest performance (allows for Temperatures up to 90C)
Leads to minimum 5x gains in analysis speed without loss in resolution compared to 5um columns
Same chemistry & selectivity, saves minimum of 80% solvent
4.6mm column can also be used for LC/MS. However, flow splitting might be necessary at F > 1ml/min.
Zorbax 2.1mm ID RRHT Columns are recommended for HT LC/MS(/UV) onlyDisadvantage:
Some loss in UV Resolution or Sensitivity compared to 4.6mm columns (compare slide 16)
Low volume UV cell (5ul, 1.7ul, 500nl) for maximum resolution, but reduced S/N
Larger volume UV cell (13ul) for maximum S/N, but some extra column broadening
Advantages
Saves >95% solvent compared to 4.6mm ID columns with 5um particles (compare to 80% of 4.6mm)
No need for splitting (flow rates < 1ml/min)

Slide 10
1100 Binary Pumps for Ultra-Fast GradientsHigh-Pressure Mixing Gradient Pumps for all Needs
Binary Pump0.5 to 5 ml/min3-8mm id columns
Binary + Degasser0.05 to 5 ml/min1-4mm id columns
Capillary Pump1 – 100 µl/min0.1–1mm id columns
Nano Pump10nl/min – 4 µl/min50-100 µm id columns
Superior gradient performance and RT precisionby high pressure gradient mixing and variable stroke
Highest speed and selectivity in fast gradient runsby minimized delay volumes (190-490ul with 80ul mixer)
Lowest detector noise and stability at low flow ratesby micro vacuum degasser
Highest stability and performance in Cap and Nano LCby electronic flow control

Slide 11
1100 Series DAD SL for Ultra-fast Detection
80Hz Data Acquisition of up to 8 Signals Up to 100% resolution gain in ultra-fast, quantitative LC
80Hz Full Spectral Data Acquisitionfor ultra-fast peak purity analysis and spectral conformation even for trace level compounds
Improved Diode-Array Front-end Electronicsfor minimized noise (typical < +/- 6µAU ASTM)
New standard flow cell (13ul/10mm)for maximized practical sensitivity by minimized RI-sensitivity and dispersion
New Electronic Temperature Control for maximized practical sensitivity by reduced baselinewander
Builds upon 1100 DADFor compatibility with existing methods, cells and libraries
Preserving features like programmable slit and dual lampdesign

Slide 12
DAD SL Method Setup – Recommendations
Signals:• Sample = WL of maximum absorbance• BW = NBW of absorbance spectrum• Reference = such that WL – 0.5 x Ref BW
lies outside Absorbance band• Reference BW = 50-100nmSlit
• For optimum spectral analysis choose slit such that NBW/Slit > 10 for all compounds
• For maximum sensitivity slit can be increased to 8 or 16nmPeakwidth• For optimum chromatographic resolution
choose Peakwidth equal or smaller than FWHM of narrowest peak.
• For maximum sensitivity choose Peakwidth twice as large as narrowest peak

Slide 13
DAD SL Method Setup – Recommendations Peak Width, Response Time, Data Rate and Sensitivity
> 0.15 sec
> 0.3 sec
> 0.6 sec
> 1.2 sec
> 3 sec
> 6 sec
> 12 sec
> 24 sec
> 51 sec Peak Width = Peak Width at 50% Peak Height
Don‘t use for > 0.15 sec peak width
For 50% peak width of 0.15 – 0.3 sec
For 50% peak width of 0.6 – 1.5 sec
For 50% peak width of 0.3 – 0.6 sec
Note and Recommendations:Noise level changes approx. proportional to the square root of the change in response time (data rate).• To not give up sensitivity the Peak Width should not be chosen smaller than narrowest peaks• To compensate increased noise the slit can be increased to 8 or 16nm.

Slide 14
DAD SL – Flow Cell Recommendations
13µl Standard Flow Cell: For highest sensitivity and linearityHigh-demanding quantitative work, e.g. analytical method development, QA/QC4.6 – 3 mm ID Columns
1.7µl Micro Flow Cell: For highest selectivityUltra-fast semi-quantitative work, e.g. Screening Experiments, HT LC/MS/UV2.1 – 1mm ID Columns
5µl Semi-micro Flow Cell: Best compromise of sensitivity and selectivityFor good quantitative and qualitative results, e.g. Screening, HT LC/MS/UV, Early Formulation Studies4.6 – 1mm ID Columns+
++
+++
Signal /Noise Resolution*Flow Cell
Volume/Pathlength
+++1.7 µl / 6mm
++5 µl / 6mm
+13 µl / 10mm
* Depends on analytical conditions and column dimension

Slide 15
1100 Series WPS for High-Speed InjectionsDelay Volume Reduction and Overlapped Injections
Main Pass Bypass
Simulteanous Speed and CO optimization by• Simple „one-valve“ flow-though design• Automatic delay volume reduction (6ul)• Overlapped injection• Programmable sample flush-out time• External needle wash• MCO by additional valve switches

Slide 16
1100 Series WPS for High-Speed InjectionsMinimizing Carry Over
Injection 1(Switch to mainpass)
0
ADVR (switch to Bypass) or ADVR + MCO (switchBP>MP>BP)
Overlapped injection: Next sample drawn and needle moves towash-port
Start external needle wash End Run 1
Needle movesto injection port
1.2 min72 sec
≈
Sample flush-outtime
t1
Injection 2(Switch tomainpass)
1.3 mint2 = 29 sect2 = 30 sect2 = 32 sec
A: t1 = 0.65 sec (Flash-out factor 5, no MCO)B: t1 = 1.30 sec (Flash-out factor 10, MCO)C: t1 = 2.61 sec (Flash-out factor 20, MCO)
t3 = 35 sect3 = 36 sect3 = 38 sec
How to minimize Carryover when using OI• Increase sample flush-out factor
• Use external needle wash
• Use minimized carryover option to removesticky compounds from grooves of injectionvalve by automated valve switch
min0 0.2 0.4 0.6 0.8 1
mAU
0
100
200
300
400
500
ABC
C: CO < 0.003% (LOD)B: CO < 0.5%A: CO < 1%
Flow rate 2.3ml/min

Slide 17
1100 Series WPS for High-Speed InjectionsFast Gradients, Short Cycle Times, Low Carry Over, High Precision
Fast gradientsShort cycle times
Minimized carryoverHigh area precision
Large linear range WPSµWPS
Drawn volume = Injected volume
6.2 µl delay volume in overlapped injection mode
< 15 sec including inside loop and needle wash
< 30 sec including inside loop and needle and external needle wash
< 0.003% Beclomethasone
< 1% from 1-5µl and < 0.5% from 5-100µl
0.1–100µl (1500µl) without loop change
0.01–8µl (40µl) without loop change
Compatibility with small sample amounts

Slide 18
1100 Valve Solutions for Faster Cycle Times Alternating Column Regeneration with 2 PS/10 PT Valve
• Shorter cycle times and increased sample throughput for HT and method development labs
• Saves up to 50% of cycletime by parallel columnwash and regeneration

Slide 19
1100 System Configuration for Ultra-fast LCSystem with Automated Alternating Column Wash and Regeneration
Gradient Equilibration
2PS/10PT ValveG1316A #57
4.6 x 50mm, 1.8um 4.6 x 50mm, 1.8um
0.17 mm ID capillary
1100 TCC(G1316A)
RRHT ColumnRRHT Column
Binary pump 1(G1312A)
Gradient pump 2(G1312A)
1100 WPS (G1367A)
DAD SL(G1315C)
Waste
Slide 20
Part 2
What is the performance level I can achieve using the new 1100 DAD SL?
Slide 21
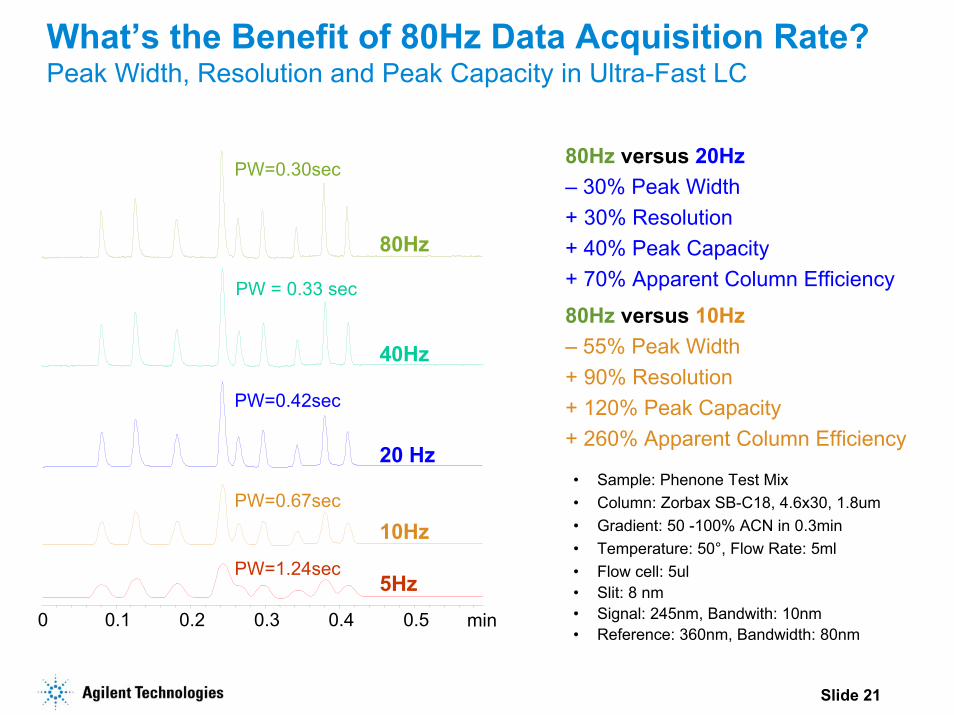
What’s the Benefit of 80Hz Data Acquisition Rate? Peak Width, Resolution and Peak Capacity in Ultra-Fast LC
80Hz versus 20Hz– 30% Peak Width+ 30% Resolution + 40% Peak Capacity+ 70% Apparent Column Efficiency
80Hz
PW=0.30sec
40Hz
PW = 0.33 sec80Hz versus 10Hz– 55% Peak Width+ 90% Resolution+ 120% Peak Capacity+ 260% Apparent Column Efficiency
20 Hz
PW=0.42sec
• Sample: Phenone Test Mix• Column: Zorbax SB-C18, 4.6x30, 1.8um• Gradient: 50 -100% ACN in 0.3min• Temperature: 50°, Flow Rate: 5ml• Flow cell: 5ul • Slit: 8 nm• Signal: 245nm, Bandwith: 10nm• Reference: 360nm, Bandwidth: 80nm
10HzPW=0.67sec
5HzPW=1.24sec
min0.1 0.2 0.3 0.4 0.50

Slide 22
Ultra-fast Gradient Analysis of 9 PhenonesIncreasing Temperature and Flow Rate to push the limits
min0 0.2 0.4 0.6 0.8 1
32°C2.9mL/min383bar
min
60°C2.9mL/min259bar
min0 0.2 0.4 0.6 0.8 1
min0 0.2 0.4 0.6 0.8 1
40°C2.9mL/min342bar
0 0.2 0.4 0.6 0.8 1
4.35mL/min390bar
79
79
72
72
73
69
64
PeakCapacity
0.64
0.67
0.72
0.78
0.81
0.84
0.86
AnalysisTime/min
2.65
2.74
2.74
2.44
2.62
2.94
2.94
Rs (4,5)
0.80
0.85
0.90
0.95
0.95
1.0
1.0
*Cycle Time/min
0.573422.940
0.542942.950
0.503904.360
0.503503.960
0.553043.460
0.552592.960
0.623832.932
W4σsec
Pbar
Flowml/min
T°C
Sample: 9 PhenonesColumn: Zorbax SB C18 4.6 x 50mm, 1.8 µmGradient:: 50 -100% ACN in 0.65min
60°C
*Achievable CT with column regenerationWithout CR: CT = CT+0.2min
Slide 23
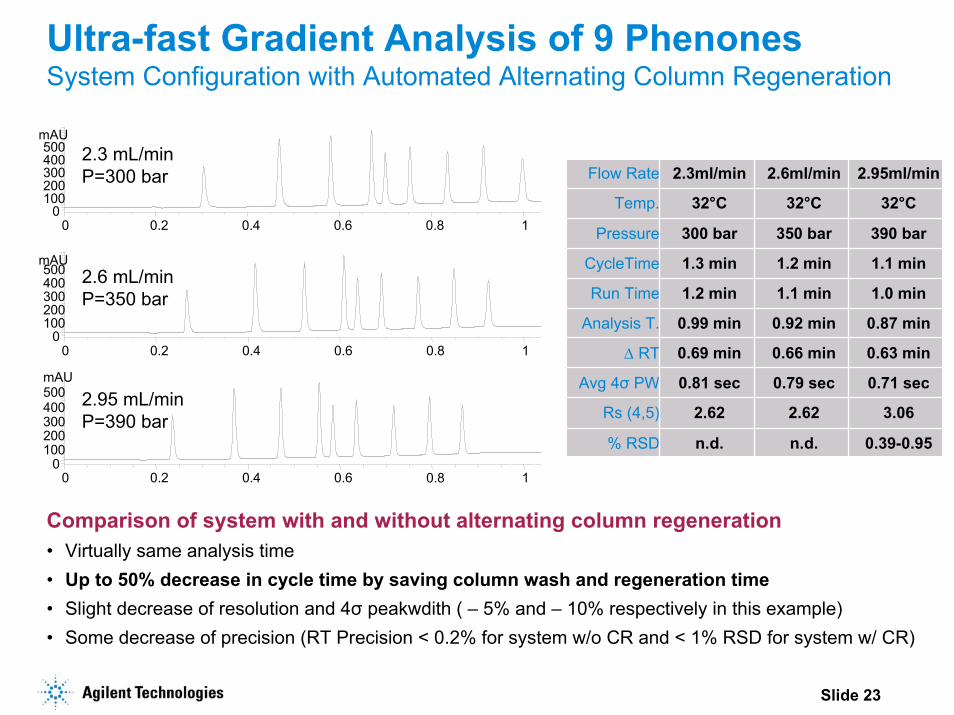
Ultra-fast Gradient Analysis of 9 PhenonesSystem Configuration with Automated Alternating Column Regeneration
min0 0.2 0.4 0.6 0.8 1
mAU
0100200300400500
min0 0.2 0.4 0.6 0.8 1
mAU
0100200300400500
2.6 mL/minP=350 bar
2.95 mL/minP=390 bar
min0 0.2 0.4 0.6 0.8 1
mAU
0100200300400500 2.3 mL/min
P=300 bar32°C32°C32°CTemp.
0.39-0.95n.d.n.d.% RSD
3.062.622.62Rs (4,5)
390 bar350 bar300 barPressure
0.71 sec0.79 sec0.81 secAvg 4σ PW
0.63 min0.66 min0.69 min∆ RT
0.87 min0.92 min0.99 minAnalysis T.
1.0 min1.1 min1.2 minRun Time
1.1 min1.2 min1.3 minCycleTime
2.95ml/min2.6ml/min2.3ml/minFlow Rate
Comparison of system with and without alternating column regeneration• Virtually same analysis time• Up to 50% decrease in cycle time by saving column wash and regeneration time• Slight decrease of resolution and 4σ peakwdith ( – 5% and – 10% respectively in this example)• Some decrease of precision (RT Precision < 0.2% for system w/o CR and < 1% RSD for system w/ CR)

Slide 24
Performance Requirements of Ultra-Fast LC
• Ultra-fast LC using the 1100 DAD SL provides Resolutionand Peak Capacity gains of up to 100%.
• But – Can I still fulfill my (regulatory) performance and robustness requirements under ultra-fast LC conditions?
• Quantification of 0.05% level Impurities with S/N > 10?
• RT Precision < 0.5% ?
• Area Precision < 1% ?
• Peak Purity Analysis at Trace Levels ?
• Same LOD as in conventional HPLC ?
• Spectral Conformation at Trace Levels ?
• Robustness of method, column and instrument?

Slide 25
Sensitivity and Linearity in Ultra-Fast LC Can I Simultaneously Quantity Main Compounds and Side Products at 0.05% Level?
min0.5 1 1.5 2 2.5
mAU
0
500
1000
1500
2000
DMSO
Main Compound (Nimodipin)2000mAU (100% level)
Impurities (Nifedipin) 1mAU (0.05% level)
Impurities
Is the detectors Dynamic Range large enough to accurately quantify Main Compound and Impurities simultaneously?

Slide 26
Sensitivity and Linearity in Ultra-Fast LC Is the Linear Range Large Enough for my Quantitative Analysis?
Linearity (Caffeine Sample): Deviation at 2.0AU:
• 2.0% (Vis Lamp off)• 2.5% (Vis Lamp on)
5% Deviation:• 2.5 AU (Vis Lamp off)• 2.4 AU (Vis Lamp off)
Specification: • 5% Deviation at 2.0 AU
80.0%
85.0%
90.0%
95.0%
100.0%
105.0%
0 500 1000 1500 2000 2500 3000
Absorbance / mAU
% D
eviat
ion fr
om L
inear
Valu
e
Vis Lamp off
Vis Lamp on

Slide 27
Sensitivity and Linearity in Ultra-Fast LC Reproducibility of Main Compounds at 2000mAU (100% Level)
• Gradient: 50–70% B in 0.85min• Column: 4.6 x 50, 1.8um• Injection: 5ul of
550 µg/ml Nimodipin• Flow Rate: 4 ml/min• Flow cell: 13ul• Data Rate: 80Hz• Slit: 8nm
Overlay of 10 analyses at 245nm• RT Precision: 0.067% RSD• Area Precision: 0.13% RSD
Typical Requirement:• RT Precision: < 0.3% RSD • Area Precision: < 0.7% RSD
min0.61 0.62 0.63 0.64 0.65 0.66 0.67
mAU
0
250
500
750
1000
1250
1500
1750
2000
Peak Width
0.70 sec

Slide 28
Sensitivity and Linearity in Ultra-Fast LC Is the Noise Low Enough for my Quantitative Analysis?
Peak-to-Peak Noise on 13ul Flow Cell
min5 10 15 20
mAU
-0.04-0.03-0.02-0.01
0 16nm SlitNoise < 4.0 µAU
ASTM Noise Specification:20 µAU Peak-to-Peak (+/- 10 µAU)
• Temperature: 20C• DAD: 254nm,16nm, Ref 360, 80nm • PW: > 0.1min (2.5Hz, 2sec RT)
Conditions• Eluent: Water/ACN = 70/30• Flow rate: 1ml/min• 4.6x30mm SB C18, 1.8um
min5 10 15 20
mAU
-0.06
-0.04
-0.02
0 4nm SlitNoise < 7.4 µAU
min5 10 15 20
mAU
-0.1-0.08-0.06-0.04-0.02
8nm Slit Noise < 5.4 µAU
7.4
15
21
30
42
4nm Slit 16nm Slit8nm Slit
111620 Hz
8.011 10 Hz
4.05.42.5 Hz
162240 Hz
233180 Hz
Note: 50µAU Noise gives S/N = 20 at 1mAU (0.05% level)

Slide 29
Sensitivity and Linearity in Ultra-Fast LC Can I quantity Impurities and Side Products at 0.05% Level?
Conditions:• Column: 4.6 x 50, 1.8um• Gradient: 50–70% B in 0.85 min• Injection: 5ul• Flow Rate: 4 ml/min• Flow cell: 13ul • Data Rate: 80Hz• Slit: 8nm
Nifedipin at trace levelsPeak Width = 0.63 sec
min0.3 0.31 0.32 0.33
mAU
0
0.5
1
1.5
22mAU = 0.1% level
S/N = 50
1mAU = 0.05% level S/N = 25
0.5mAU = 0.025% level S/N = 12
Noise 40 µAU
Result:Under ultra-fast LC conditions the DAD SL allows accurate quantitation of impurities and side products at levels smaller than 0.05% of the main compound(s).

Slide 30
Sensitivity and Linearity in Ultra-Fast LC Reproducibility of Impurities and Side Products at Trace Level
min0.2 0.25 0.3 0.35 0.4 0.45 0.5 0.55
mAU
0
1
2
3
4
5
6
Overlay of 10 analyses at 245 nm:Nifedipin • A = 2.5mAU (0.1% level)• RT Precision = 0.092% RSD
Nifedipin degradation product• A = 0.5mAU (0.03% level)• RT Precision = 0.123% RSD
• Column: 4.6 x 50, 1.8um• Gradient: 50–70% B in 0.85 min• Injection: 5ul• Flow Rate: 4 ml/min• Flow cell: 13ul• Data Rate: 80Hz• Slit: 8nm
Typical Requirement:• RT Precision < 1.0% RSD
Slide 31
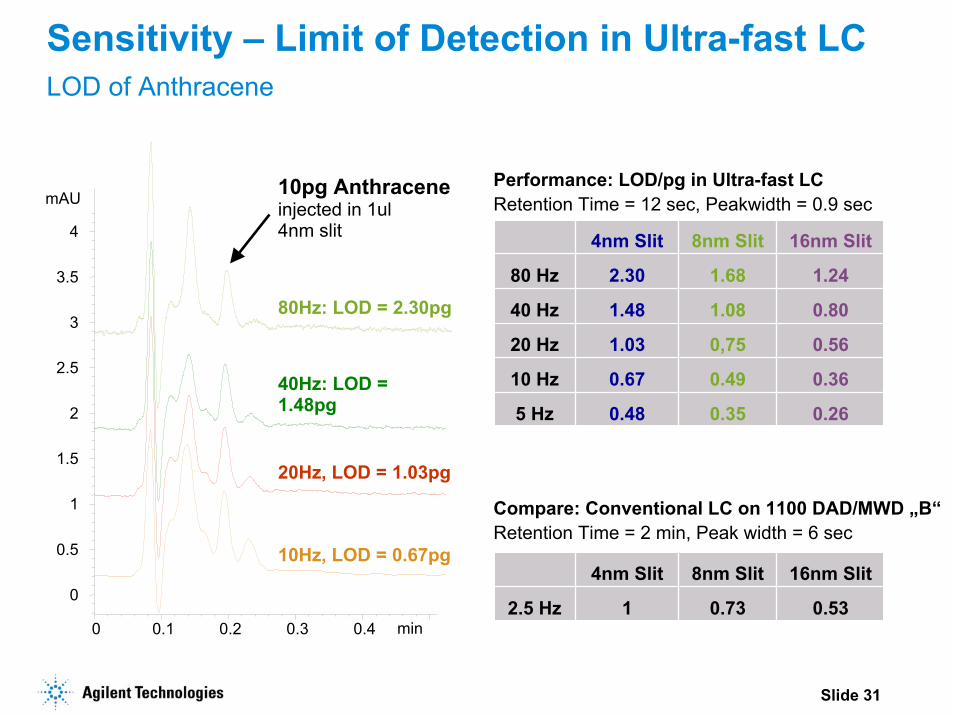
Sensitivity – Limit of Detection in Ultra-fast LCLOD of Anthracene
10pg Anthraceneinjected in 1ul 4nm slit
40Hz: LOD = 1.48pg
20Hz, LOD = 1.03pg
10Hz, LOD = 0.67pg
80Hz: LOD = 2.30pg
0 0.1 0.2 0.3 0.4
mAU
0
0.5
1
1.5
2
2.5
3
3.5
4
min
0.48
0.67
1.03
1.48
2.30
4nm Slit 16nm Slit8nm Slit
0.560,7520 Hz
0.360.4910 Hz
0.260.355 Hz
0.801.0840 Hz
1.241.6880 Hz
1
4nm Slit 16nm Slit8nm Slit
0.530.732.5 Hz
Compare: Conventional LC on 1100 DAD/MWD „B“Retention Time = 2 min, Peak width = 6 sec
Performance: LOD/pg in Ultra-fast LCRetention Time = 12 sec, Peakwidth = 0.9 sec

Slide 32
Spectral Analysis in Ultra-Fast LCCan I do Peak Purity and Spectral Conformation at Trace Levels?
nm300 400 500 600 700 800
mAU
0
400
800
1200
Reference Spectrum of Nifedipin at 100% level (1800 mAU) measured at 80 Hz:
Apex Spectrum of Nifedipin at 0.1% (1.8 mAU) measured at 80 Hz:
nm300 400 500 600 700 800
mAU
0
0.5
1.0
1.5 Is the spectral quality obtained at trace level under ultra-fast LC conditions and 80Hz spectral sampling rate good enoughfor peak purity analysis and spectral conformation?

Slide 33
UV Spectrum of Nifedipin at higher concentration (ca. x180):
min1.6 1.7 1.8 1.9 2
Norm.
6
8
10
12
14
DAD1 A, Sig=245,10 Ref=500,80 (N:\BACKUP_MSD\DATA_MRZ\MF_180305_STD_A_ALL\NIMIX_1_2000_1_G_05.D)
1.6
29
2.0
26
nm300 400 500 600 700 800 900
Fl
-0.25
0
0.25
0.5
0.75
1
1.25
1.5
1.75
mAU
Overlay of extracted Nifedipin spectra at trace level
Spectral Analysis in Ultra-Fast LCCan I do 80Hz Peak Purity Analysis at Trace Levels?
Result: Nifedipin peak at 0.1% level (1.8mAU) measured with 80Hz spectral rate is pure – no other compounds are co-eluting with Nifedipin

Slide 34
Spectral Analysis in Ultra-Fast LCCan I do 80Hz Spectral Conformation at Trace Levels?
nm300 400 500 600 700 800 900
Norm
0
0.25
0.5
0.75
1
1.25
1.5
1.75
2Overlay of 80Hz Reference and Apex Spectrum
• Nifedipin Ref: 1800mAU (100% level) • Nifedipin Apex: 1.8mAU (0.1% level)
Match Factor = 963
nm300 400 500 600 700 800 900
Norm
0
0.25
0.5
0.75
1
1.25
1.5
1.75
2 Overlay of 80Hz Reference and Apex Spectrum• Nimodipin Ref: 1800mAU (100% level) • Nifedipin Apex: 1.8mAU (0.1% level)
Match Factor = 929
Result:
Identification of Nifedipin at 0.1% tracelevel under fast LC conditions and 80Hz spectral sampling rate

Slide 35
Robustness in Ultra-Fast LCAre methods, column and instrument robust enough for 24x7 operation?
min0.2 0.4 0.6 0.8 1
injection 1
injection 4000Column 2
Column 1injection 4000
injection 2000
injection 2000
injection 1
min0.2 0.4 0.6 0.8 1
P=300bar
Injection Number
0.4
0.5
0.6
0.7
0.8
0.4
0.5
0.6
0.7
0.8
0 500 1000 1500 2000 2500 3000 3500 4000
Column 1
Column 2
∆RT/min
W1/2 /sec
0 500 1000 1500 2000 2500 3000 3500 4000
∆RT/min
W1/2 /sec
Stability study on system configuration with automated column regeneration:• Stable system and column performance for 8000 injection (4000 injections per column)• System suitable for unattended and automated 24x7 operation and reliable over-weekend runs
Slide 36
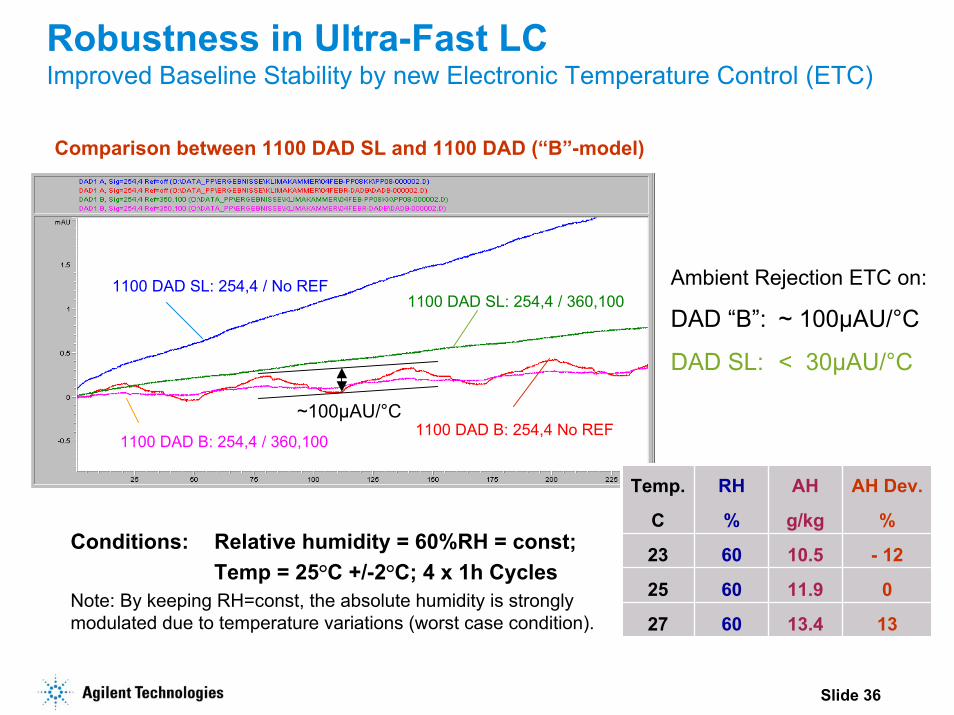
Robustness in Ultra-Fast LCImproved Baseline Stability by new Electronic Temperature Control (ETC)
1100 DAD SL: 254,4 / No REF1100 DAD SL: 254,4 / 360,100
1100 DAD B: 254,4 No REF1100 DAD B: 254,4 / 360,100
~100µAU/°C
Comparison between 1100 DAD SL and 1100 DAD (“B”-model)
Ambient Rejection ETC on:
DAD “B”: ~ 100µAU/°C
DAD SL: < 30µAU/°C
60
60
60
RH
%
AH Dev.
%
AH
g/kg
Temp.
C
1313.427
011.925
- 1210.523Conditions: Relative humidity = 60%RH = const; Temp = 25°C +/-2°C; 4 x 1h Cycles
Note: By keeping RH=const, the absolute humidity is strongly modulated due to temperature variations (worst case condition).

Slide 37
Part 3
How does the new DAD SL help to increase data security and traceability?

Slide 38
New Data Recovery Card*The first LC Detector with “Data Never Lost” Insurance
Data Recovery Card* - DRC• All signals, spectra and meta data are
buffered on high-capacity, embedded 256MB Compact Flash Card compliant with 21 CFR Part 11.
• Prevents any data loss in case of communication breakdowns between instrument and PC.
• Automatic Run Recovery in case of temporary communication failures.
• Manual Run Recovery in case of permanent communication failures” after software, PC, and/or instrument re-boot.
*Patent Filed

Slide 39
New Data Recovery CardThe first LC Detector with “Data Never Lost” Insurance
Automated Run Recovery in case of temporary communication failures
A) Time Elapsed = 0.3 min • Run in Progress
B) Time Elapsed = 0.6 min• Communication Failure Occurs
C) Time Elapsed = 1.9 min • Communication is re-established• Automatic data transfer DRC > PC• No user interaction necessary

Slide 40
New Data Recovery CardThe first LC Detector with “Data Never Lost” Insurance
Manual Run Recovery in case of permanent communication failures
• Run Recovery dialog pops-up automatically after system re-boot.
• Data are stored on the PC under a pre-configured location.

Slide 41
DAD SL – The Next Level of Data TraceabilityProprietary RFID Technology for Flow Cells and UV Lamp
Radio Frequency Identification Tags• RFID tags records all relevant data
necessary to recall instrument conditions under which a run has been executed.
• Minimizes the risk of false data interpretation, because measurement conditions are documented.
• Meta data stored on RFID tags are saved with each raw data file for unambiguous answers to (auditor-) questions like
“Which type of flow cell was used to generate this chromatogram -what was the path length and volume?”
“Did the accumulated burn-time of the lamp exceed pre-defined limit?”
Flow Cell • Path length• Volume• Max pressure• Date last test passed• Product number• Serial number• Production date
UV Lamp • Accumulated on-time• Actual on-time• Number of ignitions• Date last test passed• Product number• Serial number• Production date

Slide 42
1100 Series DAD SL and Ultra–fast LCMore Information
• DAD SL Product Landing Page http://www.agilent.com/chem/dad-sl
• Brochure 5989-2789EN – Agilent 1100 Series Diode-Array Detector SL
• Presentation – 80Hz Data Acquisition for Ultra-fast LC
• Article – New 1100 Series DAD SL and MWD SL – The 1st for Ultra-fast LC
• Article – New DAD SL Safeguards Your Data
• Promotion – Buy a DAD SL and get a Free Ultra-fast LC Start-up Kit
• Video – New 1100 Series DAD SL and MWD SL
• DAD SL Product Page http://www.chem.agilent.com/Scripts/PDS.asp?lPage=34216
• RRHT Columns Product Page http://www.chem.agilent.com/Scripts/PDS.asp?lPage=9818
• Technical Note 5989-3002EN
Optimization of New High Speed 1100 Series DAD/MWD SL for resolution and sensitivity
• Technical Note 5989-1603EN (September 2004)
Ultra-fast LC using the 1100 and RRHT ColumnsNotes: Instead of the 500nl flow cell the more cost-effective 1.7ul cell can be used for highest selectivity.
Flow cell connecting capillaries: Use 0.12mm ID for 1.7ul and 0.17mm for 13ul cell instead of 0.125mm ID
Slide 43
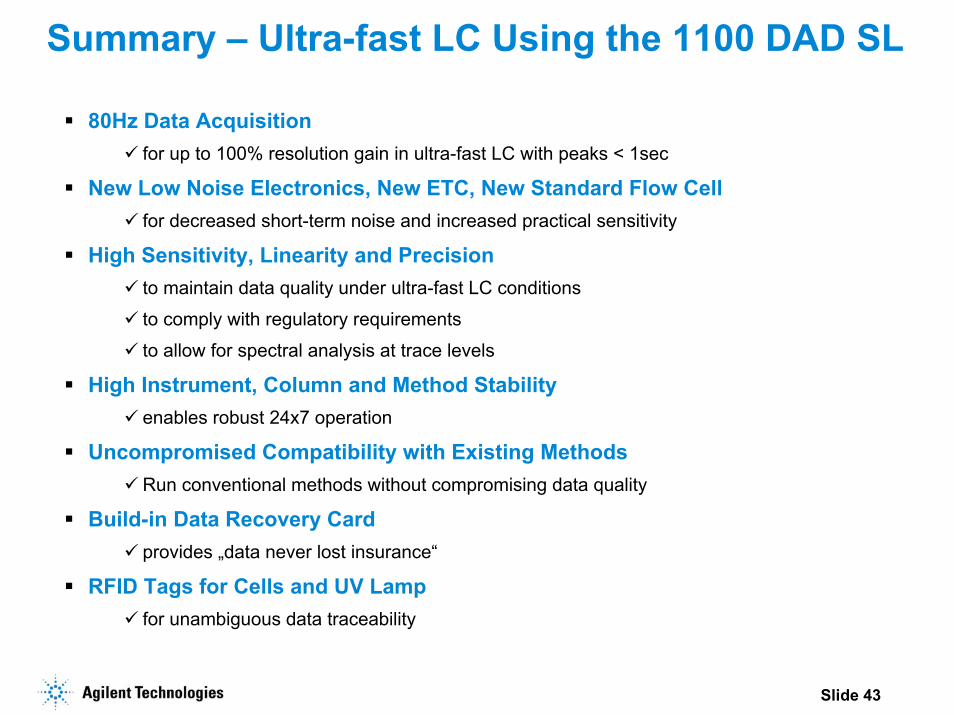
Summary – Ultra-fast LC Using the 1100 DAD SL
80Hz Data Acquisition for up to 100% resolution gain in ultra-fast LC with peaks < 1sec
New Low Noise Electronics, New ETC, New Standard Flow Cellfor decreased short-term noise and increased practical sensitivity
High Sensitivity, Linearity and Precisionto maintain data quality under ultra-fast LC conditions
to comply with regulatory requirements
to allow for spectral analysis at trace levels
High Instrument, Column and Method Stabilityenables robust 24x7 operation
Uncompromised Compatibility with Existing MethodsRun conventional methods without compromising data quality
Build-in Data Recovery Card provides „data never lost insurance“
RFID Tags for Cells and UV Lamp for unambiguous data traceability

Slide 44
Wrap-up E-Seminar Questions
Thank you for attending today’s Agilent e-Seminar. Our e-Seminar schedule is expanding regularly.
Please check our web site frequently at:
www.agilent.com/chem
If you would like to receive regular updates please update your account information under
Stay Current with e-Notes


