
NORTH DAKOTA
DEPARTMENT OF TRANSPORTATION
MATERIALS AND RESEARCH DIVISION
Experimental Study ND 2005-01
Evaluation of a Light Weight Profiler
(LWP) for Collection of Ride Quality Data
on Asphalt and Concrete Pavements
Final Report
March 2009
Prepared by
NORTH DAKOTA DEPARTMENT OF TRANSPORTATION BISMARCK, NORTH DAKOTA
www.dot.nd.gov
DIRECTOR Francis G. Ziegler, P.E.
MATERIALS AND RESEARCH DIVISION Ron Horner, P.E.

RCS HHO-30-19
U.S. DEPARTMENT OF TRANSPORTATION FEDERAL HIGHWAY ADMINISTRATION
EXPERIMENTAL PROJECT REPORT
EXPERIMENTAL PROJECT
EXPERIMENTAL PROJECT NO. CONSTRUCTION PROJ NO LOCATION
STATE Y EAR NUMBER SURF
8
28
1 ND 2005 -
01
EVALUATION FUNDING NEEP NO. PROPRIETARY FEATURE?
1 X HP&R 3 DEMONSTRATION Yes
48 2 CONSTRUCTION 4 IMPLEMENTATION 49 51 X No
SHORT TITLE TITLE 52
Evaluation of a Light Weight Profiler (LWP) for Collection of Ride Quality Data on Asphalt and Concrete Pavements
THIS FORM DATE MO. YR. REPORTING
140 09 -- 2007 1 INITIAL 2 ANNUAL 3 X FINAL
KEY WORDS
KEY WORD 1 145 International Roughness Index
KEY WORD 2 167 IRI
KEY WORD 3 189 Lightweight Profiler
KEY WORD 4 211 LWP
UNIQUE WORD 233
PROPRIETARY FEATURE NAME 255
CHRONOLOGY
Date Work Plan Approved
Date Feature Constructed:
Evaluation Scheduled Until:
Evaluation Extended Until:
Date Evaluation Terminated:
277 04-2005 281 285 12-2007 289 293
QUANTITY AND COST
QUANTITY OF UNITS (ROUNDED TO WHOLE NUMBERS)
UNITS UNIT COST (Dollars, Cents)
1 LIN. FT 2 SY 3 SY-IN 4 CY 305
5 TON 6 LBS 7 EACH 8 X LUMP SUM
1
$49,425.00
297 306
AVAILABLE EVALUATION
REPORTS
CONSTRUCTION
315
PERFORMANCE
FINAL
EVALUATION
318
1 2 3 4 5
CONSTRUCTION PROBLEMS
319
1 2 3 4 5
PERFORMANCE
NONE SLIGHT MODERATE SIGNIFICANT SEVERE
EXCELLENT GOOD SATISFACTORY MARGINAL UNSATISFACTORY
APPLICATION 320
1 ADOPTED AS PRIMARY STD. 2 PERMITTED ALTERNATIVE 3 ADOPTED CONDITIONALLY
4 X PENDING 5 REJECTED 6 NOT CONSTRUCTED
(Explain in remarks if 3, 4, 5, or 6 is checked)
321 The NDDOT purchased a high speed profiler since this project has begun. This profiler will be incorporated into this research project.
REMARKS
Form FHWA 1461
X


Experimental Study ND 2005-01
Evaluation of a Light Weight Profiler
(LWP) for Collection of Ride Quality Data
on Asphalt and Concrete Pavements
FINAL REPORT
March 2009
Written by
Bryon Fuchs
Kyle Evert

Disclaimer
The contents of this report reflect the views of the author or authors who are responsible for the facts and the accuracy of the data presented herein. The contents do not reflect the official views of the North Dakota Department of Transportation or the Federal Highway Administration. This report does not constitute a standard, specification, or regulation.

Lightweight Profiler ND 2005-01 Final Report
North Dakota Department of Transportation Materials & Research Division
TABLE OF CONTENTS
Purpose and Need ......................................................................................................... 1
Objective ........................................................................................................................ 2
Location ......................................................................................................................... 2
Equipment ...................................................................................................................... 3
Data Collection Resources ........................................................................................... 4
HBP Pavement Data Analysis ...................................................................................... 5
Mine & Blend Projects ................................................................................................ 6
Structural Overlay Projects ...................................................................................... 11
Thin Lift Overlays (Initial IRI <133.0 in/mile) ............................................................ 13
Thin Lift Overlays (Initial IRI >133.0 & <177.0 in/mile) ............................................. 14
Concrete Pavement Data Analysis ............................................................................ 16
Summary ...................................................................................................................... 17
Recommendations for Year Two................................................................................ 21
Appendix A: 2005 SP on Mine & Blend Projects ..................................................... A-1

LWP ND 2005-01 Final Report
North Dakota Department of Transportation Materials & Research Division 1
Evaluation of a Light Weight Profiler (LWP) for Collection of Ride Quality Data on Asphalt and Concrete Pavements
ND 2005-01
Purpose and Need
Past literature has indicated that pavements that are initially built smoother, stay
smoother longer, thus improving overall ride quality for a longer period of time. Past
research has also shown that smoother pavements reduce maintenance costs over the
life of the pavement.
The North Dakota Department of Transportation (NDDOT) has developed a
Strategic Business Plan (SBP) to help improve customer satisfaction within the state of
North Dakota. The plan outlines a number of objectives in order to accomplish this
plan. The desired outcome of SBP Objective 1.3 is to improve overall ride quality of
North Dakota’s roads by 10%.
The NDDOT developed a Flexible Pavement Surface Tolerance Special
Provision (SP) in 2005 for a ride specification on asphalt pavements constructed or
rehabilitated within the state to support SBP Objective 1.3. The ride quality index used
is the International Roughness Index (IRI) which is measured in inches per mile
(in/mile). Prior to the SP, North Dakota did not have a ride specification for asphalt
pavements.
The NDDOT has had a ride specification on concrete pavements for many years
that uses a California-style profilograph to evaluate new or rehabilitated concrete
pavements. The California-style profilograph uses the Profile Index (PI) which is
measured in inches per mile (in/mile) to measure ride quality. The profilograph is
capable of adequately finding bumps; however, it does not accurately reflect the quality
of the ride as experienced by the user. The IRI is a more accurate measurement of ride
quality as it simulates what the user feels driving down the road.
While the IRI and PI have the same units, the values are not interchangeable as
the measurement and calculations are different.
There is a need to replace the profilograph with a device that measures ride
quality that simulates what the user feels in the car.

LWP ND 2005-01 Final Report
North Dakota Department of Transportation Materials & Research Division 2
Objective
The Planning and Programming Division uses a Pathrunner XP Model PSI3 LG
high speed inertial profiler to collect data on a state basis which is used for pavement
management. While the Pathrunner XP Model PSI3 LG profiler can collect the data we
are interested in, this equipment is expensive and does not have the time availability to
collect project specific data during construction. Other disadvantages with using the
Pathrunner XP Model PSI3 LG are the turnaround times needed to analyze the data.
The equipment is not light enough to be used on new concrete pavements within the
first few days.
The original objective of this research was to evaluate the use of a Light Weight
Inertial Profiler (LWP) in collecting ride quality data. The data collected then would be
used to determine the resources required for implementation of a ride quality
specification. During the course of this research project Materials and Research
purchased a bumper mounted High Speed Inertial Profiler (HSP). The collection of data
with the HSP will be combined with the intent of the original objective. Data will be
collected with both the LWP and HSP to be used to determine the resources required
for implementation of a ride quality specification.
Location
The NDDOT collected ride quality data on 11 projects in 2006. Refer to Figure 1
on the next page for project locations.

LWP ND 2005-01 Final Report
North Dakota Department of Transportation Materials & Research Division 3
Equipment
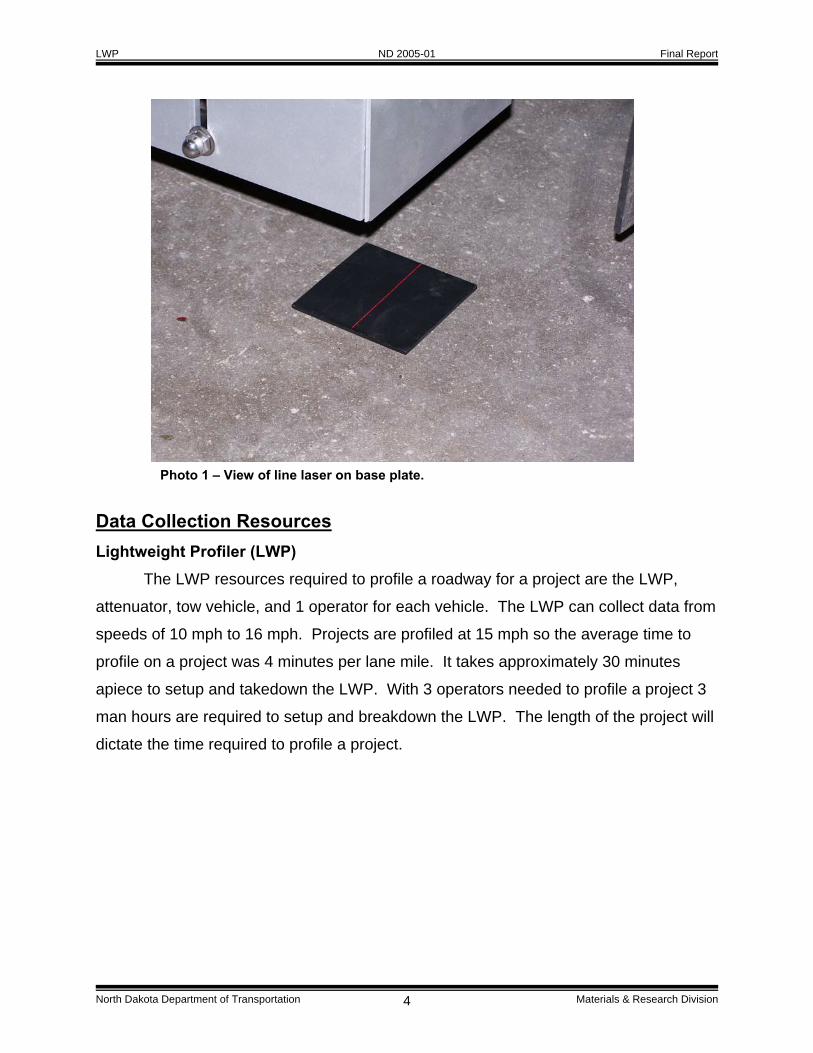
Ames Engineering is the manufacturer that won the bid for the LWP as stated in
the year one research report. The Final Report will use the original single point laser
and Ames RoLine lasers. New Roline lasers were purchased in August of 2006. These
lasers use a line laser that runs perpendicular to the roadway. They use different points
along the laser line to develop an algorithmic average for the profile heights of the
peaks and valleys of a pavement texture. This works well with concrete that has
grinding or longitudinal tining. A regular single point laser will fall in between peaks and
valleys of the grooves of textured pavement giving a false profile elevation. Photo 1
displays the laser line of the Roline laser. .
Both the RoLine lasers and the single point lasers are certified annually at the
MNROAD’s facility. The lasers must meet Minnesota Department of Transportation’s
specifications to become certified by MnDOT.
SS-1-024(010)029
MDF-3-017(004)038
HPP-4-052(038)068
SS-5-016(019)060
IM-2-094(060)295
SER-3-019(039)135 SER-3-281(084)905
AC-NH-7-002(062)065
AC-NH-7-002(064)077 NH-6-002(072)341
IM-5-094(034)053
Figure 1 – Map of project locations.
LWP ND 2005-01 Final Report
North Dakota Department of Transportation Materials & Research Division 4
Data Collection Resources
Lightweight Profiler (LWP)
The LWP resources required to profile a roadway for a project are the LWP,
attenuator, tow vehicle, and 1 operator for each vehicle. The LWP can collect data from
speeds of 10 mph to 16 mph. Projects are profiled at 15 mph so the average time to
profile on a project was 4 minutes per lane mile. It takes approximately 30 minutes
apiece to setup and takedown the LWP. With 3 operators needed to profile a project 3
man hours are required to setup and breakdown the LWP. The length of the project will
dictate the time required to profile a project.
Photo 1 – View of line laser on base plate.
LWP ND 2005-01 Final Report
North Dakota Department of Transportation Materials & Research Division 5
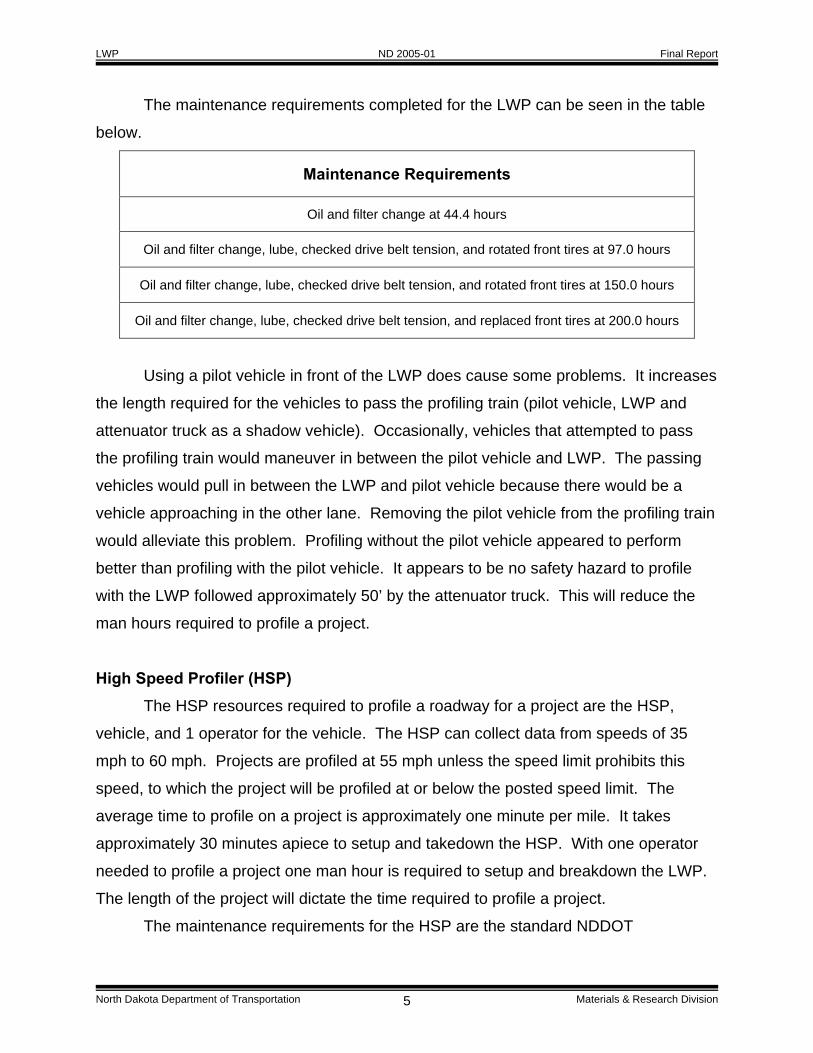
The maintenance requirements completed for the LWP can be seen in the table
below.
Maintenance Requirements
Oil and filter change at 44.4 hours
Oil and filter change, lube, checked drive belt tension, and rotated front tires at 97.0 hours
Oil and filter change, lube, checked drive belt tension, and rotated front tires at 150.0 hours
Oil and filter change, lube, checked drive belt tension, and replaced front tires at 200.0 hours
Using a pilot vehicle in front of the LWP does cause some problems. It increases
the length required for the vehicles to pass the profiling train (pilot vehicle, LWP and
attenuator truck as a shadow vehicle). Occasionally, vehicles that attempted to pass
the profiling train would maneuver in between the pilot vehicle and LWP. The passing
vehicles would pull in between the LWP and pilot vehicle because there would be a
vehicle approaching in the other lane. Removing the pilot vehicle from the profiling train
would alleviate this problem. Profiling without the pilot vehicle appeared to perform
better than profiling with the pilot vehicle. It appears to be no safety hazard to profile
with the LWP followed approximately 50’ by the attenuator truck. This will reduce the
man hours required to profile a project.
High Speed Profiler (HSP)
The HSP resources required to profile a roadway for a project are the HSP,
vehicle, and 1 operator for the vehicle. The HSP can collect data from speeds of 35
mph to 60 mph. Projects are profiled at 55 mph unless the speed limit prohibits this
speed, to which the project will be profiled at or below the posted speed limit. The
average time to profile on a project is approximately one minute per mile. It takes
approximately 30 minutes apiece to setup and takedown the HSP. With one operator
needed to profile a project one man hour is required to setup and breakdown the LWP.
The length of the project will dictate the time required to profile a project.
The maintenance requirements for the HSP are the standard NDDOT

LWP ND 2005-01 Final Report
North Dakota Department of Transportation Materials & Research Division 6
maintenance requirements for a state owned vehicle.
HBP Pavement Data Analysis
ProVAL will be the software used to analyze the profiling data. ProVAL is a free
software provided by Federal Highway Administration. The software can analyze data
from different profilers to provide a IRI value. The data will be analyzed using 0.1 mile
lots, 0.05 mile lots and 264’ long “sliding lots”. The sliding lots are a moving average IRI
at each point down the roadway. The benefit of using a sliding average is to eliminate
the chance of a bump beginning or ending a lot. The analyzed data will then be
compared using the ride quality incentives/disincentives, from the Flexible Pavement
Surface Tolerance Special Provision, for the type of project constructed.
The Flexible Pavement Surface Tolerance Special Provision was applied to three
types of projects; mine and blend or new construction, structural overlay (2 or more
lifts), and thin lift overlays. Each type of project had different ride quality requirements
(IRI limits) and the thin lift overlay project requirements were based on the existing ride
quality of the road. Eleven projects with the Flexible Pavement Surface Tolerance
Special Provision had ride quality data collected and analyzed for HBP highways.
Mine and Blend or New Construction Projects
There was one mine and blend project and four new grading projects where ride
quality data was collected for 2006. These projects applied a Flexible Pavement
Surface Tolerance Provision to the ride statistics. The pay bands for the SP can be
found in Appendix A.
AC-NH-7-002(062)065
This project was new construction and was part of constructing US 2 into a four
lane roadway. The total pavement section consisted of 15.0” of dense graded
aggregate and 5.5” of HBP. The bottom 3.5” of HBP had PG 58-28 asphalt cement and
the top 2.0” had PG 58-34 asphalt cement. Ride quality data was collected on 10-16-
2006. Tables 1 and 2 are a summary of the ride quality data and incentives /
disincentives according to the 2006 Flexible Pavement Surface Tolerance SP.

LWP ND 2005-01 Final Report
North Dakota Department of Transportation Materials & Research Division 7
Number of lots within the range
2006 Range 0.1 mile % 0.05 mile % 264 ft
sliding base length
<=32.0 68 27.42% 174 35.1% 34.9% 32.1 to 36.0 64 25.81% 91 18.4% 19.0% 36.1 to 39.0 26 10.48% 60 12.1% 10.5% 39.1 to 42.0 19 7.66% 34 6.9% 8.8% 42.1 to 50.0 50 20.16% 79 15.9% 16.5% 50.1 to 57.0 13 5.24% 40 8.1% 6.5% 57.1 to 64.0 6 2.42% 10 2.0% 2.4% 64.1 to 70.0 2 0.81% 4 0.8% 1.0%
>=70.1 0 0.00% 4 0.8% 0.6% Total 248 100.0% 496 100.0% 100.0%
Table 1 – Percentage of lots within a lot size range. - AC-NH-7-002(062)065
Incentive / Disincentive Lane 0.1 mile 0.05 mile 264’ Sliding
Drive $36,700 $36,950 $37,237
Pass $13,500 $15,400 $15,065 Total $50,200 $52,350 $52,302
Table 2 – Incentive / disincentive project totals. - AC-NH-7-002(062)065
AC-NH-7-002(064)077
This project was new construction. It was part of making US 2 a four lane
roadway. The total pavement section consisted of 15.0” of dense graded aggregate
and 5.5” of HBP. The bottom 3.5” of HBP had PG 58-28 asphalt cement and the top
2.0” had PG 58-34 asphalt cement. Ride quality data was collected on 10-9-2006.
Tables 3 and 4 are a summary of the ride quality data and incentives / disincentives
according the 2006 Flexible Pavement Surface Tolerance SP.

LWP ND 2005-01 Final Report
North Dakota Department of Transportation Materials & Research Division 8
Number of lots within the range
2006 Range 0.1 mile % 0.05 mile
% 264 ft sliding base length
<=32.0 64 26.2% 138 28.3% 27.6% 32.1 to 36.0 35 14.3% 63 12.9% 13.0% 36.1 to 39.0 17 7.0% 48 9.8% 10.5% 39.1 to 42.0 32 13.1% 51 10.5% 11.4% 42.1 to 50.0 62 25.4% 113 23.1% 22.6% 50.1 to 57.0 21 8.6% 44 9.0% 8.6% 57.1 to 64.0 8 3.3% 18 3.7% 3.8% 64.1 to 70.0 5 2.1% 9 1.8% 1.7%
>=70.1 0 0.00% 4 0.8% 0.9% Total 244 100.0% 488 100.0% 100.0%
Table 3 – Percentage of lots within a lot size range. - AC-NH-7-002(064)077
Incentive / Disincentive Lane 0.1 mile 0.05 mile 264’ Sliding
Drive $34,700 $34,400 $34,120
Pass $2,300 $4,200 $4,595 Total $37,000 $38,600 $38,714
Table 4 – Incentive / disincentive project totals. - AC-NH-7-002(064)077
SER-3-019(039)135
This project was new construction. The total pavement section consisted of
18.0” of dense graded aggregate and 5.5” of HBP. The bottom 3.5” of HBP had PG
58-28 asphalt cement and the top 2.0” had PG 58-34 asphalt cement. Ride quality data
was collected on 8-21-2006. Tables 5 and 6 are a summary of the ride quality data and
incentives / disincentives according the 2006 Flexible Pavement Surface Tolerance SP.

LWP ND 2005-01 Final Report
North Dakota Department of Transportation Materials & Research Division 9
Number of lots within the range
2006 Range 0.1 mile % 0.05 mile % 264 ft sliding base length
<=32.0 3 4.6% 8 6.0% 7.7% 32.1 to 36.0 7 10.6% 25 18.7% 17.0% 36.1 to 39.0 15 22.7% 26 19.4% 18.6% 39.1 to 42.0 10 15.2% 20 14.9% 17.2% 42.1 to 50.0 23 34.9% 33 24.6% 24.1% 50.1 to 57.0 5 7.6% 12 9.0% 7.9% 57.1 to 64.0 1 1.5% 6 4.5% 3.3% 64.1 to 70.0 2 3.0% 2 1.5% 2.0%
>=70.1 0 0.00% 2 1.5% 2.1% Total 66 100.0% 134 100.0% 100.0%
Table 5 – Percentage of lots within a lot size range. - SER-3-019(039)135
Incentive / Disincentive Lane 0.1 mile 0.05 mile 264’ Sliding
WB $4,100 $4,800 $4,819
EB $1,700 $2,550 $2,680 Total $5,800 $7,350 $7,499
Table 6 – Incentive / disincentive project totals. - SER-3-019(039)135
HPP-4-052(038)068
This project was a mine and blend construction project. The base section
consisted of 11” of existing HBP and aggregate base blended with 7” virgin aggregate.
The pavement section consists of 5.5” of Superpave HBP. The bottom 3.5” of HBP had
PG 58-28 asphalt cement and the top 2.0” had PG 58-34 asphalt cement. Ride quality
data was collected on 8-2-2006. Tables 7 and 8 are a summary of the ride quality data
and incentives / disincentives according to the 2006 Flexible Pavement Surface
Tolerance SP.

LWP ND 2005-01 Final Report
North Dakota Department of Transportation Materials & Research Division 10
Number of lots within the range
2006 Range 0.1 mile % 0.05 mile % 264 ft sliding base length
<=34.0 62 24.6% 146 28.9% 28.4% 34.1 to 39.0 94 37.3% 172 34.0% 33.9% 39.1 to 44.0 58 23.0% 96 19.0% 20.3% 44.1 to 48.0 18 7.1% 45 8.9% 8.0% 48.1 to 56.0 16 6.3% 29 5.7% 6.4% 56.1 to 62.0 1 0.4% 11 2.2% 2.2% 62.1 to 69.0 2 0.8% 4 0.8% 0.5% 69.1 to 75.0 0 0.0% 1 0.2% 0.1%
>=75.1 1 0.4% 2 0.4% 0.3% Total 252 100.0% 506 100.0% 100.0%
Table 7 – Percentage of lots within a lot size range. - HPP-4-052(038)068
Incentive / Disincentive Lane 0.1 mile 0.05 mile 264’ Sliding
WB $24,150 $24,488 $24,394
EB $25,275 $24,788 $24,743 Total $49,425 $49,275 $49,137
Table 8 – Incentive / disincentive project totals. - HPP-4-052(038)068
SER-3-281(084)905
This project was new construction. The total pavement section consisted of
18.0” of dense graded aggregate and 5.5” of HBP. The bottom 3.5” of HBP had PG 58-
28 asphalt cement and the top 2.0” had PG 58-34 asphalt cement. Ride quality data
was collected on 8-22-2006. Tables 9 and 10 are a summary of the ride quality data
and incentives / disincentives according the 2006 Flexible Pavement Surface Tolerance
SP.

LWP ND 2005-01 Final Report
North Dakota Department of Transportation Materials & Research Division 11
Number of lots within the range
2006 Range 0.1 mile % 0.05 mile
% 264 ft sliding base length
<=32.0 4 5.4% 19 12.7% 14.0% 32.1 to 36.0 24 32.4% 36 24.0% 25.0% 36.1 to 39.0 16 21.6% 33 22.0% 17.6% 39.1 to 42.0 10 13.5% 19 12.7% 15.7% 42.1 to 50.0 14 18.9% 28 18.7% 18.7% 50.1 to 57.0 3 4.1% 9 6.0% 5.1% 57.1 to 64.0 2 2.7% 1 0.7% 1.3% 64.1 to 70.0 0 0.0% 2 1.3% 1.3%
>=70.1 1 1.4% 3 2.0% 1.2% Total 74 100.0% 150 100.0% 100.0%
Table 9 – Percentage of lots within a lot size range. - SER-3-281(084)905
Incentive / Disincentive Lane 0.1 mile 0.05 mile 264’ Sliding
NB $5,600 $5,600 $5,666
SB $6,700 $6,900 $6,859 Total $12,300 $12,500 $12,526
Table 10 – Incentive / disincentive project totals. - SER-3-281(084)905
Structural Overlay Projects
There were two structural overlay projects where ride quality data was collected.
One project had a Flexible Pavement Surface Tolerance Special Provision applied to
the project. Refer to Appendix A for the SP pay bands regarding Structural Overlays.
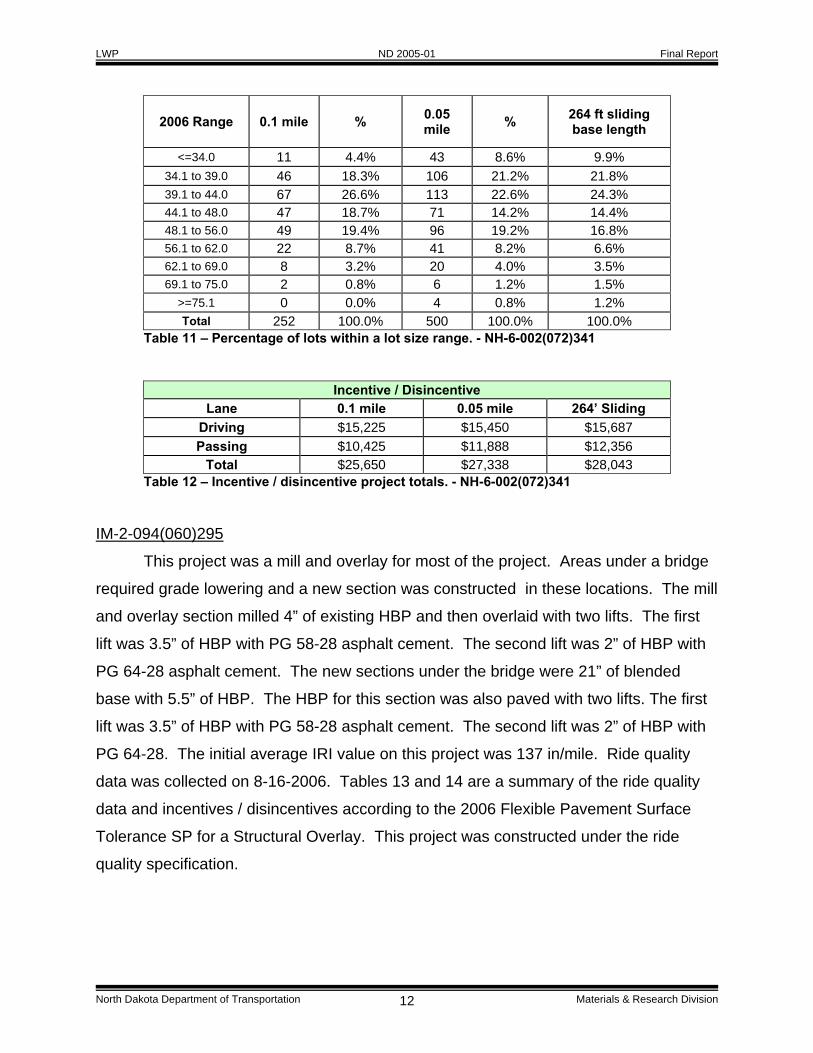
NH-6-002(072)341
The structural overlay on this project consisted of 2.5” of HBP with PG 58-28
asphalt cement. The initial average IRI value on this project was 95 in/mile. Ride
quality data was collected on 10-9-2006. Tables 11 and 12 are a summary of the ride
quality data and incentives / disincentives according to the 2006 Flexible Pavement
Surface Tolerance SP for a Structural Overlay. This project was constructed under the
ride quality specification.
Number of lots within the range
LWP ND 2005-01 Final Report
North Dakota Department of Transportation Materials & Research Division 12
2006 Range 0.1 mile % 0.05 mile
% 264 ft sliding base length
<=34.0 11 4.4% 43 8.6% 9.9% 34.1 to 39.0 46 18.3% 106 21.2% 21.8% 39.1 to 44.0 67 26.6% 113 22.6% 24.3% 44.1 to 48.0 47 18.7% 71 14.2% 14.4% 48.1 to 56.0 49 19.4% 96 19.2% 16.8% 56.1 to 62.0 22 8.7% 41 8.2% 6.6% 62.1 to 69.0 8 3.2% 20 4.0% 3.5% 69.1 to 75.0 2 0.8% 6 1.2% 1.5%
>=75.1 0 0.0% 4 0.8% 1.2% Total 252 100.0% 500 100.0% 100.0%
Table 11 – Percentage of lots within a lot size range. - NH-6-002(072)341
Incentive / Disincentive Lane 0.1 mile 0.05 mile 264’ Sliding
Driving $15,225 $15,450 $15,687
Passing $10,425 $11,888 $12,356 Total $25,650 $27,338 $28,043
Table 12 – Incentive / disincentive project totals. - NH-6-002(072)341
IM-2-094(060)295
This project was a mill and overlay for most of the project. Areas under a bridge
required grade lowering and a new section was constructed in these locations. The mill
and overlay section milled 4” of existing HBP and then overlaid with two lifts. The first
lift was 3.5” of HBP with PG 58-28 asphalt cement. The second lift was 2” of HBP with
PG 64-28 asphalt cement. The new sections under the bridge were 21” of blended
base with 5.5” of HBP. The HBP for this section was also paved with two lifts. The first
lift was 3.5” of HBP with PG 58-28 asphalt cement. The second lift was 2” of HBP with
PG 64-28. The initial average IRI value on this project was 137 in/mile. Ride quality
data was collected on 8-16-2006. Tables 13 and 14 are a summary of the ride quality
data and incentives / disincentives according to the 2006 Flexible Pavement Surface
Tolerance SP for a Structural Overlay. This project was constructed under the ride
quality specification.

LWP ND 2005-01 Final Report
North Dakota Department of Transportation Materials & Research Division 13
Number of lots within the range
2006 Range 0.1 mile % 0.05 mile
% 264 ft sliding base length
<=34.0 41 20.3% 82 20.2% 20.4% 34.1 to 39.0 24 11.9% 57 14.0% 14.1% 39.1 to 44.0 27 13.4% 63 15.5% 14.4% 44.1 to 48.0 32 15.8% 49 12.1% 14.0% 48.1 to 56.0 54 26.7% 100 24.6% 23.0% 56.1 to 62.0 12 5.9% 35 8.6% 8.2% 62.1 to 69.0 8 4.0% 7 1.7% 2.7% 69.1 to 75.0 3 1.5% 6 1.5% 1.6%
>=75.1 1 0.5% 7 1.7% 1.4% Total 202 100.0% 406 100.0% 100.0%
Table 13 – Percentage of lots within a lot size range. - IM-2-094(060)295
Incentive / Disincentive Lane 0.1 mile 0.05 mile 264’ Sliding
Driving $19,650 $19,350 $19,231
Passing $1,500 $3,188 $3,036 Total $21,150 $22,538 $22,268
Table 14 – Incentive / disincentive project totals. - IM-2-094(060)295
Thin Lift Overlay Projects – Initial IRI Values Less Than 133.0 in/mile
There was one thin lift overlay project with an initial IRI value of less than 133.0
in/mile where ride quality data was collected. This project had a Flexible Pavement
Surface Tolerance Special Provision applied to the project. Refer to Appendix A for the
SP pay bands regarding Thin Lift Overlays with an initial IRI value of less than 133.0
in/mile.
SS-5-016(019)060
The thin lift overlay on this project consisted of 1.5” of HBP with PG 58-28
asphalt cement. The initial average IRI value on this project was 60.1 in/mile. Ride
quality data was collected on 8-9-2006. Tables 15 and 16 are a summary of the ride
quality data and incentives / disincentives according the 2006 Flexible Pavement
Surface Tolerance SP for a thin lift overlay with an initial IRI value of less than 133.0
in/mile.
Number of lots within the range

LWP ND 2005-01 Final Report
North Dakota Department of Transportation Materials & Research Division 14
2005 Range 0.1 mile % 0.05 mile % 264 ft sliding base length
<=47.0 228 72.2% 447 70.7% 71.5%
47.1 to 57.0 50 15.8% 103 16.3% 15.1%
57.1 to 67.0 21 6.6% 43 6.8% 6.8%
67.1 to 72.0 5 1.6% 15 2.4% 2.0%
72.1 to 82.0 8 2.5% 14 2.2% 2.6%
>=82.1 4 1.3% 10 1.6% 2.1%
Total 316 100.0% 632 100.0% 100.0% Table 15 – Percentage of lots within a lot size range. - SS-5-016(019)060
Incentive / Disincentive Lane 0.1 mile 0.05 mile 264’ Sliding
Driving $19,550 $19,050 $19,027
Passing $15,700 $15,700 $11,178 Total $35,250 $34,750 $30,205
Table 16 – Incentive / disincentive project totals. - SS-5-016(019)060
Thin Lift Overlay Projects – Initial IRI Values Greater Than 133.0 in/mile and less
than 177.0 in/mile
There were two thin lift overlay projects with an initial IRI value of greater than
133.0 in/mile and less than 177 in/mile where ride quality data was collected. These
projects did not have a Flexible Pavement Surface Tolerance Special Provision applied
to the project. Refer to Appendix A regarding the SP pay bands thin lift overlays with an
initial IRI value of greater than 133.0 in/mile and less than 177.0 in/mile.
MDF-3-017(004)038
The thin lift overlay on this project consisted of 1.5” of HBP with PG 58-28
asphalt cement. The initial average IRI value on this project was 155.5 in/mile. Ride
quality data was collected on 7-11-2006. Tables 17 and 18 are a summary of the ride
quality data and incentives / disincentives according the 2006 Flexible Pavement
Surface Tolerance SP for a Thin Lift Overlay with an initial IRI value greater than 133.0
in/mile and less than 177.0 in/mile.

LWP ND 2005-01 Final Report
North Dakota Department of Transportation Materials & Research Division 15
Number of lots within the range
2005 Range 0.1 mile % 0.05 mile % 264 ft sliding base length
<=51.0 96 33.3% 224 38.9% 38.0%
51.1 to 61.0 135 46.9% 229 39.8% 40.0% 61.1 to 76.0 53 18.4% 103 17.9% 19.0%
76.1 to 81.0 2 0.7% 8 1.4% 1.4% 81.1 to 91.0 2 0.7% 11 1.9% 1.4%
>=91.1 0 0.0% 1 0.2% 0.2% Total 288 100.0% 576 100.0% 100.0%
Table 17 – Percentage of lots within a lot size range. - MDF-3-017(004)038
Incentive / Disincentive Lane 0.1 mile 0.05 mile 264’ Sliding
WB $9,150 $10,100 $9,684
EB $11,600 $11,400 $11,486 Total $20,750 $21,500 $21,169
Table 18 – Incentive / disincentive project totals. - MDF-3-017(004)038
SS-1-024(010)029
The thin lift overlay on this project consisted of 1.5” of HBP with PG 58-28
asphalt cement. The initial average IRI value on this project was 167.8 in/mile. Ride
quality data was collected on 6-22-2006. Tables 19 and 20 are a summary of the ride
quality data and incentives / disincentives according the 2006 Flexible Pavement
Surface Tolerance SP for a Thin Lift Overlay with an initial IRI value greater than 133.0
in/mile and less than 177.0 in/mile.
Number of lots within the range
2006 Range 0.1 mile % 0.5 mile % 264 ft sliding base length
<=51.0 117 39.4% 260 43.8% 42.3%
51.1 to 61.0 84 28.3% 142 23.9% 25.2%
61.1 to 76.0 68 22.9% 128 21.6% 21.9%
76.1 to 81.0 7 2.4% 20 3.4% 3.5%
81.1 to 91.0 16 5.4% 17 2.9% 3.4%
>=91.1 5 1.7% 26 4.4% 3.7% Total 297 100.0% 593 100.0% 100.0%
Table 19 – Percentage of lots within a lot size range.

LWP ND 2005-01 Final Report
North Dakota Department of Transportation Materials & Research Division 16
Incentive / Disincentive Lane 0.1 mile 0.05 mile 264’ Sliding
WB $9,000 $10,225 $9,794
EB $10,000 $11,575 $10,990 Total $19,000 $21,800 $20,783
Table 20 – Incentive / disincentive project totals.
Concrete Pavement Data Analysis
There were two concrete paving projects for the 2006 construction season,
project IM-5-094(034)053 and IM-2-094(033)315. IM-5-094(034)053 was the only
concrete project to have data collected in 2006. The IM-2-094(033)315 project was
completed late in the season and the temperature was too cold to use the lightweight
profiler. Tables 21 and 22 are a summary of the RoLine and single point lasers. Also,
there is a histogram for the RoLine lasers.
Difference between lasers
Point RoLine Difference
Average 57.2 42.3 14.9 stdev 7.3 8.6 6.1 min 47.5 24.9 5.1 max 76.0 65.4 24.4
Table 21 – Summary of data collected with Point and RoLine lasers. - IM-5-094(034)053
Number of lots within the range
IRI Range 0.1 Mile %
<=30.0 4 11.1% 30.1 to 35.0 2 5.6% 35.1 to 40.0 6 16.7% 40.1 to 45.0 13 36.1% 45.1 to 50.0 6 16.7% 50.1 to 55.0 1 2.8% 55.1 to 60.0 3 8.3% 60.1 to 65.0 0 0.0% 65.1 to 70.0 1 2.8% 70.1 to 75.0 0 0.0% 75.1 to 80.0 0 0.0%
>=80.1 0 0.0% Total 36 100%
Table 22 – Histogram of data collected with RoLine lasers. - IM-5-094(034)053

LWP ND 2005-01 Final Report
North Dakota Department of Transportation Materials & Research Division 17
A large difference between the RoLine and point lasers IRI measurements exists.
This is due to the longitudinal tinning on the concrete. The point lasers fall between the
peaks and valleys of the longitudinal tinning. As the lasers fall between the peaks and
valleys the accumulated IRI develops a false IRI score for the roadway.
Summary
The data collected with LWP has used 3 people to operate the equipment. That
will change to 2 people when the pilot vehicle is eliminated from the profiling train. The
pilot vehicle seems to cause problems with cars trying to pass the vehicle train.
Removing the pilot vehicle will reduce the average man hours required per project. The
average time to profile is 4 minutes per lane mile. The setup and breakdown of the
LWP take approximately one half hour each to complete. The setup and breakdown
include the mounting of the laptop and lasers on the LWP, calibrating the LWP, and
setting start and stop cones.
The maintenance requirements completed for the LWP can be seen in the table below.
Maintenance Requirements
Oil and filter change at 44.4 hours
Oil and filter change, lube, checked drive belt tension, and rotated front tires at 97.0 hours
Oil and filter change, lube, checked drive belt tension, and rotated front tires at 150.0 hours
Oil and filter change, lube, checked drive belt tension, and replaced front tires at 200.0 hours
With the HSP projects are profiled at 55 mph unless the speed limit prohibits this
speed, to which the project will be profiled at or below the posted speed limit. The
average time to profile on a project is approximately one minute per mile. It takes
approximately 30 minutes apiece to setup and takedown the HSP. With one operator
needed to profile a project one man hour is required to setup and breakdown the LWP.
The HBP data was analyzed by using a histogram of the existing SP for each
type of project. Also, it was analyzed by determining the incentive / disincentive for the
project using 0.1 mile lot, 0.05 mile lot, and a 264’ sliding lot. The histogram data can
be used as historical data to compare with previous years of profile data collection.

LWP ND 2005-01 Final Report
North Dakota Department of Transportation Materials & Research Division 18
Ideally the percent of lots with a lower IRI would increase with the contractors trying to
improve the ride for a larger incentive. The charts below are the summary of the 2006
projects. The second year of data collection had an increase in the number of lots in
the lower IRI brackets except in mine and blend projects.
Mine and Blend
Range (in/mile) 2005 2006
0.1 Mile Lots
% 0.1 Mile
Lots %
<=32.0 62 26.5% 201 22.7% 32.1 to 36.0 87 37.2% 224 25.3% 36.1 to 39.0 35 15.0% 132 14.9% 39.1 to 42.0 18 7.7% 89 10.1% 42.1 to 50.0 25 10.7% 165 18.7% 50.1 to 57.0 4 1.7% 43 4.9% 57.1 to 64.0 1 0.4% 19 2.1% 64.1 to 70.0 1 0.4% 9 1.0%
>=70.1 1 0.4% 2 0.2%
Total 234 100.0% 884 100.0% Table 23 – Histogram summary of mine and blend projects in 2006.
Structural Overlay
Range (in/mile) 2005 2006
0.1 Mile Lots
% 0.1 Mile
Lots %
<=34.0 35 3.4% 52 11.5% 34.1 to 39.0 140 13.8% 70 15.4% 39.1 to 44.0 244 24.0% 94 20.7% 44.1 to 48.0 152 14.9% 79 17.4% 48.1 to 56.0 243 23.9% 103 22.7% 56.1 to 62.0 97 9.5% 34 7.5% 62.1 to 69.0 55 5.4% 16 3.5% 69.1 to 75.0 23 2.3% 5 1.1%
>=75.1 29 2.8% 1 0.2%
Total 1018 100.0% 454 100.0% Table 24 – Histogram summary of Structural Overlay projects in 2006.

LWP ND 2005-01 Final Report
North Dakota Department of Transportation Materials & Research Division 19
Thin Lift Overlay < 133
Range (in/mile) 2005 2006
0.1 Mile Lots
% 0.1 Mile
Lots %
<=47.0 911 53.1% 228 72.2% 47.1 to 57.0 483 28.1% 50 15.8% 57.1 to 67.0 214 12.5% 21 6.6% 67.1 to 72.0 45 2.6% 5 1.6% 72.1 to 82.0 38 2.2% 8 2.5%
>=82.1 26 1.5% 4 1.3%
Total 1717 100.0% 316 100.0% Table 25 – Histogram summary of Thin Lift projects in 2006.
Thin Lift Overlay > 133
Range (in/mile) 2005 2006
0.1 Mile Lots
% 0.1 Mile
Lots %
<=47.0 2 0.6% 213 36.4% 47.1 to 57.0 39 12.5% 219 37.4% 57.1 to 67.0 94 30.0% 121 20.7% 67.1 to 72.0 50 16.0% 9 1.5% 72.1 to 82.0 75 24.0% 18 3.1%
>=82.1 53 16.9% 5 0.9%
Total 313 100.0% 585 100.0% Table 26 – Histogram summary of Thin Lift projects in 2006.
The data was analyzed using the incentives / disincentives with 0.1 mile lot, 0.05
mile lot, and 264’ sliding continuous reporting. This was done to determine the best
way to analyze the data collected for a paving project. There is not a large difference
between the different methods of analyzing the data. The data for mine and blend,
structural overlay, thin lift with initial IRI >133, and thin lift with initial IRI < 133 was
broken down to the price per mile for each method of analysis. These can be seen in
the charts below.

LWP ND 2005-01 Final Report
North Dakota Department of Transportation Materials & Research Division 20
Mine and Blend
Lot Size
AC-NH-7-002(062)065 AC-NH-7-002(064)077 SER-3-019(039)135 HPP-4-052(038)068 SER-3-281(084)905
Average Incentive/mile
Incentive Incentive/mile Incentive Incentive/mile Incentive Incentive/mile Incentive Incentive/mile Incentive Incentive/mile
0.1 $50,200 $4,204 $37,000 $3,099 $5,800 $1,758 $49,425 $3,901 $12,300 $3,220 $3,236
0.5 $52,350 $4,384 $38,600 $3,233 $7,350 $2,227 $49,275 $3,889 $12,500 $3,272 $3,401
264' Sliding
$52,302 $4,380 $38,714 $3,242 $7,499 $2,272 $49,137 $3,878 $12,526 $3,279 $3,410
Table 27 – Incentive paid for Mine and Blend.
Structural Overlay
Lot Size NH-6-002(072)341 IM-2-094(060)295
Average Incentive/mile Incentive Incentive/mile Incentive Incentive/mile
0.1 mile $25,650 $1,982 $21,150 $2,084 $2,033
0.5 Mile $27,338 $2,113 $22,538 $2,220 $2,167
264' Sliding $28,043 $2,167 $22,268 $2,194 $2,181
Table 28 – Incentive paid for Structural Overlays.
Thin Lift Overlay Initial IRI > 133
Lot Size NH-6-002(072)341 IM-2-094(060)295
Average Incentive/mile Incentive Incentive/mile Incentive Incentive/mile
0.1 $20,750 $1,434 $19,000 $1,257 $1,345
0.5 $21,500 $1,486 $21,800 $1,442 $1,464
264' Sliding $21,169 $1,463 $20,783 $1,375 $1,419
Table 29 – Incentive paid for Thin Lift Overlay Initial IRI > 133.
Thin Lift Overlay Initial IRI ≤ 133
Lot Size NH-6-002(072)341
Average Incentive/mile Incentive Incentive/mile
0.1 $35,250 $2,063 $2,063
0.5 $34,750 $2,033 $2,033
264' Sliding $30,205 $1,768 $1,768
Table 30 – Incentive paid for Thin Lift Overlay Initial IRI ≤ 133.
The 0.1 mile lots have the smallest incentive /mile for all of the paving methods

LWP ND 2005-01 Final Report
North Dakota Department of Transportation Materials & Research Division 21
except the thin lift overlay with an initial IRI < 133. The 264’ sliding lot and 0.05 mile lot
are very similar in their incentive for most of the projects profiled. There is a very small
difference between all three methods of analyzing the data.
Due to the small difference in the incentive / disincentive for the existing SP, the
264’ continuous sliding lot may be ideal to eliminate lots beginning or ending in the
middle of a bump. In the existing SP 0.1 mile lots are used. If a lot does not meet the
0.1 mile lot IRI requirements in the SP the contractor may be required to grind in
between the beginning and end locations of the lot to achieve an acceptable IRI.
Only one concrete project was profiled in 2006. There are much fewer concrete
paving jobs in North Dakota then HBP paving jobs. This limits the amount of data
collected. The one concrete project collected had a longitudinal tined texture. The
project was profiled with both the RoLine lasers and single point lasers. This was a
good comparison of the effect of the longitudinal tined texture. The average IRI
between the two types of lasers was 14.9 inches/mile.
Recommendations
It is recommended not to use the shadow vehicle when profiling a project with the
LWP. The shadow vehicle made passing the paving train more difficult. Removing the
shadow vehicle will allow passing traffic to pass without being in the other lane as long.
The HSP will profile projects much faster than the LWP. The HSP is
recommended to be used when the traffic speeds allow. For areas where the speed
limit and geometrics prevent the HSP from being used the LWP will be used.
It is also recommended to use the RoLine lasers for a surface that has
longitudinal tining or has been ground. A roadway with the entire surface having a
longitudinal tined or ground surface should be profiled with the RoLines lasers. These
lasers will provide a more accurate measurement of the IRI.


Appendix A

A-1
HBP Pavement Pay Band Schedule
<=32.0 $ 400.00 32.1 to 36.0 $ 300.00 36.1 to 39.0 $ 200.00 39.1 to 42.0 $ 100.00 42.1 to 50.0 $ - 50.1 to 57.0 $(100.00) 57.1 to 64.0 $(200.00) 64.1 to 70.0 $(400.00)
>=70.1 CA
Structural Overlay Pay Band Schedule
<=34.0 $ 300.00 34.1 to 39.0 $ 225.00 39.1 to 44.0 $ 150.00 44.1 to 48.0 $ 75.00 48.1 to 56.0 $ - 56.1 to 62.0 $ (75.00) 62.1 to 69.0 $(150.00) 69.1 to 75.0 $(300.00)
>=75.1 CA
Thin Lift Overlay Pay Band Schedule
<=47.0 $ 150.00 47.1 to 57.0 $ 50.00 57.1 to 67.0 $ - 67.1 to 72.0 $ (50.00) 72.1 to 82.0 $(150.00)
>=82.1 CA


