
Materials and Methods

61
III. MATERIALS AND METHODS
3.1 General considerations
The glassware used in this study were of neutral glass of Corning or Borosil
India Ltd. make. The culture media, buffers and other biochemical reagents were
prepared in MilliQ water (Millipore) water. The chemicals of Analar, Excellar or
molecular biology grade were used for the preparation of various solutions and
reagents. The culture media, buffers, reagents, enzymes, kits and other requirements
were obtained from M/s. Biosciences, Merck specialties Pvt. Ltd., Mumbai; BD, BBL
and DIFCO, USA; E-Merck (India) Ltd; Hi-media, Mumbai; Real Biotech
Corporation, Banqiao city, Taiwan; Sigma Aldrich, USA; Sisco Research
Laboratories Pvt. Ltd., Mumbai and Synergy Scientific Services, Chennai.
Plasticware including microcentrifuge tubes, micropipette tips, cryovials, Petri dishes
and autoclave bags were procured from M/s. Tarson Products Pvt. Ltd., Kolkata and
Axygen Inc., USA.
3.1.1 Preparation of glassware
The glassware used in the study were prepared by soaking them in detergent
(Teepol) solution overnight. The following day, they were washed thoroughly in running
tap water, followed by rinse in deionised/ distilled water (DW). The oven dried glassware
were packed and sterilized in hot air oven for one hr at 160?C as per Collee et al. (1989).
62
3.1.2 Preparation of plasticware
The new plasticware including microcentrifuge tubes and micropipette tips were
sterilized by autoclaving at 121oC for 15 min at 15 psi.
3.1.3 Media and reagents used
Brain Heart Infusion broth and agar, Mannitol salt agar, Blood agar base,
Nutrient agar and broth, Toludine blue DNA agar, Voges-Proskauer’s test medium,
Peptone water, Glycerol, Hydrogen peroxide, and Gram’s staining kit were obtained
from M/s Hi media Laboratories Ltd., Mumbai and, the media and reagents were
prepared as recommended by the manufacturer and sterilized by autoclaving.
3.1.3.1 Blood agar (BA)
Blood agar was either prepared using blood agar base (Hi media Laboratories Ltd.,
Mumbai) to which 5% sheep blood was added as per standard procedure or ready to
use 5% sheep blood agar plates (M/s JDM Technologies, Bangalore) were procured.
3.1.3.2 Nutrient-glycerol broth
Nutrient broth (sterile) 85 ml
Sterile glycerol 15 ml
Glycerol was sterilized in hot air oven at 160o C for one hr and added into nutrient
broth sterilized by autoclaving, mixed well and aliquoted into sterile tubes in 1ml
quantities and stored at 4º C.

63
3.2 Collection of milk samples
A total of 313 bovine milk samples collected from 7 organized Farms (n=158)
and 7 unorganized sectors (n=155) from various geographic locations in and around
Bangalore and Bidar were subjected for study (Table 1). The total samples comprised 222
samples and 91 samples from Bangalore and Bidar, respectively (Table 13.1 and 13.2).
Out of these, a total of 176 bovine milk samples from four organized farms (n=61) and
seven unorganized sectors (n=115) were collected (Bidar-91 samples and Bangalore-85
samples) in this study. The remaining samples (n=137) that were already collected and
processed up to bacteriological isolation were also included in this study, and the relevant
data regarding their history and SCM tests results were also incorporated for further
overall analysis.
In addition, a total of 42 milk samples from clinical mastitis cases were also
collected from the cows that were presented in the clinics attached to Veterinary College,
Bidar/ Bangalore. The relevant history was also collected for all the samples.
Approximately 10 ml of milk was collected in sterile tubes following strict aseptic
measures and was immediately transported to laboratory in refrigerated conditions.
3.3 Screening for subclinical mastitis
All the milk samples (n=313) collected from organized/ unorganized sectors were
screened for subclinical mastitis (SCM) by Somatic Cell Count (SCC), Electrical
Conductivity (EC) test, California Mastitis Test (CMT) and Bromothymol Blue (BTB)
strip tests.

64
Table 1.Farm/ sector-wise details of milk samples collected
Sl. No.
Farm code
No. of milk samples collected Sl. No. Farm code No. of milk
samples collected Organized Sector Unorganized Sector
1 Farm A 10 1 Sector A 40 2 Farm B 21 2 Sector B 31 3 Farm C 66 3 Sector C 26 4 Farm D 28 4 Sector D 21 5 Farm E 20 5 Sector E 15 6 Farm F 8 6 Sector F 9 7 Farm G 5 7 Sector G 13
Total 158 Total 155 Grand Total = 313
3.3.1 Estimation of Somatic Cell Count (SCC)
Freshly collected milk samples were used for SCC estimation and all the milk
samples (n=313) collected from organized/ unorganized sectors were screened for SCM
by either Direct Microscopic Somatic Cell Count in milk (n=176) or using Nucleocounter
(n=137).
3.3.1.1 Direct Microscopic Somatic Cell Count in milk
Procedure: The procedure followed was according to general principle of Prescott and
Breed method as detailed by Schalm et al. (1971).
Preparation of milk films
? The milk samples were mixed 15-20 times to obtain a uniform distribution of cells
and were allowed to stand for 2-5 min to permit air bubbles to rise and foam to
disappear.

65
? A clean, grease-free microscopic slide was placed over the template to outline four
one sq.cm areas.
? Ten µl of milk was placed exactly in the centre of the one sq.cm template and was
spread evenly to cover all the area delineated by the template. From each sample,
two films were prepared using successive areas of the slide. The films were dried at
room temperature and then stained.
Staining by Newman – Lampert staining technique
? The slides with milk smears were placed on the slide rack and were flooded with
modified Newman-Lampert stain (Himedia) for 2 min.
? The excess stain was drained off by standing the slides on absorbent paper and air-
dried.
? The slides were rinsed in three changes of tap water at 42-45°C and air-dried.
Counting of cells
Stained films were examined under oil immersion objective and the number of
cells in 20 fields was counted. The fields were selected by moving the slide horizontally
from one edge of the film through the centre to the opposite edge and then, repeated in a
vertical direction. The average number of cells per field was multiplied by the
microscopic factor.

66
Calibration of the microscope / Calculation of microscopic factor
The diameter of the microscopic field seen through oil immersion objective was
measured using a stage micrometer slide ruled in 0.1 and 0.01 mm. The diameter of the
field was measured up to two decimal points and the area of the field was calculated
using the formula πr2.
Area of the smear (in mm2 ) Microscopic factor (MF) =
Area of the microscopic field
The diameter was 0.16, then r = 0.08
100 So, MF = = 4976 ? 5000
3.14X 0.082
Since, the milk sample taken on the slide was 0.01 ml, the total number of cells
per ml of milk was given by the formula,
Cell count per ml of milk = Average no. of cells per field ? MF ? 100
3.3.1.2 SCC using Nucleocounter
Somatic Cell Count was estimated using Nucleocounter (ChemoMetec, Denmark)
available at PD_ADMAS, Bangalore. Initially, 500 μl of milk sample was mixed with
equal quantity of the lysis buffer supplied by the manufacturer. The mixture was mixed
gently to lyse the cells. The lysed milk was then aspirated into the cassette and the
cassette was then inserted into the Nucleocounter and the SCC values were recorded.

67
The SCC value > 5,00,000 cells/ml of milk was taken as criteria to declare the
milk / animal as subclinically mastitic / infected.
3.3.2 Measurement of Electrical conductivity (EC)
Milk samples procured were subjected for Electrical conductivity test using hand
held instrument (Milk checker, Oriental instruments limited, Tokyo, Japan or Mastitis
Detector, Draminski, Olsztyn, Poland). Milk sample was poured till the brim marked in
the sampling cup of the instrument. Electrical conductivity of more than 6.5 milli
Siemens (mS)/cm was taken as criteria to declare the milk/animal as subclinically
mastitic /infected.
3.3.3 California Mastitis Test (CMT)
Mastitis reagent obtained from Nice Chemicals Pvt. Ltd. Kochi, Kerala, was used
to perform CMT according to the procedure described by Sharma and Rajani (1969). An
equal quantity of milk was mixed with the mastitis reagent and mixed well on a clean
glass slide or plate using a tooth pick. The results were recorded as positive when it
resulted in thickening and/ or clot/ gel formation within 60 seconds.
3.3.4 Bromothymol Blue (BTB) strip test (Indicator paper method)
The method was employed for detection of SCM and for this a commercially
available Mastrip, a cellulose based BTB strip impregnated with stabilized ion sensitive
indicator (Bromothymol Blue), procured from Ayurvet Ltd., Delhi, was used. A drop of
milk was placed on the strip and observed for changes in colour. The interpretation of
changed colour was read as follows:

68
Yellow - Normal
Greenish yellow - Subclinical Mastitis
Green - Advanced Subclinical Mastitis
Blue - Clinical Mastitis
3.3.5 Statistical analysis of the results of SCM tests
The Pearson chi square test was used to analyze the results of all the four SCM
tests for significant association using PROC MEAN or PROC FREQ procedure of SAS
9.2 software programme and with this, comparative evaluation of the SCM tests
regarding their efficacy to detect SCM cases was made.
3.4 Isolation of Staphylococcal species from milk samples
Isolation of Staphylococcus and the relevant biochemical tests were carried out as
per the standard procedure (Collee et al., 1989). About 0.1 ml of milk sample was
initially enriched in 3 ml of Brain heart infusion (BHI) broth for 8 hrs at 37⁰ C, then
streaked on to Mannitol salt agar and incubated at 37⁰ C for 24 hrs. After reading the
colony morphology on MSA, the cultures were streaked on to BHI agar for further
identification procedures. Purity of the culture was checked by Gram’s staining and
panel of biochemical tests.
3.5 Gram’s staining: Gram’s staining kit, which contained Crystal violet, Gram’s iodine,
Decolourizer and Safranin was procured from M/s Hi-Media, Mumbai. Staining of all the
culture isolates was carried out as per the instructions mentioned in the kit.

69
3.6 Preservation of pure culture and revival of isolates
Pure cultures thus obtained were streaked on to nutrient agar slants and
preserved at 4⁰C for further use. Cultures were also preserved in sterile nutrient
glycerol (15%) broth vials at -20ºC until further use. The isolates were revived once
in three months in slants and once in a year in nutrient glycerol broth.
3.7 Biochemical characterization (Collee et al., 1989) and identification of isolates
3.7.1 Catalase test: Ebullition of gas bubbles after the addition of 24 hr culture to 3%
hydrogen peroxide indicated positive reaction. Absence of ebullition of gas bubbles
indicated negative reaction. Only catalase positive cultures were considered for further
characterization.
3.7.2 Haemolytic pattern: The colonies were further streaked on to blood agar to
study the haemolytic patterns. β haemolysis, a complete zone of clearance and α
haemolysis, a greenish discolouration around and beneath the colonies was recorded on 5
% sheep blood agar plates.
3.7.3 Coagulase test: All the staphylococcal isolates obtained were first subjected to
tube coagulase test. For this, about 0.3 ml of 18 hr old Staphylococcus culture in BHI
broth was mixed with 0.5ml of diluted rabbit plasma (1:4 in PBS) and incubated
overnight at 37°C. The result was recorded at 1 hr, 4 hr and after overnight incubation.
Formation of clot/ stiff gel which remained in place when tube was tilted through 90º
angle or inverted was considered as positive for coagulase production. The tubes were
read negative when plasma remained liquid or showed only a flocculent or ropy

70
precipitate even after overnight incubation and only such isolates negative by coagulase
test were further subjected to various biochemical tests as follows.
3.7.4 Thermonuclease test: Wells of 6mm diameter were punched in the Toluidine blue
DNA agar (M/s Hi-media Laboratories Ltd., Mumbai). Twenty-four hr old CoNS cultures
in BHI broth were boiled for 15 min and cooled. About 20µl of this culture suspension
was loaded onto the wells in the Toluidine blue DNA agar and incubated at 37°C for 24
hr. Presence of a pink halo around the well with a dark blue peripheral ring was
considered as positive for thermonuclease test.
3.7.5 Biochemical characterization of the isolates using HiStaph™ Identification Kit
All CoNS isolates were further characterized by KB004 HiStaph™ Identification
Kit (Hi-media Laboratories Ltd., Mumbai) which consisted of miniature wells to perform
simultaneously 12 different tests viz., Voges Proskauer test, Phosphatase test, o-
nitrophenyl-ß-D-galactopyranoside (ONPG) test, Urease test, Arginine Utilisation test
and, tests for the fermentation of sugars such as Mannitol, Sucrose, Lactose, Arabinose,
Raffinose, Trehalose and Maltose. Following the manufacturer’s instructions, about 50µl
of 18 hr old bacterial suspension of the isolate adjusted to tube no. 0.5 on the McFarland
scale was overlaid on each of the 12 wells of the kit and then it was incubated at 37ºC for
24 hr. The reagents supplied were added to the wells of Voges Proskauer and
Phosphatase test, and then the results were recorded as per the recommendations of the
manufacturer.

71
3.7.6 Speciation: The biochemical profile was then compared with the index supplied by
the manufacturer and the appropriate Staphylococcus species was assigned for every
isolate.
3.8 Staphylococcal reference cultures
The staphylococcal cultures obtained from Microbial Type Culture Collection
and Gene Bank (MTCC), Chandigarh were included in the study as reference cultures
(Table 2) for biochemical as well as molecular characterization studies.
Table 2. Panel of staphylococcal reference cultures used in the study
Sl. No. Species MTCC No.
1 S. chromogenes 3545
2 S. epidermidis 3382
3 S. epidermidis 3615
4 S. sciuri 6154
5 S. saprophyticus 6155
6 S. haemolyticus 3383
7 S. aureus 96
3.9 Molecular characterization of CoNS isolates by PCR
3.9.1 Reference isolates
In addition to the reference isolates of Staphylococci procured from MTCC,
Chandigarh (Table 2), the CoNS strains viz., Staphylococcus arlettae (GenBanK
accession no. JQ764624) and S. xylosus (isolate no. 48; GenBanK accession number
awaited) obtained in this study were also used as reference isolates after they were
72
confirmed as belonging to the species as detected by the PCR and sequencing based
method of detection mentioned further in the section 3.9.7 of this thesis.
3.9.2 PCR primers
3.9.2.1 Designing of the PCR primers
? The gene sequences of interest were downloaded from the NCBI, GenBank and saved
in the EditSeq format.
? Primers were designed either manually using MegAlign program or using software
such as ‘Prmer3’ / ‘Primerquest’.
? For manual designing of the primers, the downloaded sequences were loaded into the
EditSeq program of “Lasergene DNA STAR” software.
? The saved sequences were then aligned by ClustalV method using MegAlign program
of the same software.
? The alignment report contents were then split to fit them to a page.
? The aligned sequences were then used for designing the primers manually.
? For designing primers using software, the downloaded sequences were then loaded
into the ‘Prmer3’ / ‘Primerquest’ software and the primers meeting all the
requirements of the PCR conditions and in silico specificity were selected.
? Criteria for the selection of the primers:
For the genus specific primers, a region conserved through the genus was chosen.
For species specific primers, variable region was chosen.
Other criteria such as GC content of 40-60% and Tm value of 55-60, nucleotide
sequence length of 18-27 were also considered.
73
3.9.2.1 Synthesis/ Procurement of PCR primers
All sets of primers used in this study were synthesized commercially at M/s.
Bioserve Biotechnologies (India) Pvt. Ltd, Hyderabad, and they were reconstituted in
NFW as per the requirement and stored at - 20OC.
3.9.3 Extraction of genomic DNA
Extraction of genomic DNA was done using “HiYield™ Genomic DNA Mini Kit
(Blood/ Bacteria/ Cultured cells)” procured from Real Biotech Corporation, Banqiao
city, Taiwan.
3.9.3.1 Materials: HiYield™ Genomic DNA Mini Kit (RBC, Banqiao city, Taiwan),
Spectrophotometer, Sterile DNase free Micropipette tips and Microcentrifuge tubes
(Tarsons), Microcentrifuge and Micropipettes (Eppendorf, Germany), Ethanol (96-100
%), Lysozyme Buffer solution.
Materials provided in the kit: GB Buffer (Lysis Buffer), W1 Buffer, Wash Buffer
(concentrated), Elution Buffer, GB Columns, 2 ml Collection tubes.
One hundred µl of ethanol (96-100 %) was added to Wash Buffer (concentrated)
of the kit, labeled as Wash Buffer (ethanol added) and kept ready prior to use.
Composition of Lysozyme Buffer solution:
Lysozyme: 20 mg/ml
Tris HCl : 20 mM (pH 8.0)
EDTA : 2 mM
Triton X : 1.2%
Lysozyme buffer solution was prepared fresh immediately prior to use.
74
3.9.3.2 Protocol for extraction of genomic DNA
The genomic DNA was extracted, as per the standard protocol prescribed by the
manufacturer for Gram-positive bacteria, using the HiYield™ “Genomic DNA Mini Kit
(Blood/ Bacteria/ Cultured cells)” procured from Real Biotech Corporation, Banqiao city,
Taiwan.
Cell harvesting:
? One ml of 18 hr old cultured bacterial cells (up to 1X10⁹) was transferred to a 1.5 ml
microcentrifuge tube, centrifuged at full speed (13,000 rpm) for 1 min. and the
resultant supernatant was discarded.
? Two-hundred µl of Lysozyme buffer was added to the tube and the cell pellet was
resuspended by vortexing or pipetting.
? Then incubated at RT for 10 min. During incubation, the tube was inverted every 2-3
min.
Cell lysis:
? Two-hundred µl of of GB buffer was added to the sample and mixed thoroughly by
vortexing for 5 seconds.
? The mixture was incubated at 70o C water bath for 10 min. until the sample lysate was
clear and inverted the tubes every 2-3 minutes. Meanwhile, the Elution buffer
required for the next step was kept ready by preheating at 70o C.

75
DNA binding:
? Two-hundred µl of ethanol (96-100 %) was added to the sample lysate and mixed by
vortexing for 10 sec. Precipitate, if appeared, was broken up by pipetting.
? Then, the GB columns were placed in a 2 ml collection tubes.
? All the mixture from the previous step, including the precipitate, if any, was carefully
applied to the GB column. The cap was closed and centrifuged at full speed (13,000
rpm) for 2 minutes.
? The 2 ml collection tube containing the flow-through was discarded and the GB
column was placed in a new clean 2 ml collection tube.
Wash:
? Four-hundred μl of W1 buffer was added in the GB column without wetting the rim
and centrifuged at full speed (13,000 rpm) for 30 seconds.
? The flow-through was discarded and GB column was placed back in the 2ml
collection tube. Then, 600 μl of Wash buffer (ethanol added) was added in the GB
column and centrifuged at full speed (13,000 rpm) for 30 seconds.
? The flow-through was discarded and GB column was placed back in the 2ml
collection tube. Then, the cap was closed and centrifuged at full speed (13,000 rpm)
for 3 minutes to dry the column matrix.
DNA elution:
? The dried GB column was transferred into a clean 1.5 ml centrifuge tubes.
76
? One hundred μl of preheated Elution buffer was added into the centre of the column
matrix and allowed to stand at RT for 3-5 minutes until the Elution buffer is absorbed
by the matrix.
? Finally, the purified DNA was eluted by centrifuging at full speed (13,000 rpm) for
30 seconds and stored at -20° C until further use.
3.9.3.3 Determination of purity and yield of the DNA samples by UV
spectrophotometry
The purity and concentration of the extracted genomic DNA was estimated by UV
spectrophotometry. An aliquot of 20?l of DNA sample was dissolved in 0.98 ml of sterile
DW. The diluted DNA was transferred into 1 ml microcuvette and the optical density
(OD) was read at 260nm and 280nm in a UV spectrophotometer. Sterile DW was used as
blank.
The ratio of 260/280 OD was calculated. A ratio of 1.7 to 1.9 was considered
pure. Further, the purity of the DNA sample was checked by electrophoresis on 0.8 per
cent agarose gel.
3. 9.3.4 DNA confirmation by Agarose Gel Electrophoresis
The 0.5 µg DNA was used to check the purity by electrophoresis on 0.8 % agarose gel.
3.9.3.4.1 Equipments: Horizontal electrophoresis apparatus with power pack (Bangalore
Genie, India), Micro-wave oven (LG, India), Gel documentation unit (Bio-Rad, USA).
3.9.3.4.2 Reagents
a. Agarose (Synergy Scientific Services, Chennai)

77
b. Tris - Borate EDTA buffer (TBE buffer) (10X, pH 8.2)
Tris base 108.0 g
Boric acid 55.0 g
EDTA disodium salt 8.3 g
Double D.W up to 1000.0 ml
The stock solution was sterilized by autoclaving and made to 1X before use.
c. Gel loading dye (6X) was procured from Biosciences, Merck specialties Pvt. Ltd.,
Mumbai and stored at 4oC.
d. Ethidium bromide (10 mg) was procured from Biosciences, Merck specialties Pvt.
Ltd., Mumbai. One ml of DW was added and the suspension was mixed properly to
dissolve the dye. The stock solution was stored at RT and protected from light.
e. 100 bp DNA ladder (Biosciences, Merck specialties Pvt. Ltd., Mumbai)
3.9.3.4.3 Procedure
About 0.2g of analytical grade agarose was dissolved in 20 ml of 1X TBE buffer
by melting in microwave oven to obtain a clear uniform suspension. Prior to casting the
gel, the molten agarose was allowed to cool to about 50°C, after which ethidium bromide
was added to a final concentration of 0.5?g/ml and mixed thoroughly. Gel was cast on an
appropriate gel casting tray fitted with acrylic comb and left for setting. The acrylic comb
was carefully removed after the gel was set. The tray with gel was then submerged in an
electrophoresis tank containing 1X TBE buffer.
The DNA to be analyzed was mixed with 1/6th volume of 6X loading dye and
carefully loaded into the wells using micropipette alongside 100bp DNA molecular
50
respectively, in cases of bovine mastitis. In this study, 59 strains were detected as S.
aureus by both conventional tests and PCR, and 13 of them were found to be methicillin
resistant and 4 (30.7%) were positive for mecA gene. Only 2 of 59 strains were positive
for both methicillin resistance and slime producing, phenotypically, suggesting lack of
correlation between methicillin resistance and slime production in these isolates.
Capurro et al. (2009) in Sweden identified antimicrobial resistance in 15 (18%) of
82 milk isolates, and β-lactamase production was found in13 of those isolates (1 S.
aureus, 1 S. chromogenes, 5 S. epidermidis, 5 S. haemolyticus, 1 S. xylosus). One S.
epidermidis isolate was multi-resistant, i.e. resistant to more than three antimicrobials.
This isolate, as well as one additional S. epidermidis isolate, were mecA gene positive by
PCR. Two S. chromogenes isolates did not produce β-lactamase, but were resistant to
trimetoprim/sulfametoxazole. Anti-microbial resistance was not associated with specific
CoNS species or ‘tuf’ gene sequences.
Sawant et al. (2009) screened CoNS isolates (n = 168) obtained from milk from
heifers and dairy cows for MIC to antimicrobials used commonly for mastitis therapy. Of
the 10 CoNS species included in the study, the predominant species were S. chromogenes
(n = 61), S.epidermidis (n = 37), S. hyicus (n = 37), and S. simulans (n = 16). The
majority of CoNS was susceptible to ampicillin, oxacillin, cephalothin, and ceftiofur.
Erythromycin and pirlimycin were also very effective in vitro inhibitors of CoNS. The
only exception was observed with S. epidermidis. Of 37 S. epidermidis evaluated, 13
(35%) exhibited efflux-based resistance to erythromycin (≥16 mg/ml) encoded by msrA
and oneisolate carried ermC encoding ribosomal methylase-based resistance to both

78
weight (MW) marker. Electrophoresis was carried out at 5 V/cm until the tracking dye
(Bromophenol Blue) had just reached the anode end of the gel. Following the
electrophoresis, DNA bands were visualized and the images were captured using gel
documentation system; Gel Doc XR (Bio-Rad, USA).
3.9.4 PCR based confirmation of CoNS to genus level
All the CoNS isolates obtained in the study were first confirmed at genus level by
the partial amplification of Staphylococcus genus specific sequence of the tuf gene. For
this, genus specific primers (Table 3) targeting the tuf gene of staphylococci designed
earlier (Hegde, 2011) and made available in the Dept. of Veterinary Microbiology,
Veterinary College, Bangalore-24, were used.
3.9.4.1 Reagents: As listed in section 3.9.3.4.2 and Table 3 and 4.
3.9.4.2 Partial amplification of tuf gene by Staphylococcus genus specific primers
Staphylococcus genus specific primers (Table 3) synthesized and stored as
mentioned in section 3.9.2.1 were used for the amplification of target sequence.
Table 3. Oligonucleotide sequences of Staphylococcus genus specific (tuf gene) primers
Name of the primer Primer sequence 5’─ 3’ Product length (bp)
Staph tuf-F GAA GAA TTA TTA GAA TTA GT 235
Staph tuf-R GTG ATT GAG AAT ACG TCC TCA AC
The reaction mixture of 25 µl each was prepared in 0.2 ml thin walled PCR tubes
placed in mini cooler as shown below (Table 4).

79
Table 4. Contents of 25µl PCR mixture for tuf gene based PCR
Reagents (Conc.) Volume
10X Taq Buffer (10 mM Tris HCl, 15mM MgCl2pH 8.4) 2.5 µl
Taq Polymerase (1U/µl) 0.8 µl
dNTPs (100µM/µl i.e., 25mM each dNTP) 1.0 µl
Primer F (Staph tuf-F) (10 pmoles/µl) 1.0 µl
Primer R (Staph tuf-R) (10 pmoles/µl) 1.0 µl
Template (Staphylococcal DNA) 3.0 µl
Nuclease Free Water - to make a final volume of 25µl 15.7 µl
Total 25.0 µl
After mixing the contents, tubes were centrifuged to collect the contents in the
bottom. Then the tubes with cap were placed firmly into the thermal cycler and the
thermal cycler conditions were set as detailed below (Table 5).
Table 5. Thermal cycling conditions for tuf gene based PCR
Initial denaturation Denaturation Annealing Extension Final
extension
94oC, 5 min. 94oC,30 sec. 50oC, 30 sec. 72oC, 30sec.
72oC,10 min. Repeated for 30 cycles
PCR was carried out using a programmable master cycler (Eppendorf, Germany).
After completion of PCR reaction, 3µl of the amplified products along with 100bp DNA
ladders, added with 6X gel loading dye, were subjected to electrophoresis on 2.0 per cent
agarose gel. The images were captured using gel documentation system; Gel Doc XR
(Bio-Rad., U.S.A).
80
3.9.5 Development and Standardization of m-PCR for detection of CoNS species
3.9.5.1 Species considered for detection by m-PCR
Five predominant CoNS species (S. arlettae, S. fluerettii, S. equorum, S.
epidermidis and S. saprophyticus) identified based on the outcome of phenotype-based
speciation were considered to be included for detection by m-PCR. However, to rule out
the possibility of incorrect identification of species by biochemical typing, five CoNS
species (S. chromogens, S. simulans, S. sciuri, S. haemolyticus and S. xylosus) which
were reported to be predominant elsewhere by molecular methods, were also included in
the study. In all, a total of 10 different sets of species specific primers were designed in
this study to detect CoNS at species level and used for PCR studies.
3.9.5.2 Designing of primers for detection of CoNS species
Species specific primers were designed by targeting ‘gap’ / ‘sodA’/ ‘rpoB’ genes
(anyone) of CoNS as detailed in the section 3.9.2.1. All the designed primer sets (reverse
and forward) were analyzed for their compatibility using Primerstat software for all
primer secondary structures including hairpins, self-dimers, cross-dimers in primer pairs
and primer dimers. Primers are enlisted with their base sequences, accession no. of the
gene sequence used for primer designing along with other details in Table 6.
Although there was no positive reference for S. fluerettii and S. equorum, the
primers specific for these species in silico were included in the two-tube multiplex PCR
assay in this study with the aim of detecting these species, if any.

81
3.9.5.2 Standardization of uniplex assay PCR for CoNS species
Initially, the gradient PCRs were set up for each of the species targeted in the
study by using known positive reference cultures listed in Table 2. A temperature range
of 5° C above and below the annealing temperature calculated based on the Tm value of
the each primer set was used in the gradient PCR. The temperature range at which the
primers amplified the target species was noted down for every species.
For S. arlettae and S. xylosus, for which the positive references were not
available, all the biochemically identified S. arlettae and S. xylosus isolates were
screened by the uniplex PCR using respective species specific primers and, those which
were confirmed as belonging to the corresponding species both by PCR and subsequent
sequencing of the amplicon were used as positive reference strain.
3.9.5.3 Evaluation of the primers
Then uniplex PCR was standardized using known reference cultures (Table 2).
Specificity of each set of primers was confirmed by the standardized unipex PCR using
known positive and negative controls. All the reference cultures of Staphylococcus
(Table 2) were used as negative controls for the uniplex PCR except the species targeted
which served as positive control. In addition to these, the isolates maintained at the
Department of Veterinary Microbiology, KVAFSU, Veterinary College, Bangalore viz.,
Sterptococcus agalactiae (AD1), Streptococcus dysgalactiae (AD3), Streptococcus
uberis (AD6) and E. coli with GenBank accession nos. HM 355961, HC 359248, HC
355972, JF926686, respectively, all of which are the etiological agents of mastitis, were
also used as negative controls in this assay.

82
3.9.5.3 Standardization and development of two-tube m-PCR
Once the uniplex PCR was standardized, the temperature at which amplification
was fairly better was considered suitable for multiplexing. Primers in each tube were
analyzed using FastPCR software for all primer secondary structures including hairpins,
self-dimers, cross-dimers in primer pairs and primer dimers before multiplexing. Then,
based on the outcome of the analysis of FastPCR, five compatible primer sets with a
difference of minimum 50bp in their expected amplicon size were considered to be
included in each tube for the standardization of two tube multiplex PCR. Thus, the
primer sets specific for S. arlettae, S. chromogenes, S. sciuri, S. epidermidis and
S. saprophyticus were used in one tube reaction and, the primer sets specific for
S. equorum, S. haemolyticus, S. xylosus, S. simulans and S. fluerettii were used in the
other tube reaction in a two-tube m-PCR (Table 6).

83
Table 6. Primers used for the detection of CoNS species
Primer sets used in used in tube-1 Sl. No
Name of the
Primer
Species and gene targeted Oligonucleotide Sequence 5’─ 3’ Length Start
position
Product Size (bp)
Accession No.
1 Sarl-gap S. arlettae, gap F: ATCTCTGCTCCAGCATCAGG 20 333 216 DQ321674 R: AGGAGCGTCTTGTGTGCTTT 20 548
2 Schrom-sodA
S. chromogens, sodA F: CGTGACTAAGTTAAACGATGCAG 23 54 303 AJ343901 R: CCATTATTTACAACGAGCCATG 22 356
3 Ssci-gap S. sciuri, gap F: ATTTCAGCTCCAGCATCAGG 20 333 354 FJ578004 R: TGGAACACGTTGAGCTGATC 20 686
4 Sepi-rpoB S. epidermidis, rpoB F: AGGGCCTGGTGGATTAACAC 20 182 466 EF173659 R: TTGCATGTTTGCTCCCATTA 20 647
5 Ssap-gap S. saprophyticus, gap F: CGTTGACGGAATCGACGTAG 20 47 630 DQ321695 R: TGCGCTCCTCCATCTAATTT 20 676
Primer sets used in used in tube-2 6 Seq- sodA S. equorum, sodA F: AACGCTGCAGTTGAAGGAAC 20 82 245 AY818175
R: GCAGCTTGGTTAGCAAACTCTTC 23 326 7 Shaem-
sodA S. haemolyticus, sodA F: GCAGTTGAGGGAACAGATCTTG 22 76 292 EU652775
R: CTAACTGACCATTGTTAACTACTAACC 27 367 8
S xyl-rpoB
S. xylosus, rpoB F: GTCTAGTTATGCCCGTGTGAATG 23 126 433 FJ906727 R: AACAATTGCAGCACCTGAGTC 21 558
9 Ssim-gap S. simulans, gap F: CTACACTAGCGACGAAAAAGCAC 23 275 482 AF495498 R: CGTTTACTTCTTCGATTGTTACGTC 25 756
10 Sflu- rpoB S. fluerettii, rpoB F: ATCAGCTCTTGGACCCGG 18 7 550 GQ222236 R: GTCACGAGCAGTTACGTGTTCC 22 556

84
3.9.5.3.1 Preparation of PCR mixture for two-tube m-PCR
The reaction mixture of 25 µl prepared in 0.2 ml thin walled PCR tubes, on ice, in
each of the two-tubes comprised of the following reagents (Table 7). The primers were
added, 5 sets in each tube, as dsecribed above in section 3.9.5.3 and Table 6.
Table 7. Contents of the PCR mixture used in two-tube m-PCR
Sl. No Reagents (Conc.) Volume
1 10X Taq Buffer (10 mM Tris HCl, 15mM MgCl2, pH 8.4) 2.5 µl
2 Taq Polymerase (1U/µl) 0.8 µl
3 dNTPs (100µM/µl i.e., 25mM each dNTP) 1.0 µl
4 Primer F – 1 µl each from the 5 sets of the primers (10 pmoles/µl) 5.0 µl
5 Primer R – 1 µl each from the 5 sets of the primers (10 pmoles/µl) 5.0 µl
6 Template - 1 µl each from the 5 samples 5.0 µl
7 Nuclease Free Water - to make a final volume of 25µl 5.7 µl
Total 25.0 µl
3.9.5.3.2 Protocol for two-tube m-PCR
PCR with required cycling conditions (Table 8), electrophoresis of the PCR
products and the documentation of the gel images were carried out in a similar manner as
described in section 3.10.4.
Table 8. Cycling conditions used for two-tube m-PCR
Initial denaturation Denaturation Annealing Extension Final
extension
94oC, 5 min. 94oC,30 sec. 60oC, 30 sec. 72oC, 30sec.
72oC,10 min. Repeated for 30 cycles

85
3.9.6 Triplex PCR for the detection of S. aureus
CoNS isolates that were negative by two-tube m-PCR including phenotypically
thermonuclease positive isolates were subjected for triplex PCR specific for S. aureus
developed and standardized by Raju et. al. (manuscript under preparation), to identify
coagulase negative S. aureus, if any.
3.9.6.1 Preparation of PCR mixture
PCR mixture was prepared as described in 3.10.5.3.1. The reagents were same but
the primers were different (Table 9).
Table 9. Primers used in the S. aureus specific triplex PCR
Sl. No
Species and gene targeted Primer Length Product
size (bp)
1 Fib F: AATTGCGTCAACAGCAGATGCGAG 24
210 R: GGACGTGCACCATATTCGAATGTACC 26
2 Nuc F: GTGCTGGCATATGTATGGCAATTGT 25
461 R: TCTTTGACCTTTGTCAAACTCGA 23
3 23S rRNA F: ACGGAGTTACAAAGGACGAC 20
1250 R: AGCTCAGCCTTAACGAGTAC 20
3.9.5.3.2 Triplex PCR Protocol
The amplification reaction was also carried out in a similar manner as described
in the section 3.10.4., but only the PCR conditions were different as follws.

86
Cycling conditions used for Triplex PCR
Initial denaturation Denaturation Annealing Extension Final
extension
94oC, 5 min. 94oC,30 sec. 60oC, 30 sec. 72oC, 30sec.
72oC,10 min. Repeated for 30 cycles
Electrophoresis of the PCR products and the documentation of the gel images
were also carried out in a similar manner as described earlier in section 3.9.4.
3.9.7 Sequencing of Polymerase Chain Reaction products
All reference CoNS strains, few representative test isolates from different species
and geographic locations were chosen for sequencing. In all, 30 samples were sent for
sequencing which included 7 reference strains, 24 test isolates from 8 different CoNS
species, 2 coagulase negative S. aureus isolates. Details are shown in results (Table 22).
3.9.7.1 Polymerase chain reaction
The PCR was carried out in 100 µl reaction volume for the reference strains
and test isolates as described in this thesis depending on the species/ gene targeted.
3.9.7.2 Purification of PCR product
All the amplified products were purified using HiYield™ Gel/PCR Fragments
Extraction Kit procured from Real Biotech Corporation, Banqiao city, Taiwan.
3.9.7.2.1 Materials: Supplied with kit:- DF Buffer, Wash Buffer (concentrated), Elution
Buffer, DF Columms, 2 ml Collection Tubes; Additional requirements: 1.5 ml
microcentrifuge tubes, Micropipettes, Microtips.

87
3.9.7.2.2 Protocol for the purification of PCR product
Sample preparation
One hundred μl of the PCR product was transfered to a 1.5 ml microcentrifuge
tube. Five volumes of DF Buffer were added to one volume of the sample and mixed by
vortexing.
DNA Binding
A DF column was placed in a 2 ml collection tube. Sample mixture from previous
step was applied into the DF column and centrifuged at 6,000 x g (8,000 rpm) for 30
seconds. The flow-through was discarded and the DF column was placed back in the
collection tube.
Wash
Five hundred μl of Wash Buffer (ethanol added) was added into the DF column
and centrifuged at 6,000 x g (8,000rpm) for 30 seconds. The flow-through was discarded
and the DF column was placed back in the collection tube. DF column in the collection
tube was centrifuged again at full speed (13,000 RPM) for 2 minutes.
DNA Elution
Dried column was transferred into a new 1.5 ml microcentrifuge tube. Fifteen μl
of elution buffer or NFW was added into the center of the column matrix and it was
allowed to stand for 2 minutes until Elution buffer or NFW was absorbed by the matrix.
Then, the column was centrifuged for 2 minutes at full speed (13,000 RPM) to elute
purified DNA. The DNA eluted was detected by running 3 µl of each product in agarose

88
gel. The purified PCR products were either stored at -20⁰ C for further use or sent for
sequencing.
3.9.7.3 Sequencing of the purified PCR products
The purified PCR amplicons were commercially sequenced at Sequencing Dept.
of Eurofins Genomics India Pvt Ltd., Bangalore, sequencing facility on an ABI-PRlSM
dye terminator DNA sequencing apparatus using T3 sequencing. The sequence data
generated was received as colored electropherograms and text files.
3.9.8 Analysis of Nucleotide sequence and submission to GenBank
The nucleotide sequence data obtained were edited by Bio-edit/ Mega5 software
before they were submitted to GenBank. The sequence data was further analyzed by
BLAST and Clustal method with Weighted residue weight table software program.
MegAlign of DNA STAR was used for further analysis of nucleotide sequences.
CoNS isolates obtained in this study were compared and phylogenetically
analyzed species-wise with the sequence data available in GenBank (http:/ncbi.com).
Details are shown in results. All the sequences were aligned and phylogenetic analysis
was carried out using Clustal method with Weighted residue weight table software
program of MegAlign of DNA STAR or MEGA5. Additional analysis (Percentage
similarity / difference) in nucleotide sequence was estimated using MegAlign program
available in the DNA STAR.
89
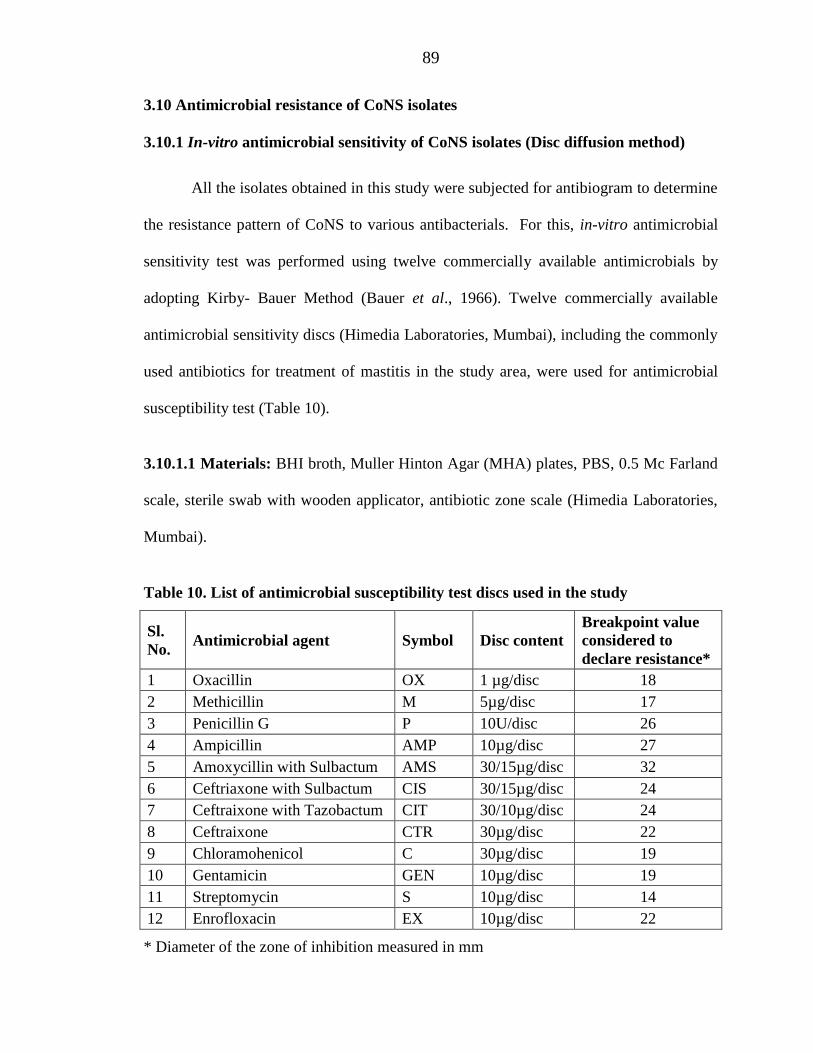
3.10 Antimicrobial resistance of CoNS isolates
3.10.1 In-vitro antimicrobial sensitivity of CoNS isolates (Disc diffusion method)
All the isolates obtained in this study were subjected for antibiogram to determine
the resistance pattern of CoNS to various antibacterials. For this, in-vitro antimicrobial
sensitivity test was performed using twelve commercially available antimicrobials by
adopting Kirby- Bauer Method (Bauer et al., 1966). Twelve commercially available
antimicrobial sensitivity discs (Himedia Laboratories, Mumbai), including the commonly
used antibiotics for treatment of mastitis in the study area, were used for antimicrobial
susceptibility test (Table 10).
3.10.1.1 Materials: BHI broth, Muller Hinton Agar (MHA) plates, PBS, 0.5 Mc Farland
scale, sterile swab with wooden applicator, antibiotic zone scale (Himedia Laboratories,
Mumbai).
Table 10. List of antimicrobial susceptibility test discs used in the study
Sl. No. Antimicrobial agent Symbol Disc content
Breakpoint value considered to declare resistance*
1 Oxacillin OX 1 µg/disc 18 2 Methicillin M 5µg/disc 17 3 Penicillin G P 10U/disc 26 4 Ampicillin AMP 10µg/disc 27 5 Amoxycillin with Sulbactum AMS 30/15µg/disc 32 6 Ceftriaxone with Sulbactum CIS 30/15µg/disc 24 7 Ceftraixone with Tazobactum CIT 30/10µg/disc 24 8 Ceftraixone CTR 30µg/disc 22 9 Chloramohenicol C 30µg/disc 19 10 Gentamicin GEN 10µg/disc 19 11 Streptomycin S 10µg/disc 14 12 Enrofloxacin EX 10µg/disc 22
* Diameter of the zone of inhibition measured in mm

90
3.10.1.2 Protocol:
1. To prepare pure culture inoculum, 3-4 similar colonies of CoNS isolates were
transferred into BHI broth in 5 ml test tubes incubated at 37° C for 6 hrs or till
light to moderate turbidity develops. Then, the tubes were centrifuged at 3,000
RPM for 3 min. The supernatant was discarded and the cell pellet was suspended
in 1-2 ml sterile PBS.
2. The bacterial suspension of the isolates were adjusted to tube no. 0.5 on Mc
Farland scale using sterile PBS to yield a uniform suspension containing 105 – 106
cells/ ml.
3. A sterile non-toxic swab on a wooden applicator was dipped into the standardized
inoculum (whose turbidity was so adjusted as above to obtain a confluent growth)
and the soaked swab was rotated firmly against the upper inside wall of the tube
to express excess fluid.
4. Then, the entire agar surface of the plate was streaked with the swab three times,
turning the plate at 60° angle between each streaking. The inoculum was allowed
to dry for 5 – 10 minutes with lid in place.
5. Then, the antimicrobial susceptibility test discs were deposited aseptically onto
the agar surface with centres at least 30 mm apart. Sterile disc was used as a
control. The plates were incubated immediately at 37° C and examined after 16 –
18 hrs.

91
6. The diameter of zone of inhibition was measured in mm with the help of
antibiotic zone scale. The zone size recorded as diameter in mm was compared
with the interpretative chart supplied with the discs (Table 10) to declare the
result as either sensitive or resistant. The interpretation was done in accordance to
performance standards for antimicrobial disks susceptibility tests, Clinical
Laboratory Standard Institute (CLSI, 2010).
3.10.1.3 Statistical analysis of the results
The data obtained on the species-wise antimicrobial resistance was subjected to
the Pearson’s chi square test using PROC FREQ procedure of SAS 9.2 software
programme. As some of the expected frequencies were very less, Fisher’s exact test was
also applied.
3.10.2 Amplification of antibiotic resistant genes and coa gene of by m-PCR
3.10.2.1 Antibiotic resistant genes targeted and primers used
The antibiotic resistane genes to be targeted were decided based on the
phenotypic resistance pattern of the CoNS isolates. As the highest resistance was noticed
against the β-lactam antibiotics and aminoglycosides, these genes were targeted and the
published primers were used except for mecA (Table 11). Upon detection of
phenotypically coagulase negative S. aureus in the present study, the coa gene encoding
the enzyme coagulase, was also targeted and included in the multiplex PCR.

92
Table 11. Primers used in m-PCR for antibiotic resistance genes and coa gene
Sl. No
Species and gene targeted Primer Length Product
size (bp) References
1 Staph mecA F: TGG CTA TCG TGT CAC AAT CG 20
304 Designed* R: CTG GAA CTT GTT GAG CAG AG 20
2 novel mecA F: TCA CCA GGT TCA ACCT[Y] CAA AA 21
450 Garcia-Alvarez et al. (2011) R: CCT GAA TCAT[W] GCT AAT AAT ATT TC 24
3 Staph aacA-D
F: TAA TCC AAG AGC AAT AAG GGC 21
228 Strommenger et al. (2003) R: GCC ACA CTA TCA TAA CCA CTA 21
R:CAC ACT ATC ATA ACC ATC ACC G 22
4 aph3'-IIIa F: CTG ATC GAA AAA TAC CGC TGC 21
272 Vanhoof et al. (1994) R: TCA TAC TCT TCC GAG CAA AGG 21
5 coa F: AAC AAA GCG GCC CAT CAT TAA G 22
851 Montesinos et al. (2002) R: TAA GAA ATA TGC TCC GAT TGT CG 23

93
The PCR was initially standardized using phenotypically positive and negative
controls. The isolates that were phenotypically resistant to a group of antibacterials were
used as positive controls for the standardization of uniplex PCR to their respective genes,
and those that were sensitive were used as negative controls. Oxacillin and methicillin
were considered as the indicators of methicillin resistance mediated by mecA and novel
mecA gene. Similarly, gentamicin and streptomycin were considered as the indicators of
aminoglycoside resistance mediated by AME genes viz., aacA-D and aph3' -IIIa.
3.10.2.2 Protocol
The preparation of PCR mixture, amplification reaction, electrophoresis of the
PCR products and documentation of images was carried out in a similar manner as
described in section 3.10.5.3. PCR reagents were same but the conditions and the primers
were different (Table 11 and 12).
Table 12. PCR conditions for the amplification of antibiotic resistant genes and coa
gene
Initial denaturation Denaturation Annealing Extension Final extension
94oC, 10 min. 94oC, 20 sec. 55oC, 60 sec. 72oC, 50sec.
72oC,10 min. Repeated for 30 cycles
3.10.2.3 Sequencing of Polymerase Chain Reaction products
Three PCR products obtained by the amplification of antibiotic resistant genes
i.e., mecA, aacA-D and aph3'-IIIa as well as coa were sequenced (details are shown in
results section in Table 22). PCR, purification of PCR products and sequencing was
carried out as per the method described in 3.9.7.

94
3.10.2.3 Analysis of Nucleotide sequence and submission to GenBank
The nucleotide sequence data obtained were edited and analyzed as detailed in the
section 3.9.8.
3.10.3 Determination of minimum inhibitory concentration (MIC) values
MIC values were determined using commercial MIC determination paper strips
either HiComb or Ezy MIC strips obtained from Himedia Laboratories, Mumbai. These
were discs with pre-coated antibacterials in a concentration gradient manner capable of
showing MICs in the range of 0.016 µg to 256µg/ml or 001 µg to 240µg/ml, on testing
against the test organism.
3.10.3.1 Isolates
The isolates which were positive for mecA gene by PCR and a few negative
isolates were used for determination of MIC levels of oxacillin and methicillin. Similarly,
the isolates which were positive for AME genes (aacA-D and Staph aph3'-IIIa) by PCR
and a few negative isolates were used for determination of MIC levels of gentamicin.
3.10.3.2 Protocol for the determination of MIC values
1) Preparation of the inoculum and inoculation to MHA plates were carried out in a
similar manner as mentioned in section 3.9.2 from step 1 to step 4.
2) HiComb MIC strips / Ezy MIC strips stored at 2 – 8⁰ C were first brought to room
temperature or 25⁰ C before they were used.
95
3) The strips were applied aseptically with sterile forceps on to the agar surface with
MIC scale facing upwards and the plates were incubated at 37⁰ C for 18 – 24 hrs.
4) Then, the plates were examined for the zone of inhibition in the form of an
ellipse.
5) MIC value was read as the value at which the zone convenes the comb-like
projections of the strips and not the handle. When no zone of inhibition was
observed, the MIC was recorded as greater than the highest concentration of the
strip. When the zone of inhibition was below the concentration, then the MIC was
recorded as less than the highest concentration of the strip.
The MIC values recorded were compared with the interpretative chart (supplied
with the MIC strips) which was in accordance to the performance standards for
antimicrobial disk suceptility tests, Clinical Laboratory Standards Institute (CLSI, 2010).


