Faculty of Electrical Engineering and Information Technology
Chair of Communication Engineering
Master Thesis
Enhancement of Communication Model for Driving Simulators by Relevant Physical Effects of Radio
Propagation.
Nikhil Deshmukh
Chemnitz, 05/05/2015
Student ID: 329204 Email address: [email protected] Course of studies: Information and Communication systems Chair & Examiner: Prof.Dr.Gerd Wanielik Supervisiors: Dr.-Ing. Ulrich Neubert M.Sc. Comp.Sc Andreas Richter (DLR)
2
Acknowledgement
The need for research in this topic in the Institute of Transportation Systems
at German Aerospace Center (DLR), Braunschweig, Germany was a profound
moment that gave me an opportunity to work and explore the interesting
world of Vehicle-2-Vehicle communication. Therefore I would like to
acknowledge and convey my thanks to Dr. Ulrich Neubert of TU Chemnitz for
his valuable assistance. Working with M.Sc. Comp .Sc. Andreas Richter at DLR
has taught me several intangible things which perhaps I will never be able to
give back in-person and would hence like to convey my regards. The love and
support provided by my parents has always kept me going. Last but not the
least, I would like to thank my friends for providing me time to gain valuable
insights on various technical and philosophical aspects and providing me a
honest feedback.
3
Abstract
Vehicle-2-Vehicle (V2V) and Vehicle-2-Infrastructure (V2I) communication has been
an emerging area of interest in the recent times. It offers applications ranging from
road safety (e.g.: collision avoidance) to infotainment (e.g.: multimedia, navigation,
traffic information etc.). Due to growing number of driver assistance systems, it is
very important to evaluate the interaction with users and acceptance of these
systems. Suitable tools for doing this are driving simulators. The goal of this master
thesis is to enhance an already existing communication model for V2V
communication scenarios that is used for the driving simulators of the DLR-Institute
of Transportation Systems. The current communication simulation implements a
simple propagation model based on free space communication and is already
integrated in the simulator environment that provides all necessary information and
parameters. This work focuses on the enhancement of existing communication
model with two major physical effects: the multi-path propagation to provide “urban
canyon” effects and the directional antenna (main lobe) to take the direction of the
communication into account. Algorithms for assessing the environment are
developed based on the open source graphics engine “Open Scene Graph” and the
prototype implementation is later integrated in the DLR Institute’s own system
architecture called “Dominion”.

4
Contents
List of Figures .............................................................................................................. 6
List of Abbreviations .................................................................................................... 7
1. Introduction ............................................................................................................. 8
1.1 Motivation .............................................................................................................. 9
1.2 Problem statement ................................................................................................ 9
1.3 Thesis structure ................................................................................................... 10
2. Vehicle-to-Vehicle Communication........................................................................ 11
2.1 Car 2 Car Communication Consortium ................................................................ 11
2.2 Scenarios ............................................................................................................ 12
2.3 Use Cases ........................................................................................................... 13
2.3.1 Safety ....................................................................................................... 13
2.3.2 Traffic Efficiency ....................................................................................... 14
2.3.3 Infotainment and others ........................................................................... 15
2.4 System Architecture ............................................................................................ 17
3. Radio System ........................................................................................................ 19
3.1 General ............................................................................................................... 19
3.2 Application Categories ........................................................................................ 19
3.3 Physical Layer ..................................................................................................... 20
3.4 MAC layer ........................................................................................................... 21
4. Open Scene Graph ............................................................................................... 22
5. Dominion System Architecture .............................................................................. 25
6. Communication Simulation and its Requirements ................................................. 27
6.1 Approach ............................................................................................................. 28
6.1.1 Propagation Models ................................................................................. 29
6.1.1.1 Free Space Model ................................................................................. 30
6.1.1.2 Two Ray Ground Model ........................................................................ 31
6.1.1.3 Knife Edge Diffraction Model ................................................................. 32
6.1.2 Antenna .................................................................................................... 34
7. Implementation ...................................................................................................... 38
7.1 Algorithm ............................................................................................................. 39
7.1.1 Function main() ........................................................................................ 40
7.1.2 Function LineIntersection() ....................................................................... 41

5
7.1.3 Function FindNamedNode() ..................................................................... 42
7.1.4 Function reflection() ................................................................................. 43
7.1.5 Function diffraction() ................................................................................ 43
7.1.6 Function totalReceivedPower() ................................................................ 44
7.1.7 Function lookup(int) .................................................................................. 44
7.1.8 Traversing the Scene graph ..................................................................... 44
7.1.9 Pickup Handler ......................................................................................... 46
8. Results .................................................................................................................. 47
9. Summary and Conclusion ..................................................................................... 53
Bibliography .............................................................................................................. 55

6
List of Figures
Figure 1: Use Cases . ............................................................................................... 12
Figure 2: Reference Architecture . ........................................................................... 17
Figure 3: A Scene graph of a virtual world consisting of vegetation, building and vehicle ...................................................................................................................... 24
Figure 4: General Dominion system architecture with test vehicles on upper left corner and simulators in upper right corner . ............................................................ 25
Figure 5: Concept of Data Flow ............................................................................... 28
Figure 6: Multipath propagation effects . .................................................................. 29
Figure 7: Two-Ray ground reflection . ...................................................................... 31
Figure 8: Knife edge Diffraction . .............................................................................. 33
Figure 9: Antenna positions in Vehicle ..................................................................... 34
Figure 10: Beam steerable Antenna in mobile V2V context . ................................... 35
Figure 11: Radiation Patterns ................................................................................... 37
Figure 12: 3D model of urban environment .............................................................. 38
Figure 13: Flowchart for object classification ............................................................ 41
Figure 14: Flowchart for search Node ...................................................................... 43
Figure 15: Hierarchy of 3D model ............................................................................ 44
Figure 16: Console output of direct LOS .................................................................. 48
Figure 17: 3D Scenario of free space ....................................................................... 48
Figure 18: Free space propagation. ......................................................................... 49
Figure 19: Console output of NLOS links with intersection co-ordinates .................. 49
Figure 20: Console output of NLOS links with propagation output parameters ........ 50
Figure 21: Urban canyon effect with orientation angle 0° of antenna ....................... 50
Figure 22: Urban canyon effect with orientation angle 30° of antenna ..................... 51
Figure 23: Urban canyon effect with orientation angle 60°of antenna ...................... 51

7
List of Abbreviations
AU: Application Unit
C2C-CC: Car 2 Car Communication Consortium.
DLR: German Aerospace Center (Deutsches Zentrum für Luft- und Raumfahrt e.V.)
ESP: Electronic Stability Program.
GW: Gateways
HS: Hot spots.
IEEE: Institute of Electrical and Electronics Engineers
LOS: Line of Sight
NLOS: Non Line of Sight
OFDM: Orthogonal Frequency Division Multiplexing.
OSG: Open Scene Graph.
OBUs: Onboard Units.
RSUs: Road Side Units.
V2I: Vehicle-2-Infrastructure.
V2V: Vehicle-2-Vehicle.
VANET: Vehicular Ad-hoc Network.
8
1. Introduction
Today, increasing number of vehicles on the road has resulted in drastic increase in
traffic jams and road accidents. Therefore, for the purpose of safety on the road,
research in Vehicular Ad-hoc Networks (VANET) has gained more importance in the
recent past. The idea of VANET is to form an ad-hoc network with vehicles as the
network nodes. VANET research has progressed mainly in two areas i.e. Vehicle-2-
Infrastructure (V2I) and Vehicle-2-Vehicle (V2V) communication. In V2I
communication, connectivity between vehicle and the roadside infrastructure is
established, whereas in V2V communication, the network is maintained among the
group of vehicles. In this work, focus is on V2V communication [1].
The German Aerospace Center (DLR) is the national research centre of the Federal
Republic of Germany. Its extensive research and development work in aeronautics,
space, energy, transport and safety is integrated into national and international
cooperative ventures. In 16 German locations (headquarter in Cologne), DLR
employs approximately 7,400 employees and has offices in Brussels, Paris, Tokyo
and Washington DC.
The Institute of Transportation Systems in Braunschweig, Germany focuses on the
research activities on increasing safety and efficiency of traffic. This includes for
example the development of assistance and automation systems within the
automotive domain. Three different degrees of assistance are possible: information,
warnings and recommendations are provided to the driver; corrections of lateral and
longitudinal movement of the vehicle or the fully autonomous vehicle control.
Therefore, the acceptance of these systems has to be evaluated. This is done at
DLR by using different types of simulators, test vehicles and stationary test facilities.
For future assistance and automation systems, Vehicle-2-Vehicle and Vehicle-2-
Infrastructure (both together called V2X) communication will be the underlying
technology to develop and deploy a new class of assistance systems, which
exchanges information like recommendations, warnings, and status information that
vehicles could not gather on their own.
9
1.1 Motivation
Due to the dynamic nature of vehicular traffic and the road surroundings, the
propagation characteristics of Vehicle-2-Vehicle communication vary greatly both on
large-scale and small-scale. The large static objects like buildings will have a
profound impact on Vehicle-2-Vehicle communication. The existing geometry-based
models like ray-tracing yield results that are in very good agreement with the real
world. However these models are computationally too expensive to be practically
useful for modelling large-scale networks in VANET simulators.
The solution is to come up with simple, computationally inexpensive communication
model considering the physical effects like reflection and diffraction in Vehicle-2-
Vehicle communication.
1.2 Problem statement
The main goals of this Master Thesis are listed below:
To become familiar with the environment model and current vehicle
representation of the current communication simulation and adapting the
implementation of the DLR simulation environment for driving simulations.
Development of a multi-path propagation without modification of the damping
rate of the air as done in the previous implementation.
Development of a directional antenna simulation.
Modular implementation of the algorithms in communication simulation for a
later on intended integration into the existing simulator.
Test and evaluation of the implemented communication simulation using
appropriate model scenarios.
Discussion of approaches for further development of the communication
simulation with respect to other, more realistic simulation conditions.
10
1.3 Thesis structure
The structure of this Master Thesis is organised in the following chapters.
Chapter 2 describes the objectives of CAR 2 CAR Communication Consortium. It
also describes the safety use cases and system architecture of CAR 2 CAR
communication system.
Chapter 3 describes the communication channels, design principles for dedicated
channel and the short description of channel access mechanism of MAC layer.
Chapter 4 describes the 3D computer graphics engine called “Open Scene Graph”.
The core libraries and Node Kits of Open Scene Graph are also described.
Chapter 5 describes the system architecture “Dominion” developed by DLR-Institute
of Transportation Systems.
Chapter 6 describes the communication simulation and its requirements. The
suitable radio wave propagation models for prototype implementation and the merits
of using directional antenna over Omni-directional antenna are also described.
Chapter 7 describes the implementation algorithm and the functionalities used in the
implementation code.
Chapter 8 describes the results obtained. The critical analysis of the results is
carried out.
Chapter 9 presents the conclusion to this work underlining the goal to be achieved in
this Master Thesis. It also identifies some key enhancements to the existing set-up
for future development.

11
2. Vehicle-to-Vehicle Communication
2.1 Car 2 Car Communication Consortium
The main aim of CAR 2 CAR Communication Consortium (C2C-CC) is to
standardize the protocols and the interfaces of wireless communication between the
vehicles and their environment. It makes different vehicle manufacturers and Tier 1
supplier compatible to each other and enables them to communicate with access
points or the road side units (RSUs) [2].
The objectives of CAR 2 CAR Communication Consortium are:
To create European industry standard worldwide for CAR 2 CAR
communication system.
To enable development of safety applications by specifying, prototyping
and demonstrating the CAR 2 CAR system.
To allow inter vehicle operatibility.
Allocation and promotion of frequency band for CAR 2 CAR
communication.
To promote Harmonization of CAR 2 CAR communication standards
worldwide.
The top level attributes of CAR 2 CAR communication are as follows:
Fast and reliable data transmission between the vehicles and between the
vehicles and the roadside units.
Transmission of infotainment data like traffic information, entertainment
information, as well as warnings.
The CAR 2 CAR communication is based on ad-hoc network and do not
require pre-installed network infrastructure.
CAR 2 CAR communications form a decentralized network that is well suited for
active safety applications. Apart from safety applications, gathered information helps
in traffic management to support traffic flow [2].

12
2.2 Scenarios
To improve driving safety or traffic efficiency and provide information or
entertainment to the driver, V2X communication enables large number of use cases.
This section introduces the use cases and shows how the use cases imply certain
requirements to the system [2].
Fig1: Use Cases
The figure 1 involves many actors for V2X communication. They are as follows:
Driver: the driver benefits from the system by receiving e.g. warning
messages and recommendations about the route.
Road operators: the road operators receive traffic data and control the traffic
efficiently.
Hot spots and internet service providers: it provides attachment of vehicle
communication systems to the point of interests like restaurants, gas stations,
banks etc.
Figure 1: Use Cases [2].

13
2.3 Use Cases
In the following, some V2X use cases are described to demonstrate the advantages
of V2X communication [2].
2.3.1 Safety
The safety use cases are as follows.
Cooperative Forward Collision Warning: Typical causes of rear-end collisions are
driver distraction or sudden braking ahead of a following vehicle. In all regions of the
world, rear-end collisions cause a significant percentage of all accidents. The
Cooperative Forward Collision Warning use case provides assistance to the driver
primarily to avoid rear-end collisions with other vehicles. During normal driving, the
equipped vehicles anonymously share relevant information such as position, speed,
and heading. In order to predict an imminent rear-end collision, each vehicle
monitors the actions of its own driver and the position and behaviour of all other
nearby vehicles. When the vehicle detects a critical proximity, the vehicle warns the
driver via visual, auditory, and/or haptic displays. Thus, the driver will have enough
time to intervene and avoid a crash.
Pre-crash sensing: Here, the assumption is that a crash is unavoidable and will
take place. Similar to the Cooperative Forward Collision Warning use case, this use
case requires that all vehicles periodically share information from neighbouring
vehicles to predict a collision. Once a collision is no longer avoidable (i.e., no
possible way to steer or brake to avoid the crash), the involved vehicles engage in
fast and reliable communication to exchange information such as more detailed
position data and vehicle size. This extra information provided to both vehicles
enables an optimized usage of actuators such as air bags, motorized seat belt pre-
tensioners, and extendable bumpers.

14
Hazardous Location V2V Notification: The Hazardous Location V2V Notification
use case utilizes the network of vehicles to share information that relates to
dangerous locations on the roadway, as for instance slippery roadways or potholes.
Thereby, a major issue is the generation of information about the driving condition at
a specific location. For instance, a vehicle that experiences an actuation of its ESP
(Electronic Stability Program) system, the vehicle retains information about the
location and shares its knowledge with other vehicles in the surrounding area.
Vehicles that receive the information either provide it to the driver or use it to
automatically optimize its chassis or safety systems. The relevant information can be
shared with any number of vehicles over an area, limited only by the current density
of equipped vehicles.
2.3.2 Traffic Efficiency
Traffic Efficiency improves the efficiency of transportation network by providing
information to the drivers or to the owners of transportation network. The more
efficient transportation system will result in lesser delay and lower maintenance cost
for the owners of transportation network. The example use cases for improving the
traffic efficiency are as follows:
Enhanced Route Guidance and Navigation: The Enhanced Route Guidance and
Navigation use case uses the information constantly collected from the roadside
infrastructure regarding the traffic congestion on the roads over the large area. When
an equipped vehicle passes through the roadside unit, the RSU sends the
information about the current traffic conditions throughout the area. The vehicle uses
this information and conveys the driver about the expected delay and the better
routes if available.
The Enhanced Route Guidance and Navigation use case requires:
A roadside infrastructure to collect the information on the traffic conditions,
Ability for the RSU or infrastructure to offer service to the passing vehicles,

15
Green Light Optimal Speed Advisory: The main aim of this use case is to make
the driving smoother and avoid stopping. As the vehicle approaches the intersection,
the vehicle receives the information about the location of intersection and the signal
timing. The vehicle now calculates the optimal speed and notifies it to the driver. If
the vehicle travels at the optimal speed and the signal is green, the driver need not
have to slow or stop the vehicle.
The Green Light Optimal Speed Advisory use case requires:
To transmit information of the intersection position and the timing information
of the traffic signal for each lane and the direction of travel,
Vehicles to trust the information provided by the traffic signal.
Vehicle to Vehicle Merging Assistance: The V2V Merging Assistance use case
allows the merging vehicles to join the traffic flow without disrupting the flow of traffic.
When a vehicle enters the limited access roadways, it signals to the traffic adjacent
to it attempting to merge into the roadways.
The V2V Merging Assistance use case requires:
The ability for all the vehicles to share information with each other over a
distance adequate to perform merging manoeuvre,
Vehicles to trust the information they receive from other vehicles,
Vehicles have to agree on the actions to provide spacing for merging vehicles.
2.3.3 Infotainment and others
These use cases are not directed at safety or traffic efficiency, instead they provide
entertainment information’s. The example use cases are as follows.
Internet Access in Vehicle: The Internet Access in Vehicle use case provides
connection to the internet and allows the use of all kind of IP based services in the
vehicle. The multi-hop route is established and maintained to the roadside
infrastructure, which acts as an internet gateway.
16
The Internet Access in Vehicle use case requires:
The ability for a vehicle to connect to the road side unit who offers the internet
connection,
The ability to multi-hop the messages from vehicle to the roadside unit,
Dynamic route maintenance.
Point of Interest Notification: The Point of Interest Notification use case allows the
local businesses, tourist attractions and other point of interests to advertise their
availability to the nearby vehicles. The roadside unit broadcasts the information like
the location, time required etc.
The Point of Interest Notification use case requires:
The ability for roadside unit to broadcast the information to the surrounding
vehicles,
Vehicles to trust the information generated by the roadside units.
Remote Diagnostics: The remote diagnostics use case allows the service station to
assess the state of vehicle without making physical connection to the vehicle.
The remote Diagnostics use case requires:
The ability for vehicle to identify itself and the authorized requester,
Vehicles to establish the secured connection with the roadside unit.
17
2.4 System Architecture
The reference architecture for CAR 2 CAR communication systems is shown in
Figure 2 below.
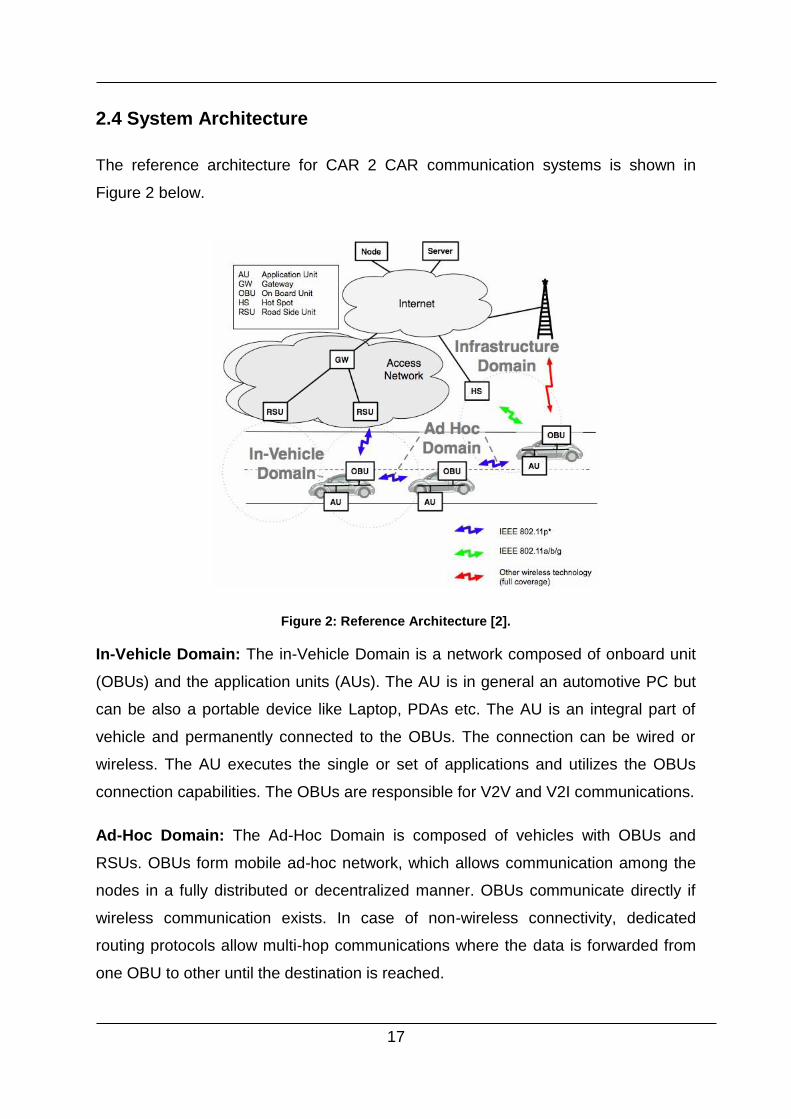
Figure 2: Reference Architecture [2].
In-Vehicle Domain: The in-Vehicle Domain is a network composed of onboard unit
(OBUs) and the application units (AUs). The AU is in general an automotive PC but
can be also a portable device like Laptop, PDAs etc. The AU is an integral part of
vehicle and permanently connected to the OBUs. The connection can be wired or
wireless. The AU executes the single or set of applications and utilizes the OBUs
connection capabilities. The OBUs are responsible for V2V and V2I communications.
Ad-Hoc Domain: The Ad-Hoc Domain is composed of vehicles with OBUs and
RSUs. OBUs form mobile ad-hoc network, which allows communication among the
nodes in a fully distributed or decentralized manner. OBUs communicate directly if
wireless communication exists. In case of non-wireless connectivity, dedicated
routing protocols allow multi-hop communications where the data is forwarded from
one OBU to other until the destination is reached.
18
The RSUs are responsible for executing special applications and by sending,
receiving, or forwarding the data in the Ad-Hoc Domain. A RSU can be attached to
an infrastructure network, which in turn can be connected to the Internet. As a result,
RSUs may allow OBUs to access the infrastructure. In this way, it is possible for the
OBUs to communicate with any hosts on the internet.
Infrastructure Domain: The communication stakeholders such as roadside
administrators, public authorities or public or privately owned hotspots set up the
RSUs for internet access. In case, neither RSUs nor hotspots provide internet
access, OBUs can utilize the cellular radio networks like GSM; UMTS; LTE etc.
19
3. Radio System
3.1 General
In order to enable vehicles and the corresponding infrastructure to exchange data in
adequate manner, the main requirements and the constraints are specified in the
following sections.
For safety applications, the C2C-CC radio system should be able to transmit and
receive the messages stably under expected European Traffic conditions. For
example, the vehicle speed up to 250 km/h having relative speed of 500 km/h should
be supported by C2C-CC radio system [2].
3.2 Application Categories
There are two types of communication channels used by C2C-CC radio system:
Dedicated C2C channels for
1. Network control and critical safety applications,
2. Road safety and traffic efficiency applications,
3. Non-safety related V2I and V2V applications.
Public channels as specified in IEEE 802.11 a/b/g.
Among these two communication channels, only dedicated C2C channels are
mandatory. In addition, C2C communication system may support other radio
systems such as GSM, UMTS, GPRS, WIMAX, and 4G.
The following rules are set based on the above communication channel
classification.
The network control and service announcement for C2C-CC radio system
shall use control channel,
20
Critical applications need robust and reliable communication between V2V
and V2I. Hence protected dedicated channels shall be used,
Infotainment and internet access applications are regarded as add-on
services for C2C-CC radio system.
3.3 Physical Layer
The following subsections are the design principles relevant only for the dedicated
channels [2].
Frequency Band:
10 MHz band from 5.885 to 5.895 GHz for network control and critical safety
applications,
10 MHz band from 5.895 to 5.905 GHz for critical safety applications,
three 10 MHz bands from 5.875 to 5.885 GHz and from 5.905 to 5.925 GHz
for road safety and traffic efficiency applications,
Two 10 MHz bands from 5.855 to 5.875 GHz for non-safety related car to
roadside and car-to-car applications.
Maximum Transmit Power: Maximum Transmit Power allowed for the C2C-CC
radio system is 33 dBm. The communication range to be achieved by the C2C-CC
radio system is 500 to 1,000 m within one-hop in line-of-sight situations.
Transmit Power Control: The C2C-CC radio shall support dynamic transmits power
control with minimum transmits power of 3 dBm.
Data Rates: Data rates of 3, 6, 9, 12, 18, 24, 27 Mb/s are supported. The default
data rate shall be 6 Mb/s.

21
Antenna: Antennas influences significantly the communication range of C2C-CC
radio system. The experimental results show that circular characteristics of antenna
would be the best to achieve the expected performance under the traffic conditions.
The design principles on antenna beams are not yet defined.
Communication Mode and Frequency Modulation: Half-duplex and broadcast
communication modes are adequate to the applications used today. Orthogonal
Frequency Division Multiplexing (OFDM) is the modulation technology used.
3.4 MAC layer
In general, the IEEE 802.11p and IEEE 1609.4 are the technical basis for C2C-CC
radio system and the adopted MAC algorithm is the standard carrier sense multiple
access with collision avoidance [2].

22
4. Open Scene Graph
The Open Scene Graph (OSG) is an open source, cross platform computer graphics
toolkit for the development of high performance graphics applications such as flight
simulators, driving simulators, games, virtual reality and scientific visualization. It
provides an object-oriented framework on top of OpenGL. This frees the developer
from implementing and optimizing low-level graphics calls and provides additional
utilities for rapid development of graphics applications [3].
The OSG project is open sourced and released under a modified GNU Lesser
General Public License (LPGL), named OSGPL. OSG provides significant benefits
like superior performance, high scalability, software and Hardware portability and
open source [3].
At DLR, the powerful OSG is used to simulate different environments for e.g. 3D
urban environment in the driving simulator as well as desktop visualization.
The computing infrastructure of OSG is highly scalable to enable run time access to
the extended functionalities. The standard core libraries and additional modular
libraries called Node Kits have been delivered to meet specific development
requirements.
The core OSG functionality consists of four libraries:
1. The OpenThreads library: This Third party open source library provides a
minimal and complete object oriented thread interface for C++ programmers.
It is used by OSG as main threading model implementation.
2. The osg library: This library provides basic elements used to build a scene
graph with objects like nodes, geometries, rendering states and textures. It
contains few math classes used to implement vector and matrix operations
that are used in two-dimensional and three-dimensional spaces.
3. The osgDB library: This provides plugin mechanism for reading and writing of
2D and 3D files with derivable class containing access to data files and
stream I/O operations.

23
4. The osgUtil library: This library is designed for building the OSG rendering
backend, which traverses the scene tree, performs culling in each frame, and
finally converts the OSG scene into series of OpenGL calls.
A Node Kit is an add-on library that extends the core Open Scene Graph nodes,
draw able or state attributes to add specialist features such as particle system and
text. Node Kits can be directly linked and used by user’s applications, or used
indirectly when loading a scene graph from disk, which references the Node Kit. The
extra Node Kits and utilities available with current OSG distributions are [3]:
osgAnimation library
osgFX library
osgGA library
osgManipulator library
osgParticle library
osgShadow library
osgSim library
osgTerrain library
osgText library
osgViewer library
osgVolume library
osgWidget library
osgQt library
All OSG core libraries and Node Kits have same prefix “osg”.
The figure 3 below shows a simple scene graph of an exemplary traffic situation.
The scene graph tree starts with a top-level root node osg::Root. Below that, a
geometry-group node osg::Geode and osg::Drawable geometry organized by a
general of Groups node osg::Group. The root node and the Group node can have
multiple children. At the lower end of the scene graph to find the geometry node
containing the objects in the scene.

24
The Group nodes are used to organize the geometry in a scene. The scene graph
offers various types of nodes and group nodes that offer a wide range of functions.
One example is a transformation node osg::Transform with that help you can rotate,
move, or scale the underlying inserted objects [3].
Figure 3: A Scene graph of a virtual world consisting of vegetation, building and vehicle
25
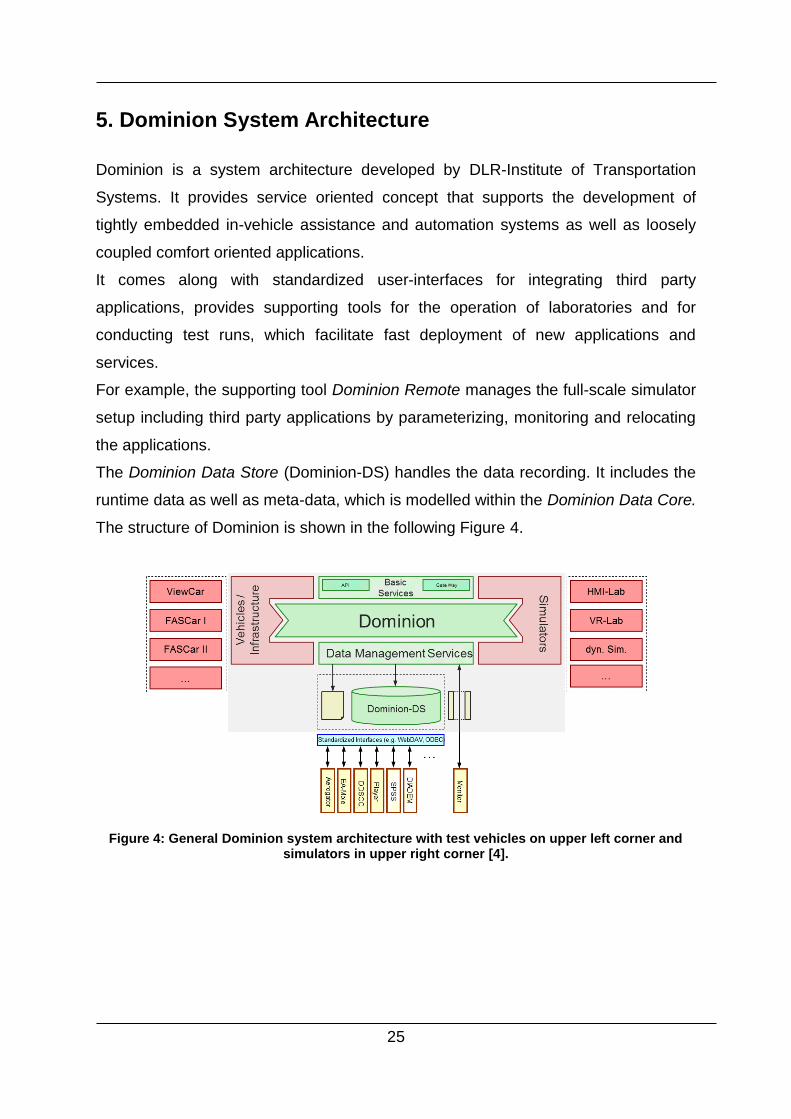
5. Dominion System Architecture
Dominion is a system architecture developed by DLR-Institute of Transportation
Systems. It provides service oriented concept that supports the development of
tightly embedded in-vehicle assistance and automation systems as well as loosely
coupled comfort oriented applications.
It comes along with standardized user-interfaces for integrating third party
applications, provides supporting tools for the operation of laboratories and for
conducting test runs, which facilitate fast deployment of new applications and
services.
For example, the supporting tool Dominion Remote manages the full-scale simulator
setup including third party applications by parameterizing, monitoring and relocating
the applications.
The Dominion Data Store (Dominion-DS) handles the data recording. It includes the
runtime data as well as meta-data, which is modelled within the Dominion Data Core.
The structure of Dominion is shown in the following Figure 4.
Figure 4: General Dominion system architecture with test vehicles on upper left corner and simulators in upper right corner [4].

26
Dominion is mainly used in two types of test facilities in particular in simulators and in
test vehicles. Therefore, a transfer of software prototype and special hardware
interfaces causes minimal migration effort. Additionally to that Dominion is running
also in DLR’s RSUs.
In Conclusion, the Dominion system architecture enables greater flexibility for set-up
of simulator experiments [4].

27
6. Communication Simulation and its Requirements
Simulations play a pre-dominant role in the field of engineering research. Therefore,
communication simulators are developed for the investigation of radio transmissions
in all facets. The most widely used communication simulators are ns-2, ns-3,
OMNETT++ and OPNET. These simulators are able to simulate large networks and
for that, they use various stochastic communication models to compute faster than
real time. These simulators can also be used with physical models for radio
transmission simulation, if there is a small area of interest. However, the
computational effort will have a major impact on simulation run time. In most
scenarios, the information about the environment is missing because either it is not
possible to integrate such type of data into communication simulator or it would
influence the computational time [4].
Since environment has a major impact on V2V or V2X communication, it is therefore
necessary to couple with driving simulators to achieve results in real time. To tackle
the issues of simulating communication in real time considering the environment, a
simplified communication model has to be developed. Additionally the simulation has
to fulfil some requirements with respect to driving simulation. The most important
requirements are as follows:
Run Time: The simulator has to provide results in real time. The interest is to
simulate the messages from different senders to mostly one receiver. It is not
necessary to simulate the whole traffic.
Environment: For driving simulator scenarios, it is necessary to consider the
surrounding environment for instance trees, buildings and other vehicles.
Reproducibility: The simulator has to provide same results for several test
runs. The results should not be random.
Communication results: The communication simulator should produce only
three types of message outputs i.e. “Receiving a message” when
transmission was successful, “No message” when transmission failed and the
third message is “Noticed” state. The third message indicates that the signal
power received is above the threshold power and is therefore unable to
decrypt the message [4].
28
6.1 Approach
To meet these requirements, the idea was to come up with simple communication
model considering the physical effects like reflection and diffraction in urban
environment of V2V communication. This communication model is an enhancement
to the existing communication model with free space propagation between the
sender and receiver. Contrary to this, highly realistic models like ray-tracing models
yield results that are in very good agreement with the real world.
However, these models are computationally very expensive as the network grows
and most often bounded to specific location for which detailed geographic database
is required. In our approach, obstacles like buildings are taken into account, as it has
greater effect on communication. The objects like vehicles, trees are ignored in our
case but can be integrated in the algorithm in the same way like buildings
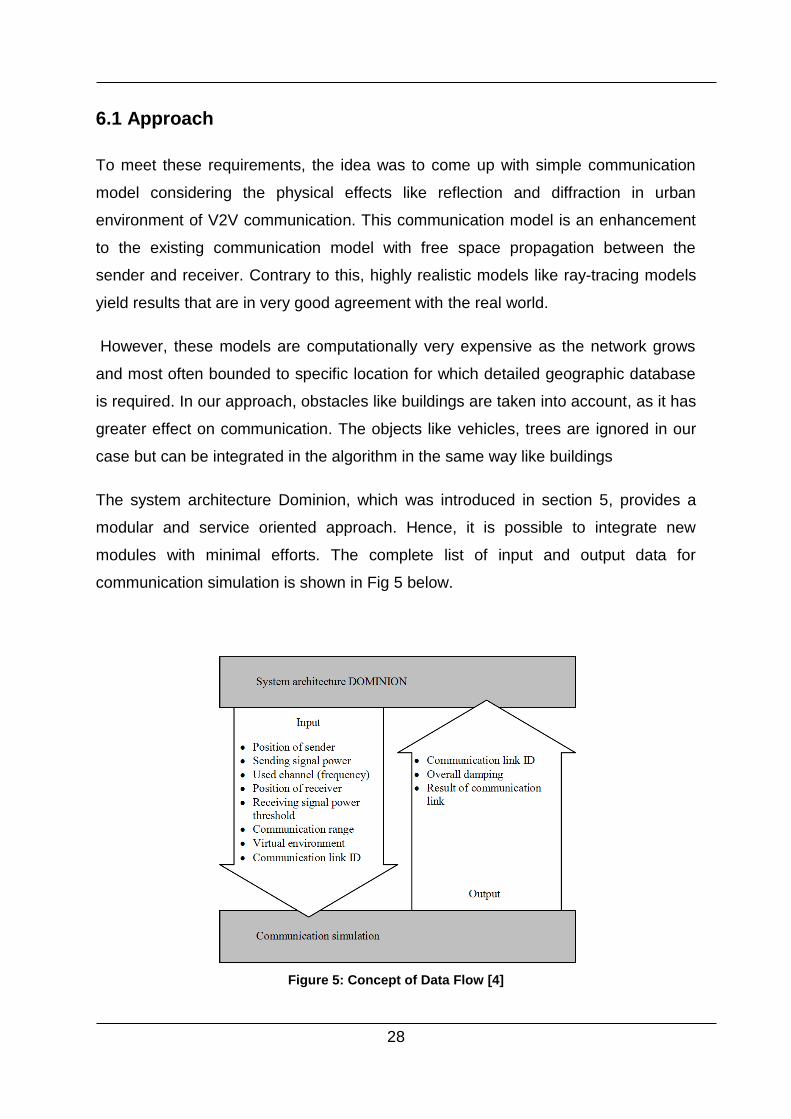
The system architecture Dominion, which was introduced in section 5, provides a
modular and service oriented approach. Hence, it is possible to integrate new
modules with minimal efforts. The complete list of input and output data for
communication simulation is shown in Fig 5 below.
Figure 5: Concept of Data Flow [4]

29
For analysing the virtual world, the computer graphics library Open Scene Graph is
used. The detailed description of Open Scene Graph is given in section 4. The
detailed Implementation algorithm is explained in section 7.
6.1.1 Propagation Models
The implementation of communication model with physical effects like reflection,
diffraction in V2V communication makes use of various radio wave propagation
models like two-ray ground reflection model and single knife-edge diffraction model.
This subsection describes these propagation models in details.
Radio waves encounter many obstacles in the urban environment while propagating
from sender to receiver. This results in multipath propagation effects at the receiver.
Multipath propagation is a phenomenon that results in radio signals reaching the
receiver antenna by two or more paths.
The causes of multipath effects include reflections, diffraction and scattering from the
obstacles like buildings, vegetation or vehicles in the environment. The figure 6
below shows the multipath propagation effects in the environment.
Figure 6: Multipath propagation effects [9].
The propagation of radio waves results in both large scale and small scale
propagation effects. Large-scale propagation effects describe variations of received
signal strength over relatively long distances in which path loss and shadowing are
mainly considered. Small-scale propagation effects describe variations in received
30
signal strength over small distances, in which multipath delay and Doppler shift are
mainly considered.
The Concept of path loss plays a vital role in describing the attenuation of signal
power. In VANET simulation, to calculate received power path loss in several radio
wave propagation models are considered [5].
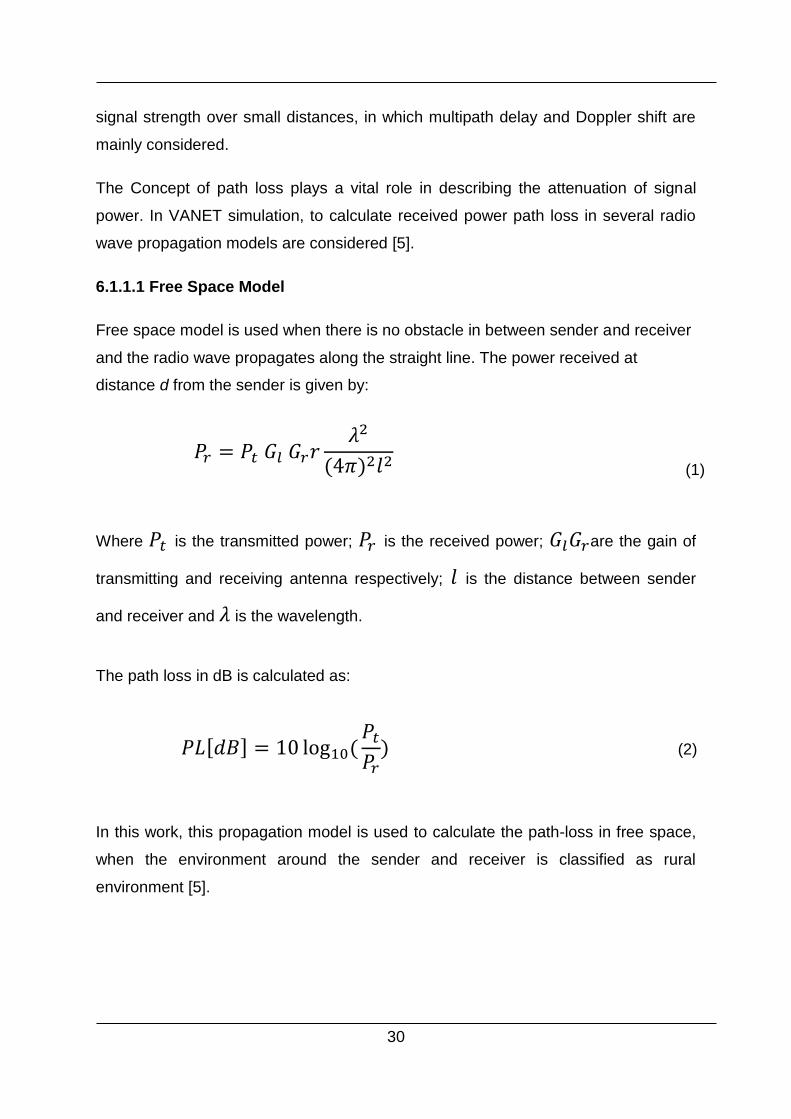
6.1.1.1 Free Space Model
Free space model is used when there is no obstacle in between sender and receiver
and the radio wave propagates along the straight line. The power received at
distance d from the sender is given by:
𝑃𝑟 = 𝑃𝑡 𝐺𝑙 𝐺𝑟𝑟𝜆2
(4𝜋)2𝑙2
(1)
Where 𝑃𝑡 is the transmitted power; 𝑃𝑟 is the received power; 𝐺𝑙𝐺𝑟are the gain of
transmitting and receiving antenna respectively; 𝑙 is the distance between sender
and receiver and 𝜆 is the wavelength.
The path loss in dB is calculated as:
𝑃𝐿[𝑑𝐵] = 10 log10(𝑃𝑡
𝑃𝑟 ) (2)
In this work, this propagation model is used to calculate the path-loss in free space,
when the environment around the sender and receiver is classified as rural
environment [5].

31
6.1.1.2 Two Ray Ground Model
The received signal in two-ray ground model consists of two components: the signal
propagating through free space and the signal reflected of the ground. The figure 7
below shows the two-ray ground model.
Figure 7: Two-Ray ground reflection [6].
The received power at a distance d from sender is given by:
𝑃𝑟 = 𝑃𝑡(𝜆/4𝛱)2 |√𝐺𝑙
𝑙+
𝑅 √𝐺𝑟 𝑒−𝑗𝛿𝜓
𝑥 + 𝑥′|
2
(3)
Where 𝑃𝑡,𝑃𝑟 are the power transmitted and power received by antenna; 𝐺𝑙𝐺𝑟 are
the gain of transmitting and receiving antenna respectively; 𝑙 is the length of direct
path; 𝑥 + 𝑥′ is the length of reflection path; 𝛿𝜓 is the phase difference between
two received signal components and is given by:
𝛿𝜓 =2Π(𝑥 + 𝑥′ − 𝑙)
𝜆
(4)

32
The Two-ray ground reflection model holds well when the reflecting surfaces are
buildings as in the case of our communication model. Hence, the reflection co-
efficient 𝑅 of buildings are used instead of ground surface in our implementation.
The reflections can be calculated from surrounding vehicles as well. Since all
buildings are significantly taller than any vehicle, any building can reflect the signal
for any communicating pair.
For the vehicle to be a reflector it has to be taller than both communicating vehicle’s
antennas, otherwise the reflected ray does not exist. Furthermore, tall vehicles are
more likely to block reflections coming off the buildings, whereas short vehicles are
less likely to do so, since their height is often shorter than height of the line between
communicating antennas discounted for the 60% of first Fresnel zone. In this work,
only buildings as the reflecting surfaces are assumed [5].
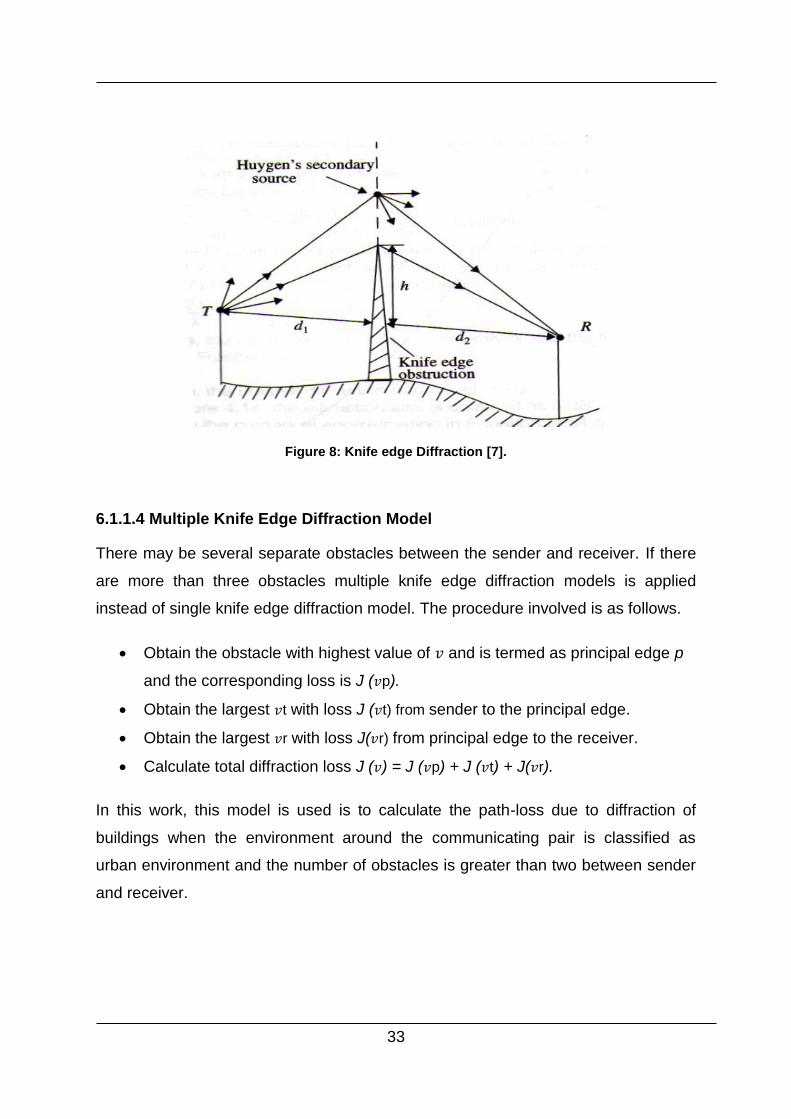
6.1.1.3 Knife Edge Diffraction Model
When there is an obstacle between sender and receiver, the shape of an obstacle
can be viewed as knife-edge for calculating the loss due to diffraction. The Fresnel-
Kirchhoff diffraction parameter 𝑣 is defined as
𝑣 = ℎ √(2
𝜆) (
1
𝑑1+
1
𝑑2) (5)
Where ℎ is the height of the top of the obstacle above a straight line joining two ends
of the path 𝑑1 and 𝑑2 are the distances of the two ends of the path from the top of
obstacle. The approximation of loss caused by diffraction can be expressed as a
function of 𝑣.
𝐽(𝑣) = 6.9 + 20 log10 𝑠𝑞𝑟𝑡((𝑣 − 0.1)2 + 1) + 𝑣 − 0.1 (6)
33
Figure 8: Knife edge Diffraction [7].
6.1.1.4 Multiple Knife Edge Diffraction Model
There may be several separate obstacles between the sender and receiver. If there
are more than three obstacles multiple knife edge diffraction models is applied
instead of single knife edge diffraction model. The procedure involved is as follows.
Obtain the obstacle with highest value of 𝑣 and is termed as principal edge p
and the corresponding loss is J (𝑣p).
Obtain the largest 𝑣t with loss J (𝑣t) from sender to the principal edge.
Obtain the largest 𝑣r with loss J(𝑣r) from principal edge to the receiver.
Calculate total diffraction loss J (𝑣) = J (𝑣p) + J (𝑣t) + J(𝑣r).
In this work, this model is used is to calculate the path-loss due to diffraction of
buildings when the environment around the communicating pair is classified as
urban environment and the number of obstacles is greater than two between sender
and receiver.

34
6.1.2 Antenna
The effectiveness of V2X applications require low latency and high reliability. In order
to obtain high reliability it is necessary to have a stable radio link. In cellular
communications the base station is at an elevated position and has a sectorized
coverage around it. This is not the same case in V2V communication. Both the
transmit (Tx) and receive (Rx) antennas are at the same height relatively close to the
ground level.
In V2V communications, the position of antenna has a greater impact on the radio
link performance. Therefore the experiences gained from the cellular
communications cannot be directly applied to V2V communications.
The figure 9 shows the posibilities of antenna positions in a vehicle.
Figure 9: Antenna positions in Vehicle
Position 1 is roof top antenna at the rear end of the vehicle. Position 2 is the bumper
antenna mounted near the registration plate. Position 3 is windscreen antenna and
position 4 is left mirror antenna. In our scenario, position 1 (roof top antenna) is
assumed.
In this thesis, directional antenna is assumed in contrast to the Omni-directional
antenna. By focusing energy in one direction directional antenna can get a better
transmit and receive gain in target direction compared to the Omni-directional
counter parts.

35
Directional antenna also provides better immunity against co-channel interference
and multi-path fading. This improves the signal-to-noise ratio (SNR) and better range
as well as better physical layer data rates. However, when directional antenna is
used in mobile V2V scenario, the direction must be steered appropriately to maintain
best link quality. The Figure 10 below shows the Beam steerable antenna in case of
mobile V2V communication [1].
Figure 10: Beam steerable Antenna in mobile V2V context [1].
For this work, directional antenna with fixed sender and receiver position is
considered. The look-up table is created with damping rates corresponding to
different elevation angles of directional antenna. The look-up table can be created for
any antenna. The model PS14-5500-451 of Mobile Mark antenna solutions is used
as reference for creating the look-up table in this thesis. This antenna model can be
1http://www.mobilemark.com/shop/category.asp?catid=687;Dateaccessed:
05/09/2014
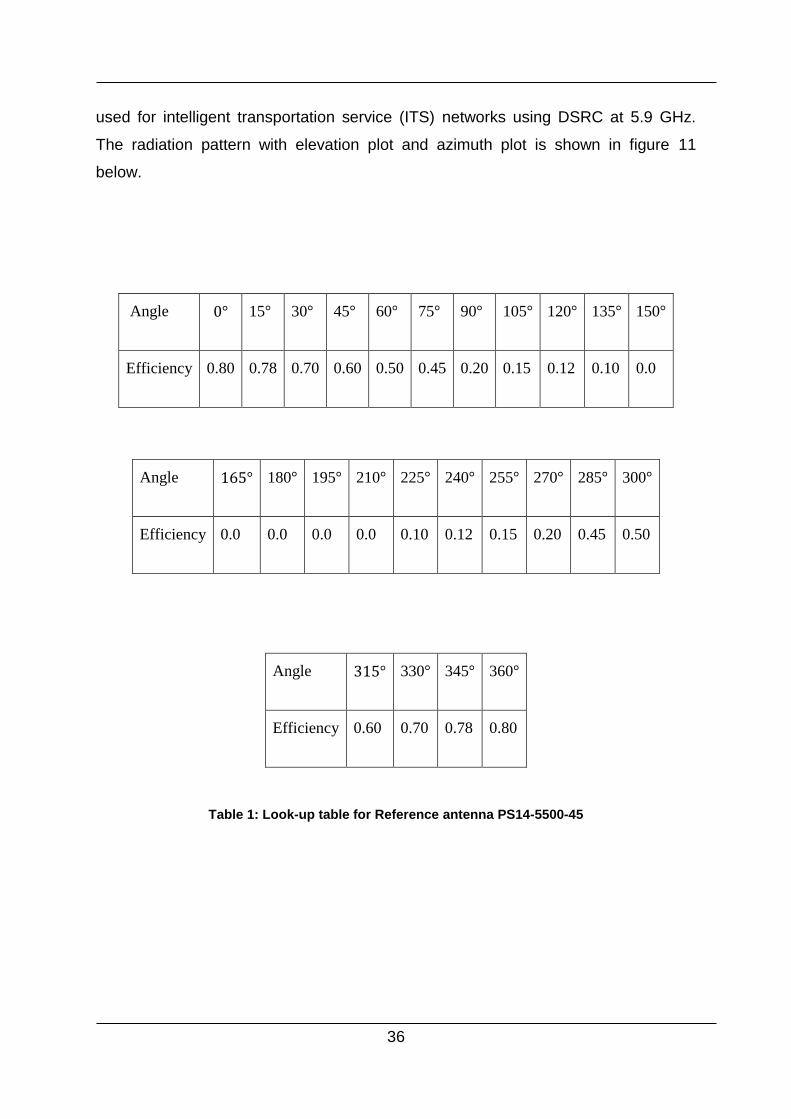
36
used for intelligent transportation service (ITS) networks using DSRC at 5.9 GHz.
The radiation pattern with elevation plot and azimuth plot is shown in figure 11
below.
Angle 0° 15° 30° 45° 60° 75° 90° 105° 120° 135° 150°
Efficiency 0.80 0.78 0.70 0.60 0.50 0.45 0.20 0.15 0.12 0.10 0.0
Angle 165° 180° 195° 210° 225° 240° 255° 270° 285° 300°
Efficiency 0.0 0.0 0.0 0.0 0.10 0.12 0.15 0.20 0.45 0.50
Angle 315° 330° 345° 360°
Efficiency 0.60 0.70 0.78 0.80
Table 1: Look-up table for Reference antenna PS14-5500-45

37
Figure 11: Radiation Patterns

38
7. Implementation
In this chapter, the implementation of communication model with physical effects of
V2V communication in the urban environment is considered. Here the data
structures and the functions used in the simulation are described.
The scenery of the urban environment or virtual world is loaded in the simulation. For
analysing the virtual world, the computer graphics library Open Scene Graph is used.
The use of 3D computer graphics provides an easy solution for investigating the
virtual environment.
The 3D virtual world consists of objects like buildings, vehicles and vegetation. The
figure 12 below shows the sample 3D urban environment used in the driving
simulation. The 3D model is provided in OSG’s own file format *.ive.
Figure 12: 3D model of urban environment

39
7.1 Algorithm
The new communication model considering the physical effects like reflection,
diffraction in V2V communication has to be developed. The main idea behind this
enhanced communication model is to show the effect of reflection, diffraction in
urban environment and possibility to decrypt the sender’s message over a large
communication range as compared to the communication model in free space. The
reason behind the larger communication range is because of the multipath
propagation in the urban environment.
1. The sender and receiver are positioned in the virtual environment. In our
simulation already existing 3D model, i.e. “marker.3DS” as placeholder is used as
sender and receiver. Later on in the driving simulation Dominion will provide that
information and 3D models of vehicles will be placed there.
2. The intersection node kit (line of sight as intersecting element) is used to
determine all the objects between the sender and receiver coordinates. With the help
of metadata like object names or identifier, it is possible to classify the objects
between sender and receiver.
3. To classify the environment as urban or rural environment, helping points are used
for each sender and receiver. In this work additional point’s sender 2, senders 3 are
used as helping points for sender 1. Similarly receiver 2 and receiver 3 is used as
helping points for receiver 1.The helping points are placed to the right and left of the
sender 1 and receiver 1 respectively.
4. The helping points are moved one meter each time to check if there are any
intersections between the sender and the corresponding receiver. If the intersections
are found and the intersecting obstacles are buildings then the surrounding
environment is classified as urban environment. The process is repeated for
maximum of 20 meters to cover broad streets, too.

40
5. Based on the type of environment around the sender and receiver different radio
wave propagation models as described in section 6 are considered. The propagation
models are different for both the urban and rural environments.
6. Directional Antenna is assumed on the rooftop of the sender and receiver. The
look up table for the antenna is created with different damping factor values for
various angles.
7. The power received at the receiver is calculated. The received power threshold is
set to -95 dBm. Later on this value will be provided by Dominion.
8. Decision is made based on the received power and threshold power set. If the
received power is above the maximum power level, the message transmitted can be
decrypted and is considered as transmission success.
The following paragraph gives a more detailed description about the implementation
of the algorithm steps.
7.1.1 Function main()
In the main function int main(), the osgDB::readNodeFile() is used to load geometric
models and add them to a scene. There are 45 plugin in the core Open Scene Graph
distribution and these provides the support for reading and writing both native and
third-party file formats. The Open Scene Graph plugin library osgDB automatically
loads plugin on demand, using the extension of the file being loaded/saved to
determine which plugin to load. In this work two different files are read i.e. “demo-
tile.ive” and “marker.3DS”.The “demo-tile.ive” loads 3D virtual environment and
“marker.3DS” are used to indicate communicating pairs and the helping points in the
visualisation.
The position attitude transform osg::PositionAttitudeTranform() is a public member
function of OSG class and is used to set the position and attitude of sender and
receiver. The position of sender and receiver is a 3D vector coordinates declared as
OSG::Vec3 sender, where the variable sender is a three-dimensional coordinate
represented as (x, y, z). Quaternion class OSG::Quat() is used to represent an
orientation in 3D space.
41
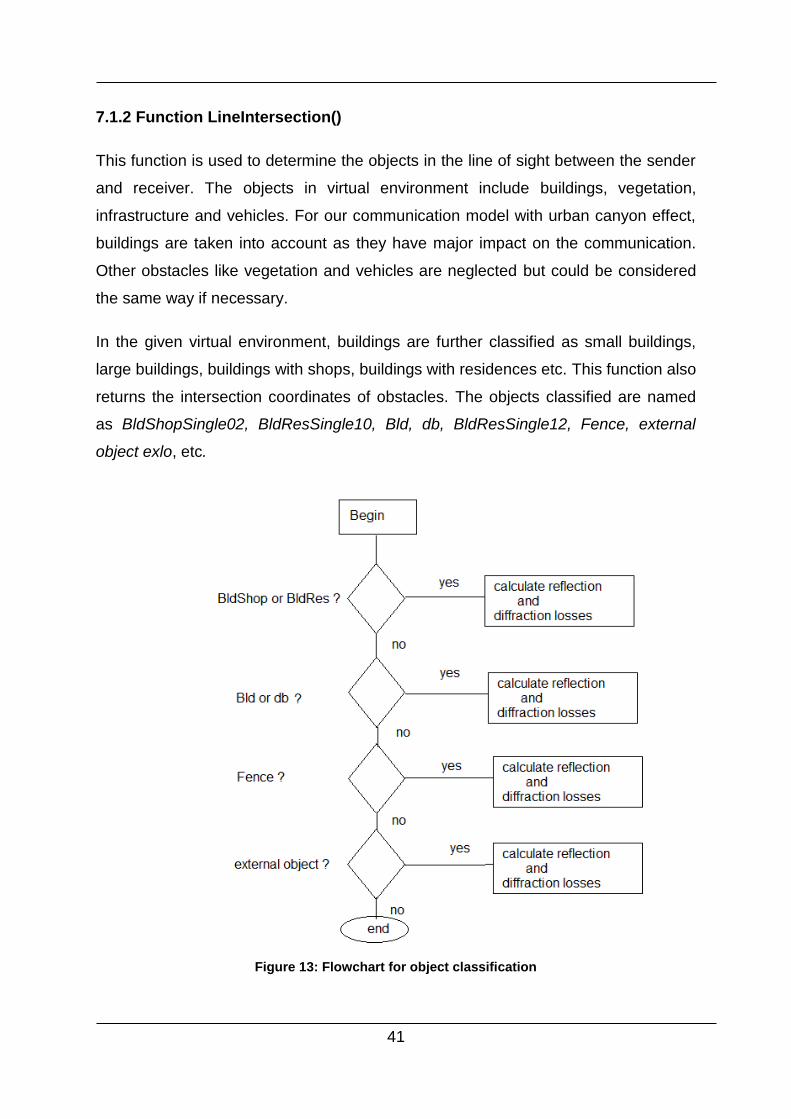
7.1.2 Function LineIntersection()
This function is used to determine the objects in the line of sight between the sender
and receiver. The objects in virtual environment include buildings, vegetation,
infrastructure and vehicles. For our communication model with urban canyon effect,
buildings are taken into account as they have major impact on the communication.
Other obstacles like vegetation and vehicles are neglected but could be considered
the same way if necessary.
In the given virtual environment, buildings are further classified as small buildings,
large buildings, buildings with shops, buildings with residences etc. This function also
returns the intersection coordinates of obstacles. The objects classified are named
as BldShopSingle02, BldResSingle10, Bld, db, BldResSingle12, Fence, external
object exlo, etc.
Figure 13: Flowchart for object classification

42
Based on the type of intersection between the sender and receiver, the surrounding
environment is classified as urban or rural area. If the intersecting objects between
sender and receiver are buildings, then the environment is considered as urban
environment, otherwise the environment is rural.The reflection and diffraction losses
are calculated for the urban environment in order to calculate the power received
due to urban-canyon effect at the receiver.
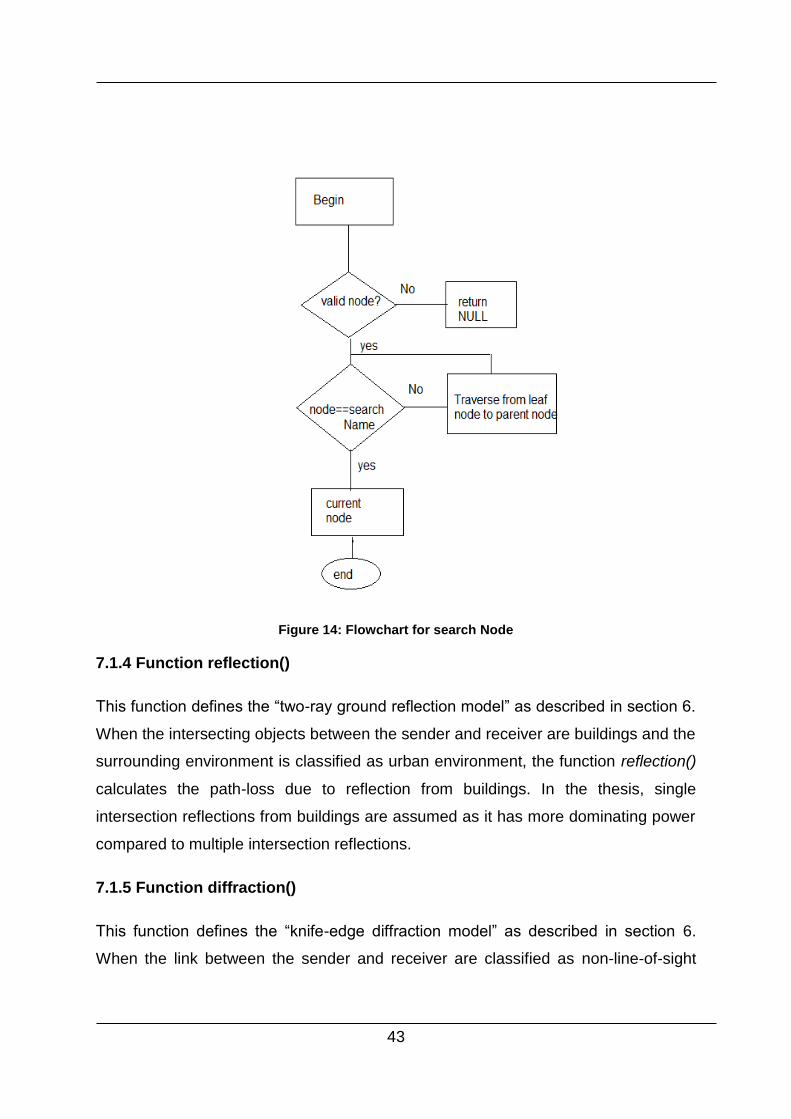
7.1.3 Function FindNamedNode()
Model files can contain number of different nodes that allows users to update or
articulate parts of the model. The function FindNamedNode() is a recursive function
that accepts two arguments: a string to search for and a current node from which to
start a search. The function checks if there is a valid (non-NULL) node, if there is a
null node the function returns NULL. If there is a valid node, the function checks
whether the node is same as search name passed as a function argument, if yes the
function returns the current node. If the node is valid node but not the one looking for
then traverse through the hierarchy from bottom to top i.e. from leaf node to parent
node. If there is a match return the current node otherwise the function returns
NULL.
43
Figure 14: Flowchart for search Node
7.1.4 Function reflection()
This function defines the “two-ray ground reflection model” as described in section 6.
When the intersecting objects between the sender and receiver are buildings and the
surrounding environment is classified as urban environment, the function reflection()
calculates the path-loss due to reflection from buildings. In the thesis, single
intersection reflections from buildings are assumed as it has more dominating power
compared to multiple intersection reflections.
7.1.5 Function diffraction()
This function defines the “knife-edge diffraction model” as described in section 6.
When the link between the sender and receiver are classified as non-line-of-sight
44
(NLOS) and the surrounding environment is urban environment, the function
diffraction() calculates the path-loss due to diffraction from buildings.
7.1.6 Function totalReceivedPower()
This function calculates the power received due to reflection and diffraction from the
surrounding urban environment. The received power is measured in dBm.
7.1.7 Function lookup(int)
This function introduces the directional antenna on the roof top of sender and
receiver. The look up table is created for different orientation angles as described in
table 1 of section 6.The function lookup(int) makes a function call for look up table
with orientation angle as its integer argument. The look up table returns the
maximum power efficiency based on the orientation angle.
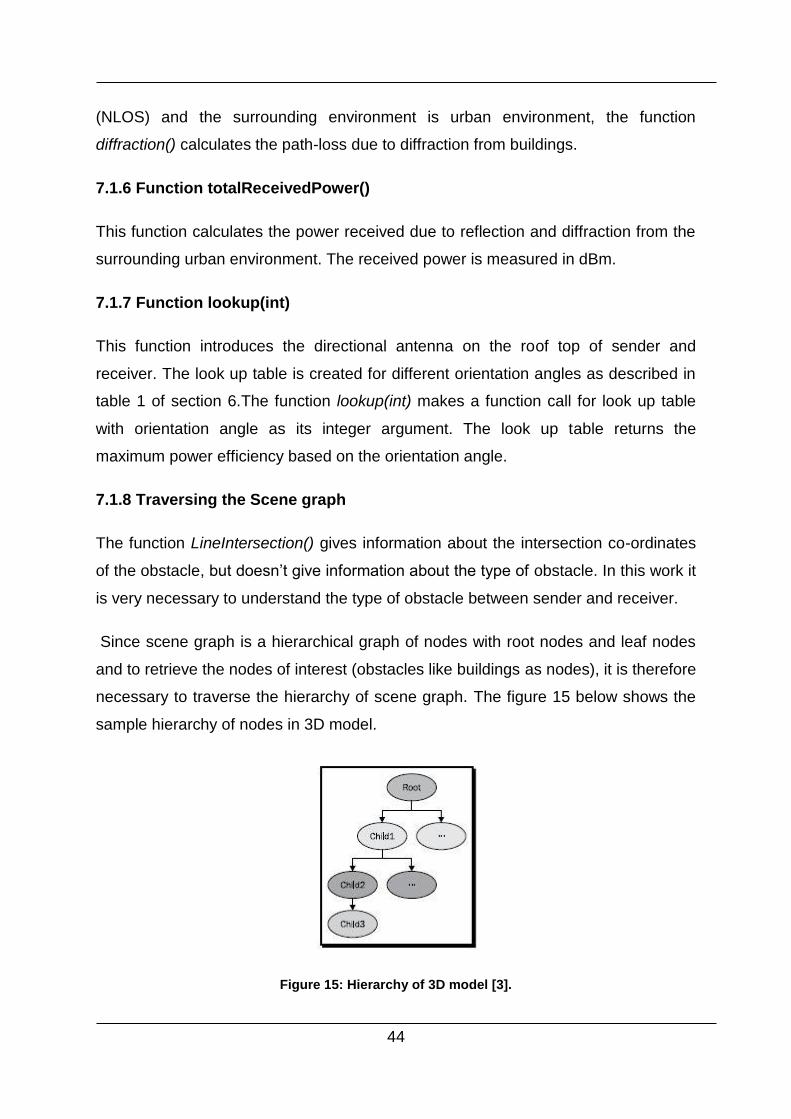
7.1.8 Traversing the Scene graph
The function LineIntersection() gives information about the intersection co-ordinates
of the obstacle, but doesn’t give information about the type of obstacle. In this work it
is very necessary to understand the type of obstacle between sender and receiver.
Since scene graph is a hierarchical graph of nodes with root nodes and leaf nodes
and to retrieve the nodes of interest (obstacles like buildings as nodes), it is therefore
necessary to traverse the hierarchy of scene graph. The figure 15 below shows the
sample hierarchy of nodes in 3D model.
Figure 15: Hierarchy of 3D model [3].

45
The osg::Group type represents the group nodes or root nodes of an OSG Scene
graph. It can have any number of child nodes including osg::Geode leaf nodes and
other osg::Group nodes.
In the 3D model used in this work, the obstacles of interest like buildings are the
group nodes and the intersecting co-ordinates returned by function LineIntersection()
points towards the geometrical nodes or leaf node of the group. To understand the
type of obstacle, it was necessary to traverse the hierarchy from leaf node to group
node. Therefore the function FindNamedNode() is used.
In function FindNamedNode(), the method getNumParents() is used. This method is
a built-in function which returns the total number of parents. If the node has single
parent, it returns 1.A node without parent node will return 0.The method getName()
is then used to return the name of a parent node, which is the type of obstacle in this
case.
The above method is one way of traversing the scene graph. The visitor pattern
method is alternative way that can be used to implement the traversals.

46
7.1.9 Pickup Handler
The Pickup handler functionality allows users to the mouse over portion of rendered
scene and clicks a button. There are three main steps required to perform these
kinds of actions.
Firstly, event handlers are used to receive mouse events. For example, a mouse
push event comes along with X and Y positions of the cursor, which are the most
important factors of picking operation.
Secondly, it is necessary to determine which part of scene graph is under the mouse
cursor. This can be done by using intersection tools provided by osg::Util library. The
result is set of intersections that include the picked Drawable, the intersection point
and so on.
Finally, Intersection results are used to achieve goals of picking up objects [3].
In this work reference position co-ordinates are necessary to set the position of
sender, receiver and also its helping points. The pickup handler provides the position
co-ordinates. Similarly position of other objects can be obtained using pickup
handler.

47
8. Results
In this section the results of the prototype communication model are analysed based
on the power received at the receiver due to urban canyon effects. The comparison
of urban canyon effects with free space propagation is also performed.
In order to verify the proper operation of prototype, a common scenario was
designed to simulate variety of applications. Through the diverse landscape the need
for suitable simulation environment for free space and urban canyon effects should
be employed.
The figure 16 below shows the console output under the condition of free space
propagation or direct line of sight. Here the distance between the sender and
receiver is maintained at 200 m. The notification “Intersection not found” indicates
that there are no obstacles between sender and receiver as a result of which the
notification “No urban canyon effect “is displayed. The console output illustrates the
positions of sender 1 and receiver 1 and the helping point’s sender 2, receiver 2 and
sender 3, receiver 3.The 3D scene for the above scenario is shown in Figure 17.
The graph in figure 18 illustrates the free space propagation wherein the received
power decreases with increase in distance between sender and receiver. For a free
space propagation or direct line-of-sight (LOS) situation, the reflection from ground
surface is neglected.
The antenna parameters considered for the simulation are as follows.
Gain of transmitting antenna: 2
Gain of receiving antenna: 2
Power of transmitting antenna : 20 dBm
Height of transmitting antenna: 1.5 m
Height of receiving antenna : 1.7 m

48
Figure 16: Console output of direct LOS
Figure 17: 3D Scenario of free space

49
Figure 18: Free space propagation.
When a NLOS links or an intersection exists between the sender and receiver, the
console output of the simulation is divided into three parts. First, all the intersections
are calculated in Cartesian co-ordinates which were detected between the sender
and receiver. Second, the type of intersections is determined and lastly all the output
parameters of the propagation models described in section 6. The figure 19 below
shows the console output of the NLOS links.
Figure 19: Console output of NLOS links with intersection co-ordinates
50
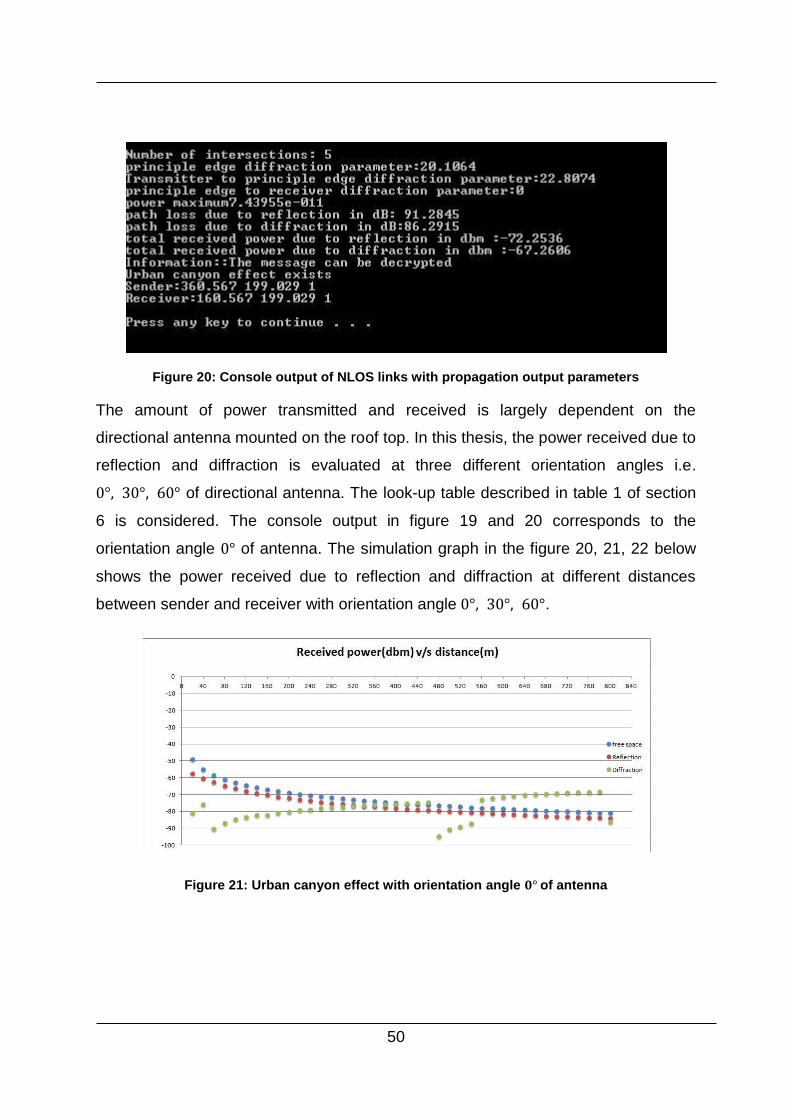
Figure 20: Console output of NLOS links with propagation output parameters
The amount of power transmitted and received is largely dependent on the
directional antenna mounted on the roof top. In this thesis, the power received due to
reflection and diffraction is evaluated at three different orientation angles i.e.
0°, 30°, 60° of directional antenna. The look-up table described in table 1 of section
6 is considered. The console output in figure 19 and 20 corresponds to the
orientation angle 0° of antenna. The simulation graph in the figure 20, 21, 22 below
shows the power received due to reflection and diffraction at different distances
between sender and receiver with orientation angle 0°, 30°, 60°.
Figure 21: Urban canyon effect with orientation angle 𝟎° of antenna
51
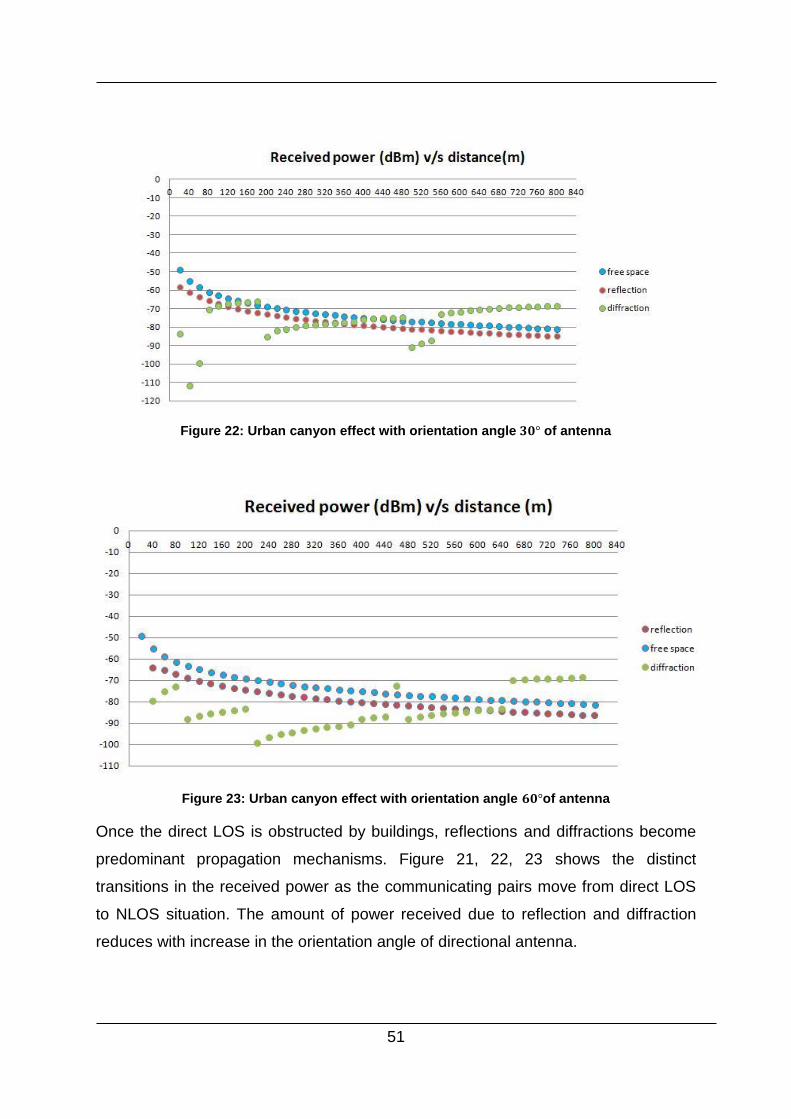
Figure 22: Urban canyon effect with orientation angle 𝟑𝟎° of antenna
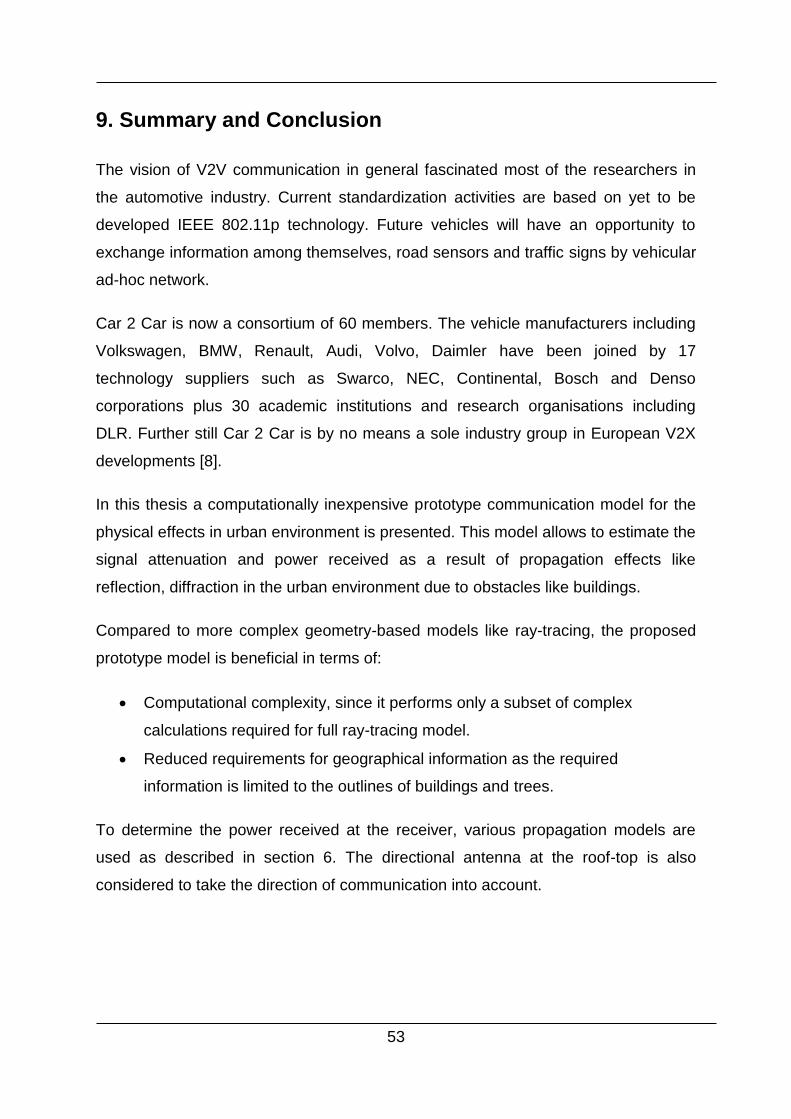
Figure 23: Urban canyon effect with orientation angle 𝟔𝟎°of antenna
Once the direct LOS is obstructed by buildings, reflections and diffractions become
predominant propagation mechanisms. Figure 21, 22, 23 shows the distinct
transitions in the received power as the communicating pairs move from direct LOS
to NLOS situation. The amount of power received due to reflection and diffraction
reduces with increase in the orientation angle of directional antenna.

52
The average difference between power received due to free space and power
received by reflection is around -3 to -6 dBm. The same is not true for diffraction
effects, as the power received depends on the height of obstacle and its distance
between the sender and receiver.
For 5.9 GHz carrier frequency of IEEE 802.11p, wavelength of 0.051 m, the receiver
power threshold is set to -95 dBm. From the above graphs, it is evident that
maximum possible messages can be decrypted with receiver threshold power of -95
dBm. Therefore, a notification “message can be decrypted” is displayed on the
console output.
53
9. Summary and Conclusion
The vision of V2V communication in general fascinated most of the researchers in
the automotive industry. Current standardization activities are based on yet to be
developed IEEE 802.11p technology. Future vehicles will have an opportunity to
exchange information among themselves, road sensors and traffic signs by vehicular
ad-hoc network.
Car 2 Car is now a consortium of 60 members. The vehicle manufacturers including
Volkswagen, BMW, Renault, Audi, Volvo, Daimler have been joined by 17
technology suppliers such as Swarco, NEC, Continental, Bosch and Denso
corporations plus 30 academic institutions and research organisations including
DLR. Further still Car 2 Car is by no means a sole industry group in European V2X
developments [8].
In this thesis a computationally inexpensive prototype communication model for the
physical effects in urban environment is presented. This model allows to estimate the
signal attenuation and power received as a result of propagation effects like
reflection, diffraction in the urban environment due to obstacles like buildings.
Compared to more complex geometry-based models like ray-tracing, the proposed
prototype model is beneficial in terms of:
Computational complexity, since it performs only a subset of complex
calculations required for full ray-tracing model.
Reduced requirements for geographical information as the required
information is limited to the outlines of buildings and trees.
To determine the power received at the receiver, various propagation models are
used as described in section 6. The directional antenna at the roof-top is also
considered to take the direction of communication into account.
54
The implementation of this prototype communication model is done using C++ Visual
Studio IDE and open source graphics engine Open Scene Graph. The results and
the analysis are carried out in section 8.
As an enhancement to the current work, it is possible to evaluate the urban canyon
effects with sender and receiver in motion wherein the environment around the
sender and receiver changes with every timestamp. The effect of vehicles as an
obstacle between the sender and receiver can also be modelled as the vehicles are
the major source of diffraction. Since the application prototypes are developed in
modular form, it is possible to integrate easily the future applications and expansion
of existing simulation.

55
Bibliography
[1] Anand Prabhu Subramanium,Vishnu Navda,Pralhlad Deshpande, “Measurement study
of Inter-Vehicular communication using steerable Beam Directional Antenna,”
[Online]. Available: http://research.microsoft.com/en-us/groups/mns/v2v-vanet2008.pdf.
[Accessed 15 09 2014].
[2] “CAR 2 CAR Communication Consortium Manifesto,” [Online].
Available: http://elib.dlr.de/48380/1/C2C-CC_manifesto_v1.1.pdf. [Accessed 12 10 2014].
[3] W. Rui, Open Scene Graph 3.0:Beginner's Guide, December 2010.
[4] Andreas Richter,Miguel Angel Paz Lazo,Klaus Jaschke, “A simplified V2X Communication
Model for Driving Simulators considering environmental influences”.
[5] Liming Zhang,Feng Chen, “A Channel model for VANET simulation systems,”
[Online]. Available: file:///C:/Users/hp%20world/Downloads/2cbfb1ff-d2de-4f9a-a520
-db5a39e0989e.pdf. [Accessed 18 07 2014].
[6] [Online]. Available: http://en.wikipedia.org/wiki/Two-ray_ground-reflection_model.
[7] “Fresnel Zones and Diffractions,” 2013. [Online]. Available: http://www.ece.ubc.ca/~edc/
7860/lectures/lec3.pdf. [Accessed 05 12 2014].

56
[8] “ITS Internal -Car 2 Car a step closer,” [Online]. Available: http://www.itsinternational.com/
categories/location-based-systems/features/car-to-car-communications-a-step-closer/.
[Accessed 12 01 2015].
[9] “SkyDSP,”[Online].Available: http://www.google.de/imgres?imgurl=http://www.skydsp.com/publications/4thyrthesis/
Image6.gif&imgrefurl=http://www.skydsp.com/publications/4thyrthesis/
chapter1.htm&h=204&w=495&tbnid=r_sHiB90lGYiYM:&zoom=1&tbnh=120&tbnw=291&usg
=__baMAyKCaoW6YRsywINeqpCRab90. [Accessed 2014].


