Dee Dewitt! 1997-2015, Veridian Financial, Inc. dba Summit Venture Strategies
ALL RIGHTS RESERVED
Facility Company
SAMPLE COMPANY Financial Projections
Assisted Living

Company
Projected Income Statement, Balance Sheet & Cash Flow
2003 2004 2005 2006 2007 2008 2009 2010 2011 2012Gross Revenues
Beds at Rate 1 $3,822,140 $5,878,340 $10,495,680 $12,856,320 $15,552,000 $21,672,000 $28,903,680 $34,894,080 $42,456,960 $48,677,760Beds at Rate 2 $997,080 $1,651,440 $2,926,680 $5,178,240 $6,220,800 $8,668,800 $11,487,360 $13,868,160 $16,773,120 $19,230,720Beds at Rate 3 $1,139,520 $2,516,480 $4,440,480 $5,892,480 $7,050,240 $9,824,640 $12,969,600 $15,657,600 $18,869,760 $21,634,560
Total Revenues $5,958,740 $10,046,260 $17,862,840 $23,927,040 $28,823,040 $40,165,440 $53,360,640 $64,419,840 $78,099,840 $89,543,040
Cost of Goods Sold (COGS) $3,325,215 $5,606,215 $9,968,179 $13,352,245 $16,084,409 $22,413,922 $29,777,372 $35,948,848 $43,582,835 $49,968,598Gross Profit $2,633,525 $4,440,045 $7,894,661 $10,574,795 $12,738,631 $17,751,518 $23,583,268 $28,470,992 $34,517,005 $39,574,442
Other Operating Costs
Corporate G&A Expenses $668,764 $1,144,000 $1,395,370 $1,877,697 $2,167,096 $2,469,322 $2,785,601 $3,117,280 $3,465,838 $3,782,898Net Operating Income $1,964,761 $3,296,045 $6,499,291 $8,697,098 $10,571,535 $15,282,196 $20,797,668 $25,353,713 $31,051,167 $35,791,544
% Operating Margin 33% 33% 36% 36% 37% 38% 39% 39% 40% 40%
Mortgage/Bond Interest $1,785,321 $3,575,000 $3,575,000 $5,135,900 $5,135,900 $6,696,800 $6,696,800 $8,257,700 $8,257,700 $9,818,600Depreciation & Amortization $1,837,064 $3,162,091 $4,673,315 $4,857,428 $5,292,622 $4,888,393 $5,549,683 $5,319,890 $5,757,693 $5,779,917Interest Income $2,544,159 $1,898,463 $1,567,019 $1,089,538 $612,058 $612,058 $612,058 $612,058 $612,058 $612,058Mgmt Developer Fees $950,000 $1,000,000 $0 $1,000,000 $1,000,000 $1,000,000 $1,000,000 $1,000,000 $1,000,000 $1,000,000
Earnings Before Taxes $1,836,535 ($542,583) ($182,006) $793,308 $1,755,071 $5,309,061 $10,163,243 $13,388,181 $18,647,832 $21,805,084Cumulative Income Tax Shield $0 $0 $0 $0 $0 $0 $0 $0 $0 $0Income Tax Expense (0%) - LLC $0 $0 $0 $0 $0 $0 $0 $0 $0 $0
Net Income (Loss) $1,836,535 ($542,583) ($182,006) $793,308 $1,755,071 $5,309,061 $10,163,243 $13,388,181 $18,647,832 $21,805,084Percent Net Margin 31% -5% -1% 3% 6% 13% 19% 21% 24% 24%
10-Yr. Income Statement Projections
2003 2004 2005 2006 2007 2008 2009 2010 2011 2012
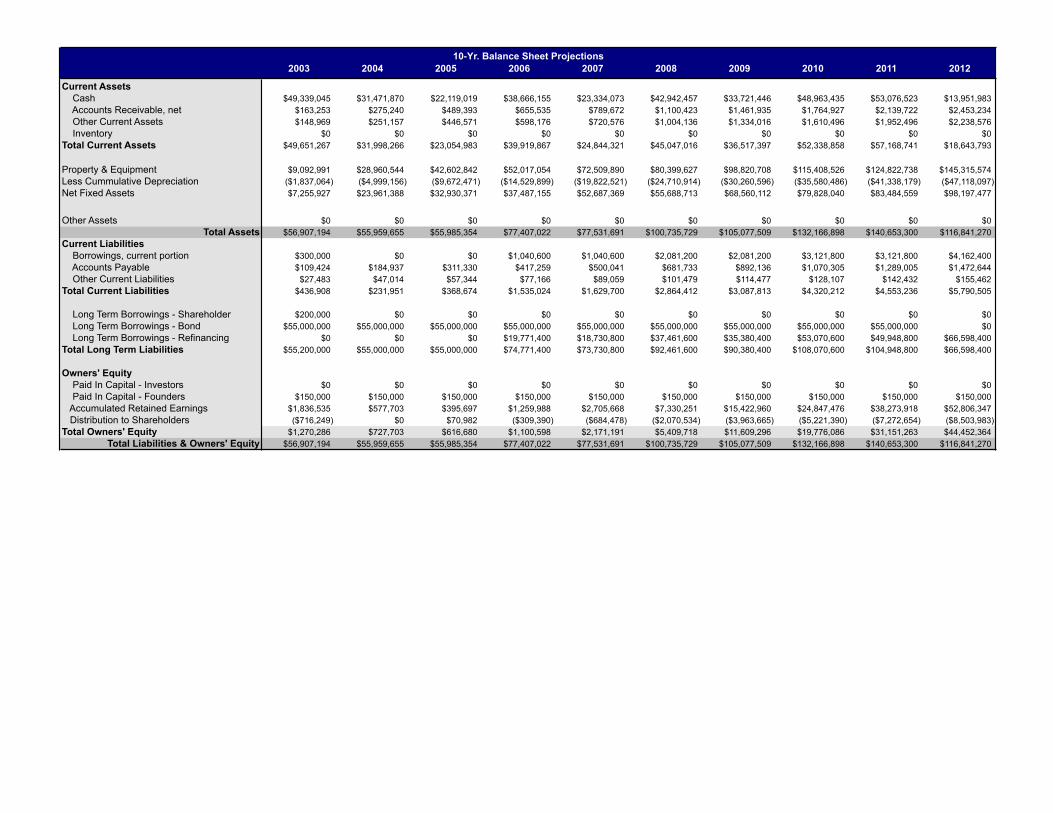
Current Assets Cash $49,339,045 $31,471,870 $22,119,019 $38,666,155 $23,334,073 $42,942,457 $33,721,446 $48,963,435 $53,076,523 $13,951,983 Accounts Receivable, net $163,253 $275,240 $489,393 $655,535 $789,672 $1,100,423 $1,461,935 $1,764,927 $2,139,722 $2,453,234 Other Current Assets $148,969 $251,157 $446,571 $598,176 $720,576 $1,004,136 $1,334,016 $1,610,496 $1,952,496 $2,238,576 Inventory $0 $0 $0 $0 $0 $0 $0 $0 $0 $0
Total Current Assets $49,651,267 $31,998,266 $23,054,983 $39,919,867 $24,844,321 $45,047,016 $36,517,397 $52,338,858 $57,168,741 $18,643,793
Property & Equipment $9,092,991 $28,960,544 $42,602,842 $52,017,054 $72,509,890 $80,399,627 $98,820,708 $115,408,526 $124,822,738 $145,315,574Less Cummulative Depreciation ($1,837,064) ($4,999,156) ($9,672,471) ($14,529,899) ($19,822,521) ($24,710,914) ($30,260,596) ($35,580,486) ($41,338,179) ($47,118,097)Net Fixed Assets $7,255,927 $23,961,388 $32,930,371 $37,487,155 $52,687,369 $55,688,713 $68,560,112 $79,828,040 $83,484,559 $98,197,477
Other Assets $0 $0 $0 $0 $0 $0 $0 $0 $0 $0Total Assets $56,907,194 $55,959,655 $55,985,354 $77,407,022 $77,531,691 $100,735,729 $105,077,509 $132,166,898 $140,653,300 $116,841,270
Current Liabilities Borrowings, current portion $300,000 $0 $0 $1,040,600 $1,040,600 $2,081,200 $2,081,200 $3,121,800 $3,121,800 $4,162,400 Accounts Payable $109,424 $184,937 $311,330 $417,259 $500,041 $681,733 $892,136 $1,070,305 $1,289,005 $1,472,644 Other Current Liabilities $27,483 $47,014 $57,344 $77,166 $89,059 $101,479 $114,477 $128,107 $142,432 $155,462
Total Current Liabilities $436,908 $231,951 $368,674 $1,535,024 $1,629,700 $2,864,412 $3,087,813 $4,320,212 $4,553,236 $5,790,505
Long Term Borrowings - Shareholder $200,000 $0 $0 $0 $0 $0 $0 $0 $0 $0 Long Term Borrowings - Bond $55,000,000 $55,000,000 $55,000,000 $55,000,000 $55,000,000 $55,000,000 $55,000,000 $55,000,000 $55,000,000 $0 Long Term Borrowings - Refinancing $0 $0 $0 $19,771,400 $18,730,800 $37,461,600 $35,380,400 $53,070,600 $49,948,800 $66,598,400
Total Long Term Liabilities $55,200,000 $55,000,000 $55,000,000 $74,771,400 $73,730,800 $92,461,600 $90,380,400 $108,070,600 $104,948,800 $66,598,400
Owners' Equity Paid In Capital - Investors $0 $0 $0 $0 $0 $0 $0 $0 $0 $0 Paid In Capital - Founders $150,000 $150,000 $150,000 $150,000 $150,000 $150,000 $150,000 $150,000 $150,000 $150,000
Accumulated Retained Earnings $1,836,535 $577,703 $395,697 $1,259,988 $2,705,668 $7,330,251 $15,422,960 $24,847,476 $38,273,918 $52,806,347 Distribution to Shareholders ($716,249) $0 $70,982 ($309,390) ($684,478) ($2,070,534) ($3,963,665) ($5,221,390) ($7,272,654) ($8,503,983)Total Owners' Equity $1,270,286 $727,703 $616,680 $1,100,598 $2,171,191 $5,409,718 $11,609,296 $19,776,086 $31,151,263 $44,452,364
Total Liabilities & Owners' Equity $56,907,194 $55,959,655 $55,985,354 $77,407,022 $77,531,691 $100,735,729 $105,077,509 $132,166,898 $140,653,300 $116,841,270$0 $0 $0 $0 $0 $0 $0 $0 $0 $0
10-Yr. Balance Sheet Projections

2003 2004 2005 2006 2007 2008 2009 2010 2011 2012Cash Flow From Operations Net Income/Loss $1,836,535 ($542,583) ($182,006) $793,308 $1,755,071 $5,309,061 $10,163,243 $13,388,181 $18,647,832 $21,805,084 Plus Depreciation Charges $1,837,064 $3,162,091 $4,673,315 $4,857,428 $5,292,622 $4,888,393 $5,549,683 $5,319,890 $5,757,693 $5,779,917 Less Distribution to Shareholders ($716,249) $0 $70,982 ($309,390) ($684,478) ($2,070,534) ($3,963,665) ($5,221,390) ($7,272,654) ($8,503,983) Minus Change in Accounts Receivable ($163,253) ($111,987) ($214,153) ($166,142) ($134,137) ($310,751) ($361,512) ($302,992) ($374,795) ($313,512) Minus Change in Other Current Assets ($148,969) ($102,188) ($195,415) ($151,605) ($122,400) ($283,560) ($329,880) ($276,480) ($342,000) ($286,080) Minus Change in Inventory $0 $0 $0 $0 $0 $0 $0 $0 $0 $0 Plus Change in Current Liabilities $436,908 ($204,956) $136,723 $125,750 ($945,924) ($846,488) ($1,857,799) ($1,889,401) ($2,888,776) ($2,925,131)
Net Cash Flow from Operations $3,082,036 $2,200,377 $4,289,447 $5,149,348 $5,160,753 $6,686,121 $9,200,070 $11,017,807 $13,527,300 $15,556,295
Cash Flows from Investing Activities Purchases - Capital Expenditures ($9,092,991) ($19,867,553) ($13,642,298) ($9,414,212) ($20,492,836) ($7,889,737) ($18,421,081) ($16,587,818) ($9,414,212) ($20,492,836)
Net Cash Flow from Investing ($9,092,991) ($19,867,553) ($13,642,298) ($9,414,212) ($20,492,836) ($7,889,737) ($18,421,081) ($16,587,818) ($9,414,212) ($20,492,836)
Cash Flows from Financing Activities Cash Received from Borrowing $55,300,000 ($200,000) $0 $20,812,000 $0 $20,812,000 $0 $20,812,000 $0 ($34,188,000) Cash Received from Investors $0 $0 $0 $0 $0 $0 $0 $0 $0 $0
Net Cash Flow from Financing $55,300,000 ($200,000) $0 $20,812,000 $0 $20,812,000 $0 $20,812,000 $0 ($34,188,000)
Net Cash Flow $49,289,045 ($17,867,176) ($9,352,851) $16,547,136 ($15,332,083) $19,608,384 ($9,221,011) $15,241,989 $4,113,088 ($39,124,541)Cash Available at beginning of period $50,000 $49,339,045 $31,471,870 $22,119,019 $38,666,155 $23,334,073 $42,942,457 $33,721,446 $48,963,435 $53,076,523
Net Cumulative Cash Flow $49,339,045 $31,471,870 $22,119,019 $38,666,155 $23,334,073 $42,942,457 $33,721,446 $48,963,435 $53,076,523 $13,951,983
2003 2004 2005 2006 2007 2008 2009 2010 2011 2012
Quick Ratio 112.928 135.683 59.996 25.189 14.318 14.992 10.921 11.334 11.657 2.409 Current Ratio 113.643 137.953 62.535 26.006 15.245 15.726 11.826 12.115 12.556 3.220
Gross Margin 0.442 0.442 0.442 0.442 0.442 0.442 0.442 0.442 0.442 0.442 Net Margin 0.308 -0.054 -0.010 0.033 0.061 0.132 0.190 0.208 0.239 0.244
10-Yr. Cash Flow Statement Projections
Performance Ratios

$80,194,835
Based on a discount rate of: 25% for risk$49,339,045 $49,289,045 -$17,867,176 -$9,352,851 $16,547,136 -$15,332,083 $19,608,384 -$9,221,011 $15,241,989 $4,113,088
$36,966,784 (13,400,382) (7,014,638) 12,410,352 (11,499,062) 14,706,288 (6,915,758) 11,431,492 3,084,816
-$10,050,286 (5,260,978) 9,307,764 (8,624,296) 11,029,716 (5,186,819) 8,573,619 2,313,612
-$3,945,734 6,980,823 (6,468,222) 8,272,287 (3,890,114) 6,430,214 1,735,209
$5,235,617 (4,851,167) 6,204,215 (2,917,586) 4,822,661 1,301,407
-$3,638,375 4,653,161 (2,188,189) 4,822,661 976,055
$3,489,871 (1,641,142) 4,822,661 732,041
-$1,230,856 4,822,661 732,041
$3,616,996 549,031
$411,773
Company
Valuation Based on PV of Future Cash Flows =
PRESENT VALUE VALUATION ANALYSIS
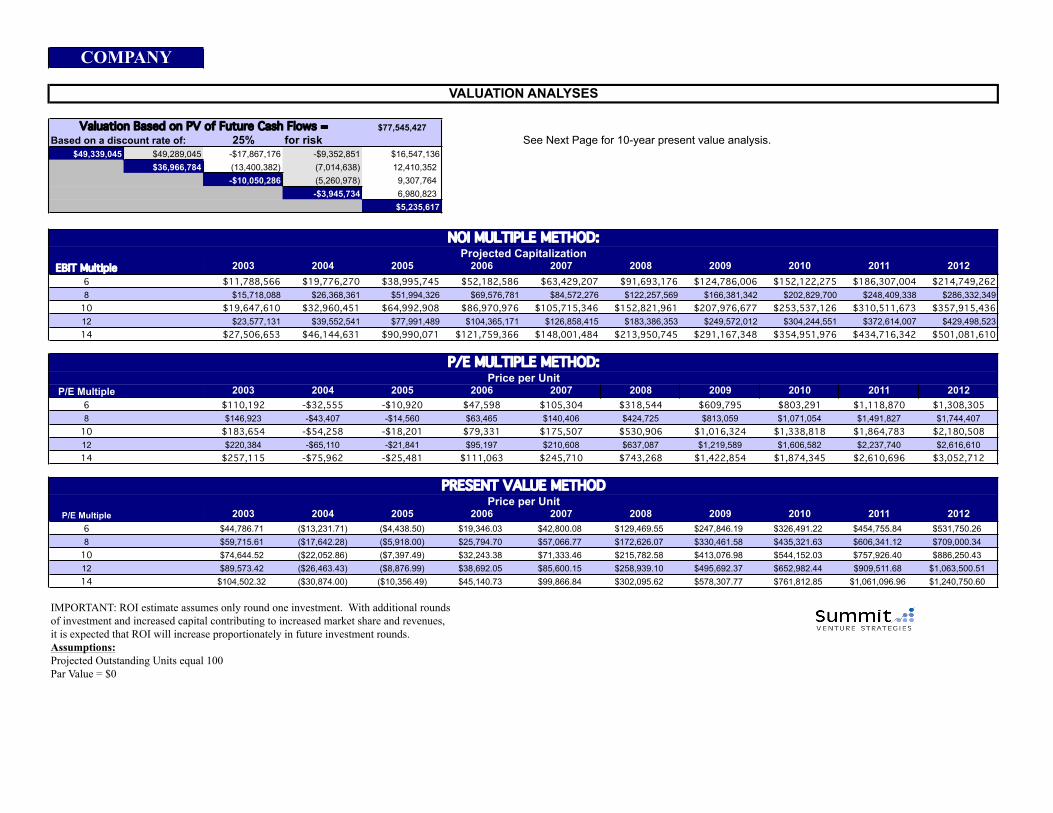
$77,545,427Based on a discount rate of: 25% for risk See Next Page for 10-year present value analysis.
$49,339,045 $49,289,045 -$17,867,176 -$9,352,851 $16,547,136$36,966,784 (13,400,382) (7,014,638) 12,410,352
-$10,050,286 (5,260,978) 9,307,764 -$3,945,734 6,980,823
$5,235,617
EBIT Multiple 2003 2004 2005 2006 2007 2008 2009 2010 2011 20126 $11,788,566 $19,776,270 $38,995,745 $52,182,586 $63,429,207 $91,693,176 $124,786,006 $152,122,275 $186,307,004 $214,749,2628 $15,718,088 $26,368,361 $51,994,326 $69,576,781 $84,572,276 $122,257,569 $166,381,342 $202,829,700 $248,409,338 $286,332,349
10 $19,647,610 $32,960,451 $64,992,908 $86,970,976 $105,715,346 $152,821,961 $207,976,677 $253,537,126 $310,511,673 $357,915,43612 $23,577,131 $39,552,541 $77,991,489 $104,365,171 $126,858,415 $183,386,353 $249,572,012 $304,244,551 $372,614,007 $429,498,52314 $27,506,653 $46,144,631 $90,990,071 $121,759,366 $148,001,484 $213,950,745 $291,167,348 $354,951,976 $434,716,342 $501,081,610
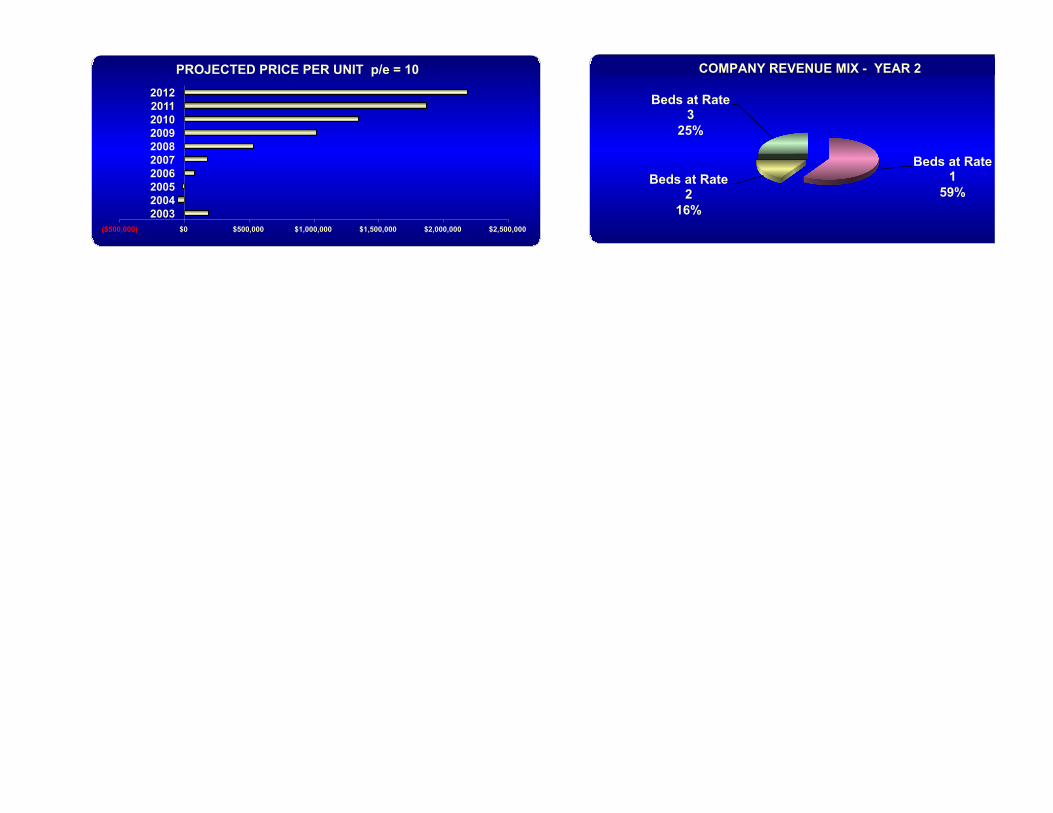
P/E Multiple 2003 2004 2005 2006 2007 2008 2009 2010 2011 20126 $110,192 -$32,555 -$10,920 $47,598 $105,304 $318,544 $609,795 $803,291 $1,118,870 $1,308,3058 $146,923 -$43,407 -$14,560 $63,465 $140,406 $424,725 $813,059 $1,071,054 $1,491,827 $1,744,407
10 $183,654 -$54,258 -$18,201 $79,331 $175,507 $530,906 $1,016,324 $1,338,818 $1,864,783 $2,180,50812 $220,384 -$65,110 -$21,841 $95,197 $210,608 $637,087 $1,219,589 $1,606,582 $2,237,740 $2,616,61014 $257,115 -$75,962 -$25,481 $111,063 $245,710 $743,268 $1,422,854 $1,874,345 $2,610,696 $3,052,712
P/E Multiple 2003 2004 2005 2006 2007 2008 2009 2010 2011 20126 $44,786.71 ($13,231.71) ($4,438.50) $19,346.03 $42,800.08 $129,469.55 $247,846.19 $326,491.22 $454,755.84 $531,750.268 $59,715.61 ($17,642.28) ($5,918.00) $25,794.70 $57,066.77 $172,626.07 $330,461.58 $435,321.63 $606,341.12 $709,000.34
10 $74,644.52 ($22,052.86) ($7,397.49) $32,243.38 $71,333.46 $215,782.58 $413,076.98 $544,152.03 $757,926.40 $886,250.4312 $89,573.42 ($26,463.43) ($8,876.99) $38,692.05 $85,600.15 $258,939.10 $495,692.37 $652,982.44 $909,511.68 $1,063,500.5114 $104,502.32 ($30,874.00) ($10,356.49) $45,140.73 $99,866.84 $302,095.62 $578,307.77 $761,812.85 $1,061,096.96 $1,240,750.60
IMPORTANT: ROI estimate assumes only round one investment. With additional roundsof investment and increased capital contributing to increased market share and revenues,it is expected that ROI will increase proportionately in future investment rounds.Assumptions:Projected Outstanding Units equal 100Par Value = $0
Price per Unit
VALUATION ANALYSES
COMPANY
Valuation Based on PV of Future Cash Flows =
PRESENT VALUE METHOD
NOI MULTIPLE METHOD:Projected Capitalization
P/E MULTIPLE METHOD:Price per Unit

Company
2003 Jan Feb Mar Apr May June July Aug Sept Oct Nov Dec
Number of Beds 164 169 169 174 174 196 218 218 218 218 218 238Total 164 169 169 174 174 196 218 218 218 218 218 238
2004 Jan Feb Mar Apr May June July Aug Sept Oct Nov Dec
Number of Beds 244 238 264 304 334 334 334 364 364 364 394 394Total 244 238 264 304 334 334 334 364 364 364 394 394
2005 Jan Feb Mar Apr May June July Aug Sept Oct Nov Dec
Number of Beds 424 464 464 464 544 544 544 624 624 624 704 704Total 424 464 464 464 544 544 544 624 624 624 704 704
2006 Jan Feb Mar Apr May June July Aug Sept Oct Nov Dec
Number of Beds 744 744 744 744 744 744 744 744 744 744 744 744Total 744 744 744 744 744 744 744 744 744 744 744 744
2007 Jan Feb Mar Apr May June July Aug Sept Oct Nov Dec
Number of Beds 744 744 744 824 824 824 904 904 904 984 984 984Total 744 744 744 824 824 824 904 904 904 984 984 984
2008 Jan Feb Mar Apr May June July Aug Sept Oct Nov Dec
Number of Beds 1,084 1,084 1,084 1,164 1,164 1,164 1,244 1,244 1,244 1,324 1,324 1,324Total 1,084 1,084 1,084 1,164 1,164 1,164 1,244 1,244 1,244 1,324 1,324 1,324
2009 Jan Feb Mar Apr May June July Aug Sept Oct Nov Dec
Number of Beds 1,424 1,424 1,424 1,504 1,504 1,504 1,584 1,584 1,584 1,664 1,664 1,664Total 1,424 1,424 1,424 1,504 1,504 1,504 1,584 1,584 1,584 1,664 1,664 1,664
2010 Jan Feb Mar Apr May June July Aug Sept Oct Nov Dec
Number of Beds 1,744 1,744 1,744 1,824 1,824 1,824 1,904 1,904 1,904 1,984 1,984 1,984Total 1,744 1,744 1,744 1,824 1,824 1,824 1,904 1,904 1,904 1,984 1,984 1,984
2011 Jan Feb Mar Apr May June July Aug Sept Oct Nov Dec
Number of Beds 2,064 2,064 2,064 2,144 2,144 2,144 2,224 2,224 2,224 2,304 2,304 2,304Total 2,064 2,064 2,064 2,144 2,144 2,144 2,224 2,224 2,224 2,304 2,304 2,304
2012 Jan Feb Mar Apr May June July Aug Sept Oct Nov Dec
Number of Beds 2,384 2,384 2,384 2,464 2,464 2,464 2,544 2,544 2,544 2,624 2,624 2,624Total 2,384 2,384 2,384 2,464 2,464 2,464 2,544 2,544 2,544 2,624 2,624 2,624
TOTALS Year 1 Year 2 Year 3 Year 4 Year 5 Year 6 Year 7 Year 9 Year 9 Year 10Number of Beds 238 394 704 744 984 1,324 1,664 1,984 2,304 2,624
Total 2,374 3,932 6,728 8,928 10,368 9,624 8,880 8,136 7,312 6,488#REF! #REF!
2003 Jan Feb Mar Apr May June July Aug Sept Oct Nov DecNo. Facilities Completed 13 14 14 15 15 15 15 15 15 15 15 19No. Facilities under Constr. Ph 1 2 1 1 0 5 5 5 5 5 5 5 5
PROJECTED GROWTH IN UNITS - UNITS EQUAL NUMBER OF BEDS
PROJECTED GROWTH IN FACILITIES
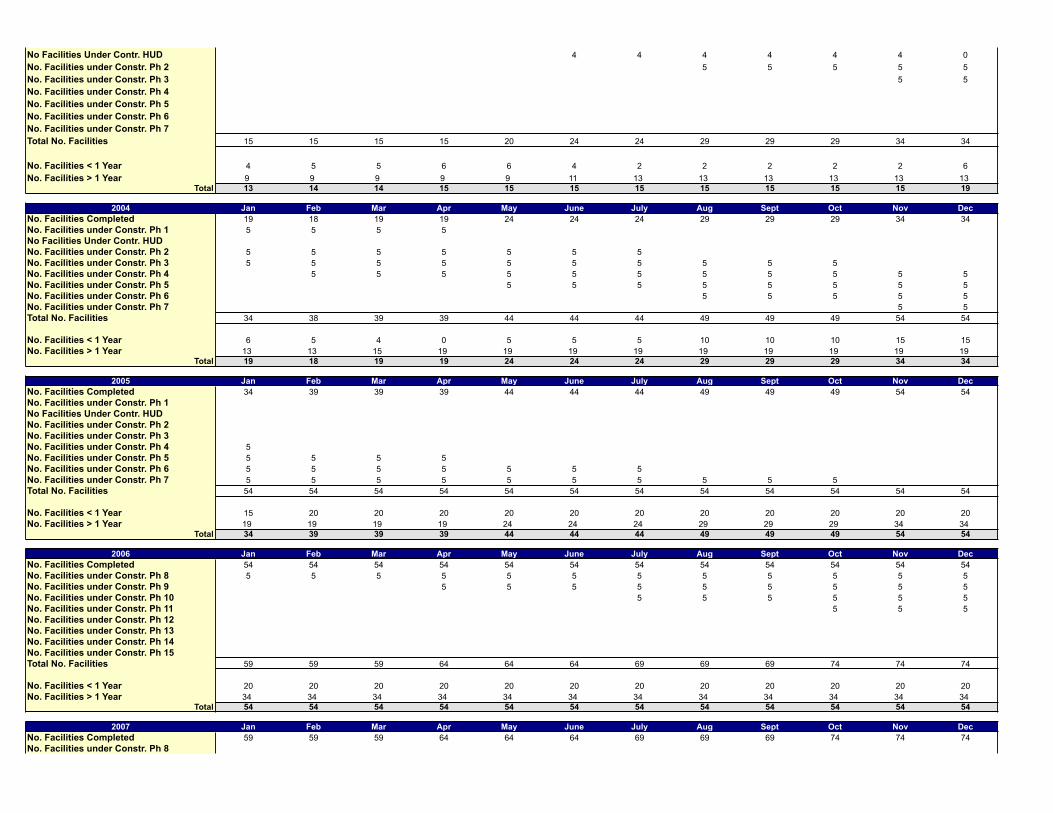
No Facilities Under Contr. HUD 4 4 4 4 4 4 0No. Facilities under Constr. Ph 2 5 5 5 5 5No. Facilities under Constr. Ph 3 5 5No. Facilities under Constr. Ph 4No. Facilities under Constr. Ph 5No. Facilities under Constr. Ph 6No. Facilities under Constr. Ph 7Total No. Facilities 15 15 15 15 20 24 24 29 29 29 34 34
No. Facilities < 1 Year 4 5 5 6 6 4 2 2 2 2 2 6No. Facilities > 1 Year 9 9 9 9 9 11 13 13 13 13 13 13
Total 13 14 14 15 15 15 15 15 15 15 15 19
2004 Jan Feb Mar Apr May June July Aug Sept Oct Nov DecNo. Facilities Completed 19 18 19 19 24 24 24 29 29 29 34 34No. Facilities under Constr. Ph 1 5 5 5 5No Facilities Under Contr. HUDNo. Facilities under Constr. Ph 2 5 5 5 5 5 5 5No. Facilities under Constr. Ph 3 5 5 5 5 5 5 5 5 5 5No. Facilities under Constr. Ph 4 5 5 5 5 5 5 5 5 5 5 5No. Facilities under Constr. Ph 5 5 5 5 5 5 5 5 5No. Facilities under Constr. Ph 6 5 5 5 5 5No. Facilities under Constr. Ph 7 5 5Total No. Facilities 34 38 39 39 44 44 44 49 49 49 54 54
No. Facilities < 1 Year 6 5 4 0 5 5 5 10 10 10 15 15No. Facilities > 1 Year 13 13 15 19 19 19 19 19 19 19 19 19
Total 19 18 19 19 24 24 24 29 29 29 34 34
2005 Jan Feb Mar Apr May June July Aug Sept Oct Nov DecNo. Facilities Completed 34 39 39 39 44 44 44 49 49 49 54 54No. Facilities under Constr. Ph 1No Facilities Under Contr. HUDNo. Facilities under Constr. Ph 2No. Facilities under Constr. Ph 3No. Facilities under Constr. Ph 4 5No. Facilities under Constr. Ph 5 5 5 5 5No. Facilities under Constr. Ph 6 5 5 5 5 5 5 5No. Facilities under Constr. Ph 7 5 5 5 5 5 5 5 5 5 5Total No. Facilities 54 54 54 54 54 54 54 54 54 54 54 54
No. Facilities < 1 Year 15 20 20 20 20 20 20 20 20 20 20 20No. Facilities > 1 Year 19 19 19 19 24 24 24 29 29 29 34 34
Total 34 39 39 39 44 44 44 49 49 49 54 54
2006 Jan Feb Mar Apr May June July Aug Sept Oct Nov DecNo. Facilities Completed 54 54 54 54 54 54 54 54 54 54 54 54No. Facilities under Constr. Ph 8 5 5 5 5 5 5 5 5 5 5 5 5No. Facilities under Constr. Ph 9 5 5 5 5 5 5 5 5 5No. Facilities under Constr. Ph 10 5 5 5 5 5 5No. Facilities under Constr. Ph 11 5 5 5No. Facilities under Constr. Ph 12No. Facilities under Constr. Ph 13No. Facilities under Constr. Ph 14No. Facilities under Constr. Ph 15Total No. Facilities 59 59 59 64 64 64 69 69 69 74 74 74
No. Facilities < 1 Year 20 20 20 20 20 20 20 20 20 20 20 20No. Facilities > 1 Year 34 34 34 34 34 34 34 34 34 34 34 34
Total 54 54 54 54 54 54 54 54 54 54 54 54
2007 Jan Feb Mar Apr May June July Aug Sept Oct Nov DecNo. Facilities Completed 59 59 59 64 64 64 69 69 69 74 74 74No. Facilities under Constr. Ph 8

No. Facilities under Constr. Ph 9 5 5 5No. Facilities under Constr. Ph 10 5 5 5 5 5 5No. Facilities under Constr. Ph 11 5 5 5 5 5 5 5 5 5No. Facilities under Constr. Ph 12 5 5 5 5 5 5 5 5 5 5 5 5No. Facilities under Constr. Ph 13 5 5 5 5 5 5 5 5 5No. Facilities under Constr. Ph 14 5 5 5 5 5 5No. Facilities under Constr. Ph 15 5 5 5Total No. Facilities 79 79 79 84 84 84 89 89 89 94 94 94
No. Facilities < 1 Year 20 20 20 20 20 20 20 20 20 20 20 20No. Facilities > 1 Year 39 39 39 44 44 44 49 49 49 54 54 54
Total 59 59 59 64 64 64 69 69 69 74 74 74
2008 Jan Feb Mar Apr May June July Aug Sept Oct Nov DecNo. Facilities Completed 79 79 79 84 84 84 89 89 89 94 94 94No. Facilities under Constr. Ph 17 5 5 5 5 5 5 5 5 5No. Facilities under Constr. Ph 18 5 5 5 5 5 5No. Facilities under Constr. Ph 19 5 5 5No. Facilities under Constr. Ph 20No. Facilities under Constr. Ph 21No. Facilities under Constr. Ph 13 5 5 5No. Facilities under Constr. Ph 14 5 5 5 5 5 5No. Facilities under Constr. Ph 15 5 5 5 5 5 5 5 5 5No. Facilities under Constr. Ph 16 5 5 5 5 5 5 5 5 5 5 5 5Total No. Facilities 99 99 99 104 104 104 109 109 109 114 114 114
No. Facilities < 1 Year 20 20 20 20 20 20 20 20 20 20 20 20No. Facilities > 1 Year 59 59 59 64 64 64 69 69 69 74 74 74
Total 79 79 79 84 84 84 89 89 89 94 94 94
2009 Jan Feb Mar Apr May June July Aug Sept Oct Nov DecNo. Facilities Completed 99 99 99 104 104 104 109 109 109 114 114 114No. Facilities under Constr. Ph 17 5 5 5No. Facilities under Constr. Ph 18 5 5 5 5 5 5No. Facilities under Constr. Ph 19 5 5 5 5 5 5 5 5 5No. Facilities under Constr. Ph 20 5 5 5 5 5 5 5 5 5 5 5 5No. Facilities under Constr. Ph 21 5 5 5 5 5 5 5 5 5No. Facilities under Constr. Ph 22 5 5 5 5 5 5No. Facilities under Constr. Ph 23 5 5 5No. Facilities under Constr. Ph 24No. Facilities under Constr. Ph 25Total No. Facilities 119 119 119 124 124 124 129 129 129 134 134 134
No. Facilities < 1 Year 20 20 20 20 20 20 20 20 20 20 20 20No. Facilities > 1 Year 79 79 79 84 84 84 89 89 89 94 94 94
Total 99 99 99 104 104 104 109 109 109 114 114 114
2010 Jan Feb Mar Apr May June July Aug Sept Oct Nov DecNo. Facilities Completed 119 119 119 124 124 124 129 129 129 134 134 134No. Facilities under Constr. Ph 26 5 5 5 5 5 5No. Facilities under Constr. Ph 27 5 5 5No. Facilities under Constr. Ph 28No. Facilities under Constr. Ph 29No. Facilities under Constr. Ph 21 5 5 5No. Facilities under Constr. Ph 22 5 5 5 5 5 5No. Facilities under Constr. Ph 23 5 5 5 5 5 5 5 5 5No. Facilities under Constr. Ph 24 5 5 5 5 5 5 5 5 5 5 5 5No. Facilities under Constr. Ph 25 5 5 5 5 5 5 5 5 5Total No. Facilities 139 139 139 144 144 144 149 149 149 154 154 154
No. Facilities < 1 Year 20 20 20 20 20 20 20 20 20 20 20 20No. Facilities > 1 Year 99 99 99 104 104 104 109 109 109 114 114 114
Total 119 119 119 124 124 124 129 129 129 134 134 134
2011 Jan Feb Mar Apr May June July Aug Sept Oct Nov DecNo. Facilities Completed 139 139 139 144 144 144 149 149 149 154 154 154

No. Facilities under Constr. Ph 26 5 5 5 5 5 5No. Facilities under Constr. Ph 27 5 5 5 5 5 5 5 5 5No. Facilities under Constr. Ph 28 5 5 5 5 5 5 5 5 5 5 5 5No. Facilities under Constr. Ph 29 5 5 5 5 5 5 5 5 5No. Facilities under Constr. Ph 30 5 5 5 5 5 5No. Facilities under Constr. Ph 31 5 5 5No. Facilities under Constr. Ph 32No. Facilities under Constr. Ph 33No. Facilities under Constr. Ph 25 5 5 5Total No. Facilities 159 159 159 164 164 164 169 169 169 174 174 174
No. Facilities < 1 Year 20 20 20 20 20 20 20 20 20 20 20 20No. Facilities > 1 Year 119 119 119 124 124 124 129 129 129 134 134 134
Total 139 139 139 144 144 144 149 149 149 154 154 154
2012 Jan Feb Mar Apr May June July Aug Sept Oct Nov DecNo. Facilities Completed 159 159 159 164 164 164 169 169 169 174 174 174No. Facilities under Constr. Ph 35 5 5 5No. Facilities under Constr. Ph 27No. Facilities under Constr. Ph 28No. Facilities under Constr. Ph 29 5 5 5No. Facilities under Constr. Ph 30 5 5 5 5 5 5No. Facilities under Constr. Ph 31 5 5 5 5 5 5 5 5 5No. Facilities under Constr. Ph 32 5 5 5 5 5 5 5 5 5 5 5 5No. Facilities under Constr. Ph 33 5 5 5 5 5 5 5 5 5No. Facilities under Constr. Ph 34 5 5 5 5 5 5Total No. Facilities 179 179 179 184 184 184 189 189 189 194 194 194
No. Facilities < 1 Year 20 20 20 20 20 20 20 20 20 20 20 20No. Facilities > 1 Year 139 139 139 144 144 144 149 149 149 154 154 154
Total 159 159 159 164 164 164 169 169 169 174 174 174
Company
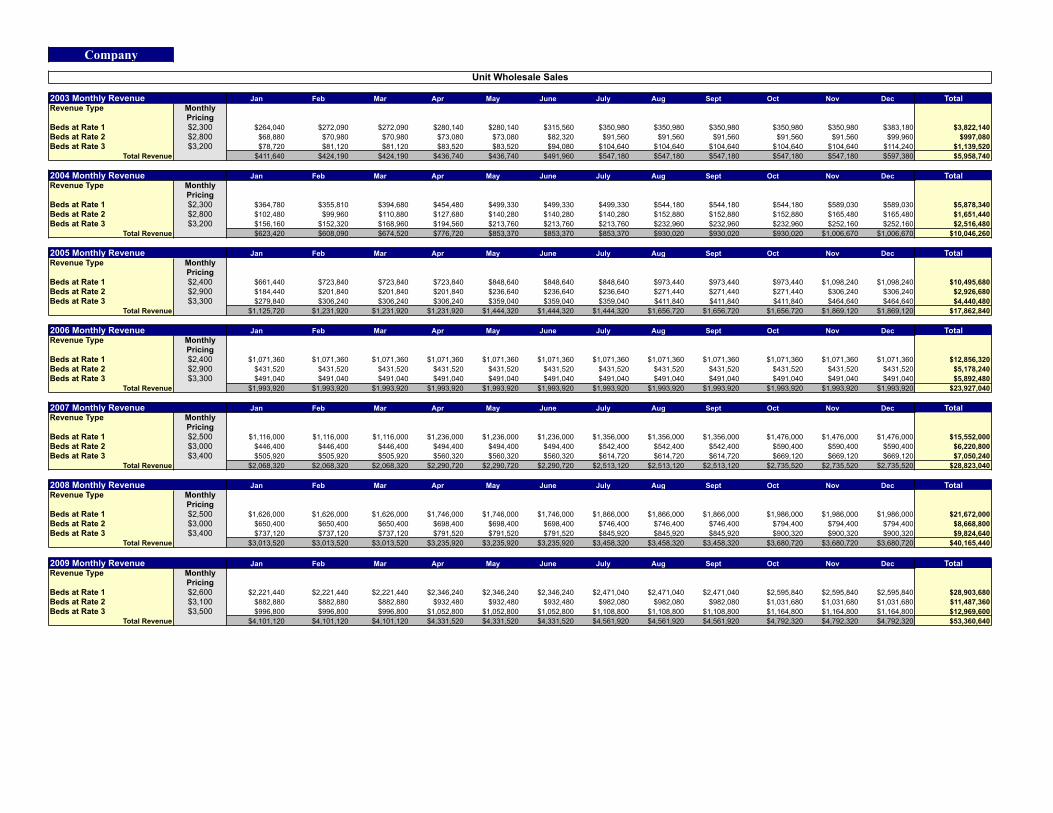
2003 Monthly Revenue Jan Feb Mar Apr May June July Aug Sept Oct Nov Dec TotalRevenue Type Monthly
PricingBeds at Rate 1 $2,300 $264,040 $272,090 $272,090 $280,140 $280,140 $315,560 $350,980 $350,980 $350,980 $350,980 $350,980 $383,180 $3,822,140Beds at Rate 2 $2,800 $68,880 $70,980 $70,980 $73,080 $73,080 $82,320 $91,560 $91,560 $91,560 $91,560 $91,560 $99,960 $997,080Beds at Rate 3 $3,200 $78,720 $81,120 $81,120 $83,520 $83,520 $94,080 $104,640 $104,640 $104,640 $104,640 $104,640 $114,240 $1,139,520
Total Revenue $411,640 $424,190 $424,190 $436,740 $436,740 $491,960 $547,180 $547,180 $547,180 $547,180 $547,180 $597,380 $5,958,740
2004 Monthly Revenue Jan Feb Mar Apr May June July Aug Sept Oct Nov Dec TotalRevenue Type Monthly
PricingBeds at Rate 1 $2,300 $364,780 $355,810 $394,680 $454,480 $499,330 $499,330 $499,330 $544,180 $544,180 $544,180 $589,030 $589,030 $5,878,340Beds at Rate 2 $2,800 $102,480 $99,960 $110,880 $127,680 $140,280 $140,280 $140,280 $152,880 $152,880 $152,880 $165,480 $165,480 $1,651,440Beds at Rate 3 $3,200 $156,160 $152,320 $168,960 $194,560 $213,760 $213,760 $213,760 $232,960 $232,960 $232,960 $252,160 $252,160 $2,516,480
Total Revenue $623,420 $608,090 $674,520 $776,720 $853,370 $853,370 $853,370 $930,020 $930,020 $930,020 $1,006,670 $1,006,670 $10,046,260
2005 Monthly Revenue Jan Feb Mar Apr May June July Aug Sept Oct Nov Dec TotalRevenue Type Monthly
PricingBeds at Rate 1 $2,400 $661,440 $723,840 $723,840 $723,840 $848,640 $848,640 $848,640 $973,440 $973,440 $973,440 $1,098,240 $1,098,240 $10,495,680Beds at Rate 2 $2,900 $184,440 $201,840 $201,840 $201,840 $236,640 $236,640 $236,640 $271,440 $271,440 $271,440 $306,240 $306,240 $2,926,680Beds at Rate 3 $3,300 $279,840 $306,240 $306,240 $306,240 $359,040 $359,040 $359,040 $411,840 $411,840 $411,840 $464,640 $464,640 $4,440,480
Total Revenue $1,125,720 $1,231,920 $1,231,920 $1,231,920 $1,444,320 $1,444,320 $1,444,320 $1,656,720 $1,656,720 $1,656,720 $1,869,120 $1,869,120 $17,862,840
2006 Monthly Revenue Jan Feb Mar Apr May June July Aug Sept Oct Nov Dec TotalRevenue Type Monthly
PricingBeds at Rate 1 $2,400 $1,071,360 $1,071,360 $1,071,360 $1,071,360 $1,071,360 $1,071,360 $1,071,360 $1,071,360 $1,071,360 $1,071,360 $1,071,360 $1,071,360 $12,856,320Beds at Rate 2 $2,900 $431,520 $431,520 $431,520 $431,520 $431,520 $431,520 $431,520 $431,520 $431,520 $431,520 $431,520 $431,520 $5,178,240Beds at Rate 3 $3,300 $491,040 $491,040 $491,040 $491,040 $491,040 $491,040 $491,040 $491,040 $491,040 $491,040 $491,040 $491,040 $5,892,480
Total Revenue $1,993,920 $1,993,920 $1,993,920 $1,993,920 $1,993,920 $1,993,920 $1,993,920 $1,993,920 $1,993,920 $1,993,920 $1,993,920 $1,993,920 $23,927,040
2007 Monthly Revenue Jan Feb Mar Apr May June July Aug Sept Oct Nov Dec TotalRevenue Type Monthly
PricingBeds at Rate 1 $2,500 $1,116,000 $1,116,000 $1,116,000 $1,236,000 $1,236,000 $1,236,000 $1,356,000 $1,356,000 $1,356,000 $1,476,000 $1,476,000 $1,476,000 $15,552,000Beds at Rate 2 $3,000 $446,400 $446,400 $446,400 $494,400 $494,400 $494,400 $542,400 $542,400 $542,400 $590,400 $590,400 $590,400 $6,220,800Beds at Rate 3 $3,400 $505,920 $505,920 $505,920 $560,320 $560,320 $560,320 $614,720 $614,720 $614,720 $669,120 $669,120 $669,120 $7,050,240
Total Revenue $2,068,320 $2,068,320 $2,068,320 $2,290,720 $2,290,720 $2,290,720 $2,513,120 $2,513,120 $2,513,120 $2,735,520 $2,735,520 $2,735,520 $28,823,040
2008 Monthly Revenue Jan Feb Mar Apr May June July Aug Sept Oct Nov Dec TotalRevenue Type Monthly
PricingBeds at Rate 1 $2,500 $1,626,000 $1,626,000 $1,626,000 $1,746,000 $1,746,000 $1,746,000 $1,866,000 $1,866,000 $1,866,000 $1,986,000 $1,986,000 $1,986,000 $21,672,000Beds at Rate 2 $3,000 $650,400 $650,400 $650,400 $698,400 $698,400 $698,400 $746,400 $746,400 $746,400 $794,400 $794,400 $794,400 $8,668,800Beds at Rate 3 $3,400 $737,120 $737,120 $737,120 $791,520 $791,520 $791,520 $845,920 $845,920 $845,920 $900,320 $900,320 $900,320 $9,824,640
Total Revenue $3,013,520 $3,013,520 $3,013,520 $3,235,920 $3,235,920 $3,235,920 $3,458,320 $3,458,320 $3,458,320 $3,680,720 $3,680,720 $3,680,720 $40,165,440
2009 Monthly Revenue Jan Feb Mar Apr May June July Aug Sept Oct Nov Dec TotalRevenue Type Monthly
PricingBeds at Rate 1 $2,600 $2,221,440 $2,221,440 $2,221,440 $2,346,240 $2,346,240 $2,346,240 $2,471,040 $2,471,040 $2,471,040 $2,595,840 $2,595,840 $2,595,840 $28,903,680Beds at Rate 2 $3,100 $882,880 $882,880 $882,880 $932,480 $932,480 $932,480 $982,080 $982,080 $982,080 $1,031,680 $1,031,680 $1,031,680 $11,487,360Beds at Rate 3 $3,500 $996,800 $996,800 $996,800 $1,052,800 $1,052,800 $1,052,800 $1,108,800 $1,108,800 $1,108,800 $1,164,800 $1,164,800 $1,164,800 $12,969,600
Total Revenue $4,101,120 $4,101,120 $4,101,120 $4,331,520 $4,331,520 $4,331,520 $4,561,920 $4,561,920 $4,561,920 $4,792,320 $4,792,320 $4,792,320 $53,360,640
Unit Wholesale Sales

2010 Monthly Revenue Jan Feb Mar Apr May June July Aug Sept Oct Nov Dec TotalRevenue Type Monthly
PricingBeds at Rate 1 $2,600 $2,720,640 $2,720,640 $2,720,640 $2,845,440 $2,845,440 $2,845,440 $2,970,240 $2,970,240 $2,970,240 $3,095,040 $3,095,040 $3,095,040 $34,894,080Beds at Rate 2 $3,100 $1,081,280 $1,081,280 $1,081,280 $1,130,880 $1,130,880 $1,130,880 $1,180,480 $1,180,480 $1,180,480 $1,230,080 $1,230,080 $1,230,080 $13,868,160Beds at Rate 3 $3,500 $1,220,800 $1,220,800 $1,220,800 $1,276,800 $1,276,800 $1,276,800 $1,332,800 $1,332,800 $1,332,800 $1,388,800 $1,388,800 $1,388,800 $15,657,600
Total Revenue $5,022,720 $5,022,720 $5,022,720 $5,253,120 $5,253,120 $5,253,120 $5,483,520 $5,483,520 $5,483,520 $5,713,920 $5,713,920 $5,713,920 $64,419,840
2011 Monthly Revenue Jan Feb Mar Apr May June July Aug Sept Oct Nov Dec TotalRevenue Type Monthly
PricingBeds at Rate 1 $2,700 $3,343,680 $3,343,680 $3,343,680 $3,473,280 $3,473,280 $3,473,280 $3,602,880 $3,602,880 $3,602,880 $3,732,480 $3,732,480 $3,732,480 $42,456,960Beds at Rate 2 $3,200 $1,320,960 $1,320,960 $1,320,960 $1,372,160 $1,372,160 $1,372,160 $1,423,360 $1,423,360 $1,423,360 $1,474,560 $1,474,560 $1,474,560 $16,773,120Beds at Rate 3 $3,600 $1,486,080 $1,486,080 $1,486,080 $1,543,680 $1,543,680 $1,543,680 $1,601,280 $1,601,280 $1,601,280 $1,658,880 $1,658,880 $1,658,880 $18,869,760
Total Revenue $6,150,720 $6,150,720 $6,150,720 $6,389,120 $6,389,120 $6,389,120 $6,627,520 $6,627,520 $6,627,520 $6,865,920 $6,865,920 $6,865,920 $78,099,840
2012 Monthly Revenue Jan Feb Mar Apr May June July Aug Sept Oct Nov Dec TotalRevenue Type Monthly
PricingBeds at Rate 1 $2,700 $3,862,080 $3,862,080 $3,862,080 $3,991,680 $3,991,680 $3,991,680 $4,121,280 $4,121,280 $4,121,280 $4,250,880 $4,250,880 $4,250,880 $48,677,760Beds at Rate 2 $3,200 $1,525,760 $1,525,760 $1,525,760 $1,576,960 $1,576,960 $1,576,960 $1,628,160 $1,628,160 $1,628,160 $1,679,360 $1,679,360 $1,679,360 $19,230,720Beds at Rate 3 $3,600 $1,716,480 $1,716,480 $1,716,480 $1,774,080 $1,774,080 $1,774,080 $1,831,680 $1,831,680 $1,831,680 $1,889,280 $1,889,280 $1,889,280 $21,634,560
Total Revenue $7,104,320 $7,104,320 $7,104,320 $7,342,720 $7,342,720 $7,342,720 $7,581,120 $7,581,120 $7,581,120 $7,819,520 $7,819,520 $7,819,520 $89,543,040
Total Annual Revenues 2003 2004 2005 2006 2007 2008 2009 2010 2011 2012 Total
Beds at Rate 1 $3,822,140 $5,878,340 $10,495,680 $12,856,320 $15,552,000 $21,672,000 $28,903,680 $34,894,080 $42,456,960 $48,677,760 $225,208,960Beds at Rate 2 $997,080 $1,651,440 $2,926,680 $5,178,240 $6,220,800 $8,668,800 $11,487,360 $13,868,160 $16,773,120 $19,230,720 $87,002,400Beds at Rate 3 $1,139,520 $2,516,480 $4,440,480 $5,892,480 $7,050,240 $9,824,640 $12,969,600 $15,657,600 $18,869,760 $21,634,560 $99,995,360
Total Revenue $5,958,740 $10,046,260 $17,862,840 $23,927,040 $28,823,040 $40,165,440 $53,360,640 $64,419,840 $78,099,840 $89,543,040 $412,206,720

Company
Detailed Expenditures (Monthly) 2000E2003 2003
Period: Jan Feb Mar Apr May June July Aug Sept Oct Nov Dec TotalCost of Operations
Accounting & Legal $4,446 $4,581 $4,581 $4,717 $4,717 $5,313 $5,910 $5,910 $5,910 $5,910 $5,910 $6,452 $64,354Activities and Entertainment $1,029 $1,060 $1,060 $1,092 $1,092 $1,230 $1,368 $1,368 $1,368 $1,368 $1,368 $1,493 $14,897Advertising $8,192 $8,441 $8,441 $8,691 $8,691 $9,790 $10,889 $10,889 $10,889 $10,889 $10,889 $11,888 $118,579Bank Charges $659 $679 $679 $699 $699 $787 $875 $875 $875 $875 $875 $956 $9,534Commercial insurances $1,605 $1,654 $1,654 $1,703 $1,703 $1,919 $2,134 $2,134 $2,134 $2,134 $2,134 $2,330 $23,239Dues and Subscriptions $123 $127 $127 $131 $131 $148 $164 $164 $164 $164 $164 $179 $1,788Emloyee Benefits $1,441 $1,485 $1,485 $1,529 $1,529 $1,722 $1,915 $1,915 $1,915 $1,915 $1,915 $2,091 $20,856Employee Training $864 $891 $891 $917 $917 $1,033 $1,149 $1,149 $1,149 $1,149 $1,149 $1,254 $12,513Food and Supplies $22,558 $23,246 $23,246 $23,933 $23,933 $26,959 $29,985 $29,985 $29,985 $29,985 $29,985 $32,736 $326,539Licenses and Permits $412 $424 $424 $437 $437 $492 $547 $547 $547 $547 $547 $597 $5,959Management Travel $1,194 $1,230 $1,230 $1,267 $1,267 $1,427 $1,587 $1,587 $1,587 $1,587 $1,587 $1,732 $17,280Office Expense $5,187 $5,345 $5,345 $5,503 $5,503 $6,199 $6,894 $6,894 $6,894 $6,894 $6,894 $7,527 $75,080Payroll Taxes $22,229 $22,906 $22,906 $23,584 $23,584 $26,566 $29,548 $29,548 $29,548 $29,548 $29,548 $32,259 $321,772Property Taxes $12,349 $12,726 $12,726 $13,102 $13,102 $14,759 $16,415 $16,415 $16,415 $16,415 $16,415 $17,921 $178,762Repairs and Maint $3,664 $3,775 $3,775 $3,887 $3,887 $4,378 $4,870 $4,870 $4,870 $4,870 $4,870 $5,317 $53,033Salaries and Wages $132,260 $136,292 $136,292 $140,325 $140,325 $158,067 $175,809 $175,809 $175,809 $175,809 $175,809 $191,938 $1,914,543Telephone $6,051 $6,236 $6,236 $6,420 $6,420 $7,232 $8,044 $8,044 $8,044 $8,044 $8,044 $8,781 $87,593Utilities $5,450 $5,616 $5,616 $5,782 $5,782 $6,514 $7,245 $7,245 $7,245 $7,245 $7,245 $7,909 $78,894
Percantage of Revenues 56% 56% 56% 56% 56% 56% 56% 56% 56% 56% 56% 56%
Mortgage/Bond Interest $72,037 $74,233 $74,233 $76,430 $76,430 $73,430 $73,430 $73,430 $297,917 $297,917 $297,917 $297,917 $1,785,321
Total COGS and Interest $301,749 $310,948 $310,948 $320,148 $320,148 $347,963 $378,778 $378,778 $603,265 $603,265 $603,265 $631,279 $5,110,536Executive & Staff Corporate Expenses
CEO $7,500 $7,500 $7,500 $7,500 $7,500 $7,500 $7,500 $7,500 $7,500 $7,500 $7,500 $7,500 $90,000President $0 $0 $0 $0 $0 $0 $0 $0 $0 $0 $0 $0 $0CFO $7,500 $7,500 $7,500 $7,500 $7,500 $7,500 $7,500 $7,500 $7,500 $7,500 $7,500 $7,500 $90,000VP Development $7,500 $7,500 $7,500 $7,500 $7,500 $7,500 $7,500 $7,500 $7,500 $7,500 $7,500 $7,500 $90,000Operations Consultant $3,000 $3,000 $3,000 $3,000 $3,000 $3,000 $3,000 $3,000 $3,000 $3,000 $3,000 $3,000 $36,000VP Operations $0 $0 $0 $0 $0 $0 $0 $0 $0 $0 $0 $0 $0Controller (.5 fte) $0 $0 $0 $0 $0 $0 $0 $0 $0 $2,083 $2,083 $2,083 $6,249Grant Writer/Govt Liaison $0 $0 $0 $0 $0 $0 $0 $0 $0 $0 $0 $0 $0Other Staff $3,000 $3,000 $3,000 $3,000 $3,000 $3,000 $3,000 $3,000 $3,000 $3,000 $3,000 $3,000 $36,000Employee Benefits $6,270 $6,270 $6,270 $6,270 $6,270 $6,270 $6,270 $6,270 $6,270 $6,728 $6,728 $6,728 $76,615Bonus $0 $0 $0 $0 $0 $0 $0 $0 $0 $0 $0 $0 $0
Other Corporate ExpensesAccounting and Legal $2,000 $2,000 $2,000 $2,000 $2,000 $2,000 $2,500 $2,500 $2,500 $2,500 $2,500 $2,500 $27,000Auto $1,500 $1,500 $1,500 $1,500 $1,500 $1,500 $1,500 $1,500 $1,500 $1,500 $1,500 $1,500 $18,000Contingency $0 $0 $0 $0 $0 $0 $2,500 $2,500 $2,500 $2,500 $2,500 $2,500 $15,000Insurance $0 $0 $0 $0 $0 $0 $750 $750 $750 $750 $750 $750 $4,500Office Expense $200 $200 $200 $200 $200 $200 $500 $500 $500 $500 $500 $500 $4,200Professional Fees $0 $0 $0 $0 $0 $0 $15,000 $15,000 $15,000 $15,000 $15,000 $15,000 $90,000Rent $1,200 $1,200 $1,200 $1,200 $1,200 $1,200 $1,200 $1,200 $1,200 $1,200 $1,200 $1,200 $14,400Telephone $800 $800 $800 $800 $800 $800 $1,000 $1,000 $1,000 $1,000 $1,000 $1,000 $10,800Travel $3,000 $3,000 $3,000 $3,000 $3,000 $3,000 $6,000 $6,000 $6,000 $6,000 $6,000 $6,000 $54,000Utilities $500 $500 $500 $500 $500 $500 $500 $500 $500 $500 $500 $500 $6,000
Total Corporate Expenses $43,970 $43,970 $43,970 $43,970 $43,970 $43,970 $66,220 $66,220 $66,220 $68,761 $68,761 $68,761 $668,764
Total Ops and Corp Expenses $345,719 $354,918 $354,918 $364,118 $364,118 $391,933 $444,998 $444,998 $669,485 $672,027 $672,027 $700,040 $5,779,300
Expenditure Summary Jan Feb Mar Apr May June July Aug Sept Oct Nov Dec TotalDepartmentCost of Goods Sold $229,712 $236,715 $236,715 $243,718 $243,718 $274,533 $305,348 $305,348 $305,348 $305,348 $305,348 $333,362 $3,325,215Mortgage Interest $72,037 $74,233 $74,233 $76,430 $76,430 $73,430 $73,430 $73,430 $297,917 $297,917 $297,917 $297,917 $1,785,321Corporate Expenses $43,970 $43,970 $43,970 $43,970 $43,970 $43,970 $66,220 $66,220 $66,220 $68,761 $68,761 $68,761 $668,764
Total Operating Costs $345,719 $354,918 $354,918 $364,118 $364,118 $391,933 $444,998 $444,998 $669,485 $672,027 $672,027 $700,040 $5,779,300
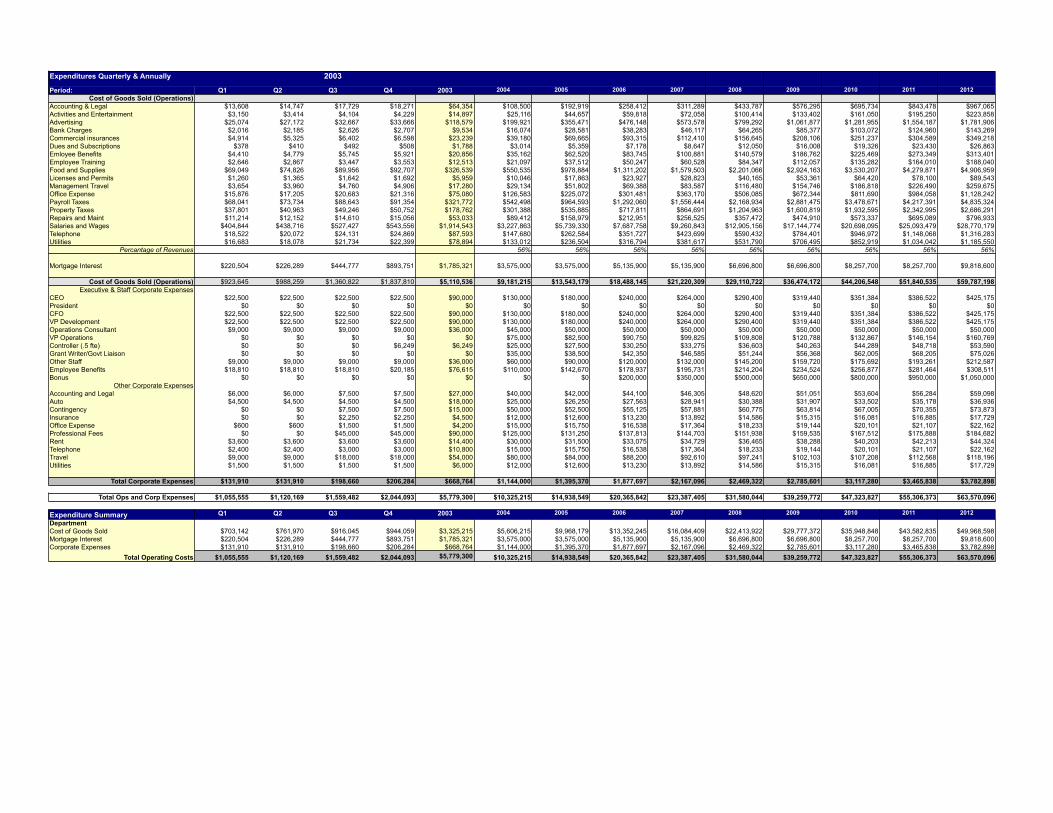
Expenditures Quarterly & Annually 2003
Period: Q1 Q2 Q3 Q4 2003 2004 2005 2006 2007 2008 2009 2010 2011 2012Cost of Goods Sold (Operations)
Accounting & Legal $13,608 $14,747 $17,729 $18,271 $64,354 $108,500 $192,919 $258,412 $311,289 $433,787 $576,295 $695,734 $843,478 $967,065Activities and Entertainment $3,150 $3,414 $4,104 $4,229 $14,897 $25,116 $44,657 $59,818 $72,058 $100,414 $133,402 $161,050 $195,250 $223,858Advertising $25,074 $27,172 $32,667 $33,666 $118,579 $199,921 $355,471 $476,148 $573,578 $799,292 $1,061,877 $1,281,955 $1,554,187 $1,781,906Bank Charges $2,016 $2,185 $2,626 $2,707 $9,534 $16,074 $28,581 $38,283 $46,117 $64,265 $85,377 $103,072 $124,960 $143,269Commercial insurances $4,914 $5,325 $6,402 $6,598 $23,239 $39,180 $69,665 $93,315 $112,410 $156,645 $208,106 $251,237 $304,589 $349,218Dues and Subscriptions $378 $410 $492 $508 $1,788 $3,014 $5,359 $7,178 $8,647 $12,050 $16,008 $19,326 $23,430 $26,863Emloyee Benefits $4,410 $4,779 $5,745 $5,921 $20,856 $35,162 $62,520 $83,745 $100,881 $140,579 $186,762 $225,469 $273,349 $313,401Employee Training $2,646 $2,867 $3,447 $3,553 $12,513 $21,097 $37,512 $50,247 $60,528 $84,347 $112,057 $135,282 $164,010 $188,040Food and Supplies $69,049 $74,826 $89,956 $92,707 $326,539 $550,535 $978,884 $1,311,202 $1,579,503 $2,201,066 $2,924,163 $3,530,207 $4,279,871 $4,906,959Licenses and Permits $1,260 $1,365 $1,642 $1,692 $5,959 $10,046 $17,863 $23,927 $28,823 $40,165 $53,361 $64,420 $78,100 $89,543Management Travel $3,654 $3,960 $4,760 $4,906 $17,280 $29,134 $51,802 $69,388 $83,587 $116,480 $154,746 $186,818 $226,490 $259,675Office Expense $15,876 $17,205 $20,683 $21,316 $75,080 $126,583 $225,072 $301,481 $363,170 $506,085 $672,344 $811,690 $984,058 $1,128,242Payroll Taxes $68,041 $73,734 $88,643 $91,354 $321,772 $542,498 $964,593 $1,292,060 $1,556,444 $2,168,934 $2,881,475 $3,478,671 $4,217,391 $4,835,324Property Taxes $37,801 $40,963 $49,246 $50,752 $178,762 $301,388 $535,885 $717,811 $864,691 $1,204,963 $1,600,819 $1,932,595 $2,342,995 $2,686,291Repairs and Maint $11,214 $12,152 $14,610 $15,056 $53,033 $89,412 $158,979 $212,951 $256,525 $357,472 $474,910 $573,337 $695,089 $796,933Salaries and Wages $404,844 $438,716 $527,427 $543,556 $1,914,543 $3,227,863 $5,739,330 $7,687,758 $9,260,843 $12,905,156 $17,144,774 $20,698,095 $25,093,479 $28,770,179Telephone $18,522 $20,072 $24,131 $24,869 $87,593 $147,680 $262,584 $351,727 $423,699 $590,432 $784,401 $946,972 $1,148,068 $1,316,283Utilities $16,683 $18,078 $21,734 $22,399 $78,894 $133,012 $236,504 $316,794 $381,617 $531,790 $706,495 $852,919 $1,034,042 $1,185,550
Percantage of Revenues 56% 56% 56% 56% 56% 56% 56% 56% 56%
Mortgage Interest $220,504 $226,289 $444,777 $893,751 $1,785,321 $3,575,000 $3,575,000 $5,135,900 $5,135,900 $6,696,800 $6,696,800 $8,257,700 $8,257,700 $9,818,600
Cost of Goods Sold (Operations) $923,645 $988,259 $1,360,822 $1,837,810 $5,110,536 $9,181,215 $13,543,179 $18,488,145 $21,220,309 $29,110,722 $36,474,172 $44,206,548 $51,840,535 $59,787,198Executive & Staff Corporate Expenses
CEO $22,500 $22,500 $22,500 $22,500 $90,000 $130,000 $180,000 $240,000 $264,000 $290,400 $319,440 $351,384 $386,522 $425,175President $0 $0 $0 $0 $0 $0 $0 $0 $0 $0 $0 $0 $0 $0CFO $22,500 $22,500 $22,500 $22,500 $90,000 $130,000 $180,000 $240,000 $264,000 $290,400 $319,440 $351,384 $386,522 $425,175VP Development $22,500 $22,500 $22,500 $22,500 $90,000 $130,000 $180,000 $240,000 $264,000 $290,400 $319,440 $351,384 $386,522 $425,175Operations Consultant $9,000 $9,000 $9,000 $9,000 $36,000 $45,000 $50,000 $50,000 $50,000 $50,000 $50,000 $50,000 $50,000 $50,000VP Operations $0 $0 $0 $0 $0 $75,000 $82,500 $90,750 $99,825 $109,808 $120,788 $132,867 $146,154 $160,769Controller (.5 fte) $0 $0 $0 $6,249 $6,249 $25,000 $27,500 $30,250 $33,275 $36,603 $40,263 $44,289 $48,718 $53,590Grant Writer/Govt Liaison $0 $0 $0 $0 $0 $35,000 $38,500 $42,350 $46,585 $51,244 $56,368 $62,005 $68,205 $75,026Other Staff $9,000 $9,000 $9,000 $9,000 $36,000 $60,000 $90,000 $120,000 $132,000 $145,200 $159,720 $175,692 $193,261 $212,587Employee Benefits $18,810 $18,810 $18,810 $20,185 $76,615 $110,000 $142,670 $178,937 $195,731 $214,204 $234,524 $256,877 $281,464 $308,511Bonus $0 $0 $0 $0 $0 $0 $0 $200,000 $350,000 $500,000 $650,000 $800,000 $950,000 $1,050,000
Other Corporate ExpensesAccounting and Legal $6,000 $6,000 $7,500 $7,500 $27,000 $40,000 $42,000 $44,100 $46,305 $48,620 $51,051 $53,604 $56,284 $59,098Auto $4,500 $4,500 $4,500 $4,500 $18,000 $25,000 $26,250 $27,563 $28,941 $30,388 $31,907 $33,502 $35,178 $36,936Contingency $0 $0 $7,500 $7,500 $15,000 $50,000 $52,500 $55,125 $57,881 $60,775 $63,814 $67,005 $70,355 $73,873Insurance $0 $0 $2,250 $2,250 $4,500 $12,000 $12,600 $13,230 $13,892 $14,586 $15,315 $16,081 $16,885 $17,729Office Expense $600 $600 $1,500 $1,500 $4,200 $15,000 $15,750 $16,538 $17,364 $18,233 $19,144 $20,101 $21,107 $22,162Professional Fees $0 $0 $45,000 $45,000 $90,000 $125,000 $131,250 $137,813 $144,703 $151,938 $159,535 $167,512 $175,888 $184,682Rent $3,600 $3,600 $3,600 $3,600 $14,400 $30,000 $31,500 $33,075 $34,729 $36,465 $38,288 $40,203 $42,213 $44,324Telephone $2,400 $2,400 $3,000 $3,000 $10,800 $15,000 $15,750 $16,538 $17,364 $18,233 $19,144 $20,101 $21,107 $22,162Travel $9,000 $9,000 $18,000 $18,000 $54,000 $80,000 $84,000 $88,200 $92,610 $97,241 $102,103 $107,208 $112,568 $118,196Utilities $1,500 $1,500 $1,500 $1,500 $6,000 $12,000 $12,600 $13,230 $13,892 $14,586 $15,315 $16,081 $16,885 $17,729
Total Corporate Expenses $131,910 $131,910 $198,660 $206,284 $668,764 $1,144,000 $1,395,370 $1,877,697 $2,167,096 $2,469,322 $2,785,601 $3,117,280 $3,465,838 $3,782,898
Total Ops and Corp Expenses $1,055,555 $1,120,169 $1,559,482 $2,044,093 $5,779,300 $10,325,215 $14,938,549 $20,365,842 $23,387,405 $31,580,044 $39,259,772 $47,323,827 $55,306,373 $63,570,096
Expenditure Summary Q1 Q2 Q3 Q4 2003 2004 2005 2006 2007 2008 2009 2010 2011 2012
DepartmentCost of Goods Sold $703,142 $761,970 $916,045 $944,059 $3,325,215 $5,606,215 $9,968,179 $13,352,245 $16,084,409 $22,413,922 $29,777,372 $35,948,848 $43,582,835 $49,968,598Mortgage Interest $220,504 $226,289 $444,777 $893,751 $1,785,321 $3,575,000 $3,575,000 $5,135,900 $5,135,900 $6,696,800 $6,696,800 $8,257,700 $8,257,700 $9,818,600Corporate Expenses $131,910 $131,910 $198,660 $206,284 $668,764 $1,144,000 $1,395,370 $1,877,697 $2,167,096 $2,469,322 $2,785,601 $3,117,280 $3,465,838 $3,782,898
Total Operating Costs $1,055,555 $1,120,169 $1,559,482 $2,044,093 $5,779,300 $10,325,215 $14,938,549 $20,365,842 $23,387,405 $31,580,044 $39,259,772 $47,323,827 $55,306,373 $63,570,096
Company
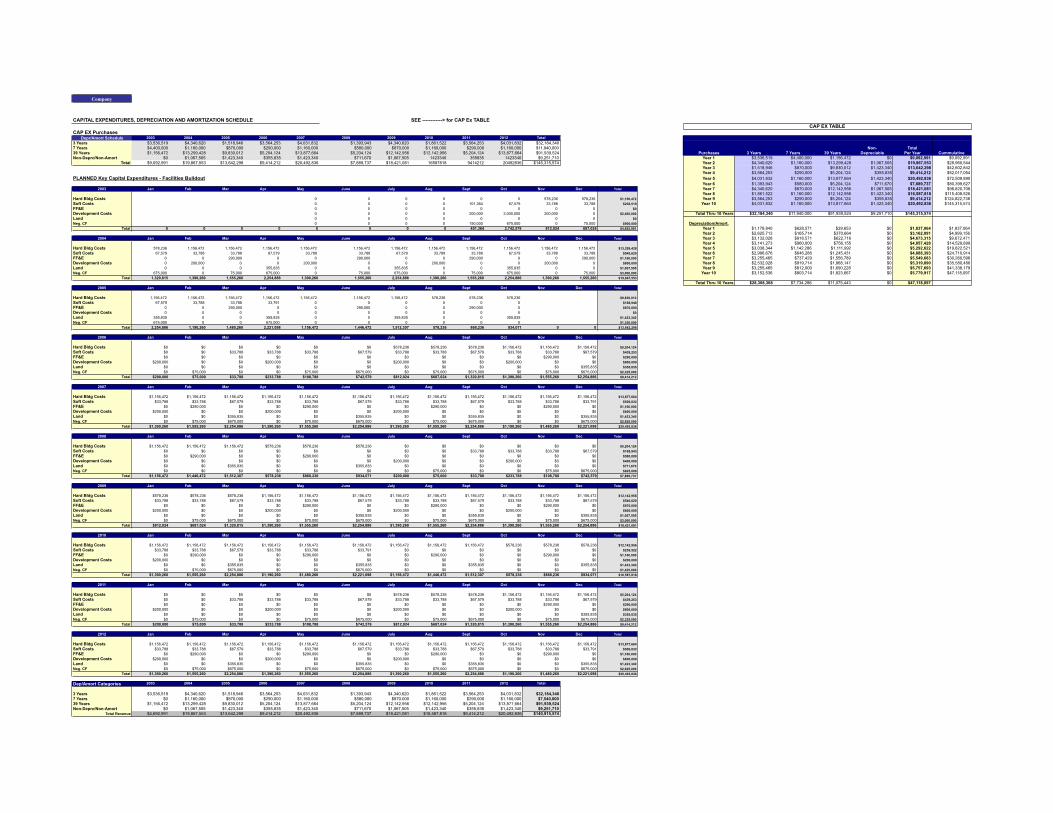
SEE ------------> for CAP Ex TABLE
CAP EX PurchasesDepr/Amort Schedule 2003 2004 2005 2006 2007 2008 2009 2010 2011 2012 Total
3 Years $3,536,519 $4,340,620 $1,518,946 $3,564,253 $4,031,832 $1,393,943 $4,340,620 $1,861,522 $3,564,253 $4,031,832 $32,184,3407 Years $4,400,000 $1,160,000 $870,000 $290,000 $1,160,000 $580,000 $870,000 $1,160,000 $290,000 $1,160,000 $11,940,000 Non- Total39 Years $1,156,472 $13,299,428 $9,830,012 $5,204,124 $13,877,664 $5,204,124 $12,142,956 $12,142,956 $5,204,124 $13,877,664 $91,939,524 Purchases 3 Years 7 Years 39 Years Depreciable Per Year CummulativeNon-Deprc/Non-Amort $0 $1,067,505 $1,423,340 $355,835 $1,423,340 $711,670 $1,067,505 1423340 355835 1423340 $9,251,710 Year 1 $3,536,519 $4,400,000 $1,156,472 $0 $9,092,991 $9,092,991
Total $9,092,991 $19,867,553 $13,642,298 $9,414,212 $20,492,836 $7,889,737 $18,421,081 16587818 9414212 20492836 $145,315,574 Year 2 $4,340,620 $1,160,000 $13,299,428 $1,067,505 $19,867,553 $28,960,544Year 3 $1,518,946 $870,000 $9,830,012 $1,423,340 $13,642,298 $42,602,842Year 4 $3,564,253 $290,000 $5,204,124 $355,835 $9,414,212 $52,017,054
PLANNED Key Capital Expenditures - Facilities Buildout Year 5 $4,031,832 $1,160,000 $13,877,664 $1,423,340 $20,492,836 $72,509,890Year 6 $1,393,943 $580,000 $5,204,124 $711,670 $7,889,737 $80,399,627
2003 Jan Feb Mar Apr May June July Aug Sept Oct Nov Dec Total Year 7 $4,340,620 $870,000 $12,142,956 $1,067,505 $18,421,081 $98,820,708 Year 8 $1,861,522 $1,160,000 $12,142,956 $1,423,340 $16,587,818 $115,408,526Hard Bldg Costs 0 0 0 0 0 0 578,236 578,236 $1,156,472 Year 9 $3,564,253 $290,000 $5,204,124 $355,835 $9,414,212 $124,822,738Soft Costs 0 0 0 0 101,364 67,579 33,788 33,788 $236,519 Year 10 $4,031,832 $1,160,000 $13,877,664 $1,423,340 $20,492,836 $145,315,574FF&E 0 0 0 0 0 0 0 0 $0Development Costs 0 0 0 0 200,000 2,000,000 200,000 0 $2,400,000 Total Thru 10 Years $32,184,340 $11,940,000 $91,939,524 $9,251,710 $145,315,574Land 0 0 0 0 0 0 0 0 $0Neg. CF 0 0 0 0 150,000 675,000 0 75,000 $900,000 Depreciation/Amort.
Total 0 0 0 0 0 0 0 0 451,364 2,742,579 812,024 687,024 $4,692,991 Year 1 $1,178,840 $628,571 $29,653 $0 $1,837,064 $1,837,064Year 2 $2,625,713 $165,714 $370,664 $0 $3,162,091 $4,999,156
2004 Jan Feb Mar Apr May June July Aug Sept Oct Nov Dec Total Year 3 $3,132,028 $918,571 $622,716 $0 $4,673,315 $9,672,471 Year 4 $3,141,273 $960,000 $756,155 $0 $4,857,428 $14,529,899Hard Bldg Costs 578,236 1,156,472 1,156,472 1,156,472 1,156,472 1,156,472 1,156,472 1,156,472 1,156,472 1,156,472 1,156,472 1,156,472 $13,299,428 Year 5 $3,038,344 $1,142,286 $1,111,992 $0 $5,292,622 $19,822,521Soft Costs 67,579 33,788 33,788 67,579 33,788 33,788 67,579 33,788 33,788 67,579 33,788 33,788 $540,620 Year 6 $2,996,676 $646,286 $1,245,431 $0 $4,888,393 $24,710,914FF&E 0 0 290,000 0 0 290,000 0 0 290,000 0 0 290,000 $1,160,000 Year 7 $3,255,465 $737,429 $1,556,789 $0 $5,549,683 $30,260,596Development Costs 0 200,000 0 0 200,000 0 0 200,000 0 0 200,000 0 $800,000 Year 8 $2,532,028 $919,714 $1,868,147 $0 $5,319,890 $35,580,486Land 0 0 0 355,835 0 0 355,835 0 0 355,835 0 0 $1,067,505 Year 9 $3,255,465 $812,000 $1,690,228 $0 $5,757,693 $41,338,179Neg. CF 675,000 0 75,000 675,000 0 75,000 675,000 0 75,000 675,000 0 75,000 $3,000,000 Year 10 $3,152,536 $803,714 $1,823,667 $0 $5,779,917 $47,118,097
Total 1,320,815 1,390,260 1,555,260 2,254,886 1,390,260 1,555,260 2,254,886 1,390,260 1,555,260 2,254,886 1,390,260 1,555,260 $19,867,553Total Thru 10 Years $28,308,368 $7,734,286 $11,075,443 $0 $47,118,097
2005 Jan Feb Mar Apr May June July Aug Sept Oct Nov Dec Total Hard Bldg Costs 1,156,472 1,156,472 1,156,472 1,156,472 1,156,472 1,156,472 1,156,472 578,236 578,236 578,236 $9,830,012Soft Costs 67,579 33,788 33,788 33,791 0 0 0 0 0 0 $168,946FF&E 0 0 290,000 0 0 290,000 0 0 290,000 0 $870,000Development Costs 0 0 0 0 0 0 0 0 0 0 $0Land 355,835 0 0 355,835 0 0 355,835 0 0 355,835 $1,423,340Neg. CF 675,000 0 0 675,000 0 0 0 0 0 0 $1,350,000
Total 2,254,886 1,190,260 1,480,260 2,221,098 1,156,472 1,446,472 1,512,307 578,236 868,236 934,071 0 0 $13,642,298
2006 Jan Feb Mar Apr May June July Aug Sept Oct Nov Dec Total Hard Bldg Costs $0 $0 $0 $0 $0 $0 $578,236 $578,236 $578,236 $1,156,472 $1,156,472 $1,156,472 $5,204,124Soft Costs $0 $0 $33,788 $33,788 $33,788 $67,579 $33,788 $33,788 $67,579 $33,788 $33,788 $67,579 $439,253FF&E $0 $0 $0 $0 $0 $0 $0 $0 $0 $0 $290,000 $0 $290,000Development Costs $200,000 $0 $0 $200,000 $0 $0 $200,000 $0 $0 $200,000 $0 $0 $800,000Land $0 $0 $0 $0 $0 $0 $0 $0 $0 $0 $0 $355,835 $355,835Neg. CF $0 $75,000 $0 $0 $75,000 $675,000 $0 $75,000 $675,000 $0 $75,000 $675,000 $2,325,000
Total $200,000 $75,000 $33,788 $233,788 $108,788 $742,579 $812,024 $687,024 $1,320,815 $1,390,260 $1,555,260 $2,254,886 $9,414,212
2007 Jan Feb Mar Apr May June July Aug Sept Oct Nov Dec Total Hard Bldg Costs $1,156,472 $1,156,472 $1,156,472 $1,156,472 $1,156,472 $1,156,472 $1,156,472 $1,156,472 $1,156,472 $1,156,472 $1,156,472 $1,156,472 $13,877,664Soft Costs $33,788 $33,788 $67,579 $33,788 $33,788 $67,579 $33,788 $33,788 $67,579 $33,788 $33,788 $33,791 $506,832FF&E $0 $290,000 $0 $0 $290,000 $0 $0 $290,000 $0 $0 $290,000 $0 $1,160,000Development Costs $200,000 $0 $0 $200,000 $0 $0 $200,000 $0 $0 $0 $0 $0 $600,000Land $0 $0 $355,835 $0 $0 $355,835 $0 $0 $355,835 $0 $0 $355,835 $1,423,340Neg. CF $0 $75,000 $675,000 $0 $75,000 $675,000 $0 $75,000 $675,000 $0 $0 $675,000 $2,925,000
Total $1,390,260 $1,555,260 $2,254,886 $1,390,260 $1,555,260 $2,254,886 $1,390,260 $1,555,260 $2,254,886 $1,190,260 $1,480,260 $2,221,098 $20,492,836
2008 Jan Feb Mar Apr May June July Aug Sept Oct Nov Dec Total Hard Bldg Costs $1,156,472 $1,156,472 $1,156,472 $578,236 $578,236 $578,236 $0 $0 $0 $0 $0 $0 $5,204,124Soft Costs $0 $0 $0 $0 $0 $0 $0 $0 $33,788 $33,788 $33,788 $67,579 $168,943FF&E $0 $290,000 $0 $0 $290,000 $0 $0 $0 $0 $0 $0 $0 $580,000Development Costs $0 $0 $0 $0 $0 $0 $200,000 $0 $0 $200,000 $0 $0 $400,000Land $0 $0 $355,835 $0 $0 $355,835 $0 $0 $0 $0 $0 $0 $711,670Neg. CF $0 $0 $0 $0 $0 $0 $0 $75,000 $0 $0 $75,000 $675,000 $825,000
Total $1,156,472 $1,446,472 $1,512,307 $578,236 $868,236 $934,071 $200,000 $75,000 $33,788 $233,788 $108,788 $742,579 $7,889,737
2009 Jan Feb Mar Apr May June July Aug Sept Oct Nov Dec Total Hard Bldg Costs $578,236 $578,236 $578,236 $1,156,472 $1,156,472 $1,156,472 $1,156,472 $1,156,472 $1,156,472 $1,156,472 $1,156,472 $1,156,472 $12,142,956Soft Costs $33,788 $33,788 $67,579 $33,788 $33,788 $67,579 $33,788 $33,788 $67,579 $33,788 $33,788 $67,579 $540,620FF&E $0 $0 $0 $0 $290,000 $0 $0 $290,000 $0 $0 $290,000 $0 $870,000Development Costs $200,000 $0 $0 $200,000 $0 $0 $200,000 $0 $0 $200,000 $0 $0 $800,000Land $0 $0 $0 $0 $0 $355,835 $0 $0 $355,835 $0 $0 $355,835 $1,067,505Neg. CF $0 $75,000 $675,000 $0 $75,000 $675,000 $0 $75,000 $675,000 $0 $75,000 $675,000 $3,000,000
Total $812,024 $687,024 $1,320,815 $1,390,260 $1,555,260 $2,254,886 $1,390,260 $1,555,260 $2,254,886 $1,390,260 $1,555,260 $2,254,886 $18,421,081
2010 Jan Feb Mar Apr May June July Aug Sept Oct Nov Dec Total Hard Bldg Costs $1,156,472 $1,156,472 $1,156,472 $1,156,472 $1,156,472 $1,156,472 $1,156,472 $1,156,472 $1,156,472 $578,236 $578,236 $578,236 $12,142,956Soft Costs $33,788 $33,788 $67,579 $33,788 $33,788 $33,791 $0 $0 $0 $0 $0 $0 $236,522FF&E $0 $290,000 $0 $0 $290,000 $0 $0 $290,000 $0 $0 $290,000 $0 $1,160,000Development Costs $200,000 $0 $0 $0 $0 $0 $0 $0 $0 $0 $0 $0 $200,000Land $0 $0 $355,835 $0 $0 $355,835 $0 $0 $355,835 $0 $0 $355,835 $1,423,340Neg. CF $0 $75,000 $675,000 $0 $0 $675,000 $0 $0 $0 $0 $0 $0 $1,425,000
Total $1,390,260 $1,555,260 $2,254,886 $1,190,260 $1,480,260 $2,221,098 $1,156,472 $1,446,472 $1,512,307 $578,236 $868,236 $934,071 $16,587,818
2011 Jan Feb Mar Apr May June July Aug Sept Oct Nov Dec Total Hard Bldg Costs $0 $0 $0 $0 $0 $0 $578,236 $578,236 $578,236 $1,156,472 $1,156,472 $1,156,472 $5,204,124Soft Costs $0 $0 $33,788 $33,788 $33,788 $67,579 $33,788 $33,788 $67,579 $33,788 $33,788 $67,579 $439,253FF&E $0 $0 $0 $0 $0 $0 $0 $0 $0 $0 $290,000 $0 $290,000Development Costs $200,000 $0 $0 $200,000 $0 $0 $200,000 $0 $0 $200,000 $0 $0 $800,000Land $0 $0 $0 $0 $0 $0 $0 $0 $0 $0 $0 $355,835 $355,835Neg. CF $0 $75,000 $0 $0 $75,000 $675,000 $0 $75,000 $675,000 $0 $75,000 $675,000 $2,325,000
Total $200,000 $75,000 $33,788 $233,788 $108,788 $742,579 $812,024 $687,024 $1,320,815 $1,390,260 $1,555,260 $2,254,886 $9,414,212
2012 Jan Feb Mar Apr May June July Aug Sept Oct Nov Dec Total Hard Bldg Costs $1,156,472 $1,156,472 $1,156,472 $1,156,472 $1,156,472 $1,156,472 $1,156,472 $1,156,472 $1,156,472 $1,156,472 $1,156,472 $1,156,472 $13,877,664Soft Costs $33,788 $33,788 $67,579 $33,788 $33,788 $67,579 $33,788 $33,788 $67,579 $33,788 $33,788 $33,791 $506,832FF&E $0 $290,000 $0 $0 $290,000 $0 $0 $290,000 $0 $0 $290,000 $0 $1,160,000Development Costs $200,000 $0 $0 $200,000 $0 $0 $200,000 $0 $0 $0 $0 $0 $600,000Land $0 $0 $355,835 $0 $0 $355,835 $0 $0 $355,835 $0 $0 $355,835 $1,423,340Neg. CF $0 $75,000 $675,000 $0 $75,000 $675,000 $0 $75,000 $675,000 $0 $0 $675,000 $2,925,000
Total $1,390,260 $1,555,260 $2,254,886 $1,390,260 $1,555,260 $2,254,886 $1,390,260 $1,555,260 $2,254,886 $1,190,260 $1,480,260 $2,221,098 $20,492,836
Dep/Amort Categories 2003 2004 2005 2006 2007 2008 2009 2010 2011 2012 Total
3 Years $3,536,519 $4,340,620 $1,518,946 $3,564,253 $4,031,832 $1,393,943 $4,340,620 $1,861,522 $3,564,253 $4,031,832 $32,184,3407 Years $0 $1,160,000 $870,000 $290,000 $1,160,000 $580,000 $870,000 $1,160,000 $290,000 $1,160,000 $7,540,00039 Years $1,156,472 $13,299,428 $9,830,012 $5,204,124 $13,877,664 $5,204,124 $12,142,956 $12,142,956 $5,204,124 $13,877,664 $91,939,524Non-Deprc/Non-Amort $0 $1,067,505 $1,423,340 $355,835 $1,423,340 $711,670 $1,067,505 $1,423,340 $355,835 $1,423,340 $9,251,710
Total Revenue $4,692,991 $19,867,553 $13,642,298 $9,414,212 $20,492,836 $7,889,737 $18,421,081 $16,587,818 $9,414,212 $20,492,836 $140,915,574
CAPITAL EXPENDITURES, DEPRECIATION AND AMORTIZATION SCHEDULECAP EX TABLE

COMPANY
2003 Jan Feb Mar Apr May June July Aug Sept Oct Nov Dec TotalRevenues
Beds at Rate 1 $264,040 $272,090 $272,090 $280,140 $280,140 $315,560 $350,980 $350,980 $350,980 $350,980 $350,980 $383,180 $3,822,140Beds at Rate 2 $68,880 $70,980 $70,980 $73,080 $73,080 $82,320 $91,560 $91,560 $91,560 $91,560 $91,560 $99,960 $997,080Beds at Rate 3 $78,720 $81,120 $81,120 $83,520 $83,520 $94,080 $104,640 $104,640 $104,640 $104,640 $104,640 $114,240 $1,139,520
Total Revenues $411,640 $424,190 $424,190 $436,740 $436,740 $491,960 $547,180 $547,180 $547,180 $547,180 $547,180 $597,380 $5,958,740
Operating CostsCost of Goods Sold $229,712 $236,715 $236,715 $243,718 $243,718 $274,533 $305,348 $305,348 $305,348 $305,348 $305,348 $333,362 $3,325,215Corporate G&A Expenses $43,970 $43,970 $43,970 $43,970 $43,970 $43,970 $66,220 $66,220 $66,220 $68,761 $68,761 $68,761 $668,764Mortgage/Bond Interest $72,037 $74,233 $74,233 $76,430 $76,430 $73,430 $73,430 $73,430 $297,917 $297,917 $297,917 $297,917 $1,785,321CapEx $0 $0 $0 $0 $0 $0 $0 $0 $4,851,364 $2,742,579 $812,024 $687,024 $9,092,991
Total Operating Costs $345,719 $354,918 $354,918 $364,118 $364,118 $391,933 $444,998 $444,998 $5,520,849 $3,414,606 $1,484,051 $1,387,064 $14,872,291
Operating Surplus(Deficit) $65,921 $69,272 $69,272 $72,622 $72,622 $100,027 $102,182 $102,182 -$4,973,669 -$2,867,426 -$936,871 -$789,684 -$8,913,551
Cumulative Surplus(Deficit) $65,921 $135,193 $204,465 $277,087 $349,709 $449,736 $551,917 $654,099 -$4,319,570 -$7,186,996 -$8,123,866 -$8,913,551
2004 Jan Feb Mar Apr May June July Aug Sept Oct Nov Dec TotalRevenues
Beds at Rate 1 $364,780 $355,810 $394,680 $454,480 $499,330 $499,330 $499,330 $544,180 $544,180 $544,180 $589,030 $589,030 $5,878,340Beds at Rate 2 $102,480 $99,960 $110,880 $127,680 $140,280 $140,280 $140,280 $152,880 $152,880 $152,880 $165,480 $165,480 $1,651,440Beds at Rate 3 $156,160 $152,320 $168,960 $194,560 $213,760 $213,760 $213,760 $232,960 $232,960 $232,960 $252,160 $252,160 $2,516,480
Total Revenues $623,420 $608,090 $674,520 $776,720 $853,370 $853,370 $853,370 $930,020 $930,020 $930,020 $1,006,670 $1,006,670 $10,046,260
Operating CostsCost of Goods Sold $467,185 $467,185 $467,185 $467,185 $467,185 $467,185 $467,185 $467,185 $467,185 $467,185 $467,185 $467,185 $5,606,215Corporate G&A Expenses $95,333 $95,333 $95,333 $95,333 $95,333 $95,333 $95,333 $95,333 $95,333 $95,333 $95,333 $95,333 $1,144,000Mortgage/Bond Interest $297,917 $297,917 $297,917 $297,917 $297,917 $297,917 $297,917 $297,917 $297,917 $297,917 $297,917 $297,917 $3,575,000CapEx $1,320,815 $1,390,260 $1,555,260 $2,254,886 $1,390,260 $1,555,260 $2,254,886 $1,390,260 $1,555,260 $2,254,886 $1,390,260 $1,555,260 $19,867,553
Total Operating Costs $2,181,250 $2,250,695 $2,415,695 $3,115,321 $2,250,695 $2,415,695 $3,115,321 $2,250,695 $2,415,695 $3,115,321 $2,250,695 $2,415,695 $30,192,768
Operating Surplus(Deficit) -$1,557,830 -$1,642,605 -$1,741,175 -$2,338,601 -$1,397,325 -$1,562,325 -$2,261,951 -$1,320,675 -$1,485,675 -$2,185,301 -$1,244,025 -$1,409,025 -$20,146,508
Cumulative Surplus(Deficit) -$1,557,830 -$3,200,434 -$4,941,609 -$7,280,209 -$8,677,534 -$10,239,858 -$12,501,809 -$13,822,484 -$15,308,158 -$17,493,459 -$18,737,483 -$20,146,508
2005 Jan Feb Mar Apr May June July Aug Sept Oct Nov Dec TotalRevenues
Beds at Rate 1 $661,440 $723,840 $723,840 $723,840 $848,640 $848,640 $848,640 $973,440 $973,440 $973,440 $1,098,240 $1,098,240 $10,495,680Beds at Rate 2 $184,440 $201,840 $201,840 $201,840 $236,640 $236,640 $236,640 $271,440 $271,440 $271,440 $306,240 $306,240 $2,926,680Beds at Rate 3 $279,840 $306,240 $306,240 $306,240 $359,040 $359,040 $359,040 $411,840 $411,840 $411,840 $464,640 $464,640 $4,440,480
Total Revenues $1,125,720 $1,231,920 $1,231,920 $1,231,920 $1,444,320 $1,444,320 $1,444,320 $1,656,720 $1,656,720 $1,656,720 $1,869,120 $1,869,120 $17,862,840
Operating CostsCost of Goods Sold $830,682 $830,682 $830,682 $830,682 $830,682 $830,682 $830,682 $830,682 $830,682 $830,682 $830,682 $830,682 $9,968,179Corporate G&A Expenses $116,281 $116,281 $116,281 $116,281 $116,281 $116,281 $116,281 $116,281 $116,281 $116,281 $116,281 $116,281 $1,395,370Mortgage/Bond Interest $297,917 $297,917 $297,917 $297,917 $297,917 $297,917 $297,917 $297,917 $297,917 $297,917 $297,917 $297,917 $3,575,000CapEx $2,254,886 $1,190,260 $1,480,260 $2,221,098 $1,156,472 $1,446,472 $1,512,307 $578,236 $868,236 $934,071 $0 $0 $13,642,298
Total Operating Costs $3,499,765 $2,435,139 $2,725,139 $3,465,977 $2,401,351 $2,691,351 $2,757,186 $1,823,115 $2,113,115 $2,178,950 $1,244,879 $1,244,879 $28,580,847
Operating Surplus(Deficit) -$2,374,045 -$1,203,219 -$1,493,219 -$2,234,057 -$957,031 -$1,247,031 -$1,312,866 -$166,395 -$456,395 -$522,230 $624,241 $624,241 -$10,718,007
Cumulative Surplus(Deficit) -$2,374,045 -$3,577,264 -$5,070,483 -$7,304,540 -$8,261,572 -$9,508,603 -$10,821,469 -$10,987,864 -$11,444,259 -$11,966,489 -$11,342,248 -$10,718,007
Projected Monthly Cash Inflow and Outlays - CORE ALF ONLY - NO INTEREST OR DEVELOPER INCOME
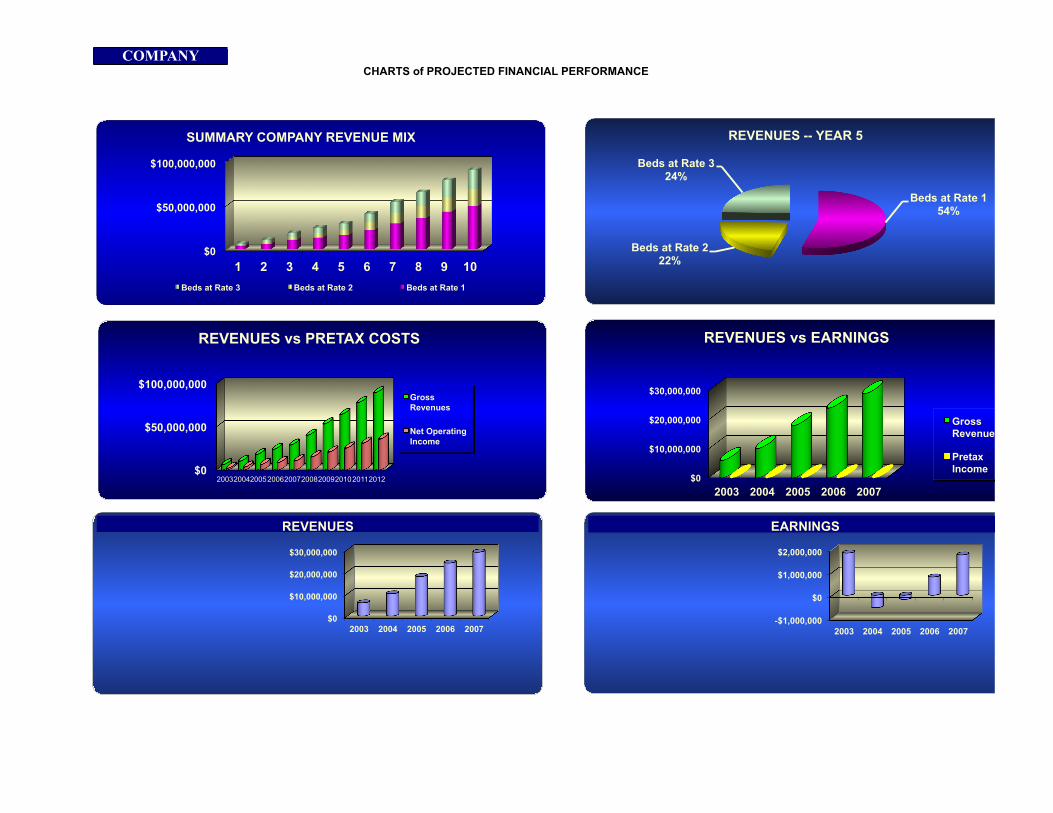
CHARTS of PROJECTED FINANCIAL PERFORMANCECOMPANY
$0
$10,000,000
$20,000,000
$30,000,000
2003 2004 2005 2006 2007
REVENUES vs EARNINGS
Gross Revenues
Pretax Income $0
$50,000,000
$100,000,000
2003 2004 2005 2006 2007 2008 2009 2010 2011 2012
REVENUES vs PRETAX COSTS
Gross Revenues
Net Operating Income
$0
$10,000,000
$20,000,000
$30,000,000
2003 2004 2005 2006 2007
REVENUES
-$1,000,000
$0
$1,000,000
$2,000,000
2003 2004 2005 2006 2007
EARNINGS
$0
$50,000,000
$100,000,000
1 2 3 4 5 6 7 8 9 10
SUMMARY COMPANY REVENUE MIX
Beds at Rate 3 Beds at Rate 2 Beds at Rate 1
Beds at Rate 1 54%
Beds at Rate 2 22%
Beds at Rate 3 24%
REVENUES -- YEAR 5
($500,000) $0 $500,000 $1,000,000 $1,500,000 $2,000,000 $2,500,000
2003 2004 2005 2006 2007 2008 2009 2010 2011 2012
PROJECTED PRICE PER UNIT p/e = 10
Beds at Rate 1
59% Beds at Rate
2 16%
Beds at Rate 3
25%
COMPANY REVENUE MIX - YEAR 2


