
Insert Cover Image using Slide Master View
Do not distort
Solar Photovoltaic Market – India
November 2014

2 SOLAR PHOTOVOLTAIC MARKET IN INDIA 2014.PPT
Executive Summary
Market
Solar PV market in India is expected to grow at a CAGR of ~x% between 2014 and 2018 to reach ~xx GW
Although overall project costs are rising, the market has continued to grow steadily
Gujarat and Rajasthan together account for ~y% of the total solar PV installations in India
Drivers and Challenges
Competitive Landscape
Drivers – Feasible Geographical Location
– Declining Capital Costs for Solar PV
– Dropping Solar Power Rates
– Depleting Coal Reserves
– India Remains Energy Deficient
– Increasing Cost of Electricity from Conventional Sources
– Time of Commissioning
Government Initiatives
Major Players
Company A Company B Company C
Company D Company E Company F
Major Government Bodies
Research and Development Initiatives
Jawaharlal Nehru National Solar Mission (JNNSM)
Subsidies and Incentives
Rural Electrification Programme
Challenges – Capital Intensive Nature
– Competition from Chinese Firms
– Lack of Awareness

3
•Macro-Economic Indicators
•Introduction
•Market Overview
•Supply Chain Analysis
•Drivers and Challenges
•Government Initiatives
•Trends
•Recent Developments
•Competitive Landscape
•Strategic Recommendations
•Appendix
SOLAR PHOTOVOLTAIC MARKET IN INDIA 2014.PPT

4
SAMPLE Economic Indicators (1/3)
D
C
B
A
11
INR tn
Q4
x4
a4
b4
Q3
x3
a3
b3
Q2
x2 a2
b2
c2
Q1
x1 a1
b1
c1
2013-14 2012-13 2011-12 2010-11
GDP at Factor Cost: Quarterly
Inflation Rate: Monthly
B
A
0
A
B
%
Nov 2013 - Dec 2013
a4
Oct 2013 - Nov 2013
a4
Sep 2013 - Oct 2013
a3
Aug 2013 - Sep 2013
a2
Jul 2013 - Aug 2013
a1
SOLAR PHOTOVOLTAIC MARKET IN INDIA 2014.PPT

5
SAMPLE Renewable energy is gaining prominence in India’s power sector
Renewable Energy Market Segmentation
A3
A2
A1
A4
A3
A2
A1 A4
Small Hydro Power
Solar
Bio-Power
Wind
Renewable
Hydro
Nuclear
Thermal
Total installed capacity of power is
~A GW
Total installed capacity of
renewable energy is A GW
• Principal sources of renewable energy are:
Wind Energy
Small Hydro up to 25 MW
Biogas
Solar Energy ⁻ Solar Thermal
⁻ Solar Photovoltaic (PV)
• Renewable energy capacity reached x GW presently,
accounting for a% of the total installed power capacity in
India
• India plans to double its renewable energy capacity to xx
MW by 2017
• Government plans to add xx GW of renewable power
generation over the next five years, more than twice the
xx GW added during the 11th Five Year Plan
• The Ministry of New and Renewable Energy (MNRE)
plans to increase the total renewable energy capacity to
more than xx GW during 2012-17
Note: Figures are in terms of Installed Capacity, as on 31st Jul 2014
Renewable Energy Scenario Energy Market Segmentation
SOLAR PHOTOVOLTAIC MARKET IN INDIA 2014.PPT

6
SAMPLE PV systems are generally classified according to their functional and operational requirements
Cell Material Module Efficiency Surface Area Requirement
(per KWp)
Monocrystalline silicon XX XX
Polycrystalline silicon XX XX
Thin film (CI/GS/Se) XX XX
Thin-film (CdTe) XX XX
Amorphous silicon (a-Si) XX XX
PV Cells – Overview
Grid Connected
XX
Types of PV Systems
XX Off-grid
XX Hybrid System
SOLAR PHOTOVOLTAIC MARKET IN INDIA 2014.PPT

7
SAMPLE Solar Photovoltaic Market will have a significant rate of growth in the near future
• XX
• XX
• XX
• XX
• XX
• XX
• XX
• XX
Solar Photovoltaic Market – Overview (1/x)
Cumulative PV Installed Capacity – Growth
D
C
B
A
0
MW
XX
FY 2018e
a10
FY 2014
a6
FY 2013
a5
FY 2012
a4
FY 2017e
a9
FY 2016e
a8
FY 2015e
a7
FY 2011
a3
FY 2010
a2
FY 2009
a1
SOLAR PHOTOVOLTAIC MARKET IN INDIA 2014.PPT

8
SAMPLE Photovoltaic market in India is largely import dependent with current low domestic manufacturing capacity
Modules Used – Segmentation Indian Solar PV Manufacturing Capacity (MW)
x
y
Thin Film
Crystalline
2012
E D C B A
MW
Modules E
Cells D
Wafers C
Ingot B
Polysilicon A
2012
Solar Photovoltaic Market – Overview (2/x)
Quarterly Capacity Additions Policy – Wise Capacity Contribution (2013)
A
0
C
B
Q4 2013 (Jan-Mar)
a4
Q3 2013 (Oct-Dec)
a3
Q2 2013 (Jul-Sep)
a2
Q1 2013 (Apr-Jun)
a1
MW D
C
B A
F
E
RPO
REC
Private Initiative
CPSUs
MNRE Initiatives
State Policy
SOLAR PHOTOVOLTAIC MARKET IN INDIA 2014.PPT
9
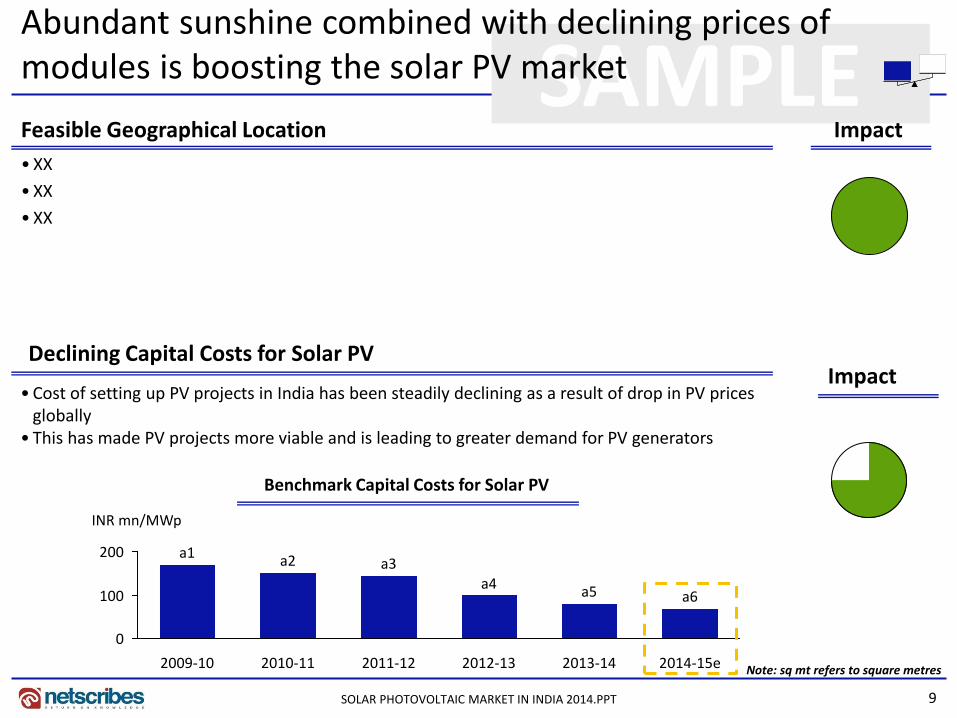
SAMPLE Abundant sunshine combined with declining prices of modules is boosting the solar PV market
Impact
• XX
• XX
• XX
Feasible Geographical Location
Impact • Cost of setting up PV projects in India has been steadily declining as a result of drop in PV prices
globally • This has made PV projects more viable and is leading to greater demand for PV generators
Declining Capital Costs for Solar PV
Benchmark Capital Costs for Solar PV
200
100
0
INR mn/MWp
2014-15e
a6
2013-14
a5
2012-13
a4
2011-12
a3
2010-11
a2
2009-10
a1
Note: sq mt refers to square metres
SOLAR PHOTOVOLTAIC MARKET IN INDIA 2014.PPT

10
SAMPLE • Price of electricity has been rising due to increase in the price of coal
• According to Coal India, average increase in the price of Grade E coal will be xx% while that of Grade F coal will be x%
• As a result we see the price of electricity has been increasing over the years
• The tariff rates have been rising at a CAGR of a% since 2010
• Increase in the price of conventionally generated electricity has further propelled the need for electricity generated through renewable sources
Increasing Cost of Electricity from Conventional Sources
Rising cost of electricity along with time of commissioning is boosting the solar PV market
Impact
Impact
• Solar photovoltaic power projects take the least time of commissioning • Other renewable energy sources involve much longer time to get design objectives and
specifications of the project verified
Time of Commissioning
P O N M L K J I B A 0.0 H G F E D C
Years
a4
Gas a3
Wind a2
Solar PV
Hydro a5
Coal
a1
Years of Commissioning
SOLAR PHOTOVOLTAIC MARKET IN INDIA 2014.PPT

11
SAMPLE Subsidy structure of solar cells are hurting domestic solar industry
Impact
• China is one the biggest economies when it comes to solar PV along with Italy and Germany
• China has a global market share of approximately x% in PV cells and xx% in the PV modules industry
• China exports about x% of its solar manufactures at very cheap prices
• Dumping activities by Chinese firms are bleeding the domestic solar manufacturing industry
• Indian firms are producing at only x-y% of their total capacity due to the excess supply
Competition from Chinese Firms
Import of PV cells from China
D
C
B
A
0 a2
2009
a1
a5
2012
a4
2011
a3
2010
INR mn
A
2014
a6
2013
Note: Figures are for the respective fiscal years HS Code: 85414011 Solar Cells/Photovoltaic Cells Whether Or Not Assembled In Module/Panel
SOLAR PHOTOVOLTAIC MARKET IN INDIA 2014.PPT

12
SAMPLE Major Government Bodies
Key Government bodies working towards the development of solar PV energy and other renewable energy resources
XX XX XX
• XX • XX • XX
SOLAR PHOTOVOLTAIC MARKET IN INDIA 2014.PPT

13
SAMPLE Government initiated the Jawaharlal Nehru National Solar Mission to…
Jawaharlal Nehru National Solar Mission (JNNSM)
• XX
• XX • XX • XX • XX • XX
Schemes • XX • XX
Targets
Overview
Outcome • XX • XX
Applications Segmented 2020 Target (MW)
On-grid Ground-mount X
Off and On-Grid Building-mount X
Off-grid Rural X
Off-grid Industrial X
SOLAR PHOTOVOLTAIC MARKET IN INDIA 2014.PPT

14
SAMPLE …facilitate growth and development of the solar photovoltaic sector
Jawaharlal Nehru National Solar Mission (JNNSM)
Application Segment Target for Phase I
(2010-13)
Cumulative Target for Phase-II (2013-17)
Cumulative Target for Phase-III
(2017-22)
X X X X
X X X X
X X X X
Special Incentive Packages
• XX
• XX
• XX
• XX
SOLAR PHOTOVOLTAIC MARKET IN INDIA 2014.PPT

15
SAMPLE Advent of cost effective solar hybrid generators has widened the consumer base
Solar Hybrid Generators
Solar PV and Wind Solar PV and Diesel
XX
•XX •XX
XX
SOLAR PHOTOVOLTAIC MARKET IN INDIA 2014.PPT

16
SAMPLE Policy and Project Outlook
State Policies
XX XX
XX XX
XX XX
XX XX
XX XX
XX XX
XX XX
• XX
SOLAR PHOTOVOLTAIC MARKET IN INDIA 2014.PPT

17
SAMPLE Policy and Project Outlook
Renewable Purchase Obligation
XX
States Favorable Neutral
XX XX XX
XX XX XX
XX XX XX
XX XX XX
Analysis of State-Wise RPO Regulation Across India(1/x)
SOLAR PHOTOVOLTAIC MARKET IN INDIA 2014.PPT

18
SAMPLE Porter’s Five Forces Analysis
Competitive Rivalry
XX
Bargaining Power of Suppliers
XX
Bargaining Power of Buyers
XX
Threat of Substitutes
XX
Threat of New Entrants
XX
Impact XX
Impact XX
Impact XX
Impact XX
Impact XX
SOLAR PHOTOVOLTAIC MARKET IN INDIA 2014.PPT

19
SAMPLE Competitive Benchmarking (1/x)
Public Trading Comparable (FY 2013)
Company A Company B Company C Company D
Market Capitalization (INR mn) XX XX XX XX
Share Price (INR) XX XX XX XX
EV/EBITDA (x) XX XX XX XX
EV/Revenue (x) XX XX XX XX
PE Ratio XX XX XX XX
Note: Market Capitalization is as on 08/09/2014; Share Price is as on 05/09/2014; PE Ratio is as on 08/09/2014
SOLAR PHOTOVOLTAIC MARKET IN INDIA 2014.PPT

20
SAMPLE Key Ratios of Top 3 Companies – Operational Basis (FY 2013) (1/3)
Competitive Benchmarking (2/x)
A
0
B
C
%
Company C
a2 a1
c2 c1
Company B
b2
b1
Company A
Operating Margin Net Margin
• XX
• XX
• XX
SOLAR PHOTOVOLTAIC MARKET IN INDIA 2014.PPT

21
SAMPLE Public: Domestic Company – Company A (1/4)
Key People
Products and Services
Company Information Offices and Centres – India
Corporate Address XX
Tel No. XX
Fax No. XX
Website XX
Year of Incorporation XX
Ticker Symbol XX
Stock Exchange XX
Category Products/Services
Solar PV XX Name Designation
XX XX
XX XX
XX XX
XX XX
Head Office
Kolkata
SOLAR PHOTOVOLTAIC MARKET IN INDIA 2014.PPT

22
SAMPLE Financial Snapshot Key Ratios
Financial Summary
• The company incurred a net loss of INR 212.1 mn in FY 2013, as compared to net loss of INR 1,666.9 mn in FY 2012
• The company reported total income of INR 1,819.5 mn in FY 2013, registering a decrease of 37.35% over FY 2012
• The company earned an operating margin of -7.28% in FY 2013, an increase of 89.68 percentage points over FY 2012
• The company reported debt to equity ratio of negative 4.93 in FY 2013
Key Financial Performance Indicators
Indicators Value (08/09/2014)
Market Capitalization (INR mn) 390.0
Total Enterprise Value (INR mn) 5,465.7
EPS (INR) -27.96
PE Ratio (Absolute) N.A.
Net Profit/Loss Total Income
-212.1
-1,666.9
-17.8
0
1000
2000
3000
-2,000
-1,500
-1,000
-500
0
INR mn INR mn
2013
1819.5
2012
1324.7
2011
2061.5
Public: Domestic Company – Company A (2/4)
Particulars y-o-y change
(2013-12) 2013 2012 2011
Profitability Ratios
Operating Margin 89.68 -7.28% -96.95% 4.79%
Net Margin 114.17 -11.66% -125.83% -0.87%
Profit Before Tax Margin 114.17 -11.66% -125.83% 0.78%
Return on Equity N.A. 31.13% N.A. -0.98%
Return on Capital Employed N.A. -6.85% N.A. 2.21%
Return on Working Capital N.A. 6.88% N.A. 169.70%
Return on Assets N.A. -2.50% N.A. 1.59%
Return on Fixed Assets N.A. -3.90% N.A. 2.80%
Cost Ratios Operating costs (% of Sales) -89.96 108.69% 198.65% 95.00%
Administration costs (% of Sales) 2.48 6.30% 3.82% 4.52%
Interest costs (% of Sales) -1.43 16.06% 17.49% 8.35%
Liquidity Ratios Current Ratio N.A. 0.43 N.A. 1.03
Cash Ratio N.A. 0.03 N.A. 0.16
Leverage Ratios Debt to Equity Ratio N.A. -4.93 N.A. 1.74
Debt to Capital Ratio N.A. 1.25 N.A. 0.63
Interest Coverage Ratio -90.40% -0.54 -5.64 0.60
Efficiency Ratios Fixed Asset Turnover N.A. 0.45 N.A. 0.56
Asset Turnover N.A. 0.29 N.A. 0.32
Current Asset Turnover N.A. 1.05 N.A. 1.09
Working Capital Turnover N.A. -0.79 N.A. 33.95
Capital Employed Turnover N.A. 0.57 N.A. 0.40
Improved Decline
SOLAR PHOTOVOLTAIC MARKET IN INDIA 2014.PPT

23
SAMPLE Key Business Segments Key Geographic Segments
Business Highlights
Description News
Overview XX
Manufacturing Capacity XX
100%
0%
20%
40%
60%
80%
100%
2013
100%
80%
60%
40%
20%
0%
2012
100% India
India is the only geographic segment in which the company has
been operating for the last four years
Public: Domestic Company – Company A (3/4)
Solar Photovoltaic Cells and Modules
It operates only in the solar PV cells and modules segment
SOLAR PHOTOVOLTAIC MARKET IN INDIA 2014.PPT

24
SAMPLE
• XX • XX
• XX • XX
T O
W S
Public: Domestic Company – Company A (4/4)
SOLAR PHOTOVOLTAIC MARKET IN INDIA 2014.PPT

25
SAMPLE
Key People
Products and Services
Company Information Offices and Centres – India
Category Products/Services
Solar PV Solutions
On-Grid Modules, Off-Grid Modules, Polycrystalline Modules, Monocrystalline Modules and Customized PV System
Name Designation
• XX • XX
• XX • XX
• XX • XX
• XX • XX
Corporate Address • XX
Tel No. • XX
Fax No. • XX
Website • XX
Year of Incorporation • XX
Private: Domestic Company – Company B (1/5)
Head Office Bangalore
SOLAR PHOTOVOLTAIC MARKET IN INDIA 2014.PPT

26
SAMPLE Shareholders of the Company as on 30/09/2013 Ownership Structure
Name No. of Shares held
• XX • XX
• XX • XX
• XX • XX
• XX • XX
Note: Ownership structure corresponds to Date of AGM: 30/09/2013
Private: Domestic Company – Company B (2/5)
100.0%
Directors or relatives of directors
SOLAR PHOTOVOLTAIC MARKET IN INDIA 2014.PPT
27
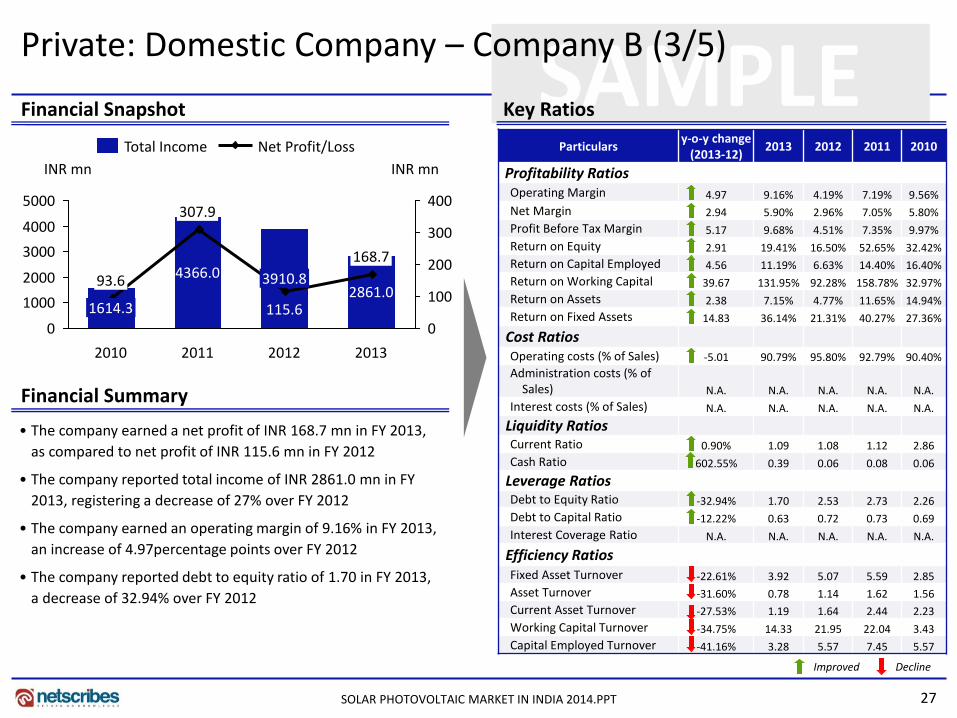
SAMPLE Financial Snapshot Key Ratios
Particulars y-o-y change
(2013-12) 2013 2012 2011 2010
Profitability Ratios
Operating Margin 4.97 9.16% 4.19% 7.19% 9.56%
Net Margin 2.94 5.90% 2.96% 7.05% 5.80%
Profit Before Tax Margin 5.17 9.68% 4.51% 7.35% 9.97%
Return on Equity 2.91 19.41% 16.50% 52.65% 32.42%
Return on Capital Employed 4.56 11.19% 6.63% 14.40% 16.40%
Return on Working Capital 39.67 131.95% 92.28% 158.78% 32.97%
Return on Assets 2.38 7.15% 4.77% 11.65% 14.94%
Return on Fixed Assets 14.83 36.14% 21.31% 40.27% 27.36%
Cost Ratios
Operating costs (% of Sales) -5.01 90.79% 95.80% 92.79% 90.40%
Administration costs (% of Sales) N.A. N.A. N.A. N.A. N.A.
Interest costs (% of Sales) N.A. N.A. N.A. N.A. N.A.
Liquidity Ratios
Current Ratio 0.90% 1.09 1.08 1.12 2.86
Cash Ratio 602.55% 0.39 0.06 0.08 0.06
Leverage Ratios
Debt to Equity Ratio -32.94% 1.70 2.53 2.73 2.26
Debt to Capital Ratio -12.22% 0.63 0.72 0.73 0.69
Interest Coverage Ratio N.A. N.A. N.A. N.A. N.A.
Efficiency Ratios
Fixed Asset Turnover -22.61% 3.92 5.07 5.59 2.85
Asset Turnover -31.60% 0.78 1.14 1.62 1.56
Current Asset Turnover -27.53% 1.19 1.64 2.44 2.23
Working Capital Turnover -34.75% 14.33 21.95 22.04 3.43
Capital Employed Turnover -41.16% 3.28 5.57 7.45 5.57
Improved Decline
Financial Summary
• The company earned a net profit of INR 168.7 mn in FY 2013,
as compared to net profit of INR 115.6 mn in FY 2012
• The company reported total income of INR 2861.0 mn in FY
2013, registering a decrease of 27% over FY 2012
• The company earned an operating margin of 9.16% in FY 2013,
an increase of 4.97percentage points over FY 2012
• The company reported debt to equity ratio of 1.70 in FY 2013,
a decrease of 32.94% over FY 2012
Net Profit/Loss Total Income
200
300
400
100
0
5000
4000
3000
2000
1000
0
INR mn INR mn
2013
168.7
2861.0
2012
115.6
3910.8
2011
307.9
4366.0
2010
93.6
1614.3
Private: Domestic Company – Company B (3/5)
SOLAR PHOTOVOLTAIC MARKET IN INDIA 2014.PPT

28
SAMPLE Business Highlights
Description News
Overview • XX
Sales Network • XX
Certification • XX
Awards and Accolades • XX
Recent Developments • XX
Private: Domestic Company – Company B (4/5)
SOLAR PHOTOVOLTAIC MARKET IN INDIA 2014.PPT
29
SAMPLE
• XX • XX
• XX • XX
T O
W S
Private: Domestic Company – Company B (5/5)
SOLAR PHOTOVOLTAIC MARKET IN INDIA 2014.PPT

30
Thank you for the attention
About Netscribes, Inc. Netscribes, Inc. is a knowledge-consulting and solutions firm with clientele across the globe. The company’s expertise spans areas of investment and business research, business and corporate intelligence, content-management services, and knowledge-software services. At its core lies a true value proposition that draws upon a vast knowledge base. Netscribes Inc. is a one-stop shop designed to fulfil clients’ profitability and growth objectives.
Disclaimer: This report is published for general information only. Although high standards have been used in the preparation, “Netscribes” is not responsible for any loss or damage arising from use of this document. This document is the sole property of Netscribes and prior permission is required for guidelines on reproduction.
Phone: +91 22 4098 7600 E-Mail: [email protected]
The Solar Photovoltaic Market – India 2014 report is a part of Netscribes’ Energy Series For any queries or customized research requirements, contact us at:


