Download - Market Factors

Market Factors
December 2012
Tim Vorpahl
Vorpahl Wing Securities, Inc.505 W. Riverside Ave., Ste 205
Spokane, WA 99201(509) 747-1749
Vorpahl Wing Securities
INVESTMENT ADVICE FOR EVERY GENERATION
NOT FDIC INSURED. MAY LOSE VALUE. NO BANK GUARANTEE. NOT INSURED BY ANY GOVERNMENT AGENCY.

The P/E ratios of the S&P 500 (shown left ending at December 5th 2012, and are for the estimated earnings of the companies next year) help show that the stock market has made a healthy recovery from the lows of 2009.
According to the Wall Street Journal, on December 5th, 2012 the forward P/E of the S & P 500 was 13.27
Market Performance
Graph made with information taken from the Wall Street Journal
10
15
20
25
30
35
40
45
50
55
60
65
13.57
P/E Ratios of the S&P 500

After rising steadily at the start of 2012, the market appeared to have had a bit of a correction in May, and appears to be rising since then.
Dow Jones Industrial Average January 9th, 2012
• Graph Taken From Yahoo! Finance
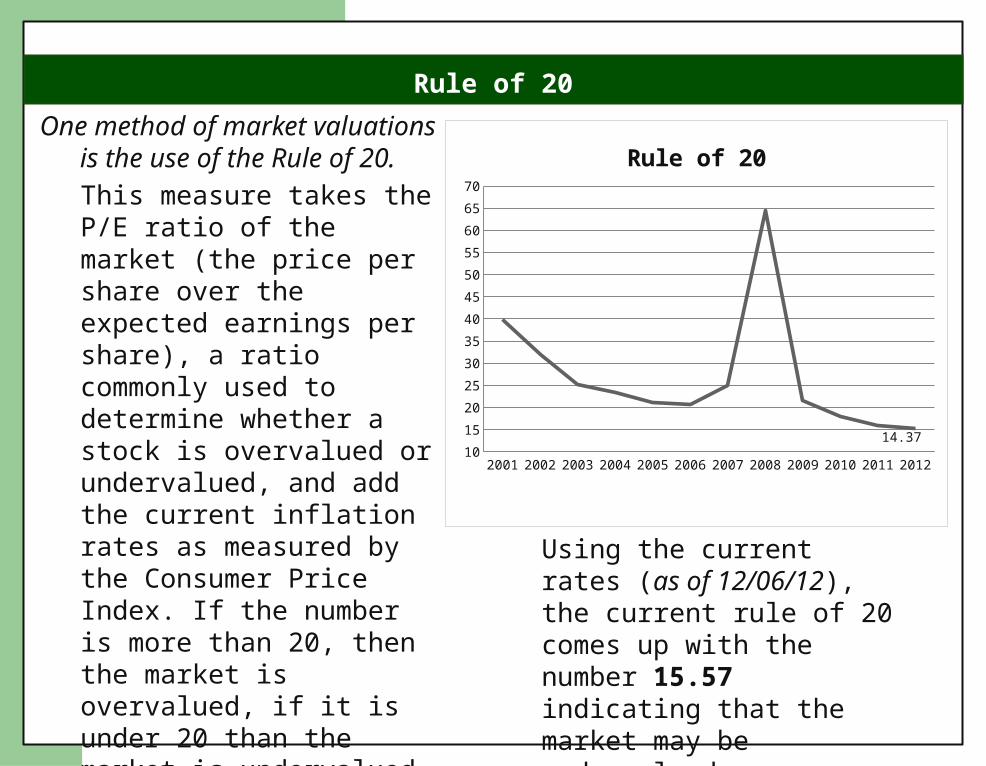
Using the current rates (as of 12/06/12), the current rule of 20 comes up with the number 15.57 indicating that the market may be undervalued.
Rule of 20
One method of market valuations is the use of the Rule of 20.
This measure takes the P/E ratio of the market (the price per share over the expected earnings per share), a ratio commonly used to determine whether a stock is overvalued or undervalued, and add the current inflation rates as measured by the Consumer Price Index. If the number is more than 20, then the market is overvalued, if it is under 20 than the market is undervalued.
P/E + CPI = Rule of 20P/E taken from WSJ.com and CPI from the Bureau of
Labor & Statistics.
2001 2002 2003 2004 2005 2006 2007 2008 2009 2010 2011 201210
15
20
25
30
35
40
45
50
55
60
65
70
14.37
Rule of 20
Graph taken November 5th, 2012
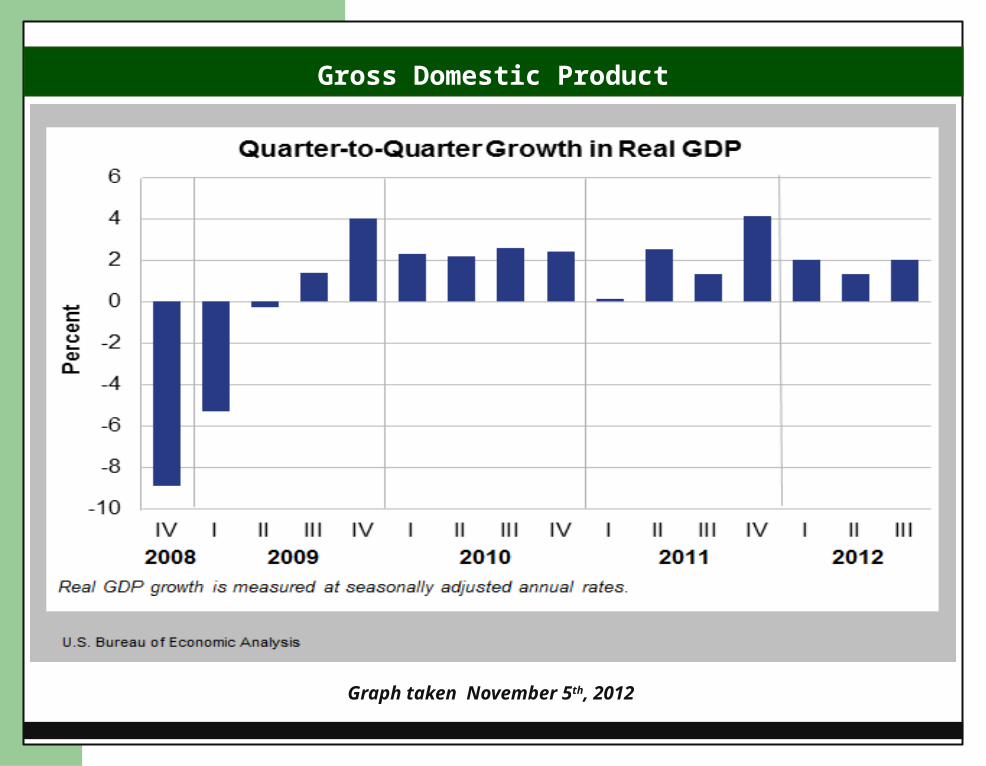
Gross Domestic Product

Arguably the largest indicators of an economy’s current status is the amount of goods and services it produces (GDP).
As seen in the graph, GDP remained positive the last two years following a down period in 2008-2009.
The current GDP growth rate (using the Second quarter of 2012) is 2.0%.
GDP

Housing markets have often been used to help stimulate economies after recessions due to the amount of goods/services required to build a single home.
While the housing market may not pull us out of this current slump, the relative stabilization of the market may be a positive sign for the rest of the year.
Housing Market
This graph taken from Standard and Poors
Graph taken January 10th, 2012
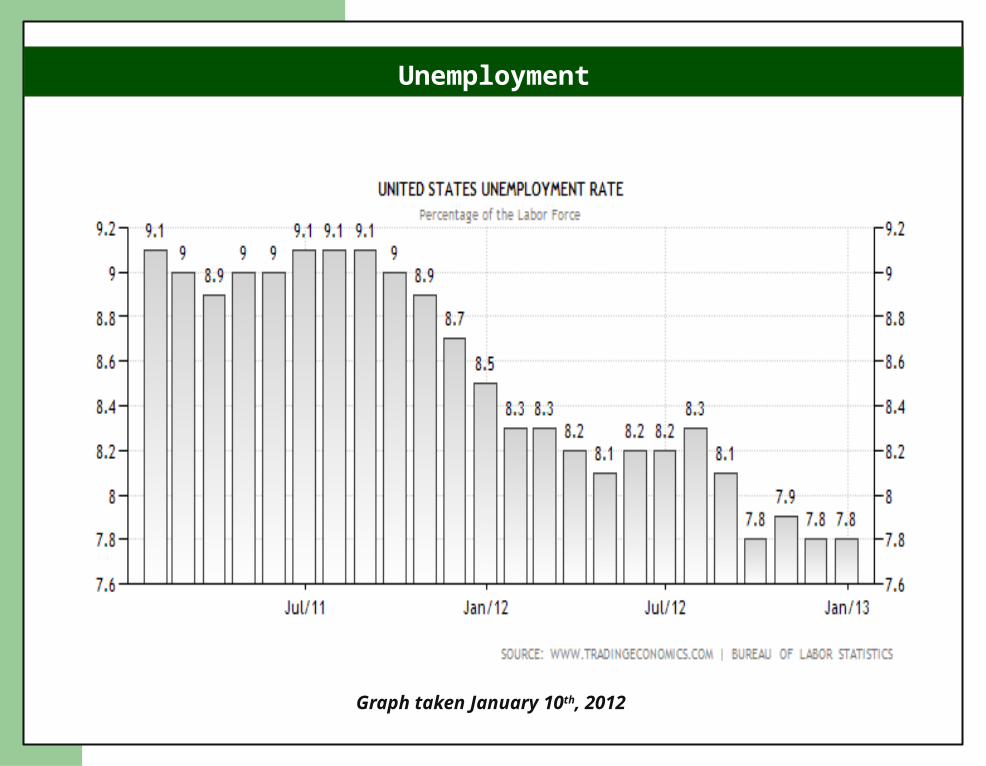
Unemployment

Unemployment continues to be an issue in the recovery from the recent recession. It is currently at 7.8%.Total employment went up by 155,000 in December 2012.Unemployment for December was 7.8%, unchanged from November .While official numbers are at 7.8%, this may not reflect actual unemployment due to the amount of people who have given up looking for work.

While unemployment is slowing down, those who are employed have seen positive changes in terms of overall employment payroll.
Graph taken November 5th, 2012
Payroll/Employment

The Employment Cost Index (ECI) measures the cost of labor in a given time period.
This can be used to show the quality of employment.
Graph created with data from the Bureau of Labor Statistics on November 5th, 2012
Employment Cost Index
2001 2002 2003 2004 2005 2006 2007 2008 2009 2010 2011 20120
0.5
1
1.5
2
2.5
3
3.5
4
Twelve Month Percent Change In ECI for Civilian Workers Through Q3 2012
Q1 Q2 Q3 Q4

The Producer Price Index (PPI) shows the change in prices received by domestic producers for their output.
This is a metric that is used to determine whether total inflation is occurring.
Graph created with data from the Bureau of Labor Statistics on November 5th, 2012
Producer Price Index
2001 2002 2003 2004 2005 2006 2007 2008 2009 2010 2011 2012
-8-7-6-5-4-3-2-10123456789
1011
Twelve Month Percentage Change in Producer Price Index Through Sep 2012
Jan
Feb
Mar
Apr
May
Jun
Jul
Aug
Sep
Oct
Nov
Dec

Consumer Price Index (CPI) represents the prices paid by consumers for goods and services.
It is one of the leading indicators of inflation.
Through November 2012, the CPI was at 2.0%, it’s highest since April.
Graph created with data from the Bureau of Labor Statistics on November 5th, 2012
Consumer Price Index
Inflation has been slowing down in China after it was prevalent for a sustained period. It is now at 1.9%, below its 18-year average of 4.3%.
2001 2002 2003 2004 2005 2006 2007 2008 2009 2010 2011 2012
-3
-2
-1
0
1
2
3
4
5
6
7
Twelve Month Percentage Change in Consumer Price Index Through Sep 2012
JanFebMarAprMayJunJulAugSepOctNovDec

S&P GSCI Commodity 1yr as of January 10, 2013
Commodities performed relatively well in the first part of 2012, but saw a pullback in May. They have appeared to make a recovery since then. With the demand placed on commodities due to the rise of the emerging markets, as well as the rebuilding of the East Coast after Hurricane Sandy.
Graph taken from Yahoo! Finance
Commodities

Political Factors

Political Factors (Continued)
Charts taken from The New York Times

So far, defaults in municipal bonds have been infrequent and a bit lower than initially predicted.
This could put more downward pressure on T-bill yields due to investors looking for government bonds, which are already at record lows, or it could put upward pressure in the stock market for investors looking for higher returns.
Due to many austerity measures being enacted throughout the country, the supply of municipal bonds has been relatively low.
Bond Markets

Investment decisions should be based on an individual’s own goals, time allowance, and tolerance for risk.Investing involves risk of loss.
Although bonds generally present less short-term risk and volatility than stocks, bonds do contain interest rate risk and the risk of default, or the risk that an issuer will be unable to make income or principal payments.
Stock markets, especially foreign markets, are volatile and can decline significantly in response to adverse issuer, political, market , or economic developments. Foreign securities are subject to interest-rate, currency-exchange rate, economic and political risks, all of which are magnified in emerging markets.
Sources: Bureau of Labor Statistics, Google Finance, Bloomberg, Fidelity, Pioneer as of 3/4/11 and the Wall Street Journal as of 3/20/11
As with all of your investments, you must make your own determination whether an investment in any particular security or fund is consistent with your investment objectives, risk tolerance, financial situation, and your evaluation of the investment option.
Vorpahl Wing Securities is not recommending or endorsing any particular investment option by mentioning it in this presentation or by making it available to its customers. This information is provided for educational purposes only, and you should bear in mind that laws of a particular state and your particular situation may affect this information.
There is no guarantee the trends discussed here will continue. Investment decisions should take into account the unique circumstances of the individual investor.
Past performance is no guarantee of future results. It is not possible to invest directly in an index or average. Index performance is not meant to represent that of any mutual fund.
Before investing, consider the funds’ investment objectives, risks, charges, and expenses.
Not FDIC insured. May lose value. No bank guarantee.
Disclosures


