
Mark Scheme 4766June 2005
Statistics 1 (4766) Qn Answer Mk Comment 1 (i) (ii)
Mean = 657/20 = 32.85
Variance = 191
(22839 - 20
657 2
) = 66.13
Standard deviation = 8.13 32.85 + 2(8.13) = 49.11 none of the 3 values exceed this so no outliers
B1 cao M1 A1 cao M1 ft A1 ft
Calculation of 49.11
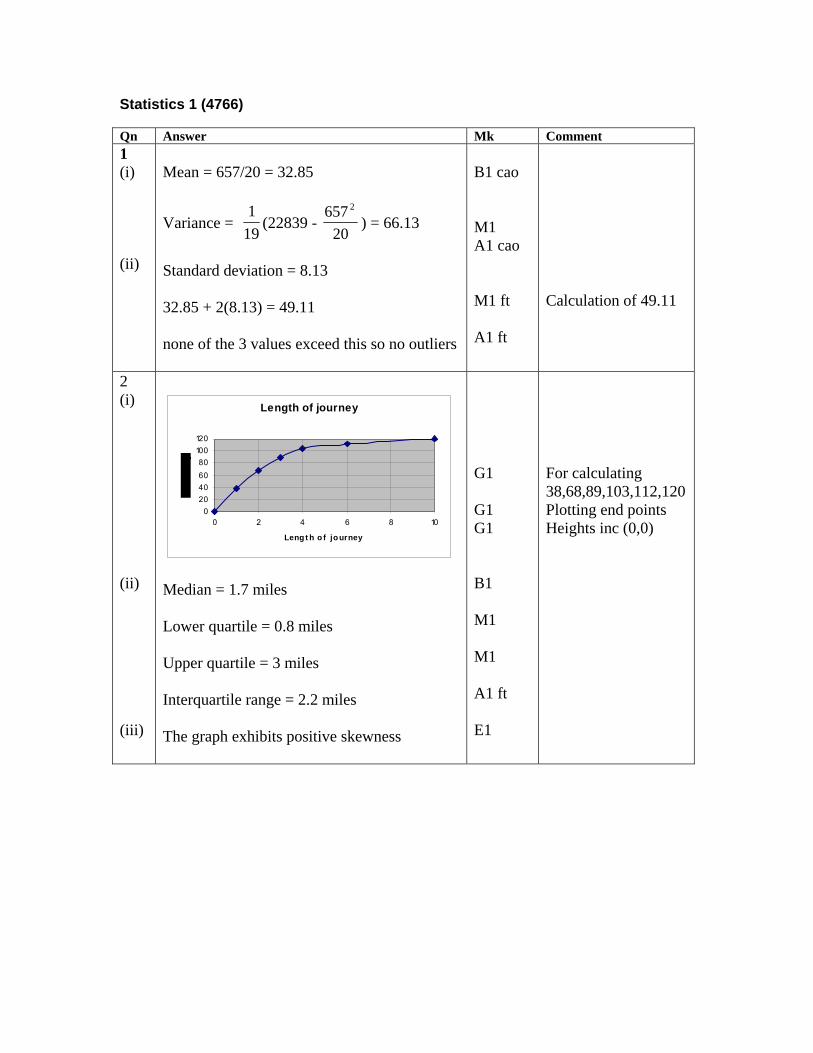
2 (i) (ii) (iii)
Length of journey
020406080
100120
0 2 4 6 8 10
Leng t h o f jo urney
Median = 1.7 miles Lower quartile = 0.8 miles Upper quartile = 3 miles Interquartile range = 2.2 miles The graph exhibits positive skewness
G1 G1 G1 B1 M1 M1 A1 ft E1
For calculating 38,68,89,103,112,120 Plotting end points Heights inc (0,0)

Statistics 1 (4766) June 2005 Final Mark Scheme 3 (i) (ii) (iii)
P(X = 4) = 401
(4)(5) = 21
(Answer given)
E = (2+12+36+80)( )X 401
So E = 3.25 ( )X
Var = (2+24+108+320)( )X 401
- 3.25²
= 11.35 – 10.5625 = 0.7875
Expected number of weeks = 406
x45
= 6.75 weeks
B1 M1 A1 cao M1 M1 dep A1 cao M1 A1
Calculation must be seen Sum of rp Sum of r²p -3.25² Use of np
4 (i) (ii) (iii)
Number of choices = = 20 ⎟⎟⎠
⎞⎜⎜⎝
⎛36
Number of ways = ⎟⎟⎠
⎞⎜⎜⎝
⎛×⎟⎟⎠
⎞⎜⎜⎝
⎛×⎟⎟⎠
⎞⎜⎜⎝
⎛58
47
36
= 563520 ×× = 39200 Number of ways of choosing 12 questions
= = 293930 ⎟⎟⎠
⎞⎜⎜⎝
⎛1221
Probability of choosing correct number from each section = 39200/293930 = 0.133
M1 A1 M1 M1 A1 cao M1 M1 ft A1 cao
For ⎟⎠
⎞⎜⎝
⎛36
Correct 3 terms Multiplied
For ⎟⎟⎠
⎞⎜⎜⎝
⎛1221

5 (i) (ii) (iii)
1 2 3 4 5 6 1 1 2 3 4 5 6 2 2 2 6 4 10 6 3 3 6 3 12 15 6 4 4 4 12 4 20 12 5 5 10 15 20 5 30 6 6 6 6 12 30 6
(A) P(LCM > 6) = 1/3 (B) P(LCM = 5n) = 11/36 (C) P(LCM > 6 ∩ LCM = 5n) = 2/9
31 x
3611 ≠
92
Hence events are not independent
B1 B1 B1 M1 A1 cao M1 E1
All correct Use of diagram Use of definition
6 (i) (ii)
P(First) 0.9 P 0.9 0.1 F(2nd) P 0.9 0.1 0.5 P(2nd) F 0.5 F(Leave) 0.1 0.5 P 0.9 F P(2nd) 0.5 0.1 F (Leave) F(Leave)
G1 G1 M1
Probabilities Outcomes

(A) (B) (iii) (iv) (v) (vi)
P(First team) = = 0.729 39.0 P(Second team) =
5.09.01.05.01.09.01.09.09.0 ××+××+×× = 0.081 + 0.045 + 0.045 = 0.171 P(asked to leave) = 1 -0.729 – 0.171 = 0.1 P(Leave after two games given leaves)
= 1.0
5.01.0 × = 21
P(at least one is asked to leave)
39.01−= = 0.271 P(Pass a total of 7 games) =P(First, Second, Second) + P(First, First, Leave after three games) = + 2171.0729.03 ×× 05.0729.03 2 ×× = 0.064 + 0.080 = 0.144
A1 M1 M1 A1 B1 M1 ft A1 cao M1 ft M1 A1 cao M1 M1 ft M1 ft M1 A1 cao
1 correct triple 3 correct triples added Denominator Calc’n of 0.9 1 – ( )³ Attempts both 0.729(0.171)² 0.05(0.729)² multiply by 3
7 (i) (ii)
⎟⎠⎞
⎜⎝⎛
61,15~ BX
( )0=XP = 15
65⎟⎠⎞
⎜⎝⎛ = 0.065
( )114
65
61
415
4 ⎟⎠⎞
⎜⎝⎛×⎟
⎠⎞
⎜⎝⎛×⎟⎟
⎠
⎞⎜⎜⎝
⎛==XP
= 0.142 (or 0.9102-0.7685)
M1 A1 cao M1 M1 A1 cao
15
65⎟⎠⎞
⎜⎝⎛
114
65
61
⎟⎠⎞
⎜⎝⎛
⎟⎠⎞
⎜⎝⎛
multiply by ⎟⎠
⎞⎜⎝
⎛4
15

(iii) (iv) (A) (B) (v)
)3( >XP = )3(1 ≤− XP = 1 – 0.7685 = 0.232 Let p = probability of a six on any throw
61:0 =pH
61:1 <pH
⎟⎠⎞
⎜⎝⎛
61,15~ BX
( 0=XP ) = 0.065 0.065 < 0.1 and so reject 0HConclude that there is sufficient evidence at the 10% level that the dice are biased against sixes. Let p = probability of a six on any throw
61:0 =pH
61:1 >pH
⎟⎠⎞
⎜⎝⎛
61,15~ BX
( )5≥XP = = 1 – 0.910 = 0.09 ( 41 ≤− XP )0.09 < 0.1 and so reject 0HConclude that there is sufficient evidence at the 10% level that the dice are biased in favour of sixes. Conclusions contradictory. Even if null hypothesis is true, it will be rejected 10% of the time purely by chance. Or other sensible comments.
M1 A1 B1 B1 M1 M1 dep E1 dep B1 M1 M1 dep E1 dep E1 E1
Definition of p Both hypotheses 0.065 Comparison Both hypotheses 0.09 Comparison Contradictory By chance

Mark Scheme 4766January 2006

Q 1 (i)
The range = 55 – 15 = 40 The interquartile range = 35 – 26 = 9
B1 CAO B1 CAO 2
(ii)
35 + 1.5 x 9 = 48.5 26 – 1.5 x 9 = 12.5 Any value > 48.5 is an outlier (so 55 will be an outlier),
M1 for 48.5 oe M1 for 12.5 oe A1 (FT their IQR in (i)) 3
(iii) One valid comment such as eg: Positively skewed Middle 50% of data is closely bunched
E1
1 TOTAL 6 2 (i)
Impossible because if 3 letters are correct, the fourth must be also.
E1 1
(ii)
There is only one way to place letters correctly. There are 4! = 24 ways to arrange 4 letters. OR:
41 x
31 x 1
2 NOTE: ANSWER GIVEN
E1 E1
B1 for 41 x
31 B1 for x 1
2
2 (iii)
E( X ) = 1 x 31 + 2 x
41 + 4 x
241
= 1
E( X² ) = 1 x 31 + 4 x
41 + 16 x
241
= 2
So Var( X ) = 2 – 12 = 1
M1 For ∑xp (at least 2 non-zero terms correct) A1 CAO M1 for 2x p∑ (at least 2 non-zero terms correct) M1dep for – their E( X )² A1 FT their E(X) provided Var( X ) > 0 5
TOTAL 8

3 (i)
X ~ B(10,0.2) P(X < 4) = P(X ≤ 3) = 0.8791 OR attempt to sum P(X = 0,1,2,3) using X ~ B(10,0.2) can score M1, A1
M1 for X ≤ 3 A1 2
(ii) Let p = the probability that a bowl is imperfect
2.0:0 =pH 2.0:1 <pH X ~ B(20,0.2) P(X ≤ 3) = 0.2061 0.2061 > 5% Cannot reject 0H and so insufficient evidence to claim a reduction. OR using critical region method: CR is {0} B1, 2 not in CR M1, A1 as above
B1 Definition of p B1, B1 B1 for 0.2061 seen M1 for this comparison A1 dep for comment in context
3 3
TOTAL 8 4 (i)
The company could increase the mean weight. The company could decrease the standard deviation.
B1 CAO B1
2 (ii)
Sample mean = 11409/25 = 456.36
2114095206937 325.7625xxS = − =
Sample s.d = 325.7624
=3.68
B1 M1 for Sxx A1
3
TOTAL 5 5 (i)
P( A ∩ B ) = 0.4
B1 CAO 1
(ii)
P( C U D ) = 0.6 B1 CAO 1
(iii)
Events B and C are mutually exclusive.
B1 CAO 1
(iv) P( B ) = 0.6, P( D ) = 0.4 and P(B ∩ D) = 0.2 0.6 x 0.4 ≠ 0.2 (so B and D not independent)
B1 for P(B ∩ D) = 0.2 soi E1 2
TOTAL 5 6 (i) Number of selections = ⎟
⎠
⎞⎜⎝
⎛7
12 = 792 M1 for ⎟
⎠
⎞⎜⎝
⎛7
12 A1 CAO
2 (ii) Number of arrangements = 7! = 5040 M1 for 7!, A1 CAO 2 TOTAL 4

7 (i)
Mean score = (2x8 + 3x7 + 4x6 + 5 + 4)/11 = 6.36
M1 for /11fx∑ A1 CAO 2
(ii)
Mean GCSE Score
G1 Linear sensible scales G1 fds of 8, 28, 38, 26, 6 or 4k, 14k, 19k, 13k, 3k for sensible values of k either on script or on graph. G1 (dep on reasonable attempt at fd) Appropriate label for vertical scale eg ‘Frequency density’, ‘frequency per ½ unit’, ‘students per mean GCSE score’. (allow Key) 3
(iii)
Mid point, x
f fx fx²
5 8 40 200 5.75 14 80.5 462.875 6.25 19 118.75 742.18756.75 13 87.75 592.31257.5 6 45 337.5
60 372 2334.875 Sample mean = 372/60 = 6.2
23722334.875 28.47560xxS = − =
Sample s.d = 28.47559
= 0.695
B1 mid points B1FT fx∑ and 2fx∑ B1 CAO M1 for their Sxx A1 CAO
5 (iv)
Prediction of score = 13 x 7.4 – 46 = 50.2 So predicted AS grade would be B
M1 For 13 x 7.4 – 46 A1 dep on 50.2 (or 50) seen 2
(v)
Prediction of score = 13 x 5.5 – 46 = 25.5 So predicted grade would be D/E (allow D or E) Because score roughly halfway from 20 to 30, OR (for D) closer to D than E OR (for E) past E but not up to D boundary
M1 For 13 x 5.5 – 46 A1 dep on 25.5 (or 26 or 25) seen E1 For explanation of conversion – logical statement/argument that supports their choice. 3
(vi) Mean = 13 x 6.2 – 46 = 34.6 Standard deviation = 13 x 0.695 = 9.035
B1 FT their 6.2 M1 for 13 x their 0.695 A1 FT 3
TOTAL 18

8 (i)
P( all jam )
= 103
114
125
××
= 221
= 0.04545
M1 5 x 4 x 3 or 53⎛ ⎞⎜ ⎟⎝ ⎠
in
numerator
M1 12 x 11 x 10 or 123
⎛ ⎞⎜ ⎟⎝ ⎠
in
denominator A1 CAO
3
(ii) P( all same )
=103
114
125
×× + 4 3 212 11 10
× × + 3 2 112 11 10
× ×
= 1 1 122 55 220
+ + = 443
= 0.06818
M1 Sum of 3 reasonable triples or combinations M1 Triples or combinations correct A1 CAO 3
(iii)
P(all different)
= 103
114
125
6 ×××
= 113
=0.2727
M1 5,4,3 M1 ×6 three fractions or 12
3⎛ ⎞⎜ ⎟⎝ ⎠
denom. A1 CAO
3 (iv) P(all jam given all same) =
122
344
= 32
M1 Their (i) in numerator M1 Their (ii) in denominator A1 CAO 3
(v)
P(all jam exactly twice)
= 2 35 1 21
2 22 22⎛ ⎞ ⎛ ⎞ ⎛ ⎞× ×⎜ ⎟ ⎜ ⎟ ⎜ ⎟
⎝ ⎠ ⎝ ⎠⎝ ⎠= 0.01797
M1 for 52⎛ ⎞⎜ ⎟⎝ ⎠
x …
M1 for their p2 q3 A1 CAO
3 (vi) P(all jam at least once)
5211 0.207522
⎛ ⎞= − =⎜ ⎟⎝ ⎠
M1 for their q5 M1 indep for 1 – 5th power A1 CAO 3
TOTAL 18

Mark Scheme 4766June 2006

4766 Mark Scheme June 2006
( ) 3.0P =∩→ BA
Q1 (i)
G1 Labelled linear scales G1 Height of lines
2 (ii) Negative (skewness) B1 1 (iii) Σfx = 123 so mean = 123/25 = 4.92 o.e.
2123681 75.8425xxS = − =
M.s.d = 75.84 3.034
25=
B1 M1 for Sxx attempted
A1 FT their 4.92 3
(iv)
Total for 25 days is 123 and totals for 31 days is 155.
Hence total for next 6 days is 32 and so mean = 5.33
M1 31 x 5 – 25xtheir 4.92
A1 FT their 123 2
TOTAL 8 Q2(i)
o.e.
M1 Product of these fractions
A1 2 (ii)
B1FT either 0.4 or 0.2 in correct place
B1FT all correct and labelled
2 (iii) P(B|A) ≠ P(B), 3/7 ≠ 0.5
Unequal so not independent
E1 Correct comparison
E1dep for ‘not independent’
2 (iv) 3/7 < 0.5
so Isobel is less likely to score when her parents attend
E1 for comparison
E1dep
2 TOTAL 8
.1 .2 .3 .4
A B
0
1
2
3
4
5
6
7
8
1 2 3 4 5 6 7
Number Correct
Freq
uenc
y
( ) ( ) ( ) 7 3P P P |10 7
A B A B A∩ = = ×

4766 Mark Scheme June 2006
Q3(i)
P(X = 1) = 7k, P(X = 2) = 12k, P(X = 3) = 15k, P(X = 4) = 16k
50k = 1 so k = 1/50
M1 for addition of four multiples of k
A1 ANSWER GIVEN
2
(ii) E(X) = 1 x 7k + 2 x 12k + 3 x 15k + 4 x 16k = 140k = 2.8
OR E(X) = 1 x 7/50 + 2 x 12/50 + 3 x 15/50 + 4 x 16/50 = 140 /50 = 2.8 oe
Var(X) = 1 x 7k + 4 x 12k + 9 x 15k + 16 x 16k -7.84 = 1.08
OR Var(X) = 1 x 7/50 + 4 x 12/50 + 9 x 15/50 + 16 x 16/50 -7.84
= 8.92 – 7.84 = 1.08
M1 for Σxp (at least 3 terms correct) A1 CAO M1 Σx2p (at least 3 terms correct) M1dep for – their E( X )² NB provided Var( X ) > 0 A1 FT their E(X)
5
TOTAL 7 Q4(i)
4 x 5 x 3 = 60 M1 for 4 x 5 x 3 A1 CAO
2
(ii) (A) ( )4
2 = 6
(B) ( )( )( )32
52
42 = 180
B1 ANSWER GIVEN B1 CAO
2 (iii) (A) 1/5
(B) 52
32
54
43
=××
B1 CAO
M1 for 3 4 24 5 3
× ×
A1
3
TOTAL 7 Q5 (i)
( ) ( ) 2952.013.087.02P 232 =××==X
M1 0.872 x 0.13
M1 ( )32 x p2q with p+q=1
A1 CAO
3 (ii) In 50 throws expect 50 (0.2952) = 14.76 times B1 FT 1 (iii) P (two 20’s twice) = ( )4
2 2597.07048.02952.0 22 =××
M1 22 7048.02952.0 × A1 FT their 0.2952
2 TOTAL 6

4766 Mark Scheme June 2006
0.9
0.1
Genuine
Fake
0.95
0.05
0. 2
0. 8
Positive
Negative
Positive
Negative
Q6 (i)
G1 for left hand set of branches fully correct including labels and probabilities G1 for right hand set of branches fully correct
2
(ii) P (test is positive) = (0.9)(0.95) + (0.1)(0.2) = 0.875 M1 Two correct pairs added A1 CAO
2
(iii) P (test is correct) = (0.9)(0.95) + (0.1)(0.8) = 0.935 M1 Two correct pairs added A1 CAO
2
(iv) P (Genuine|Positive)
= 0.855/0.875
= 0.977
M1 Numerator M1 Denominator A1 CAO
3 (v) P (Fake|Negative) = 0.08/0.125 = 0.64
M1 Numerator M1 Denominator A1 CAO
3 (vi) EITHER: A positive test means that the painting is almost
certain to be genuine so no need for a further test.
However, more than a third of those paintings with a negative result are genuine so a further test is needed.
NOTE: Allow sensible alternative answers
E1FT E1FT
2
(vii) P (all 3 genuine) = (0.9 x 0.05 x 0.96)3
= (0.045 x 0.96)3
= (0.0432)3
= 0.0000806
M1 for 0.9 x 0.05 (=0.045) M1 for complete correct triple product M1indep for cubing A1 CAO
4
TOTAL 18

4766 Mark Scheme June 2006
Q7 (i)
X ~ B(20, 0.1)
1920( ) P( = 1) 0.1 0.9 0.2702
1
A X ⎛ ⎞= × × =⎜ ⎟
⎝ ⎠
OR from tables 0.3917 0.1216 0.2701− = ( ) P( 1) 1 0.1216 0.8784B X ≥ = − =
M1 0.1 x 0.919
M1 ( )201 x pq19
A1 CAO OR: M2 for 0.3917 – 0.1216 A1 CAO M1 P(X=0) provided that P(X≥1)=1–P(X≤1) not seen M1 1-P(X=0) A1 CAO
3
3
(ii) EITHER: 1 – 0.9n ≥ 0.8 0.9n ≤ 0.2 Minimum n = 16 OR (using trial and improvement): Trial with 0.915 or 0.916 or 0.917 1 – 0.915 = 0.7941 < 0.8 and 1 – 0.916 = 0.8147 > 0.8 Minimum n = 16 NOTE: n = 16 unsupported scores SC1 only
M1 for 0.9n
M1 for inequality A1 CAO M1 M1 A1 CAO
3 (iii) ( ) A Let p = probability of a randomly selected rock
containing a fossil (for population) H0: p = 0.1 H1: p < 0.1 ( ) B Let X ~ B(30, 0.1) P(X ≤ 0) = 0.0424 < 5% P(X ≤ 1) = 0.0424 + 0.1413 = 0.1837 > 5% So critical region consists only of 0.
( ) C 2 does not lie in the critical region. So there is insufficient evidence to reject the null hypothesis and we conclude that it seems that 10% of rocks in this area contain fossils.
B1 for definition of p B1 for H0 B1 for H1 M1 for attempt to find P(X ≤ 0) or P(X ≤ 1) using binomial M1 for both attempted M1 for comparison of either of the above with 5% A1 for critical region dep on both comparisons (NB Answer given) M1 for comparison A1 for conclusion in context
3
4
2 TOTAL 18

63
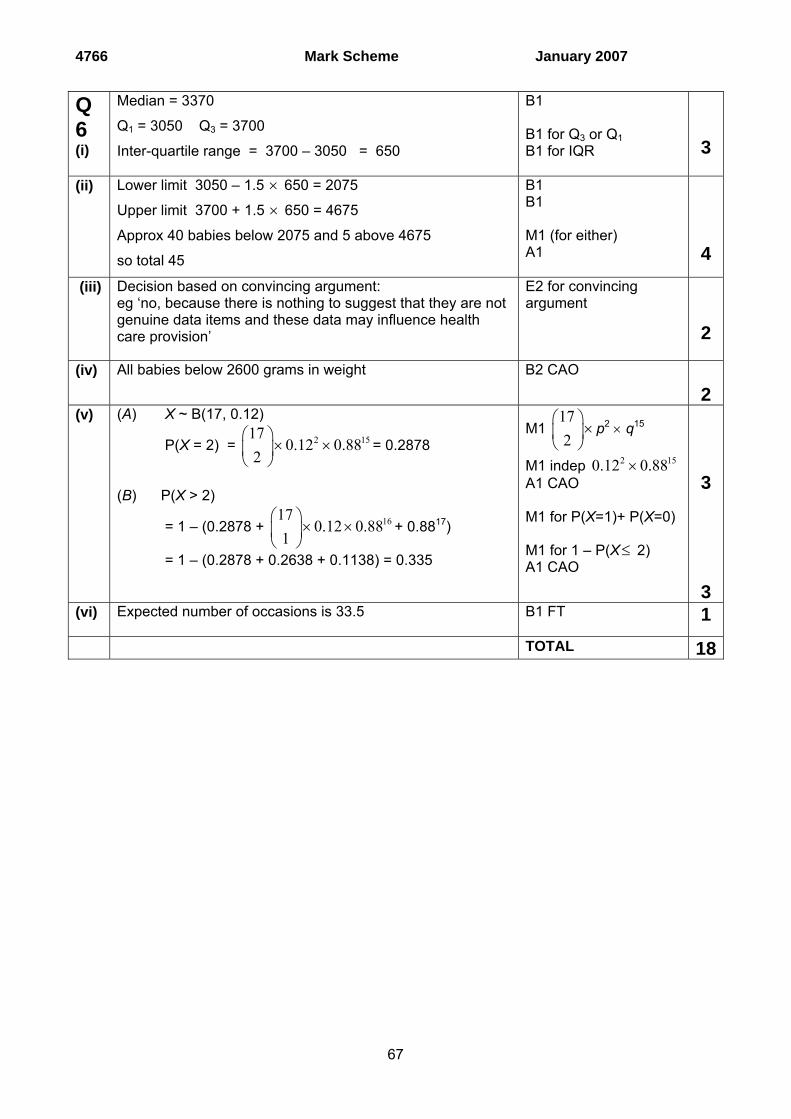
Mark Scheme 4766January 2007

4766 Mark Scheme January 2007
64
GENERAL INSTRUCTIONS Marks in the mark scheme are explicitly designated as M, A, B, E or G. M marks ("method") are for an attempt to use a correct method (not merely for stating the method). A marks ("accuracy") are for accurate answers and can only be earned if corresponding M mark(s) have been earned. Candidates are expected to give answers to a sensible level of accuracy in the context of the problem in hand. The level of accuracy quoted in the mark scheme will sometimes deliberately be greater than is required, when this facilitates marking. B marks are independent of all others. They are usually awarded for a single correct answer. E marks ("explanation") are for explanation and/or interpretation. These will frequently be sub divisible depending on the thoroughness of the candidate's answer. G marks ("graph") are for completing a graph or diagram correctly.
• Insert part marks in right-hand margin in line with the mark scheme. For fully correct parts tick the answer. For partially complete parts indicate clearly in the body of the script where the marks have been gained or lost, in line with the mark scheme.
• Please indicate incorrect working by ringing or underlining as appropriate.
• Insert total in right-hand margin, ringed, at end of question, in line with the mark scheme.
• Numerical answers which are not exact should be given to at least the accuracy shown.
Approximate answers to a greater accuracy may be condoned.
• Probabilities should be given as fractions, decimals or percentages.
• FOLLOW-THROUGH MARKING SHOULD NORMALLY BE USED WHEREVER POSSIBLE. There will, however, be an occasional designation of 'c.a.o.' for "correct answer only".
• Full credit MUST be given when correct alternative methods of solution are used. If errors
occur in such methods, the marks awarded should correspond as nearly as possible to equivalent work using the method in the mark scheme.
• The following notation should be used where applicable:
FT Follow-through marking
BOD Benefit of doubt
ISW Ignore subsequent working

4766 Mark Scheme January 2007
65
Q1 (i)
Mean = 127.6/13 = 9.8 Median = 8.6 Midrange = 14.5
M1 for 127.6/13 soi A1 CAO B1 CAO B1 CAO
4 (ii)
Mean slightly inflated due to the outlier Median good since it is not affected by the outlier Midrange poor as it is highly inflated due to the outlier
B1 B1 B1
3 TOTAL 7 Q2 (i)
0
24
6
8
10
12
14
16
0 1 2 3 4 5 6
Number of absentees
Freq
uenc
y
G1 labelled linear scales on both axes G1 heights
2
(ii) Mean =
9950
= 1.98
Sxx = 299315
50− (= 118.98)
rmsd = 118.98
50= 1.54
NB full marks for correct results from recommended method which is use of calculator functions
B1 for mean M1 for attempt at Sxx
A1 CAO
3
(iii) New mean = 30 – 1.98 = 28.02
New rmsd = 1.54 (unchanged)
B1 FT their mean B1 FT their rmsd
2
TOTAL 7
Q3 (i)
time freq width f dens 0- 34 5 6.8 5- 153 5 30.6 10- 188 10 18.8 20- 73 10 7.3 30- 27 10 2.7 40- 5 20 0.25
M1 for fds A1 CAO Accept any suitable unit for fd such as eg freq per 5 mins. G1 linear scales on both axes and label G1 width of bars G1 height of bars
5
(ii) Positive skewness B1 CAO (indep) 1 TOTAL 6

4766 Mark Scheme January 2007
66
Q4(i)
r 1 2 3 4 5 6
P(X = r) k 3k 5k 7k 9k 11k
36k = 1 , so k = 136
B1 for 3k, 5k, 7k, 9k M1 for sum of six multiples of k = 1 A1 CAO MUST BE FRACTION IN SIMPLEST FORM
3
(ii) E(X) = 1 3 5 7 9 11 1611 2 3 4 5 6 4.4736 36 36 36 36 36 36
× + × + × + × + × + × = =
M1 for Σ rp
A1 CAO
2
(iii) P(X=16) =
3166
⎛ ⎞× ⎜ ⎟⎝ ⎠
6 1
216 36= =
M1 for 6 ×
M1 indep for 31
6⎛ ⎞⎜ ⎟⎝ ⎠
A1 CAO
3
TOTAL 8
Q5(i)
P(jacket and tie) = 0.4 × 0.3 = 0.12
M1 for multiplying A1 CAO
2
(ii)
G1 for two intersecting circles labelled G1 for 0.12 and either 0.28 or 0.08 G1 for remaining probabilities Note FT their 0.12 provided < 0.2
3
(iii) (A) P(jacket or tie) =P(J) + P(T) – P(J∩T)
= 0.4 + 0.2 – 0.12 = 0.48
OR = 0.28 + 0.12 + 0.08 = 0.48
(B) P(no jacket or no tie) = 0.52 + 0.28 + 0.08 = 0.88
OR 0.6 + 0.8 – 0.52 = 0.88
OR 1 – 0.12 = 0.88
B1 FT B2 FT Note FT their 0.12 provided < 0.2
3
TOTAL 8
.28 0.12
0.52
Jacket Tie
0.08
4766 Mark Scheme January 2007
67
Q6 (i)
Median = 3370
Q1 = 3050 Q3 = 3700
Inter-quartile range = 3700 – 3050 = 650
B1 B1 for Q3 or Q1 B1 for IQR
3
(ii) Lower limit 3050 – 1.5 × 650 = 2075
Upper limit 3700 + 1.5 × 650 = 4675
Approx 40 babies below 2075 and 5 above 4675
so total 45
B1 B1 M1 (for either) A1
4 (iii) Decision based on convincing argument:
eg ‘no, because there is nothing to suggest that they are not genuine data items and these data may influence health care provision’
E2 for convincing argument
2
(iv) All babies below 2600 grams in weight B2 CAO 2
(v) (A) X ~ B(17, 0.12)
P(X = 2) = 2 15170.12 0.88
2⎛ ⎞
× ×⎜ ⎟⎝ ⎠
= 0.2878
(B) P(X > 2)
= 1 – (0.2878 + 16170.12 0.88
1⎛ ⎞
× ×⎜ ⎟⎝ ⎠
+ 0.8817)
= 1 – (0.2878 + 0.2638 + 0.1138) = 0.335
M1 172
⎛ ⎞×⎜ ⎟
⎝ ⎠p2 × q15
M1 indep 2 150.12 0.88× A1 CAO M1 for P(X=1)+ P(X=0) M1 for 1 – P(X ≤ 2) A1 CAO
3
3
(vi) Expected number of occasions is 33.5
B1 FT 1 TOTAL 18

4766 Mark Scheme January 2007
68
Q7 (i)
(A) P(both) =22 4
3 9⎛ ⎞ =⎜ ⎟⎝ ⎠
(B) P(one) =2 1 423 3 9
× × =
(C) P(neither) =21 1
3 9⎛ ⎞ =⎜ ⎟⎝ ⎠
B1 CAO B1 CAO B1 CAO
3 (ii) Independence necessary because otherwise, the probability
of one seed germinating would change according to whether or not the other one germinates. May not be valid as the two seeds would have similar growing conditions eg temperature, moisture, etc. NB Allow valid alternatives
E1 E1
2
(iii) Expected number = 2 ×
23
=43
(= 1.33)
E(X2) = 1 4 4 200 1 49 9 9 9
× + × + × =
Var(X) = 220 4 4
9 3 9⎛ ⎞− =⎜ ⎟⎝ ⎠
= 0.444
NB use of npq scores M1 for product, A1CAO
B1 FT M1 for E(X2) A1 CAO
3
(iv) Expect
8200 177.8 plants9
× =
So expect 0.85 × 177.8 = 151 onions
M1 for 200 × 89
M1 dep for × 0.85 A1 CAO
3
(v) Let X ~ B(18, p) Let p = probability of germination (for population) H0: p = 0.90 H1: p < 0.90
P(X ≤ 14) = 0.0982 > 5% So not enough evidence to reject H0 Conclude that there is not enough evidence to indicate that the germination rate is below 90%.
Note: use of critical region method scores M1 for region {0,1,2,…, 13} M1 for 14 does not lie in critical region then A1 E1 as per scheme
B1 for definition of p B1 for H0 B1 for H1 M1 for probability M1 dep for comparison A1 E1 for conclusion in context
7
TOTAL 18

Mark Scheme 4766June 2007
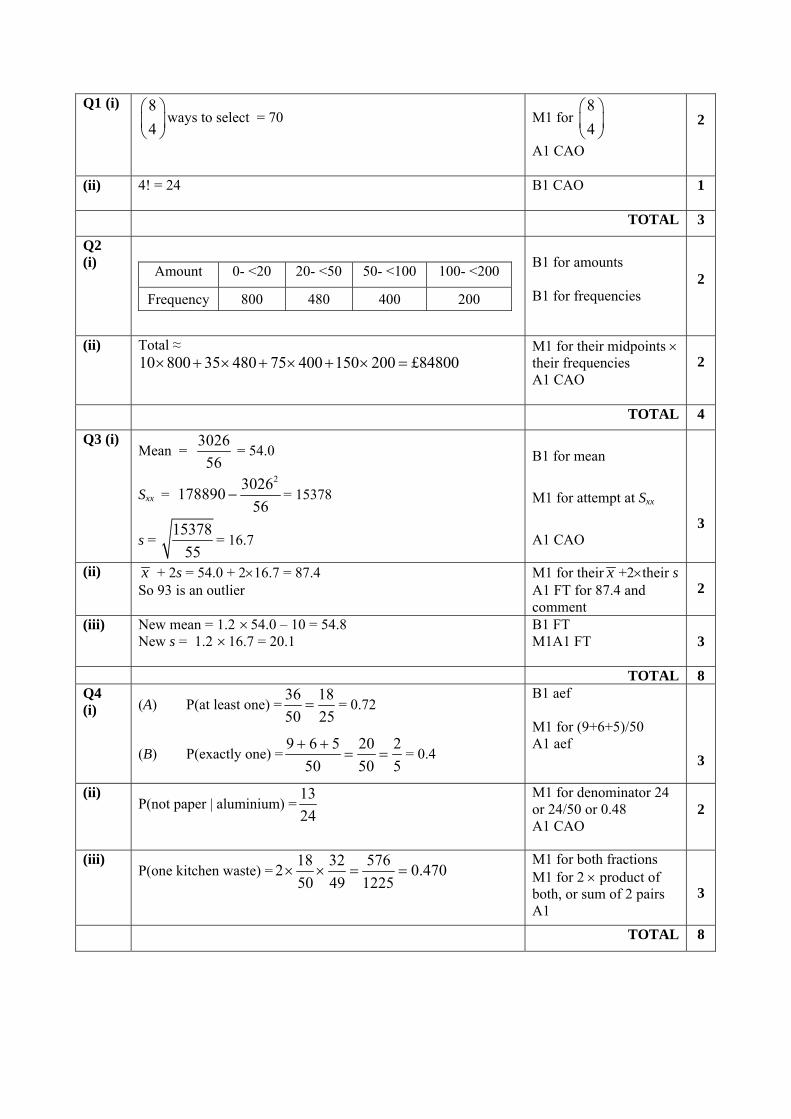
Q1 (i) 84⎛ ⎞⎜ ⎟⎝ ⎠
ways to select = 70
M1 for 84⎛ ⎞⎜ ⎟⎝ ⎠
A1 CAO
2
(ii) 4! = 24
B1 CAO
1
TOTAL 3
Q2 (i)
Amount 0- <20 20- <50 50- <100 100- <200
Frequency 800 480 400 200
B1 for amounts B1 for frequencies
2
(ii) Total ≈ 10 800 35 480 75 400 150 200 £84800× + × + × + × =
M1 for their midpoints × their frequencies A1 CAO
2
TOTAL 4
Q3 (i) Mean =
302656
= 54.0
Sxx = 23026178890
56− = 15378
s = 15378
55= 16.7
B1 for mean
M1 for attempt at Sxx
A1 CAO
3
(ii) x + 2s = 54.0 + 2×16.7 = 87.4 So 93 is an outlier
M1 for their x +2×their sA1 FT for 87.4 and comment
2
(iii) New mean = 1.2 ×54.0 – 10 = 54.8 New s = 1.2 ×16.7 = 20.1
B1 FT M1A1 FT
3
TOTAL 8 Q4 (i) (A) P(at least one) =
36 1850 25
= = 0.72
(B) P(exactly one) =9 6 5 20 2
50 50 5+ +
= = = 0.4
B1 aef M1 for (9+6+5)/50 A1 aef
3
(ii) P(not paper | aluminium) =
1324
M1 for denominator 24 or 24/50 or 0.48 A1 CAO
2
(iii) P(one kitchen waste) =
18 32 576250 49 1225
× × = = 0.470
M1 for both fractions M1 for 2 × product of both, or sum of 2 pairs A1
3
TOTAL 8
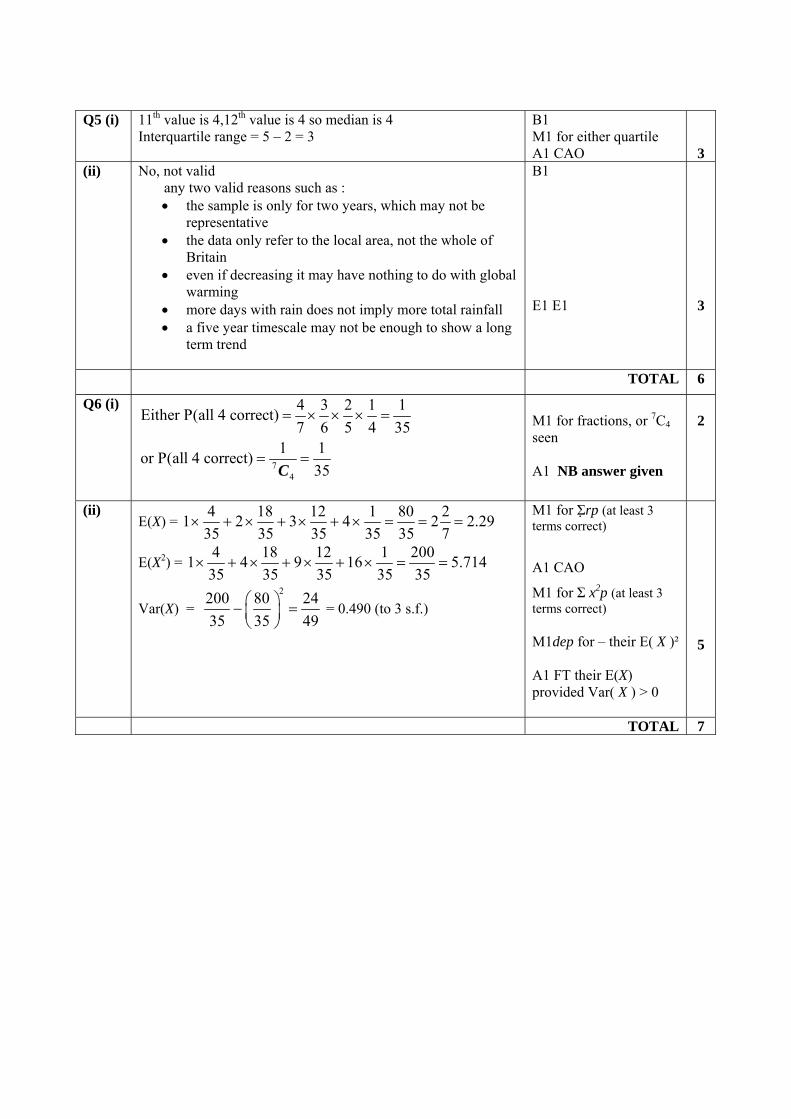
Q5 (i) 11th value is 4,12th value is 4 so median is 4
Interquartile range = 5 – 2 = 3
B1 M1 for either quartile A1 CAO
3 (ii) No, not valid
any two valid reasons such as : • the sample is only for two years, which may not be
representative • the data only refer to the local area, not the whole of
Britain • even if decreasing it may have nothing to do with global
warming • more days with rain does not imply more total rainfall • a five year timescale may not be enough to show a long
term trend
B1 E1 E1
3
TOTAL 6
Q6 (i)
74
4 3 2 1 1Either P(all 4 correct)7 6 5 4 35
1 1or P(all 4 correct)35C
= × × × =
= =
M1 for fractions, or 7C4 seen A1 NB answer given
2
(ii) E(X) =
4 18 12 1 80 21 2 3 4 2 2.35 35 35 35 35 7
× + × + × + × = = = 29
E(X2) = 4 18 12 1 2001 4 9 16 5.71435 35 35 35 35
× + × + × + × = =
Var(X) = 2200 80 24
35 35 49⎛ ⎞− =⎜ ⎟⎝ ⎠
= 0.490 (to 3 s.f.)
M1 for Σrp (at least 3 terms correct)
A1 CAO
M1 for Σ x2p (at least 3 terms correct) M1dep for – their E( X )² A1 FT their E(X) provided Var( X ) > 0
5
TOTAL 7
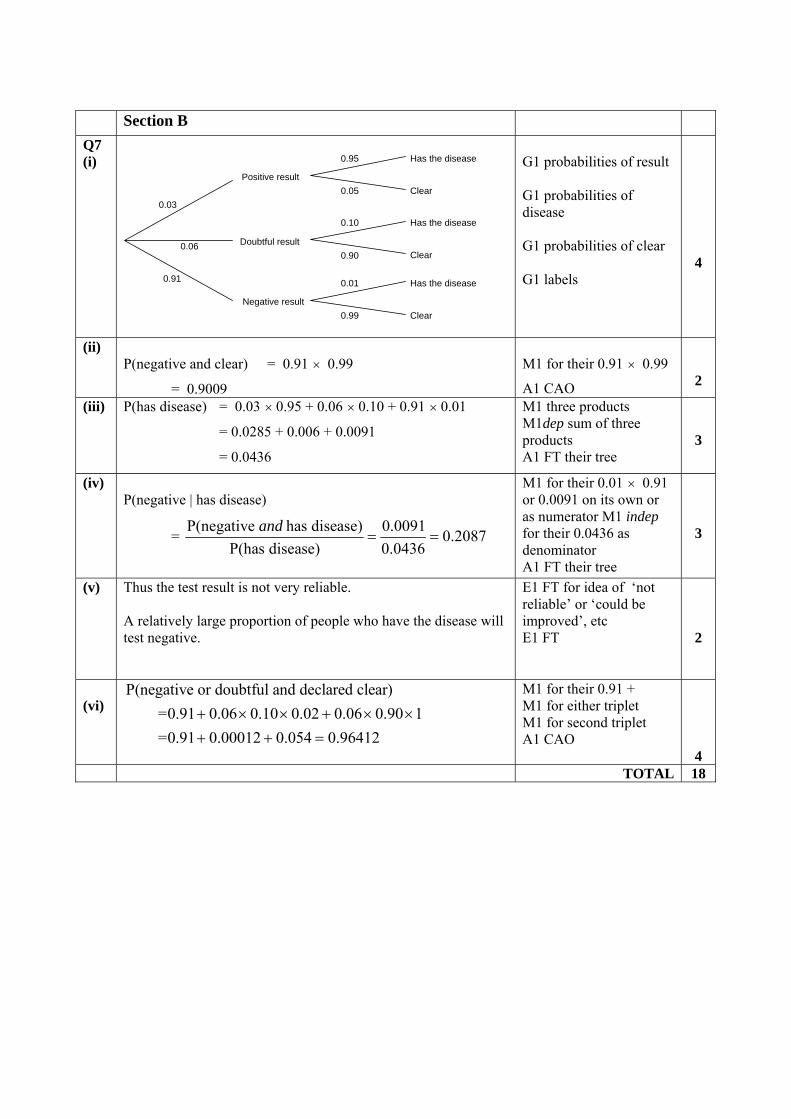
Section B Q7 (i)
Positive result
Doubtful result
Negative result
0.03
Has the disease
Clear
0.95
Has the disease
Clear
Has the disease
Clear
0.06
0.91
0.05
0.10
0.90
0.01
0.99
G1 probabilities of result G1 probabilities of disease G1 probabilities of clear G1 labels
4
(ii) P(negative and clear) = 0.91 × 0.99
= 0.9009
M1 for their 0.91 × 0.99
A1 CAO
2
(iii) P(has disease) = 0.03 × 0.95 + 0.06 × 0.10 + 0.91 × 0.01
= 0.0285 + 0.006 + 0.0091
= 0.0436
M1 three products M1dep sum of three products A1 FT their tree
3
(iv) P(negative | has disease)
= P(negative has disease) 0.0091 0.2087
P(has disease) 0.0436= =
and
M1 for their 0.01 × 0.91 or 0.0091 on its own or as numerator M1 indep for their 0.0436 as denominator A1 FT their tree
3
(v) Thus the test result is not very reliable. A relatively large proportion of people who have the disease will test negative.
E1 FT for idea of ‘not reliable’ or ‘could be improved’, etc E1 FT
2
(vi)
P(negative or doubtful and declared clear) =0.91 0.06 0.10 0.02 0.06 0.90 1 =0.91 0.00012 0.054 0.96412
+ × × + × ×+ + =
M1 for their 0.91 + M1 for either triplet M1 for second triplet A1 CAO
4 TOTAL 18

Q8 (i)
X ~ B(17, 0.2) P(X ≥ 4) = 1 – P(X ≤ 3)
= 1 – 0.5489 = 0.4511
B1 for 0.5489 M1 for 1 – their 0.5489 A1 CAO
3
(ii) E(X) = np = 17 × 0.2 = 3.4 M1 for product A1 CAO
2
(iii) P(X = 2) = 0.3096 – 0.1182 = 0.1914 P(X = 3) = 0.5489 – 0.3096 = 0.2393 P(X = 4) = 0.7582 – 0. 5489 = 0.2093 So 3 applicants is most likely
B1 for 0.2393 B1 for 0.2093 A1 CAO dep on both B1s
3
(iv) (A) Let p = probability of a randomly selected maths graduate applicant being successful (for population) H0: p = 0.2 H1: p > 0.2 (B) H1 has this form as the suggestion is that mathematics graduates are more likely to be successful.
B1 for definition of p in context B1 for H0B1 for H1E1
4
(v) Let X ~ B(17, 0.2) P(X ≥ 6) = 1 – P(X ≤ 5) = 1 – 0.8943 = 0.1057 > 5% P(X ≥ 7) = 1 – P(X ≤ 6) = 1 – 0.9623 = 0.0377 < 5% So critical region is {7,8,9,10,11,12,13,14,15,16,17}
B1 for 0.1057 B1 for 0.0377 M1 for at least one comparison with 5% A1 CAO for critical region dep on M1 and at least one B1
4
(vi) Because P(X ≥ 6) = 0.1057 > 10% Either: comment that 6 is still outside the critical region Or comparison P(X ≥ 7) = 0.0377 < 10%
E1 E1
2
TOTAL 18
4766 Mark Scheme January 2008
46
4766 Statistics 1
Q1 (i)
Mode = 7 Median = 12.5
B1 cao B1 cao
2
(ii) Positive or positively skewed E1 1 (iii)
(A) Median
(B) There is a large outlier or possible outlier of 58 / figure of 58.
Just ‘outlier’ on its own without reference to either 58 or large scores E0
Accept the large outlier affects the mean (more) E1
E1 cao E1indep
2
(iv)
There are 14.75 × 28 = 413 messages So total cost = 413 × 10 pence = £41.30
M1 for 14.75 × 28 but 413 can also imply the mark A1cao
2
TOTAL 7 Q2 (i)
43! 4 6 24
3⎛ ⎞
× = × =⎜ ⎟⎝ ⎠
codes or 4P3 = 24 (M2 for 4P3 )
Or 4 × 3 × 2 = 24
M1 for 4 M1 for ×6 A1
3
(ii) 43 = 64 codes
M1 for 43
A1 cao
2
TOTAL 5
Q3 (i)
Probability = 0.3 × 0.8 = 0.24
M1 for 0.8 from (1-0.2) A1
2
(ii)
Either: P(AUB) = P(A) + P(B) – P(A∩B)
= 0.3 + 0.2 – 0.3 × 0.2
= 0.5 – 0.06 = 0.44
Or: P(AUB) = 0.7 × 0.2 + 0.3 × 0.8 + 0.3 × 0.2
= 0.14 + 0.24 + 0.06 = 0.44
Or: P(AUB) = 1 – P(A′ ∩B′ )
= 1 – 0.7 × 0.8 = 1 – 0.56 = 0.44
M1 for adding 0.3 and 0.2 M1 for subtraction of ( 0.3 × 0.2) A1 cao M1 either of first terms M1 for last term A1 M1 for 0.7 × 0.8 or 0.56 M1 for complete method as seen A1
3
(iii) P(A|B) =
P( ) 0.06 6 0.136P( ) 0.44 44
∩= = =
A BB
M1 for numerator of their 0.06 only M1 for ‘their 0.44’ in denominator A1 FT (must be valid p)
3
TOTAL 8
4766 Mark Scheme January 2008
47
Q4 (i)
E(X) = 1 0.2 2 0.16 3 0.128 4 0.512 2.952× + × + × + × = Division by 4 or other spurious value at end loses A mark E(X2) = 1 0.2 4 0.16 9 0.128 16 0.512 10.184× + × + × + × = Var(X) = 10.184 – 2.9522 = 1.47 (to 3 s.f.)
M1 for Σ rp (at least 3 terms correct) A1 cao M1 for Σ x2p at least 3 terms correct M1 for E(X2) – E(X) 2 Provided ans > 0 A1 FT their E(X) but not a wrong E(X2)
5
(ii) Expected cost = 2.952 × £45000 = £133000 (3sf)
B1 FT ( no extra multiples / divisors introduced at this stage)
1
(iii)
0
0.2
0.4
0.6
1 2 3 4
r
P(X
= r)
G1 labelled linear scales G1 height of lines
2
TOTAL 8
Q5(i)
Impossible because the competition would have finished as soon as Sophie had won the first 2 matches
E1
1
(ii) SS, JSS, JSJSS B1, B1, B1 (-1 each error or omission)
3
(iii) 0.72 + 0.3 × 0.72 + 0.7 × 0.3 × 0.72 = 0.7399 or 0.74(0) { 0.49 + 0.147 + 0.1029 = 0.7399}
M1 for any correct termM1 for any other correct term M1 for sum of all three correct terms A1 cao
4
TOTAL 8

4766 Mark Scheme January 2008
48
Section B Q6 (i) Mean =
180.612
= 15.05 or 15.1
Sxx = 2180.63107.56
12− or 3107.56 – 12(their 15.05)2 =
(389.53)
s = 389.53
11= 5.95 or better
NB Accept answers seen without working (from calculator)
B1 for mean M1 for attempt at Sxx
A1 cao
3
(ii) x + 2s = 15.05 + 2 × 5.95 = 26.95 x – 2s = 15.05 – 2 × 5.95 = 3.15 So no outliers
M1 for attempt at either M1 for both A1 for limits and conclusion FT their mean and sd
3
(iii)
New mean = 1.8 × 15.05 + 32 = 59.1 New s = 1.8 × 5.95 = 10.7
B1FT M1 A1FT
3 (iv) New York has a higher mean or ‘ is on average’ higher (oe)
New York has greater spread /range /variation or SD (oe)
E1FT using 0F ( x dep) E1FT using 0F (σ dep)
2 (v) (vi)
NB all G marks dep on attempt at cumulative frequencies. NB All G marks dep on attempt at cumulative frequencies Line on graph at cf = 43.2(soi) or used 90th percentile = 166
B1 for all correct cumulative frequencies (may be implied from graph). Ignore cf of 0 at this stage G1 for linear scales (linear from 70 to 190) ignore x < 70 vertical: 0 to 50 but not beyond 100 (no inequality scales) G1 for labels G1 for points plotted as (UCB, their cf). Ignore (70,0) at this stage. No mid –point or LCB plots. G1 for joining all of ‘their points’(line or smooth curve) AND now including (70,0) M1 for use of 43.2 A1FT but dep on 3rd G mark earned
5
2
TOTAL 18
Upper bound (70) 100 110 120 150 170 190Cumulative frequency (0) 6 14 24 35 45 48
0
10
20
30
40
50
0 50 100 150 200
Hours
Cum
ulat
ive
freq
uenc
y

4766 Mark Scheme January 2008
49
Q7 (i)
X ~ B(12, 0.05)
1112( ) P( = 1) 0.05 0.95 0.3413
1
A X ⎛ ⎞= × × =⎜ ⎟
⎝ ⎠
OR from tables 0.8816 0.5404 0.3412− = ( ) P( 2) 1 0.8816 0.1184B X ≥ = − = ( ) Expected number E( ) 12 0.05 0.6= = × =C X np
M1 0.05 × 0.9511
M1 ( )121 × pq11 (p+q) =
1 A1 cao OR: M1 for 0.8816 seen and M1 for subtraction of 0.5404 A1 cao M1 for 1 – P(X ≤ 1) A1 cao M1 for 12 0.05× A1 cao (= 0.6 seen)
3
2
2
(ii) (iii)
Either: 1 – 0.95n ≤ ⅓ 0.95n ≥ ⅔ n ≤ log ⅔ /log0.95, so n ≤ 7.90 Maximum n = 7 Or: (using tables with p = 0.05): n = 7 leads to P(X ≥ 1) = 1 - P(X = 0) = 1 – 0.6983 = 0.3017 ( < ⅓ ) or 0.6983 ( > 2/3) n = 8 leads to P(X ≥ 1) = 1 - P(X = 0) = 1 – 0.6634 = 0.3366 ( > ⅓ ) or 0.6634 ( < 2/3 ) Maximum n = 7 (total accuracy needed for tables) Or: (using trial and improvement): 1 – 0.957 = 0.3017 ( < ⅓) or 0.957 = 0.6983 ( > 2/3) 1 – 0.958 = 0.3366 ( > ⅓) or 0.968 = 0.6634 ( < 2/3)
Maximum n = 7 (3 sf accuracy for calculations) NOTE: n = 7 unsupported scores SC1 only
Let X ~ B(60, p) Let p = probability of a bag being faulty H0: p = 0.05 H1: p < 0.05
P(X ≤ 1) = 0.9560 + 60 × 0.05 × 0.9559 = 0.1916 > 10% So not enough evidence to reject H0 Conclude that there is not enough evidence to indicate that the new process reduces the failure rate or scientist incorrect/ wrong.
M1 for equation in n M1 for use of logs A1 cao M1indep M1indep A1 cao dep on both M’s M1indep (as above) M1indep (as above) A1 cao dep on both M’s B1 for definition of p B1 for H0 B1 for H1 M1 A1 for probability M1 for comparison A1 E1
3
8
TOTAL 18

4766 Mark Scheme June 2008
60
4766 Statistics 1 Q1 (i)
Mean = 7.35 (or better) Standard deviation: 3.69 – 3.70 (awfw) Allow s2 = 13.62 to 13.68 Allow rmsd = 3.64 – 3.66 (awfw) After B0, B0 scored then if at least 4 correct mid-points seen or used.{1.5, 4, 6, 8.5, 15}
Attempt of their mean =44
fx∑, with 301 ≤ fx ≤ 346 and fx
strictly from mid-points not class widths or top/lower boundaries.
B2cao fx∑ = 323.5 B2cao fx∑ 2 = 2964.25 (B1) for variance s.o.i.o (B1) for rmsd (B1) mid-points (B1) 6.84 ≤ mean ≤ 7.86
4
(ii) Upper limit = 7.35 + 2 × 3.69 = 14.73 or ‘their sensible mean’ + 2 × ‘their sensible s.d.’ So there could be one or more outliers
M1 ( with s.d. < mean) E1dep on B2, B2 earned and comment
2
TOTAL 6 Q2 (i)
P(W) × P(C) = 0.20 × 0.17 = 0.034
P(W∩C) = 0.06 (given in the question)
Not equal so not independent (Allow 0.20 × 0.17 ≠ 0.06 or
≠ p (W ∩ C) so not independent).
M1 for multiplying or 0.034 seen A1 (numerical justification needed)
2
(ii)
The last two G marks are independent of the labels
G1 for two overlapping circles labelled G1 for 0.06 and either 0.14 or 0.11 in the correct places G1 for all 4 correct probs in the correct places (including the 0.69) NB No credit for Karnaugh maps here
3
(iii)
P(W|C) = P( ) 0.06 6 0.353
P(C) 0.17 17∩ = = =W C
(awrt 0.35)
M1 for 0.06 / 0.17 A1 cao
2
0.14
0.06
0.69
W C
0.11

4766 Mark Scheme June 2008
61
(iv) Children are more likely than adults to be able to speak
Welsh or ‘proportionally more children speak Welsh than
adults’
Do not accept: ‘more Welsh children speak Welsh than
adults’
E1FT Once the correct idea is seen, apply ISW
1
TOTAL 8
Q3 (i)
( ) 0.5 + 0.35 + 1 so 0.15( ) 0 0.5 1 0.35 2 3 0.67 so 2 3 0.32( ) from above 2 2 0.30 so 0.02, 0.13
A p qp q
B p qp q
C p qq p
+ =+ =
× + × + + =+ =
+ == =
B1 p + q in a correct equation before they reach p + q =0.15 B1 2p + 3q in a correct equation before they reach 2p + 3q = 0.32 (B1) for any 1 correct answer B2 for both correct answers
1 1 2
(ii) E(X2) = 0 0.5 1 0.35 4 0.13 9 0.02 1.05× + × + × + × = Var(X) = ‘their 1.05’ – 0.672 = 0.6011 (awrt 0.6) (M1, M1 can be earned with their p+
and q + but not A mark)
M1 Σx2p (at least 2 non zero terms correct) M1dep for (– 0.67²), provided Var( X ) > 0 A1 cao (No n or n-1 divisors)
3
TOTAL 7 Q4 (i)
X ~ B(8, 0.05) 8( ) P( = 0) 0.95 0.6634 = =A X 0.663 or better
Or using tables P( = 0) = 0.6634 X
78( ) P( = 1) 0.05 0.95 0.2793
1P( 1) 1 (0.6634 0.2793) 0.0573
⎛ ⎞= × × =⎜ ⎟⎝ ⎠
> = − + =
B X
X
Or using tables P(X > 1 ) = 1 – 0.9428 = 0.0572
M1 0.958 A1 CAO Or B2 (tables) M1 for P(X = 1)(allow 0.28 or better) M1 for 1 – P(X ≤ 1) must have both probabilities A1cao (0.0572 – 0.0573) M1 for P(X ≤ 1) 0.9428 M1 for 1 – P(X ≤ 1) A1 cao (must end in…2)
2
3
(ii) Expected number of days = 250 × 0.0572 = 14.3 awrt
M1 for 250 x prob(B) A1 FT but no rounding at end
2
TOTAL 7

4766 Mark Scheme June 2008
62
Q5 (i)
Let p = probability of remembering or naming all items (for population) (whilst listening to music.) H0: p = 0.35 H1: p > 0.35
H1 has this form since the student believes that the probability will be increased/ improved/ got better /gone up.
B1 for definition of p B1 for H0 B1 for H1 E1dep on p>0.35 in H0 In words not just because p > 0.35
4
(ii) Let X ~ B(15, 0.35)
Either: P(X ≥ 8) = 1 - 0.8868 = 0.1132 > 5% Or 0.8868 < 95% So not enough evidence to reject H0 (Accept Ho ) Conclude that there is not enough evidence to indicate that the probability of remembering all of the items is improved / improved/ got better /gone up. (when listening to music.) -------------------------------------------------------------------------- Or: Critical region for the test is {9,10,11,12,13,14,15} 8 does not lie in the critical region. So not enough evidence to reject H0
Conclude that there is not enough evidence to indicate that the probability of remembering all of the items is improved / improved/ got better /gone up. (when listening to music.) ------------------------------------------------------------------------- Or: The smallest critical region that 8 could fall into is {8, 9, 10, 11, 12, 13, 14, and 15}. The size of this region is 0.1132 0.1132 > 5% So not enough evidence to reject H0
Conclude that there is not enough evidence to indicate that the probability of remembering all of the items is improved (when listening to music)
Either: M1 for probability (0.1132) M1dep for comparison A1dep E1dep on all previous marks for conclusion in context ----------------------------- Or: M1 for correct CR(no omissions or additions) M1dep for 8 does not lie in CR A1dep E1dep on all previous marks for conclusion in context ----------------------------- Or: M1 for CR{8,9,…15}and size = 0.1132 M1 dep for comparison A1dep E1dep on all previous marks for conclusion in context
4
TOTAL 8

4766 Mark Scheme June 2008
63
Section B
Q6 (i)
(A) P(both rest of UK) = 0.20 × 0.20
= 0.04 (B) Either: All 5 case P(at least one England) = (0.79 x 0.20) + (0.79 x 0.01) + (0.20 x 0.79) + (0.01 x 0.79) + (0.79 x 0.79) = 0.158 + 0.0079 + 0.158 + 0.0079 + 0.6241 = 0.9559 Or P(at least one England) = 1 – P(neither England) = 1 – (0.21 × 0.21) = 1 – 0.0441 = 0.9559 or listing all = 1 –{ ( 0.2 x 0.2) + (0.2 x 0.01) + (0.01 x 0.20) + (0.01x 0.01)} = 1 – (**) = 1 – { 0.04 + 0.002 + 0.002 + 0.0001) = 1 – 0.0441 = 0.9559 Or: All 3 case P(at least one England) = = 0.79 × 0.21 + 0.21 × 0.79 + 0.792 = 0.1659 + 0.1659 + 0.6241 = 0.9559 ________________________________________________ (C)Either 0.79 x 0.79 + 0.79 x 0.2 + 0.2 x 0.79 + 0.2 x 0.2 = 0.9801 Or 0.99 × 0.99 = 0.9801 Or 1 – { 0.79 x 0.01 + 0.2 x 0.01 + 0.01 x 0.79 + 0.01 x 0.02 + 0.012 } = 1 – 0.0199 = 0.9801
M1 for multiplying
A1cao M1 for any correct term (3case or 5case) M1 for correct sum of all 3 (or of all 5) with no extras A1cao (condone 0.96 www) Or M1 for 0.21 × 0.21 or for (**) fully enumerated or 0.0441 seen M1dep for 1 – (1st part) A1cao See above for 3 case ___________________ M1 for sight of all 4 correct terms summed A1 cao (condone 0.98 www) or M1 for 0.99 x 0.99 A1cao Or M1 for everything 1 – {…..} A1cao
2
3
2
(ii) P(both the rest of the UK | neither overseas)
P(the rest of the UK neither overseas)P(neither overseas)
0.04 0.04080.9801
and=
= =
{Watch for:)()(
CanswerAanswer
as evidence of method (p <1)}
M1 for numerator of 0.04 or ‘their answer to (i)(A)’ M1 for denominator of 0.9801 or ‘their answer to (i) (C)’ A1 FT (0 < p < 1) 0.041 at least
3

4766 Mark Scheme June 2008
64
(iii) (A) Probability = 1 – 0.795 = 1 – 0.3077 = 0.6923 (accept awrt 0.69) see additional notes for alternative solution (B) 1 – 0.79n > 0.9 EITHER: 1 – 0.79n > 0.9 or 0.79n < 0.1 (condone = and ≥ throughout) but not reverse inequality
n >79010
.log.log
, so n > 9.768…
Minimum n = 10 Accept n ≥ 10 -------------------------------------------------------------------------- OR (using trial and improvement): Trial with 0.799 or 0.7910 1 – 0.799 = 0.8801 (< 0.9) or 0.799 = 0.1198 (> 0.1) 1 – 0.7910 = 0.9053 ( > 0.9 ) or 0.7910 = 0.09468 (< 0.1) Minimum n = 10 Accept n ≥ 10 -------------------------------------------------------------------------- NOTE: n = 10 unsupported scores SC1 only
M1 for 0.795 or 0.3077... M1 for 1 – 0.795 dep A1 CAO M1 for equation/inequality in n (accept either statement opposite) M1(indep) for process
of using logs i.e. ba
loglog
A1 CAO ----------------------------- M1(indep) for sight of 0.8801 or 0.1198 M1( indep) for sight of 0.9053 or 0.09468 A1 dep on both M’s cao -----------------------------
3
3
TOTAL 16

4766 Mark Scheme June 2008
65
Q7 (i)
Positive
B1
1
(ii)
Number of people = 20 × 33 ( 000) + 5 × 58 (000 )
= 660 ( 000 ) + 290 (000) = 950 000
M1 first term M1(indep) second term A1 cao NB answer of 950 scores M2A0
3
(iii)
(A) a = 1810 + 340 = 2150
(B) Median = age of 1 385 (000th ) person or 1385.5 (000)
Age 30, cf = 1 240 (000); age 40, cf = 1 810 (000)
Estimate median = (30) + 570145
× 10
Median = 32.5 years (32.54...) If no working shown then 32.54 or
better is needed to gain the M1A1. If 32.5 seen with no previous working allow SC1
M1 for sum A1 cao 2150 or 2150 thousand but not 215000 B1 for 1 385 (000) or 1385.5 M1 for attempt to
interpolate kk
570145 × 10
(2.54 or better suggests this) A1 cao min 1dp
2 3
(iv)
Frequency densities: 56, 65, 77, 59, 45, 17
(accept 45.33 and 17.43 for 45 and 17)
B1 for any one correct B1 for all correct (soi by listing or from histogram) Note: all G marks below dep on attempt at frequency density, NOT frequency G1 Linear scales on both axes (no inequalities) G1 Heights FT their listed fds or all must be correct. Also widths. All blocks joined G1 Appropriate label for vertical scale eg ‘Frequency density (thousands)’, ‘frequency (thousands) per 10 years’, ‘thousands of people per 10 years’. (allow key). OR f.d.
5
4766 Mark Scheme June 2008
66
(v)
Any two suitable comments such as:
Outer London has a greater proportion (or %) of people
under 20 (or almost equal proportion)
The modal group in Inner London is 20-30 but in Outer London it is 30-40 Outer London has a greater proportion (14%) of aged 65+ All populations in each age group are higher in Outer London Outer London has a more evenly spread distribution or balanced distribution (ages) o.e.
E1 E1
2 (vi) Mean increase ↑
median unchanged (-) midrange increase ↑ standard deviation increase ↑ interquartile range unchanged. ( - )
Any one correct B1 Any two correct B2 Any three correct B3 All five correct B4
4
TOTAL 20

4766 Mark Scheme January 2009
47
4766 Statistics 1
Section A Q1 (i)
(With ∑ fx = 7500 and ∑ f = 10000 then arriving at the
mean) (i) £0.75 scores (B1, B1) (ii) 75p scores (B1, B1) (iii) 0.75p scores (B1, B0) (incorrect units) (iv) £75 scores (B1, B0) (incorrect units)
After B0, B0 then sight of 100007500
scores SC1. SC1or an answer
in the range £0.74 - £0.76 or 74p – 76p (both inclusive) scores SC1 (units essential to gain this mark) Standard Deviation: (CARE NEEDED here with close proximity of answers)
• 50.2(0) using divisor 9999 scores B2 (50.20148921) • 50.198 (= 50.2) using divisor 10000 scores B1(rmsd) • If divisor is not shown (or calc used) and only an answer
of 50.2 (i.e. not coming from 50.198) is seen then award B2 on b.o.d. (default)
After B0 scored then an attempt at Sxx as evident by either
Sxx = 27500(5000 200000 25000000)
10000+ + − (= 25199375)
or Sxx = (5000 + 200000 + 25000000) – 10000(0.75)2 scores (M1) or M1ft ‘their 75002’ or ‘their 0.752’ NB The structure must be correct in both above cases with a max of 1 slip only after applying the f.t.
B1 for numerical mean (0.75 or 75 seen) B1dep for correct units attached
B2 correct s.d.
(B1) correct rmsd
(B2) default
∑ fx 2 = 25,205,000
Beware ∑ x 2 =25, 010, 100
After B0 scored then
(M1) or M1f.t. for
attempt at Sxx NB full marks for correct results from recommended method which is use of calculator functions
4

4766 Mark Scheme January 2009
48
(ii) P(Two £10 or two £100)
= 50 49 20 19
10000 9999 10000 9999× + ×
= 0.0000245 + 0.0000038 = (0.00002450245 + 0.00000380038) = 0.000028(3) o.e. = (0.00002830283)
After M0, M0 then ×10000
50 10000
50 + ×
1000020
10000
20 o.e.
Scores SC1 (ignore final answer but SC1 may be implied by sight of 2.9 × 10 – 5
o.e.)
Similarly, ×10000
50 10000
49 + ×
1000020
10000
19 scores SC1
M1 for either correct product seen (ignore any multipliers) M1 sum of both correct (ignore any multipliers) A1 CAO (as opposite with no rounding) (SC1 case #1) (SC1 case #2) CARE answer is also 2.83 × 10 – 5
3
TOTAL 7 Q2 (i)
1 1 1 1 1 1 1Either P(all correct)6 5 4 3 2 1 720
1 1or P(all correct) 0.001396! 720
= × × × × × =
= = =
M1 for 6! Or 720 (sioc) or product of fractions A1 CAO (accept 0.0014)
2
(ii) 3 2 1 1Either P(picks T, O, M)6 5 4 20
1 1 1 1or P(picks T, O, M) 3!6 5 4 201 1or P(picks T, O, M)6 203
= × × =
= × × × =
= =⎛ ⎞⎜ ⎟⎝ ⎠
M1 for denominators M1 for numerators or 3! A1 CAO Or M1 for 6
3⎛ ⎞⎜ ⎟⎝ ⎠
or 20 sioc
M1 for 1/ 63
⎛ ⎞⎜ ⎟⎝ ⎠
A1 CAO
3
TOTAL 5 Q3 (i)
p = 0.55
B1 cao
1
(ii) E(X) = 0 0.55 1 0.1 2 0.05 3 0.05 4 0.25 1.35× + × + × + × + × = E(X2) = 0 0.55 1 0.1 4 0.05 9 0.05 16 0.25× + × + × + × + × = 0 + 0.1 + 0.2 + 0.45 + 4 = (4.75) Var(X) = ‘their’ 4.75 – 1.352 = 2.9275 awfw (2.9275 – 2.93)
M1 for Σrp (at least 3 non zero terms correct) A1 CAO(no ‘n’ or ‘n-1’ divisors) M1 for Σr2p (at least 3 non zero terms correct) M1dep for – their E( X )² provided Var( X ) > 0 A1 cao (no ‘n’ or ‘n-1’ divisors)
5
(iii) P(At least 2 both times) = (0.05+0.05+0.25)2 = 0.1225 o.e. M1 for (0.05+0.05+0.25)2 or 0.352 seen A1cao: awfw (0.1225 -0.123) or 49/400
2

4766 Mark Scheme January 2009
49
TOTAL 8
4766 Mark Scheme January 2009
50
Q4 (i)
X ~ B(50, 0.03)
4950( ) P( = 1) 0.03 0.97 0.3372
1
⎛ ⎞= × × =⎜ ⎟
⎝ ⎠A X
50( ) P( = 0) = 0.97 0.2181( 1) 1 0.2181 0.3372 0.4447
=> = − − =
B XP X
M1 0.03 × 0.9749 or 0.0067(4)….
M1 501
⎛ ⎞⎜ ⎟⎝ ⎠
× pq49 (p+q
=1) A1 CAO (awfw 0. 337 to 0. 3372) or 0.34(2s.f.) or 0.34(2d.p.) but not just 0.34 B1 for 0.9750 or 0.2181 (awfw 0.218 to 0.2181) M1 for 1 – ( ‘their’ p (X = 0) + ‘their’ p(X = 1)) must have both probabilities A1 CAO (awfw 0.4447 to 0.445)
3
3
(ii) Expected number = np = 240 × 0.3372 = 80.88 – 80.93 = (81) Condone 240 × 0.34 = 81.6 = (82) but for M1 A1f.t.
M1 for 240× prob (A) A1FT
2
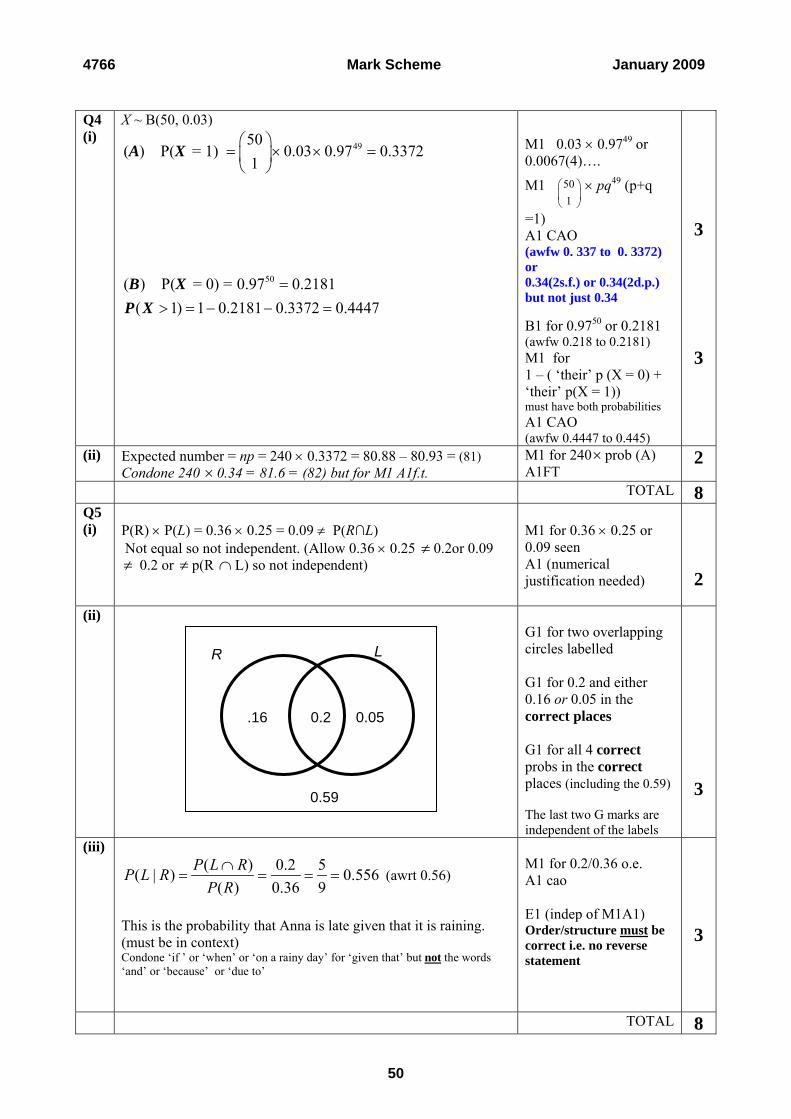
TOTAL 8 Q5 (i)
P(R) × P(L) = 0.36 × 0.25 = 0.09 ≠ P(R∩L) Not equal so not independent. (Allow 0.36 × 0.25 ≠ 0.2or 0.09 ≠ 0.2 or ≠ p(R ∩ L) so not independent)
M1 for 0.36 × 0.25 or 0.09 seen A1 (numerical justification needed)
2
(ii) G1 for two overlapping circles labelled G1 for 0.2 and either 0.16 or 0.05 in the correct places G1 for all 4 correct probs in the correct places (including the 0.59) The last two G marks are independent of the labels
3
(iii) ( ) 0.2 5( | ) 0.556
( ) 0.36 9P L RP L R
P R∩
= = = = (awrt 0.56)
This is the probability that Anna is late given that it is raining. (must be in context) Condone ‘if ’ or ‘when’ or ‘on a rainy day’ for ‘given that’ but not the words ‘and’ or ‘because’ or ‘due to’
M1 for 0.2/0.36 o.e. A1 cao E1 (indep of M1A1) Order/structure must be correct i.e. no reverse statement
3
TOTAL 8
.166
0.2
0.59
R L
0.05

4766 Mark Scheme January 2009
51
Section B Q6 (i)
Median = 4.06 – 4.075 (inclusive) Q1 = 3.8 Q3 = 4.3 Inter-quartile range = 4.3 – 3.8 = 0.5
B1cao B1 for Q1 (cao) B1 for Q3 (cao) B1 ft for IQR must be using t-values not locations to earn this mark
4
(ii) Lower limit ‘ their 3.8’ – 1.5 × ‘their 0.5’ = (3.05) Upper limit ‘ their 4.3’ + 1.5 × ‘their 0.5’ = (5.05) Very few if any temperatures below 3.05 (but not zero) None above 5.05 ‘So few, if any outliers’ scores SC1
B1ft: must have -1.5 B1ft: must have +1.5 E1ft dep on -1.5 and Q1 E1ft dep on+1.5 and Q3 Again, must be using t-values NOT locations to earn these 4 marks
4
(iii) Valid argument such as ‘Probably not, because there is nothing to suggest that they are not genuine data items; (they do not appear to form a separate pool of data.’) Accept: exclude outlier – ‘measuring equipment was wrong’ or ‘there was a power cut’ or ref to hot / cold day [Allow suitable valid alternative arguments]
E1
1
(iv) Missing frequencies 25, 125, 50 B1, B1, B1 (all cao)
3
(v) Mean = (3.2×25 + 3.6×125 + 4.0×243 + 4.4×157 + 4.8×50)/600 = 2432.8/600 = 4.05(47)
M1 for at least 4 midpoints correct and being used in attempt to find ∑ ft A1cao: awfw (4.05 – 4.055) ISW or rounding
2
(vi) New mean = 1.8 × ‘their 4.05(47)’ + 32 = 39.29(84) to 39.3 New s = 1.8 × 0.379 = 0.682
B1 FT M1 for 1.8 × 0.379 A1 CAO awfw (0.68 – 0.6822)
3
TOTAL 17

4766 Mark Scheme January 2009
52
Q7 (i)
X ~ B(10, 0.8)
(A) Either 8 210P( = 8) 0.8 0.2 0.3020
8⎛ ⎞
= × × =⎜ ⎟⎝ ⎠
X (awrt)
or P(X = 8) = P(X ≤ 8) – P(X ≤ 7) = 0.6242 – 0.3222 = 0.3020 (B) Either P(X ≥ 8) = 1 – P(X ≤ 7) = 1 – 0.3222 = 0.6778
or P(X ≥ 8) = P(X = 8) + P(X = 9) + P(X = 10) = 0.3020 + 0.2684 + 0.1074 = 0.6778
M1 0.88 × 0.22 or 0.00671…
M1 ( )108 × p8 q2; (p +q
=1) Or 45 × p8 q2; (p +q =1) A1 CAO (0.302) not 0.3 OR: M2 for 0.6242 – 0.3222 A1 CAO M1 for 1 – 0.3222 (s.o.i.) A1 CAO awfw 0.677 – 0.678 or M1 for sum of ‘their’ p(X=8) plus correct expressions for p(x=9) and p(X=10) A1 CAO awfw 0.677 – 0.678
3
2
(ii) Let X ~ B(18, p) Let p = probability of delivery (within 24 hours) (for population) H0: p = 0.8 H1: p < 0.8
P(X ≤ 12) = 0.1329 > 5% ref: [pp =0.0816] So not enough evidence to reject H0 Conclude that there is not enough evidence to indicate that less than 80% of orders will be delivered within 24 hours
Note: use of critical region method scores M1 for region {0,1,2,…,9, 10} M1dep for 12 does not lie in critical region then A1dep E1dep as per scheme
B1 for definition of p B1 for H0 B1 for H1 M1 for probability 0.1329 M1dep strictly for comparison of 0.1329 with 5% (seen or clearly implied) A1dep on both M’s E1dep on M1,M1,A1 for conclusion in context
7

4766 Mark Scheme January 2009
53
(iii) Let X ~ B(18, 0.8) H1: p ≠ 0.8 LOWER TAIL P(X ≤ 10) = 0.0163 < 2.5% P(X ≤ 11) = 0.0513 > 2.5% UPPER TAIL P(X ≥ 17) = 1 – P(X ≤ 16) = 1 – 0.9009 = 0.0991 > 2.5% P(X ≥ 18) = 1 – P(X ≤ 17) = 1 – 0.9820 = 0.0180 < 2.5% So critical region is {0,1,2,3,4,5,6,7,8,9,10,18} o.e.
Condone X ≤ 10 and X ≥ 18 or X = 18 but not p(X ≤ 10) and
p(X ≥ 18)
Correct CR without supportive working scores SC2 max after
the 1st B1 (SC1 for each fully correct tail of CR)
B1 for H1 B1 for 0.0163 or 0.0513 seen M1dep for either correct comparison with 2.5% (not 5%) (seen or clearly implied) A1dep for correct lower tail CR (must have zero) B1 for 0.0991 or 0.0180 seen M1dep for either correct comparison with 2.5% (not 5%) (seen or clearly implied) A1dep for correct upper tail CR
7
TOTAL 19

4766 Mark Scheme June 2009
67
4766 Statistics 1
Q1 (i) Median = 2
Mode = 1
B1 CAO B1 CAO
2
(ii)
0
10
20
30
40
50
60
1 2 3 4
Number o f P eople
S1 labelled linear scales on both axes H1 heights
2
(iii) Positive B1 1 TOTAL 5 Q2 (i)
255
⎛ ⎞⎜ ⎟⎝ ⎠
different teams = 53130
M1 for 255
⎛ ⎞⎜ ⎟⎝ ⎠
A1 CAO
2
(ii) 14 11364 55 20020
3 2⎛ ⎞ ⎛ ⎞
× = × =⎜ ⎟ ⎜ ⎟⎝ ⎠ ⎝ ⎠
M1 for either combination M1 for product of both A1 CAO
3
TOTAL 5
Q3 (i) Mean =
12612
= 10.5
Sxx = 21261582
12− = 259
s = 25911
= 4.85
B1 for mean M1 for attempt at Sxx A1 CAO
3
(ii) New mean = 500 + 100 ×10.5 = 1550
New s = 100 ×4.85 = 485
B1 ANSWER GIVEN M1A1FT
3
(iii) On average Marlene sells more cars than Dwayne.
Marlene has less variation in monthly sales than Dwayne.
E1 E1FT
2
TOTAL 8

4766 Mark Scheme June 2009
68
Q4 (i)
E(X) = 25 because the distribution is symmetrical. Allow correct calculation of Σrp
E1 ANSWER GIVEN
1
(ii) E(X2) = 2 2 2 210 0.2 20 0.3 30 0.3 40 0.2× + × + × + × = 730 Var(X) = 730 – 252 = 105
M1 for Σr2p (at least 3 terms correct) M1dep for – 25² A1 CAO
3
TOTAL 4 Q5 (i)
Distance freq width f dens
0- 360 50 7.200 50- 400 50 8.000 100- 307 100 3.070
200-400 133 200 0.665
M1 for fds A1 CAO Accept any suitable unit for fd such as eg freq per 50 miles. L1 linear scales on both axes and label W1 width of bars H1 height of bars
5
(ii) Median = 600th distance Estimate = 50 + 240/400 × 50 = 50 + 30 = 80
B1 for 600th M1 for attempt to interpolate A1 CAO
3
TOTAL 8
Q6 (i) (A) P(at most one) =
83 0.83100
=
(B) P(exactly two) =10 2 1 13 0.13
100 100+ + = =
B1 aef M1 for (10+2+1)/100 A1 aef
1
2
(ii) P(all at least one) =
53 52 51 140556 0.145100 99 98 970200
× × = =
M1 for 53100
×
M1dep for product of next 2 correct fractions A1 CAO
3
TOTAL 6

4766 Mark Scheme June 2009
69
Q7 (i)
a = 0.8, b = 0.85, c = 0.9.
B1 for any one B1 for the other two
2
(ii) P(Not delayed) = 0.8 × 0.85 × 0.9 = 0.612
P(Delayed) = 1 – 0.8 × 0.85 × 0.9 = 1 – 0.612 = 0.388
M1 for product A1 CAO M1 for 1 – P(delayed) A1FT
4
(iii) P(just one problem)
= 0.2×0.85×0.9 + 0.8×0.15×0.9 + 0.8×0.85×0.1
= 0.153 + 0.108 + 0.068 = 0.329
B1 one product correct M1 three products M1 sum of 3 products A1 CAO
4
(iv) P(Just one problem | delay)
= P(Just one problem and delay) 0.329
P(Delay) 0.388= = 0.848
M1 for numerator M1 for denominator A1FT
3
(v) P(Delayed | No technical problems)
Either = 0.15 + 0.85 × 0.1 = 0.235
Or = 1 – 0.9 × 0.85 = 1 – 0.765 = 0.235
Or = 0.15 × 0.1 + 0.15 × 0.9 + 0.85 × 0.1 = 0.235
Or (using conditional probability formula)
P(Delayed and no technical problems)P(No technical problems)
0.8 0.15 0.1 0.8 0.15 0.9 0.8 0.85 0.10.8
0.188 0.2350.8
× × + × × + × ×=
= =
M1 for 0.15 + M1 for second term A1CAO M1 for product M1 for 1 – product A1CAO M1 for all 3 products M1 for sum of all 3 products A1CAO M1 for numerator M1 for denominator A1CAO
3
(vi) Expected number = 110 × 0.388 = 42.7 M1 for product A1FT
2
TOTAL 18

4766 Mark Scheme June 2009
70
Q8 (i)
X ~ B(15, 0.2)
3 1215( ) P( = 3) 0.2 0.8 0.2501
3
⎛ ⎞= × × =⎜ ⎟⎝ ⎠
A X
OR from tables 0.6482 0.3980 0.2502− =
( ) P( 3) 1 0.3980 0.6020≥ = − =B X
(C) E(X) = np = 15 × 0.2 = 3.0
M1 0.23 × 0.812
M1 ( )153 × p3 q12
A1 CAO OR: M2 for 0.6482 – 0.3980 A1 CAO M1 P(X≤2) M1 1-P(X≤2) A1 CAO M1 for product A1 CAO
3 3 2
(ii) (A) Let p = probability of a randomly selected child eating at least 5 a day H0: p = 0.2 H1: p > 0.2 (B) H1 has this form as the proportion who eat at least 5 a day is expected to increase.
B1 for definition of p in context B1 for H0 B1 for H1 E1
4
(iii) Let X ~ B(15, 0.2) P(X ≥ 5) = 1 – P(X ≤ 4) = 1 – 0.8358 = 0.1642 > 10% P(X ≥ 6) = 1 – P(X ≤ 5) = 1 – 0.9389 = 0.0611 < 10% So critical region is {6,7,8,9,10,11,12,13,14,15}
7 lies in the critical region, so we reject null hypothesis and we conclude that there is evidence to suggest that the proportion who eat at least five a day has increased.
B1 for 0.1642 B1 for 0.0611 M1 for at least one comparison with 10% A1 CAO for critical region dep on M1 and at least one B1 M1 dep for comparison A1 dep for decision and conclusion in context
6
TOTAL 18

4766 Mark Scheme January 2010
46
4766 Statistics 1
1 (i) 5 2 6 3 4 7 8 7 1 2 2 3 4 5 5 7 9 8 1 Key 6 3 represents 63 mph
G1 stem G1 leaves CAO G1 sorted G1 key [4]
(ii) Median = 72 Midrange = 66.5
B1 FT B1 CAO [2]
(iii)
EITHER: Median since midrange is affected by outlier (52) OR: Median since the lack of symmetry renders the midrange less representative
E1 for median E1 for explanation [2]
TOTAL [8]
2 (i) (A) P(X = 10) = P(5 then 5) = 0.4×0.25 = 0.1
(B) P(X = 30) = P(10 and 20) = 0.4×0.25 + 0.2×0.5 = 0.2
B1 ANSWER GIVEN M1 for full
calculation A1 ANSWER GIVEN
[1]
[2] (ii) E(X) = 10 0.1 15 0.4 20 0.1 25 0.2 30 0.2 20× + × + × + × + × =
E(X2) = 100 0.1 225 0.4 400 0.1 625 0.2 900 0.2 445× + × + × + × + × = Var(X) = 445 – 202 = 45
M1 for Σrp (at least 3 terms correct)
A1 CAO M1 for Σr2p (at least 3
terms correct) M1 dep for – their
E (X )² A1 FT their E(X)
provided Var( X ) > 0
[5]
TOTAL [8]
3 (i) G1 for two labelled
intersecting circles G1 for at least 2
correct probabilities
G1 for remaining
probabilities [3]
(ii) P(G) × P(R) = 0.24 × 0.13 = 0.0312 ≠ P(G∩R) or ≠ 0.06 So not independent.
M1 for 0.24 × 0.13 A1 [2]
0.18 0.06
0.69
G R
0.07

4766 Mark Scheme January 2010
47
(iii)
( ) 0.06 1( | ) 0.25( ) 0.24 4
P R GP R GP G
∩= = = =
M1 for numerator M1 for denominator A1 CAO
[3]
TOTAL [8]
4 (i)
P(20 correct) = 20 10300.6 0.4 0.1152
20
× × =
M1 0.620 × 0.410
M1 ( )3020 × p20 q10
A1 CAO
[3]
(ii) Expected number = 100 × 0.1152 = 11.52
M1 A1 FT (Must not
round to whole number)
[2]
TOTAL [5]
5 (i) P(Guess correctly) = 0.14 = 0.0001 B1 CAO [1]
(ii)
P(Guess correctly) = 1 14! 24
= M1 A1 CAO
[2]
TOTAL [3]
6 (i) 20 × 19 × 18 = 6840 M1
A1 [2]
(ii) 203 – 20 = 7980 M1 for figures – 20
A1 [2]
TOTAL [4]

4766 Mark Scheme January 2010
48
7 (i) 10 × 2 = 20. M1 for 10 × 2
A1 CAO [2]
(ii)
Mean = 10 65 35 75 55 85 20 95 9850 82.08120 120
× + × + × + × = =
It is an estimate because the data are grouped.
M1 for midpoints M1 for double pairs A1 CAO E1 indep
[4]
(iii)
10 × 652 + 35 × 752 + 55 × 852 + 20 × 952 (= 817000)
M1 for Σfx2
Sxx =
29850817000120
− (= 8479.17)
s = 8479.17119
= 8.44
M1 for valid attempt at Sxx A1 CAO [3]
(iv) x – 2s = 82.08 – 2×8.44= 65.2
x + 2s = 82.08 + 2×8.44= 98.96 So there are probably some outliers.
M1 FT for x – 2s M1 FT for x + 2s A1 for both E1 dep on A1
[4]
(v) Negative. E1
[1]
(vi) Upper bound 60 70 80 90 100
Cumulative frequency 0 10 45 100 120
C1 for cumulative frequencies
S1 for scales L1 for labels ‘Length and CF’ P1 for points J1 for joining points
dep on P1 All dep on attempt at cumulative frequency.
[5]
TOTAL [19]

4766 Mark Scheme January 2010
49
8 (i) (A) P(Low on all 3 days) = 0.53 = 0.125 or 1/8
(B) P(Low on at least 1 day) = 1 – 0.53 = 1 – 0.125 = 0.875 (C) P(One low, one medium, one high) = 6 × 0.5 × 0.35 × 0.15 = 0.1575
M1 for 0.53
A1 CAO M1 for 1 – 0.53 A1 CAO M1 for product of probabilities 0.5 × 0.35 × 0.15 or 21/800 M1 × 6 or × 3! or 3P3 A1 CAO
[2]
[2]
[3]
(ii)
X ~ B(10, 0.15) (A) P(No days) = 0.8510 = 0.1969 Or from tables P(No days) = 0.1969
(B) Either 1 910P(1 day) 0.15 0.85 0.3474
1
= × × =
or from tables P(1 day) = P(X ≤ 1) – P(X ≤ 0) = 0.5443 – 0.1969 = 0.3474
M1 A1 M1 0.151 × 0.859 M1 ( )10
1 × p1 q9
A1 CAO OR: M2 for 0.5443 –
0.1969 A1 CAO
[2]
[3]
(iii) Let X ~ B(20, 0.5)
Either: P(X ≥ 15) = 1 – 0.9793 = 0.0207 < 5% Or: Critical region is {15,16,17,18,19,20} 15 lies in the critical region. So there is sufficient evidence to reject H0 Conclude that there is enough evidence to indicate that the probability of low pollution levels is higher on the new street. H1 has this form as she believes that the probability of a low pollution level is greater in this street.
Either: B1 for correct probability of 0.0207 M1 for comparison Or: B1 for CR, M1 for comparison A1 CAO dep on B1M1 E1 for conclusion in
context E1 indep
[5]
TOTAL [17]

Oxford Cambridge and RSA Examinations
GCE
Mathematics (MEI) Advanced Subsidiary GCE 4766
Statistics 1
Mark Scheme for June 2010
4766 Mark Scheme June 2010
Q1 (i)
Positive skewness
B1
1
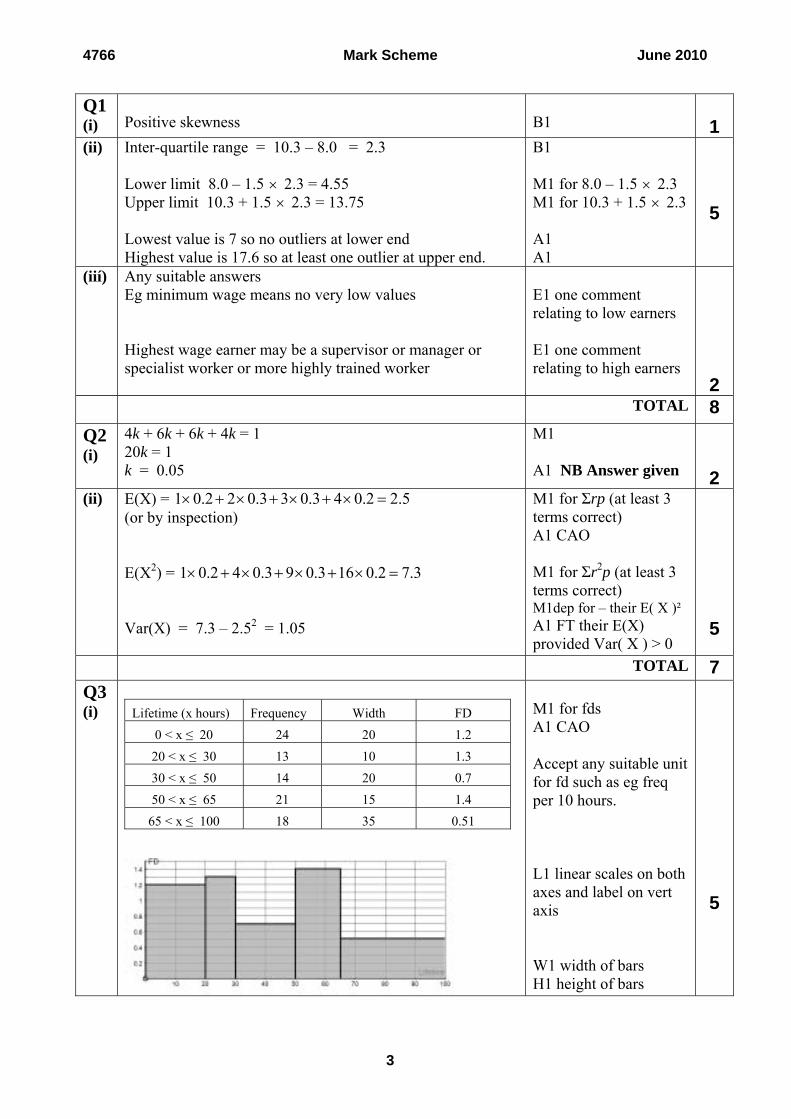
(ii) Inter-quartile range = 10.3 – 8.0 = 2.3 Lower limit 8.0 – 1.5 2.3 = 4.55 Upper limit 10.3 + 1.5 2.3 = 13.75 Lowest value is 7 so no outliers at lower end Highest value is 17.6 so at least one outlier at upper end.
B1 M1 for 8.0 – 1.5 2.3 M1 for 10.3 + 1.5 2.3 A1 A1
5
(iií) Any suitable answers Eg minimum wage means no very low values Highest wage earner may be a supervisor or manager or specialist worker or more highly trained worker
E1 one comment relating to low earners E1 one comment relating to high earners
2 TOTAL 8 Q2 (i)
4k + 6k + 6k + 4k = 1 20k = 1 k = 0.05
M1 A1 NB Answer given
2 (ii) E(X) = 1 0.2 2 0.3 3 0.3 4 0.2 2.5
(or by inspection) E(X2) = 1 0.2 4 0.3 9 0.3 16 0.2 7.3 Var(X) = 7.3 – 2.52 = 1.05
M1 for Σrp (at least 3 terms correct) A1 CAO M1 for Σr2p (at least 3 terms correct) M1dep for – their E( X )² A1 FT their E(X) provided Var( X ) > 0
5
TOTAL 7 Q3 (i)
Lifetime (x hours) Frequency Width FD
0 < x ≤ 20 24 20 1.2 20 < x ≤ 30 13 10 1.3 30 < x ≤ 50 14 20 0.7 50 < x ≤ 65 21 15 1.4
65 < x ≤ 100 18 35 0.51
M1 for fds A1 CAO Accept any suitable unit for fd such as eg freq per 10 hours. L1 linear scales on both axes and label on vert axis W1 width of bars H1 height of bars
5
3

4766 Mark Scheme June 2010
(ii) Median lies in third class interval (30 < x ≤ 50) Median = 45.5th lifetime (which lies beyond 37 but not as far as 51)
B1 CAO E1 dep on B1
2
TOTAL 7 Q4 (i)
1 × 15
= 15
M1 A1
2
(ii) 4 3 2 1 241 0.03845 5 5 5 625
M1 For
54
541 justor
M1 dep for fully correct product A1
3
(iii) 1 – 0.0384 = 0.9616 or 601/625 B1 1 TOTAL 6 Q5 (i)
Mean =
0 37 1 23 2 11 3 3 4 0 5 1 59 0.78775 75
Sxx = 2
2 2 2 2 2 2 590 37 1 23 2 11 3 3 4 0 5 1 72.5975
s = 72.5974
= 0.99
M1 A1 M1 for Σfx2 s.o.i. M1 dep for good attempt at Sxx BUT NOTE M1M0 if their Sxx < 0 A1 CAO
5
(ii) New mean = 0.787 × £1.04 = £0.818 or 81.8 pence
New s = 0.99 × £1.04 = £1.03 or 103 pence
B1 ft their mean B1 ft their s B1 for correct units dep on at least 1 correct (ft)
3
TOTAL 8 Section B
Q6 (i)
X ~ B(18, 0.1) 2 1618
( ) P(2 faulty tiles) 0.1 0.9 0.28352
A
OR from tables 0.7338 0.4503 0.2835 ( ) P(More than 2 faulty tiles) 1 0.7338 0.2662 B
M1 0.12 0.916 M1 p18
22 q16
A1 CAO OR: M2 for 0.7338 – 0.4503 A1 CAO M1 P(X≤2) M1 dep for 1-P(X≤2) A1 CAO
3
3 4
4766 Mark Scheme June 2010
5
0.95
0.05 Late
0.6
0.4
On time
On time
On time 0.95
0.05 Late
Late
1000
1100
On time 0.95
Late
On time
0.05
0.95
0.05 Late
1200
On time
On time
Late
Late
0.6
0.4
0.6
0.4
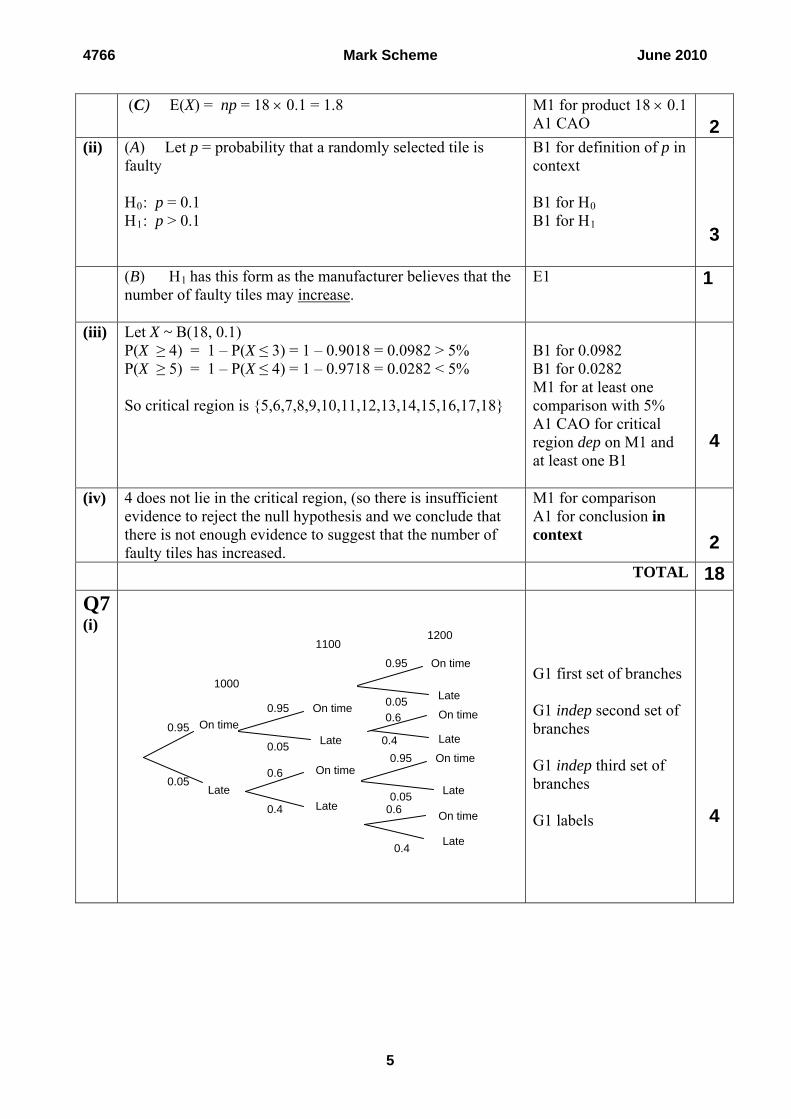
(C) E(X) = np = 18 0.1 = 1.8 M1 for product 18 0.1 A1 CAO
2
(ii) (A) Let p = probability that a randomly selected tile is faulty H0: p = 0.1 H1: p > 0.1
B1 for definition of p in context B1 for H0 B1 for H1
3
(B) H1 has this form as the manufacturer believes that the number of faulty tiles may increase.
E1
1
(iii) Let X ~ B(18, 0.1) P(X ≥ 4) = 1 – P(X ≤ 3) = 1 – 0.9018 = 0.0982 > 5% P(X ≥ 5) = 1 – P(X ≤ 4) = 1 – 0.9718 = 0.0282 < 5% So critical region is {5,6,7,8,9,10,11,12,13,14,15,16,17,18}
B1 for 0.0982 B1 for 0.0282 M1 for at least one comparison with 5% A1 CAO for critical region dep on M1 and at least one B1
4
(iv) 4 does not lie in the critical region, (so there is insufficient evidence to reject the null hypothesis and we conclude that there is not enough evidence to suggest that the number of faulty tiles has increased.
M1 for comparison A1 for conclusion in context
2 TOTAL 18Q7 (i)
G1 first set of branches G1 indep second set of branches G1 indep third set of branches G1 labels
4
4766 Mark Scheme June 2010
6
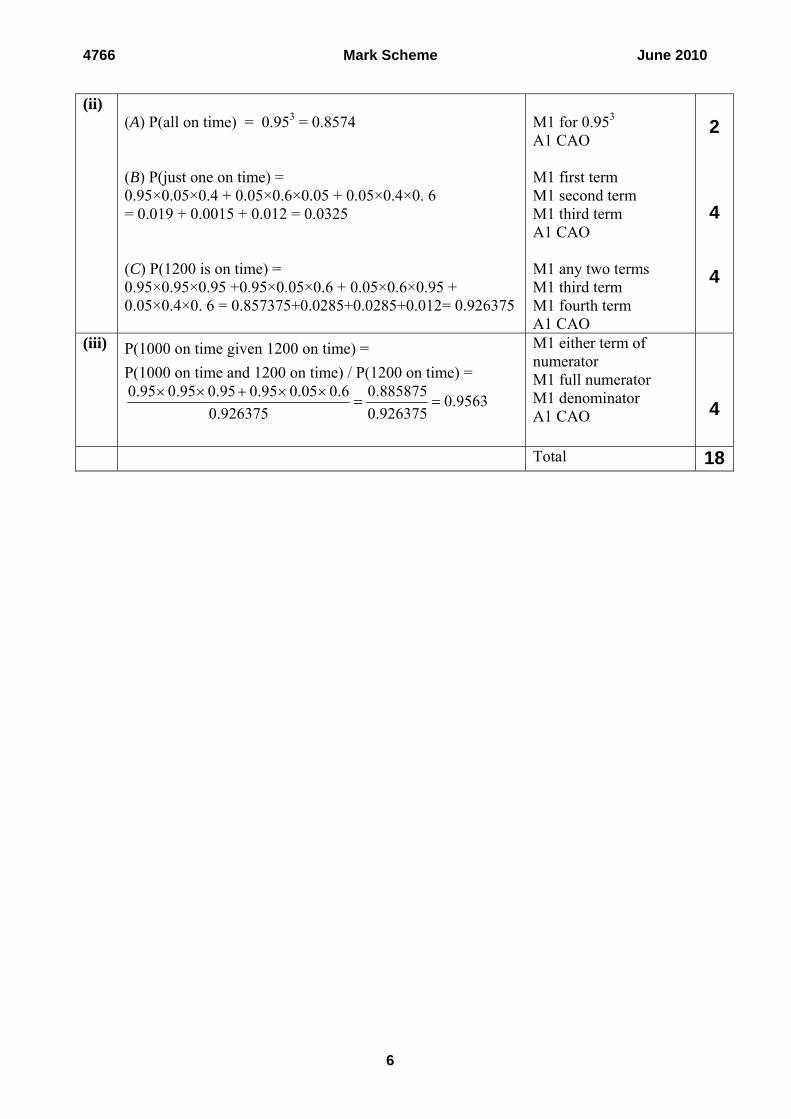
(ii)
(A) P(all on time) = 0.953 = 0.8574 (B) P(just one on time) = 0.95×0.05×0.4 + 0.05×0.6×0.05 + 0.05×0.4×0. 6 = 0.019 + 0.0015 + 0.012 = 0.0325 (C) P(1200 is on time) = 0.95×0.95×0.95 +0.95×0.05×0.6 + 0.05×0.6×0.95 + 0.05×0.4×0. 6 = 0.857375+0.0285+0.0285+0.012= 0.926375
M1 for 0.953 A1 CAO M1 first term M1 second term M1 third term A1 CAO M1 any two terms M1 third term M1 fourth term A1 CAO
2
4
4
(iii) P(1000 on time given 1200 on time) = P(1000 on time and 1200 on time) / P(1200 on time) = 0.95 0.95 0.95 0.95 0.05 0.6 0.885875 0.9563
0.926375 0.926375
M1 either term of numerator M1 full numerator M1 denominator A1 CAO
4
Total 18

GCE
Oxford Cambridge and RSA Examinations
Advanced Subsidiary GCE
Unit 4766: Statistics 1
Mathematics (MEI)
Mark Scheme for January 2011
4766 Mark Scheme January 2011
SECTION A Q1 (i)
Mode = 960 (grams) Median = 1020 (grams) N.B. 96 and 102 gets SC1
B1 CAO B1 CAO
2
Ignore units and working
(ii) Positive E1 1 Not right skewed Not positive correlation
TOTAL 3 Q2 (i) P(product of two scores < 10) = 13
16 = 0.8125
B1 1
Allow 0.813 or 0.812
(ii)
P(even) P(< 10) = 0.5 1316
= 1332
= 0.40625
P(even ∩ < 10) = 616
= 0.375
So not independent.
M1 for 0.5 1316
or 1332
FT their answer to (i)
M1 for 616
A1
3
Do not allow these embedded in probability formulae Also allow P(even|<10) = 6/13≠ P(even) = 1/2 Or P(<10|even) = 6/8≠ P(<10) = 13/16 Or P(even|<10) = 6/13≠ P(even|<10’) = 2/3 Or P(<10|even) = 6/8≠ P(<10|even’) = 7/8 For all of these alternatives allow M2 for both probabilities. (M1 not available except if they correctly state both probabilities EG P(even|<10) and P(even) and get one correct) If they do not state what probabilities they are finding, give M2 for one of the above pairs of probabilities with ≠ symbol
TOTAL 4
1

4766 Mark Scheme January 2011
Q3 (i)
133
ways of choosing the men = 286
M1 for seen 133
A1
2
Accept 13C3 or 13!/(3!10!) or equivalent for M1 No marks for permutations
(ii) 133
× = 286 × 120 = 34320 103
M1 for product A1 FT their 286
2
For permutations 1716 × 720 = 1235520 allow SC1 406 (from 286 + 120) scores SC1 (without further working)
(iii) 236
=100947
34320/100947 = 1040/3059 = 0.340 (allow 0.34)
M1 for denominator of 23
6
A1 FT
2
FT their 34320 Or 6C3×13/23×12/22×11/21×10/20×9/19×8/18 = 0.340 scores M1 for product of fractions and A1 for 6C3× and correct evaluation For permutations 1235520/72681840=0.017 scores SC1 Allow full marks for fractional answers, even if unsimplified 406/100947 = 0.00402 gets M1A1 with or without working
TOTAL 6
2

4766 Mark Scheme January 2011
Q4 (i)
2k + 6k + 12k + 20k + 30k = 1, 70k = 1
k = 170
M1 A1 NB ANSWER GIVEN
2
For five multiples of k (at least four correct multiples) Do not need to sum or =1 for M1 Condone omission of either 70k = 1 or k = 1/70 but not both Condone omission of k: 2+6+12+20+30=70 Allow substitution of k = 1/70 into formula and getting at least four of 2/70, 6/70, 12/70, 20/70, 30/70 for M1 and 2/70+6/70+12/70+20/70+30/70 = 1 for A1
(ii) E(X) = 2 6 12 20 301 2 3 4 5 470 70 70 70 70
E(X2) =
2 6 12 20 30 12041 4 9 16 25 17.270 70 70 70 70 70
Var(X) = 17.2 – 42 = 1.2
M1 for Σrp (at least 3 terms correct) A1 CAO M1 for Σr2p (at least 3 terms correct) M1dep for - their E(X )² A1 FT their E(X) but not an error in E(X2) provided Var( X ) > 0
5
280/70 scores M1A0 USE of E(X-µ) gets M1 for attempt at (x-µ) should see (-3) , (-2) , (-1) , 0 , 1 (if E(X) correct but FT their E(X)) (all 5 correct for M1), then M1 for Σp(x-µ)
2 2
2 2 2 2 2
2 (at least 3 terms correct with their probabilities) Allow all M marks with their probabilities, (unless not between 0 and 1, see below for all probs 1/70). Division by 5 or other spurious value at end gives max M1A1M1M1A0, or M1A0M1M1A0 if E(X) also divided by 5. Unsupported correct answers get 5 marks. SC2 for use of 1/70 for all probabilities leading to E(X) = 3/14 and Var(X) = 145/196 = 0.74
TOTAL 7
3

4766 Mark Scheme January 2011
Q5 (i)
P(Wet and bus) = 0.4 0.7
= 0.28
M1 for multiplying probabilities
A1 CAO
2
Fractional answer = 7/25 (Allow 28/100)
(ii) P(Walk or bike) = 0.6 0.5 + 0.6 0.4 + 0.4 0.2 + 0.4 0.1 or 0.3+0.24+0.08+0.04 = 0.66
M1 for any two correct pairs M1 for sum of all four correct terms With no extra terms for second M1 A1 CAO
3
Or = 0.6 0.9 + 0.4 0.3 gets M1 for either term = 0.54 + 0.12 gets M1 for sum of both A1 CAO Or = 1 – 0.6×0.1 – 0.4×0.7 = 0.66. M1 for 1 – one correct term, M1 for complete correct expression and A1 for correct evaluation.
(iii) P(Dry given walk or bike) P(Dry and walk or bike)
P(Walk or bike)
= 0.6 0.90.66 = 0.54
0.66=
119 = 0.818
M1 for numerator leading to 0.54 M1 for denominator Ft their P(Walk or bike) from (ii) provided between 0 and 1 A1 FT
3
Allow 0.82, not 0.819 More accurate answer =0.81818 Fractional answer = 54/66 = 27/33 = 9/11 Condone answer of 0.8181 Do not give final A1 if ans ≥ 1
TOTAL 8
4

4766 Mark Scheme January 2011
Q6 (i) (A) P(Avoided air travel) = 7
100= 0.07
(B) P(At least two) =11 2 1 4 18 9100 100 50
= 0.18
B1 aef isw M1 for (11+2+1+4)/100 A1 aef isw
1
2
For M1 terms must be added must be as above or better with no extra terms (added or subtracted) for M1 Must simplify to 18/100 or 9/50 or 0.18 for A1 SC1 for 18/58 Or 1 – (14+26+0+42)/100 = 0.18 gets M1A1
(ii) P(Reduced car use | Avoided air travel) = 67
= 0.857
M1 for denominator 7 or 7/100 or 0.07 FT their (i)A A1 CAO
2
Allow 0.86
(iii) P(None have avoided air travel) = 93 92 91 0.8025100 99 98
M1 for 93/100× (triple product) M1 for product of remaining fractions A1
3
Fuller answer 0.802511, so allow 0.803 without working, but 0.80 or 0.8 only with working . (93/100)3 scores M1M0A0 which gives answer 0.804357 so watch for this. M0M0A0 for binomial probability including 0.93100 but 3C0×0.070×0.933 still scores M1 (k/100)3 for values of k other than 93 scores M0M0A0
( 1) ( 2)100 99 98
k k k for values of k other than 93 scores
M1M0A0 Correct working but then multiplied or divided by some factor scores M1M0A0 93P3 / 100P3 = 0.803 93P3 seen M1 divided by 100P3 M1 0.803 A1 93C / 100
3 C3 = 0.803 Allow unsimplified fractional answer 778596/970200 =9269/11550
TOTAL 8
5

4766 Mark Scheme January 2011
SECTION B Q7 (i)
Income Frequency Width FD
0 ≤ x ≤ 20 238 20 11.9 20 < x ≤ 40 365 20 18.25 40 < x ≤ 60 142 20 7.1 60 < x≤ 100 128 40 3.2
100 < x ≤ 200 45 100 0.�5
INCORRECT DIAGRAMS: Frequency diagrams can get M0, A0, L0, W1, H0 MAXIMUM Thus frequency density = frequency × width, frequency/midpoint etc gets MAX M0A0L0W1H0
M1 for fds A1 CAO Accept any suitable unit for fd such as eg freq per £1000. L1 linear scale and label on vertical axis W1 linear scale on horizontal axis and correct width of bars H1 height of bars
5
At least 4 fds correct for M1 M1 can be also be gained from freq per 10K - 119, 182.5, 71, 32, 4.5 (at least 4 correct) and A1 for all correct Accept any suitable unit for fd, eg freq per £10K, BUT NOT FD per £1000 Allow fds correct to at least one dp If fd not explicitly given, M1 A1 can be gained from all heights correct (within one square) on histogram (and M1A0 if at least 4 correct) Allow restart although given fd wrong For L1, label required on vert axis in relation to first M1 mark ie fd or frequency density or if relevant freq/£10K, freq/£k etc (NOT fd/£10K) Accept f/w or f/cw (freq/width or freq/class width) Ignore horizontal label L1 can also be gained from an accurate key – may see 1 square = 36.5 or 23.8 or 14.2 For W1, must be drawn at 0, 20, 40 etc NOT 19.5 or 20.5 etc NO GAPS ALLOWED Must have linear scale. No inequality labels on their own such as 0≤I<20, 20≤I<40 etc but allow if a clear horizontal linear scale is also given. FT of heights dep on M1 all must agree with their fds If fds not given and one height is wrong then max M1A0L1W1H0 – visual check only (within one square) –no need to measure precisely
6

4766 Mark Scheme January 2011
(ii)
Mean = 918
4515012880142503653023810
= 918
37420 = 40.8
M1 for midpoints M1 for midpoints ×frequencies with divisor 918 A1 CAO
3
At least three midpoints correct for M1 (seen in (ii) or in table in (i)) No marks if not using midpoints Second M1 for sight of at least 3 double pairs seen out of 10 × 238 + 30 × 365 + 50 × 142 + 80 × 128 + 150 × 45 with divisor 918 Numerator = 2380+10950+7100+10240+6750 Use of LCB or UCB for midpoints here scores 0 For answer 40.76 or 40.8 or 41 mark as B3 37420/918 o.e. scores M1M1A0 NB Accept answers seen without working in part (ii) or (iii) (from calculator) Use of ‘not quite right’ midpoints such as 10.5, 30.5, etc can get M0M1A0 here and SC3 in (iii) Watch for incorrect method 238/10+365/30+142/50+128/80+45/150=40.71 Allow max 4 sf in final answer Also accept £40760, £40800 etc
(iii) ∑fx = 238×10 + 365×30 + 142×50 + 128×80 + 45×1502 2 2 2 2 2 = 2539000 Or 238×100 + 365×900 + 142×2500 + 128×6400 + 45×22500 = 2539000 Or 2380×10 + 10950×300 + 7100×50 + 10240×80 + 13500×150 =2539000
Sxx = 2374202539000
918 = 1013666
s = 1013666917
= 33.2
M1 for at least 3 multiples fx2 A1 for Σfx2
M1 for attempt at Sxx Dep on first M1 BUT NOTE M1M0 if their Sxx < 0 A1 CAO If using LCB or UCB
4
For A1, all midpoints and frequencies correct Or Sxx = 2539000 – 918 × 40.76 = 1013855, s=33.25. Using mean 40.8 leads to 1010861 , s=
2
33.20, Using mean = 41 leads to Sxx = 995844 and s = 32.95 M1M1 for ∑f(x-xbar) M1 for first three terms, M1 for all 5 terms
2
238 × (10-40.76) + 365 × (30-40.76) + 142 × (50-40.76) + 128 × (80-40.76) + 45 × (150-40.76) (= 1013666) A1 for
2 2
2 2 2
Sxx = 1013666 A1 for final answer
7
4766 Mark Scheme January 2011
consistently then allow SC2 if working is fully correct but SC0 otherwise but no marks in part (ii)
For answer 33.25 or 33.3 or 33.2 (www) can just mark as B4 - these may be from calculator without working Allow 33 with correct working rmsd = √(1013666/918) (=33.23) gets M1A1M1A0 (if seen) WATCH FOR DIVISOR OF 918 Allow max 4 sf in final answer Allow £33200 etc
(iv) ( x – 2s = 40.76 – 2 33.25 = –25.74 ) x + 2s = 40.76 + 2 33.25 = 107.26 Comment that there are almost certainly some outliers. Appropriate comment such as
‘No, since there is nothing to indicate that these high earners represent a separate population.’
M1 for x + 2s or x – 2s
A1 for 107.26 (FT) E1 E1 Dep on upper limit in range 106 - 108
4
FT any positive mean and positive sd for M1 Only follow through numerical values, not variables such as s, so if a candidate does not find s but then writes here ‘limit is 40.76+ 2 standard deviation’, do NOT award M1 (This rule of not following through variables applies in all situations) Award E0E0 if their upper limit > 200 Allow ‘Must be some outliers’ Allow any comments that implies that there are outliers No marks in (iv) unless using x + 2s or x – 2s
(v) New mean = 1.15 × 40.76 = 46.87 New variance = 1.152 × 33.252 = 1462
For misread 1.5 in place of 1.15 For 1.5 × 40.76 = 61.1 and 1.52 × 33.252 = 2490 allow SC2 if all present but SC0 otherwise
B1 FT M1A1 FT
3
FT their mean (if given to ≥ 2 s.f.) FT their s (if given to ≥ 2 s.f.) provided their s>0 If RMSD found in part (i) rather than s, then FT their RMSD For new SD = 38.24 found instead of variance give M1A0 even if called variance (and FT their s) M0A0 for 1.15 x 33.252= 1271 Allow max 4 sf in final answers Min 2 sf If candidate ‘starts again’ only award marks for CAO
TOTAL 19
8

4766 Mark Scheme January 2011
Q8 (i)
E(X) = np = 12 0.2 = 2.4 Do not allow subsequent rounding.
M1 for product A1 CAO
2
If wrong n used consistently throughout, allow M marks only. NB If they round to 2, even if they have obtained 2.4 first they get M1A0. For answer of ‘2.4 or 2 if rounded up’ allow M1A0 Answer of 2 without working gets M0A0. If they attempt E(X) by summing products xp give no marks unless answer is fully correct.
(ii)
X ~ B(12, 0.2)
2 1012( ) P(Wins exactly 2) 0.2 0.8 0.2835
2
A
OR from tables 0.5583 0.2749 0.2834
M1 0.22 0.810
M1 122 p2 q10
A1 CAO OR: M2 for 0.5583 – 0.2749 A1 CAO
3
With p + q = 1 Also for 66 × 0.004295 Allow answers within the range 0.283 to 0.284 with or without working or 0.28 to 0.283 if working shown See tables at the website http://www.mei.org.uk/files/pdf/formula_book_mf2.pdf
( ) P(Wins at least 2) 1 0.2749 0.7251 B
M1 P(X≤1) M1 1-P(X≤1) A1 CAO
3
M1 0.2749 seen M1 1 – 0.2749 seen Allow 0.725 to 0.73 but not 0.72. Point probability method: P(1) = 12×0.2×0.811 = 0.2062 , P(0) = 0.812 = 0.0687 So P(X≤1) = 0.2749 gets M1 then mark as per scheme SC1 for 1 – P(X≤2) = 1 – 0.5583 = 0.4417 For misread of tables value of 0.2749 , allow 0 in (A) but MAX M1M1 in (B) For P(X>1) = P(X=2) + P(X=3) + P(X=4) +.... allow M1 for 0.2835+0.2362+0.1329+0.0532+0.0155 and second M1 for 0.0033+0.0005+0.0001 and A1 for 0.725 or better M0M0A0 for 1 - P(X=1) = 1 – 0.2062 = 0.7938
9

4766 Mark Scheme January 2011
(iii) Let p = probability that Ali wins a game H0: p = 0.2 H1: p > 0.2 H1 has this form as Ali claims that he is better at winning games than Mark is. EITHER Probability method: P(X ≥ 7) = 1 – P(X ≤ 6) = 1 – 0.9133 = 0.0867 > 5% So not significant, so there is not enough evidence to reject the null hypothesis and we conclude that there is not enough evidence to suggest that Ali is better at winning games than Mark. Must include ‘not enough evidence’ or something similar for E1. ‘Not enough evidence’ can be seen in the either for the A mark or the E mark. Do not allow final conclusions for E1 such as : 'there is evidence to suggest that Ali is no better at winning games than Mark' or 'Mark and Ali have equal probabilities of winning games'
B1 for definition of p in context B1 for H0 B1 for H1 E1 B1 for P(X ≥ 7) B1 for 0.0867 Or 1 – 0.9133 seen M1 for comparison with 5% dep on B1 for 0.0867 A1 for not significant or ‘accept H0’ or ‘cannot reject H0’ or ‘reject H1’ E1 dep on M1A1 Do not award first B1 for poor symbolic notation such as P(X = 7) = 0.0867 This comment applies to all methods
4
5
Minimum needed for B1 is p = probability that Ali wins. Allow p = P(Ali wins) for B1 Definition of p must include word probability (or chance or proportion or percentage or likelihood but NOT possibility). Preferably as a separate comment. However can be at end of H as long as it is a clear definition ‘ p = the probability that Ali wins a game, NOT just a sentence ‘probability is 0.2’
0
H : p(Ali wins) = 0.2, H : p(Ali wins) > 0.2 gets B0B1B1Allow p=20%, allow θ or π and ρ but not x. However allow any single symbol
0 1
if defined / Allow H = p=0.2, Allow H : p=0 0
210
Do not allow H : P(X=x) = 0.2, H : P(0 1 X=x) > 0.2 Do not allow H : =0.2, =20%, P(0.2), p(0.2), p(x)=0.2, x=0.2 (unless x correctly defined as a probability)
0
Do not allow H :p≥0.2, 1Do not allow H and H reversed for B marks but can still get E1
0 1
Allow NH and AH in place of H and H 0 1For hypotheses given in words allow Maximum B0B1B1E1 Hypotheses in words must include probability (or chance or proportion or percentage) and the figure 0.2 oe. Zero for use of point prob - P(X = 7) = 0.0546
10

4766 Mark Scheme January 2011
OR Critical region method: Let X ~ B(20, 0.2) P(X ≥ 7) = 1 – P(X ≤ 6) = 1 – 0.9133 = 0.0867 > 5% P(X ≥ 8) = 1 – P(X ≤ 7) = 1 – 0.9679 = 0.0321 < 5% So critical region is {8,9,10,11,12,13,14,15,16,17,18,19,20}
7 does not lie in the critical region, so not significant, So there is not enough evidence to reject the null hypothesis and we conclude that there is not enough evidence to suggest that Ali is better at winning games than Mark.
B1 for 0.0867 B1 for 0.0321 M1 for at least one comparison with 5% A1 CAO for critical region and not significant or ‘accept H0’ or ‘cannot reject H0’ or ‘reject H1’ dep on M1 and at least one B1 E1 dep on M1A1
Allow any form of statement of CR eg X ≥8, 8 to 20, 8 or above, X > 8, {8, …}, annotated number line, etc but not P(X ≥8) {8,9,10,11,12} gets max B2M1A0 – tables stop at 8. NB USE OF POINT PROBABILITIES gets B0B0M0A0 Use of complementary probabilities Providing there is sight of 95%, allow B1 for 0.9133, B1 for 0.9679, M1 for comparison with 95% A1CAO for correct CR See additional notes below the scheme for other possibilities PLEASE CHECK THAT THERE IS NO EXTRA WORKING ON THE SECOND PAGE IN THE ANSWER BOOKLET
TOTAL 17 NOTE RE OVER-SPECIFICATION OF ANSWERS If answers are grossly over-specified (see instruction 8), deduct the final answer mark in every case, except where there are more than two over-specified answers in a single question (only likely in question 7) in which case deduct a mark in only the first two cases of over-specification in that question. Probabilities should also be rounded to a sensible degree of accuracy. ADDITIONAL NOTES RE Q8 PART iii Use of n = 12 P(X ≥ 7) = 1 – P(X ≤ 6) = 1 – 0.9961 = 0.0039 < 5% So significant or reject H0 etc, so there evidence to suggest that Ali is better at winning games than Mark. Gets B1 for P(X ≥ 7) B1 for 0.0039 M1 for comparison with 5% dep on B1 for 0.0039 A1 for significant E1 for evidence to suggest that Ali is better at winning games than Mark. Then award MR -1 so maximum of 4 possible Comparison with 95% method B1 for P(X ≤ 6) B1 for 0.9133
11

4766 Mark Scheme January 2011
M1 for comparison with 95% dep on B1 A1 for not significant or ‘accept H0’ or ‘cannot reject H0’ E1 Smallest critical region method: Either: Smallest critical region that 7 could fall into gets B1 and has size 0.0867 gets B1, This is > 5% gets M1, A1, E1 as per scheme NB These marks only awarded if 7 used, not other values. Use of k method with no probabilities quoted: P(X ≥ 7) = 1 – P(X ≤ 6) > 5% P(X ≥ 8) = 1 – P(X ≤ 7) < 5% These may be seen in terms of k or n. Either k = 8 or k – 1 = 7 so k = 8 gets SC1 so CR is {8,9,10,11,12,13,14,15, 16, 17, 18, 19, 20} gets another SC1and conclusion gets another SC1 Use of k method with one probability quoted: 1 - 0.9679 < 5% or 0.0321 < 5% gets B0B1M1 P(X ≤ k - 1) = P(X ≤ 7) so k – 1 = 7 so k = 8 (or just k = 8 ) so CR is {8,9,10,11,12,13,14,15, 16, 17, 18, 19, 20} and conclusion gets A1E1 Two tailed test with H1: p≠0.2 Hyp gets max B1B1B0E0 P(X ≥ 7) = 0.0867 gets B1B1comparison with 2.5% gets M1 (must be 2.5%) Final marks A0E0 Two tailed test done but with correct H1: p>0.2 Hyp gets max B1B1B1E1
12
4766 Mark Scheme January 2011
13
if compare with 5% ignore work on lower tail and mark upper tail as per scheme so can score full marks if compare with 2.5% no marks B0B0M0A0E0 One tailed test with H1: p<0.2 Hyp gets max B1B1B0E0 no further marks B0B0M0A0E0 Lower tailed test with H1: p>0.2 Hyp gets max B1B1B0E0 no further marks B0B0M0A0E0 Line diagram method B1 for squiggly line between 7 and 8 or on 8 exclusively (ie just one line), B1dep for arrow pointing to right, M1 0.0321 seen on diagram from squiggly line or from 8, A1E1 for correct conclusion Bar chart method B1 for line clearly on boundary between 7 and 8 or within 8 block exclusively (ie just one line),, B1dep for arrow pointing to right, M1 0.0321 seen on diagram from boundary line or from 8, A1E1 for correct conclusion Using P(Not faulty) method H0: p=0.8, H1: p<0.8, where p represents the prob that Ali loses a game Ali claims that the proportion of games that he loses is less than 80% gets B1B1B1E1 P(X≤13)=0.0867>5% So not significant, so there is not enough evidence to reject the null hypothesis and we conclude that there is not enough evidence to suggest that Ali is better at winning games than Mark. Gets B1B1M1A1E1

Oxford Cambridge and RSA Examinations
GCE
Mathematics (MEI) Advanced Subsidiary GCE
Unit 4766: Statistics 1
Mark Scheme for June 2011

4766 Mark Scheme June 2011
1. Annotations should be used whenever appropriate during your marking. The A, M and B annotations must be used on your standardisation scripts for responses that are not awarded either 0 or full marks. It is vital that you annotate standardisation scripts fully to show how the marks have been awarded. For subsequent marking you must make it clear how you have arrived at the mark you have awarded.
2. For answers scoring no marks, you must either award NR (no response) or 0, as follows:
Award NR (no response) if: Nothing is written at all in the answer space There is a comment which does not in any way relate to the question being asked (“can’t do”, “don’t know”, etc.) There is any sort of mark that is not an attempt at the question (a dash, a question mark, etc.)
The hash key [#] on your keyboard will enter NR.
Award 0 if: There is an attempt that earns no credit. This could, for example, include the candidate copying all or some of the question, or any working
that does not earn any marks, whether crossed out or not.
3. The following abbreviations may be used in this mark scheme. M1 method mark (M2, etc, is also used) A1 accuracy mark B1 independent mark E1 mark for explaining U1 mark for correct units G1 mark for a correct feature on a graph M1 dep* method mark dependent on a previous mark, indicated by * cao correct answer only ft follow through isw ignore subsequent working oe or equivalent rot rounded or truncated sc special case soi seen or implied www without wrong working
1
4766 Mark Scheme June 2011
4. Annotating scripts. The following annotations are available:
and BOD Benefit of doubt FT Follow through ISW Ignore subsequent working (after correct answer obtained) M0, M1 Method mark awarded 0, 1 A0, A1 Accuracy mark awarded 0, 1 B0, B1 Independent mark awarded 0,1 SC Special case ^ Omission sign MR Misread Highlighting is also available to highlight any particular points on a script.
5. The comments box will be used by the Principal Examiner to explain his or her marking of the practice scripts for your information. Please refer to these comments when checking your practice scripts. Please do not type in the comments box yourself. Any questions or comments you have for your Team Leader should be communicated by the scoris messaging system, e-mail or by telephone.
6. Write a brief report on the performance of the candidates. Your Team Leader will tell you when this is required. The Assistant Examiner’s Report Form (AERF) can be found on the Cambridge Assessment Support Portal. This should contain notes on particular strengths displayed, as well as common errors or weaknesses. Constructive criticisms of the question paper/mark scheme are also appreciated.
7. Link Additional Objects with work relating to a question to those questions (a chain link appears by the relevant question number) – see scoris assessor Quick Reference Guide page 19-20 for instructions as to how to do this – this guide is on the Cambridge Assessment Support Portal and new users may like to download it with a shortcut on your desktop so you can open it easily! For AOs containing just formulae or rough working not attributed to a question, tick at the top to indicate seen but not linked. When you submit the script, scoris asks you to confirm that you have looked at all the additional objects. Please ensure that you have checked all Additional Objects thoroughly.
8. The schedule of dates for the marking of this paper is displayed under ‘OCR Subject Specific Details’ on the Cambridge Assessment Support Portal. It is vitally important that you meet these requirements. If you experience problems that mean you may not be able to meet the deadline then you must contact your Team Leader without delay.
2

4766 Mark Scheme June 2011
SECTION A Q1 (i)
1000 × 0.013 = 13 Or 0.2 × 65 = 13 Or 0.2 × 5 × 13= 13
M1 A1 M1 for 0.2 × 65
2
Allow with or without working For MR 1000 × 0. 13 = 130 Allow M1A0 Allow M1A0 if extra terms added eg 1000 × 0.004 SC1 for 1000 × 0.014 = 14 For whole calculation
(ii) Positive B1 1 Allow +ve but NOT skewed to the right Do not allow ‘positive correlation’
(iii) Minimum value = 1500 Maximum value = 2500
B1 Without wrong working B1 Without wrong working
2 Exact answers only unless good explanation such as eg no road has length zero so min is eg 1501 SC1 for lower answer between 1499 and 1501 and upper between 2499 and 2501 Allow answer given as inequality
TOTAL 5 Q2 (i)
1 1 1 1 1 1Either P(alphabetic order)5 4 3 2 1 120
1 1or P(alphabetic order) 0.008335! 120
M1 for 5! or 120 or 5P5 seen or product of correct fractions A1 CAO
2
Allow 0.0083 or 1/120 but not 0.008
(ii) 2 1 1Either P(picks Austen and Bronte)5 4 10
1 1 1or P(picks Austen and Bronte) 25 4 10
1 1or P(picks Austen and Bronte)5 102
M1 for denominators M1 for 2× dep on correct denominators A1 CAO Or M1 for
or 10 5
2 5M1 for 1/ 2
A1 CAO
3
1/5P2 scores M1 also 1/20 oe scores M1 even if followed by further incorrect working
52
seen as part of a binomial expression gets
M0M0A0
TOTAL 5
3
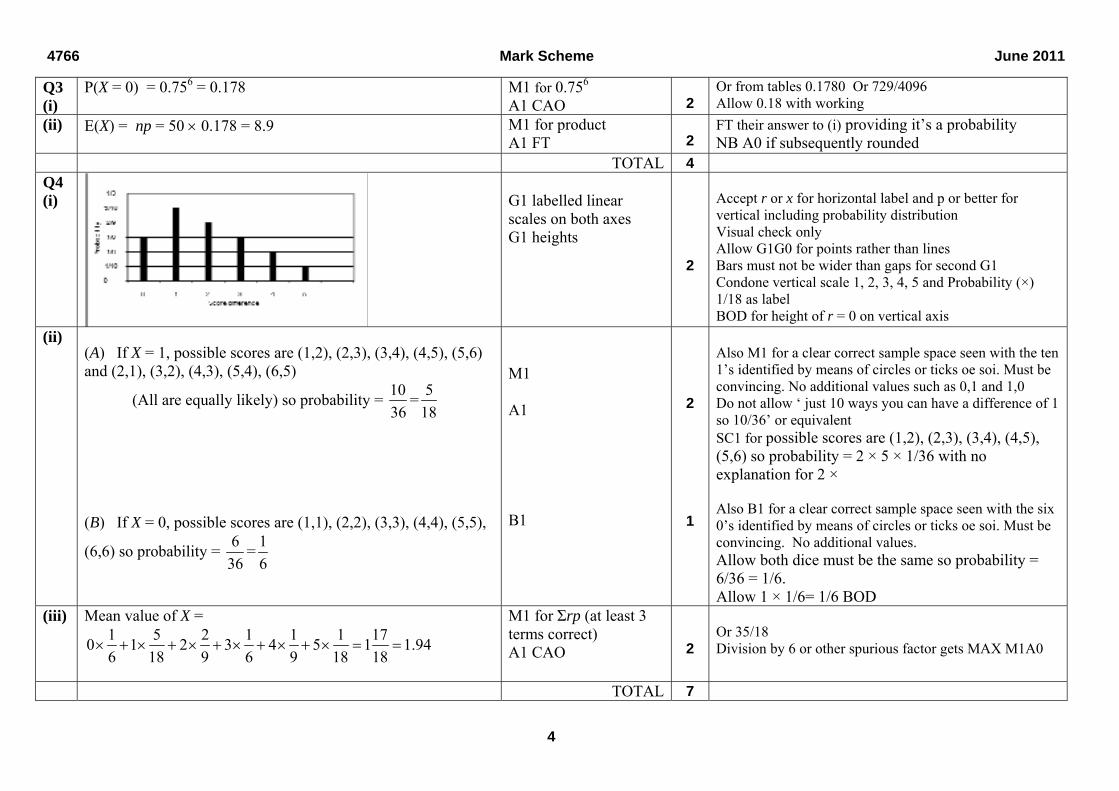
4766 Mark Scheme June 2011
Q3 (i)
P(X = 0) = 0.756 = 0.178 M1 for 0.756 A1 CAO
2
Or from tables 0.1780 Or 729/4096 Allow 0.18 with working
(ii) E(X) = np = 50 0.178 = 8.9
M1 for product A1 FT
2
FT their answer to (i) providing it’s a probability NB A0 if subsequently rounded
TOTAL 4 Q4 (i)
G1 labelled linear scales on both axes G1 heights
2
Accept r or x for horizontal label and p or better for vertical including probability distribution Visual check only Allow G1G0 for points rather than lines Bars must not be wider than gaps for second G1 Condone vertical scale 1, 2, 3, 4, 5 and Probability (×) 1/18 as label BOD for height of r = 0 on vertical axis
(ii) (A) If X = 1, possible scores are (1,2), (2,3), (3,4), (4,5), (5,6) and (2,1), (3,2), (4,3), (5,4), (6,5)
(All are equally likely) so probability = 1036
= 518
(B) If X = 0, possible scores are (1,1), (2,2), (3,3), (4,4), (5,5),
(6,6) so probability = 636
= 16
M1 A1 B1
2
1
Also M1 for a clear correct sample space seen with the ten 1’s identified by means of circles or ticks oe soi. Must be convincing. No additional values such as 0,1 and 1,0 Do not allow ‘ just 10 ways you can have a difference of 1 so 10/36’ or equivalent SC1 for possible scores are (1,2), (2,3), (3,4), (4,5), (5,6) so probability = 2 × 5 × 1/36 with no explanation for 2 × Also B1 for a clear correct sample space seen with the six 0’s identified by means of circles or ticks oe soi. Must be convincing. No additional values. Allow both dice must be the same so probability = 6/36 = 1/6. Allow 1 × 1/6= 1/6 BOD
(iii) Mean value of X = 1 5 2 1 1 1 170 1 2 3 4 5 1 1.9 46 18 9 6 9 18 18
M1 for Σrp (at least 3 terms correct) A1 CAO
2
Or 35/18 Division by 6 or other spurious factor gets MAX M1A0
TOTAL 7
4
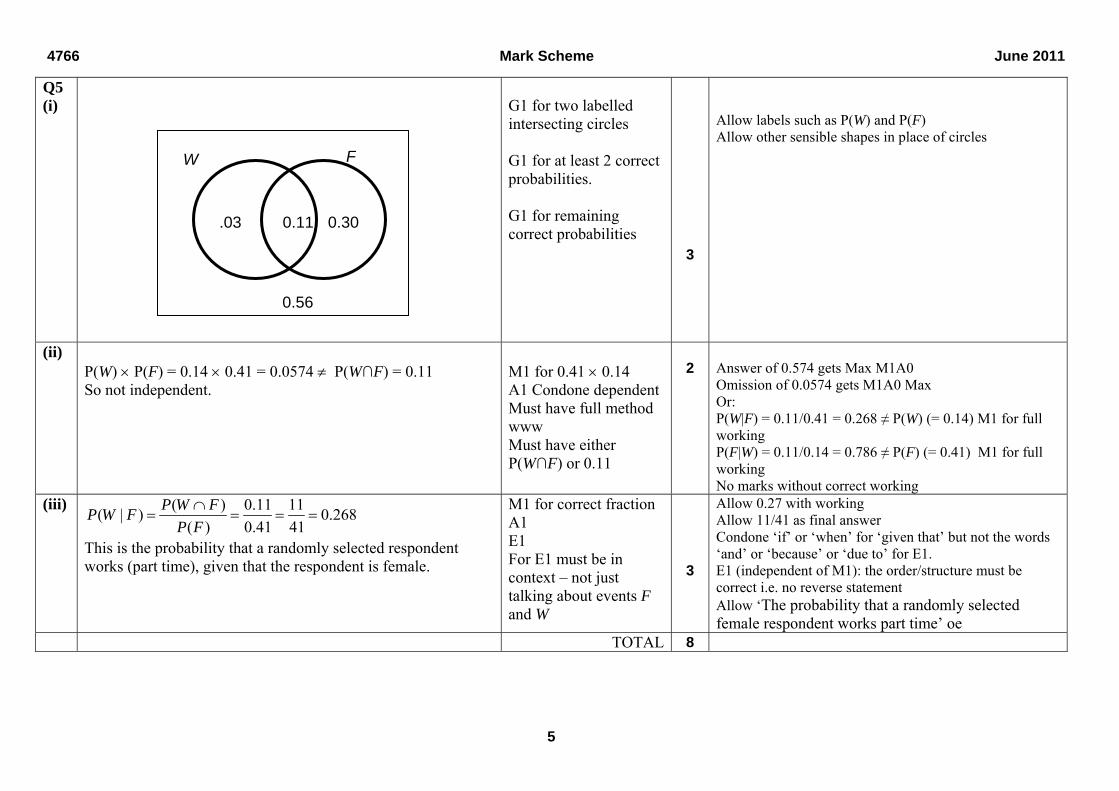
4766 Mark Scheme June 2011
Q5 (i)
G1 for two labelled intersecting circles G1 for at least 2 correct probabilities. G1 for remaining correct probabilities
3
Allow labels such as P(W) and P(F) Allow other sensible shapes in place of circles
(ii) P(W) P(F) = 0.14 0.41 = 0.0574 P(W∩F) = 0.11 So not independent.
M1 for 0.41 0.14 A1 Condone dependent Must have full method www Must have either P(W∩F) or 0.11
2
Answer of 0.574 gets Max M1A0 Omission of 0.0574 gets M1A0 Max Or: P(W|F) = 0.11/0.41 = 0.268 ≠ P(W) (= 0.14) M1 for full working P(F|W) = 0.11/0.14 = 0.786 ≠ P(F) (= 0.41) M1 for full working No marks without correct working
(iii) ( ) 0.11 11( | ) 0.268( ) 0.41 41
P W FP W FP F
This is the probability that a randomly selected respondent works (part time), given that the respondent is female.
M1 for correct fraction A1 E1 For E1 must be in context – not just talking about events F and W
3
Allow 0.27 with working Allow 11/41 as final answer Condone ‘if’ or ‘when’ for ‘given that’ but not the words ‘and’ or ‘because’ or ‘due to’ for E1. E1 (independent of M1): the order/structure must be correct i.e. no reverse statement Allow ‘The probability that a randomly selected female respondent works part time’ oe
TOTAL 8
.03 0.11
0.56
W F
0.30
5

4766 Mark Scheme June 2011
Q6 (i) Mean = 1 10 2 40 3 15 4 5 155 2.214
70 70
Sxx = 2
2 2 2 2 1551 10 2 40 3 15 4 5 385 343.21 41.7970
s = 41.7969
= 0.778
M1 A1 CAO M1 for Σfx2 s.o.i. M1 for attempt at Sxx Dep on first M1 A1 CAO If 0.778 or better seen ignore previous incorrect working (calculator answer) Allow final answer to 2 sig fig (www)
5
For M1 allow sight of at least 3 double pairs seen from 1 10 2 40 3 15 4 5 with divisor 70. Allow answer of 155/70 or 2.2 or 2.21 or 31/14 oe For 155/70 = eg 2.3 , allow A1 isw M1 for 2 52 2 21 10 2 40 3 15 4 with at least three correct terms Using exact mean leads to Sxx = 41.79 , s=0.778, Using mean 2.214 leads to Sxx = 41.87 , s=0.779, Using mean 2.21 leads to Sxx = 43.11 and s = 0.790 Using mean 2.2 leads to Sxx = 46.2 and s = 0.818 Using mean 2 leads to Sxx = 105 and s = 1.233 All the above get M1M1A1 except the last one which gets M1M1A0 RMSD(divisor n rather than n – 1) =√(41.79/70) = 0.772 gets M1M1A0 Alternative method, award M1for at least 3 terms of and second M1 for all 4 terms of
2 2 2
21 2.214 10 2 2.214 40 3 2.214 15
4 2.214 5( 41.79)
NB Allow full credit for correct answers without working (calculator used)
(ii) Mean would decrease
Standard deviation would increase
B1
B1
2
Do not accept increase/decrease seen on their own – must be linked to mean and SD. Allow eg ‘It would skew the mean towards zero’ And eg ‘ It would stretch the SD’ SC1 for justified argument that standard deviation might either increase or decrease according to number with no eggs (n≤496 increase, n≥497 decrease)
TOTAL 7
6

4766 Mark Scheme June 2011
SECTION B Q7 (i)
X ~ B(20, 0.15)
(A) Either 1 1920P( = 1) 0.15 0.85 0.1368
1
X
or P(X = 1) = P(X ≤ 1) – P(X ≤ 0) = 0.1756 – 0.0388 = 0.1368 (B) P(X ≥ 2) = 1 – P(X ≤ 1) = 1 – 0.1756 = 0.8244
M1 0.151 0.8519
M1 201 p1 q19
A1 CAO OR: M2 for 0.1756 – 0.0388 A1 CAO M1 for 1 – their 0.1756 A1 CAO
3
2
With p + q = 1 Allow answer 0.137 with or without working or 0.14 if correct working shown See tables at the website http://www.mei.org.uk/files/pdf/formula_book_mf2.pdf For misread of tables 0.3917 – 0.1216 = 0.2701 allow M1M1A0 also for 0.1304 – 0.0261 = 0.1043
Provided 0.1756 comes from P(X=0) +P(X=1) Allow answer 0.824 with or without working or 0.82 if correct working shown Point probability method: P(1) = 0.1368 , P(0) = 0.0388 So 1 - P(X≤1) = 1 - 0.1756 gets M1 then mark as per scheme M0A0 for 1 – P(X ≤ 1) = 1 – 0.4049 = 0.5951 For misread of tables 1 – 0.3917 = 0.6083 allow M1A1 also for 1 – 0. 1304 = 0.8696 provided consistent with part (A) OR M1A0 if formula used in part (A)
7

4766 Mark Scheme June 2011
(ii) Let X ~ B(n, p) Let p = probability of a ‘no-show’ (for population) H0: p = 0.15 H1: p < 0.15
H1 has this form because the hospital management hopes to reduce the proportion of no-shows.
B1 for definition of p B1 for H0 B1 for H1 E1 Allow correct answer even if H1 wrong
4
Allow p = P(no-show) for B1 Definition of p must include word probability (or chance or proportion or percentage or likelihood but NOT possibility). Preferably as a separate comment. However can be at end of H0
as long as it is a clear definition ‘ p = the probability of no-show, NOT just a sentence ‘probability is 0.15’ H0 : p(no-show) = 0.15, H1 : p(no-show) < 0.15 gets B0B1B1 Allow p=15%, allow θ or π and ρ but not x. However allow any single symbol if defined Allow H0 = p=0.15, Do not allow H0 : P(X=x) = 0.15, H1 : P(X=x) < 0.15 Do not allow H0: =0.15, =15%, P(0.15), p(0.15), p(x)=0.15, x=0.15 (unless x correctly defined as a probability) Do not allow H1:p≤0.15, Do not allow H0 and H1 reversed for B marks but can still get E1 Allow NH and AH in place of H0 and H1 For hypotheses given in words allow Maximum B0B1B1E1 Hypotheses in words must include probability (or chance or proportion or percentage) and the figure 0.15 oe.
(iii) P(X 1) = 0.1756 > 5% So not enough evidence to reject H0. Not significant. Conclude that there is not enough evidence to indicate that the proportion of no-shows has decreased.
M1 for probability seen, but not in calculation for point probability M1 dep for comparison A1
4
Zero for use of point prob - P(X = 1) = 0.1368 Do NOT FT wrong H1 Allow accept H0, or reject H1 Full marks only available if ‘not enough evidence to…’ oe mentioned somewhere Do not allow ‘enough evidence to reject H1’ for final mark but can still get 3/4 Upper end comparison: 1 – 0.1756 = 0.8244 < 95% gets
8

4766 Mark Scheme June 2011
Note: use of critical region method scores M1 for region {0} M1 for 1 does not lie in critical region, then A1 E1 as per scheme
E1 dep for conclusion in context.
M2 then A1E1 as per scheme Line diagram method M1 for squiggly line between 0 and 1 with arrow pointing to left, M1 0.0388 seen on diagram from squiggly line or from 0, A1E1 for correct conclusion Bar chart method M1 for line clearly on boundary between 0 and 1 and arrow pointing to left, M1 0.0388 seen on diagram from boundary line or from 0, A1E1 for correct conclusion
(iv) 6 < 8 So there is sufficient evidence to reject H0 Conclude that there is enough evidence to indicate that the proportion of no-shows appears to have decreased.
M1 for comparison seen A1 E1 for conclusion in context
3
Allow ‘6 lies in the CR’ Do NOT insist on ‘not enough evidence’ here Do not FT wrong H1:p>0.15 but may get M1 In part (iv) ignore any interchanged H0 and H1 seen in part (ii)
(v) For n ≤ 18, P(X 0) > 0.05 so the critical region is empty.
E1 for P(X 0) > 0.05 E1 indep for critical region is empty
2
E1 also for sight of 0.0536 Condone P(X = 0) > 0.05 or all probabilities or values, (but not outcomes) in table (for n ≤ 18) > 0.05 Or ‘There is no critical region’ For second E1 accept ‘H0 would always be accepted’ Do NOT FT wrong H1 Use professional judgement - allow other convincing answers
TOTAL 18
9

4766 Mark Scheme June 2011
Q8 (i)
Upper Bound 9.1 9.3 9.5 9.7 9.9 10.1Cumulative frequency 0 5 12 27 43 50
B1 for cumulative frequencies G1 for scales G1 for labels G1 for points (Provided plotted at correct UCB positions) G1 for joining points All G’s dep on attempt at cumulative frequency but not cumulative fx’s or other spurious values.
5
May be implied from graph. Condone omission of 0 at this stage. Linear horizontal scale. Linear vertical scale: 0 to 50 (no inequality scales - Not even <9.1, <9.3, <9.5 …) Heating quality or x and Cumulative frequency or just CF or similar but not just frequency or fd nor cumulative fd Plotted as (UCB, their cf). Ignore (9.1,0) at this stage. No midpoint or LCB plots. Plotted within ½ small square For joining all of ‘their points’ (line or smooth curve) AND now including (9.1,0) dep on previous G1 Mid point or LCB plots may score first three marks Can get up to 3/5 for cum freq bars Allow full credit if axes reversed correctly Lines of best fit could attract max 4 out of 5.
(ii) Median = 9.67
B1 FT Allow answers between 9.66 and 9.68 without checking curve. Otherwise check curve.
3
Based on 25th to 26th value on a cumulative frequency graph ft their mid-point plot (not LCB’s) approx 9.57 for m.p. plot Allow 9.56 to 9.58 without checking B0 for interpolation
CF
x
10

4766 Mark Scheme June 2011
Q1 = 9.51 Q3 = 9.83 Inter-quartile range = 9.83 – 9.51 = 0.32
B1 FT for Q3 or Q1 B1 FT for IQR providing both Q1 and Q3 are correct Allow answers between 9.50 and 9.52 and between 9.82 and 9.84 without checking curve. Otherwise check curve.
Based on 12th to 13th and 37th to 38th values on a cumulative frequency graph ft their mid -point plot (not LCB’s) approx Q1 = 9.42; Q3 = 9.73 Allow 9.41 to 9.43 and 9.72 to 9.74 without checking B0 for interpolation Allow correct IQR from graph if quartiles not stated Lines of best fit: B0 B0 B0 here.
(iii) Lower limit 9.51 – 1.5 × 0.32 = 9.03 Upper limit 9.83 + 1.5 × 0.32 = 10.31 Thus there are no outliers in the sample.
B1 FT their Q1, IQR B1 FT their Q3, IQR E1 NB E mark dep on both B marks
3
Any use of median 1.5 IQR scores B0 B0 E0 If FT leads to limits above 9.1 or below 10.1 then E0 No marks for ± 2 or 3 IQR In this part FT their values from (ii) if sensibly obtained (eg from LCB plot) or lines of best fit, but not from location ie 12.5, 37.5 or cumulative fx’s or similar. For use of mean ± 2s, Mean = 9.652, s = 0.235, Limits 9.182, 10.122 gets M1 for correct lower limit, M1 for correct upper limit, zero otherwise, but E0 since there could be outliers using this definition
(iv) (A) P(All 3 more than 9.5) = 38 37 36 0.430450 49 48
(=50616/117600 = 2109/4900)
M1 for 38/50 × (triple product) M1 for product of remaining fractions A1 CAO
3
(38/50)3 which gives answer 0.4389 scores M1M0A0 so watch for this. M0M0A0 for binomial probability including 0.76100 but 3C0×0.240×0.763 still scores M1 (k/50)3 for values of k other than 38 scores M0M0A0
( 1) ( 2)50 49 48k k k
for values of k other than 38 scores M1M0A0 Correct working but then multiplied or divided by some factor scores M1M0A0
11

4766 Mark Scheme June 2011
12
(B) P(At least 2 more than 9.5) 38 37 123 0.430450 49 48
= 3 × 0.1435 + 0.4304 = 0.4304 + 0.4304 = 0.861 (=101232/117600 = 4218/4900 = 2109/2450) OR P(At least 2 more than 9.5) = 1 – (P(0) + P(1))
= 12 11 10 12 11 381 350 49 48 50 49 48
= 1 – [0.01122 + 0.12796] = 1 – 0.13918 = 0.861
M1 for product of 3 correct fractions seen M1 for 3 × a sensible triple or sum of 3 sensible triples M1 indep for + 0.4304 FT (providing it is a probability) A1 CAO M1 for 12/50×11/49×38/48 M1 for 3 × a sensible triple or sum of 3 sensible triples M1 dep on both previous M1’s for 1 –[0.01122 + 0.12796] A1 CAO
4
Accept 0.43 with working and 0.430 without working
17600
r gets first two M1M1’s
SC1 for
Or /3 3
= 2109/4900 = 0.4304 38 50
Allow unsimplified fraction as final answer 50616/1 O
38 12 50/
2 1 3
=0.4304
38 38 12350 50 50
or other sensible triple and SC2
if this + their 0.4304 (= 0.8549) 8/4900, but only M3A0
se of 1 – method ‘with replacement’
Allow 0.86 or 2109/2450 or 421for other unsimplified fractions U
SC1 for 12 12 383 50 50 50
SC2 for whole of 1 - 12 12 38 12 12 12350 50 50 50 50 50
(= 1 – (0.1313 + 0.0138) = 1 – 0.1451 = 0.8549)
TOTAL 18 NOTE RE OVER-SPECIFICATION OF ANSWERS If answers are grossly over-specified (see instruction 8), deduct the final answer mark in every case. Probabilities should also be rounded to a sensible degree of accuracy. In general final non probability answers should not be given to more than 4 significant figures. Allow probabilities given to 5 sig fig. In general accept answers which are correct to 3 significant figures when given to 4 or 5 significant figures.

4766 Mark Scheme June 2012
Question Answer Marks Guidance 1 (i)
P(All blue) =4828
4929
5030
= 0.2071
M1 For
5030
(as part of a
triple product)
(30/50)3 = 0.216 scores M1M0A0
( 1) ( 2)50 49 48k k k
for values of k other than 30 scores M1M0A0 Zero for binomial unless simplifies to (3/5)3
M1 For product of other two fractions
Correct working but then multiplied or divided by some factor scores M1M0A0
OR 30
3 = 4060/19600 = 29/140 = 0.2071 50
/3
M2 for the complete method
A1 CAO SC2 for P(All red) = 0.0582
Accept 0.21 with working and 0.207 without working Allow unsimplified fraction as final answer 24360/117600 oe
[3] 1 (ii)
P(All red) = 4818
4919
5020
= 0.0582 or 3 = 0.0582 20 50
/3
M1 For P(All red) SC2 for 1 – (30/50)3 – (20/50)3 = 1 – 0.216 – 0.064 = 0.72, providing consistent with (i) . If not consistent with (i) M0M0A0
P(At least one of each colour) = 1 – (0.2071 + 0.0582) = 0.7347
or 29 57 260 13 361 1 1
140 980 980 49 49
M1 For 1 – (0.2071 + 0.0582)
A1 CAO Allow 0.73 with working OR [3] Allow unsimplified fraction as
final answer 86400/117600 oe P(2b,1r)+P(1b,2r) (M1)
For either 4820
4929
5030
or 4830
4919
5020
Allow M1 for 3×(30/50)2×(20/50) or 3×(30/50) ×(20/50) 2 and second M1 for sum of both if = 0.72 If not consistent with (i) M0M0A0
5

4766 Mark Scheme June 2012
Question Answer Marks Guidance
= 4820
4929
50303 +
4830
4919
50203
(M1) For sum of both or for 3× either
NB M2 also for 30 20 4850 49 48
even if not multiplied by 3 = 3 × 0.1480 + 3 × 0.0969 = 0.7347 (A1) CAO Allow 0.73 or better with
working OR Either
or 30 20 50/
2 1 3
30 20 50/
1 2 3
(M1)
(M1) For sum of both (A1) CAO 2 (i) 9C3 × 5C3 = 84 × 10 = 840 M1 For either 9C3 or 5C3 Zero for permutations M1 For product of both
correct combinations
A1 CAO [3] 2 (ii) Total number of ways of answering 6 from 14 is 14C6 = 3003 M1 For 14C6 seen in part (ii)
Probability =14340
3003840
= 0.27972 = 0.280 M1 For their 840/ 3003 or
their 840/14C6
A1 FT their 840 Allow full marks for unsimplified fractional answers
[3] OR 6C3 × 5/14 × 4/13 × 3/12 × 9/11 × 8/10 × 7/9 = 0.280 (M1) For product of fractions SC1 for 6C3 × (5/14)3 × (9/14)3 =
0.2420 (M1) For 6C3× correct product (A1)
6
4766 Mark Scheme June 2012
Question Answer Marks Guidance 3 (i) X ~ B(30, 0.85) M1 For 0.8529 × 0.151 =
0.0013466
P(X = 29) = × 0.8529 × 0.151 = 30 × 0.0013466 = 0.0404
2930 M1
For × p29 × q1
2930 With p + q = 1
A1 CAO Allow 0.04 www [3] If further working (EG P(X=29)
–P(X=28)) give M2A0 3 (ii) P(X = 30) = 0.8530 = 0.0076 M1 For 0.8530 P(X ≥ 29) = 0.0404 + 0.0076 = 0.0480 M1 For P(X = 29) + P(X =
30) (not necessarily correct, but both attempts at binomial, including coefficient in (i))
Allow eg 0.04+0.0076=0.0476 Allow 0.05 with working
A1 CAO [3] 3 (iii) Expected number = 10 × 0.0480 = 0.480 M1 For 10 × their (ii) provided (ii) between 0 and 1 A1 FT their (ii) but if answer
to (ii) leads to a whole number for (iii) give M1A0
Do not allow answer rounded to 0 or 1.
[2]
7
4766 Mark Scheme June 2012
Question Answer Marks Guidance 4 (i) (A) P(third selected) = 0.922 × 0.08 = 0.0677 M1 For 0.922 Or = 1058/15625 M1 For p2 × q With p + q = 1
With no extra terms A1 CAO Allow 0.068 but not 0.067 nor
0.07 [3] SC1 for ‘without replacement’ method 92/100×91/99×8/98
=0.0690 4 (i) (B) P (second) + P(third) M1 For 0.92 × 0.08 With no extra terms = (0.92 × 0.08) + (0.922 × 0.08) A1 FT their 0.0677 Allow 0.141 to 0.142 and = 0.0736 + 0.0677 = 0.1413 allow 0.14 with working = 2208/15625 [2] SC1 for answer of 0.143 from ‘without replacement’ method 4 (ii) P(At least one of first 20) = 1 - P(None of first 20) M1 0.9220 Accept answer of 0.81 or better
from P(1) + P(2) + ... , or SC2 if all correct working shown but wrong answer No marks for ‘without replacement’ method’
= 1 – 0.9220 = 1 – 0.1887 = 0.8113 M1 1 – 0.9220 A1 CAO Allow 0.81 with working but
not 0.812 [3]
8

4766 Mark Scheme June 2012
Question Answer Marks Guidance 5 Let p = probability that a randomly selected frame is faulty B1 For definition of p in context
Minimum needed for B1 is p = probability that frame/bike is faulty. Do not allow is p = probability that it is faulty Allow p = P(frame faulty) Definition of p must include word probability (or chance or proportion or percentage or likelihood but NOT possibility). Preferably as a separate comment. However can be at end of H0
as long as it is a clear definition ‘ p = the probability that frame is faulty, NOT just a sentence ‘probability is 0.05’ Do NOT allow ‘p = the probability that faulty frames have increased’
H0: p = 0.05 B1 H0 : p(frame faulty) = 0.05, H1 : p(frame faulty) > 0.05 gets B0B1B1 Allow p=5%, allow θ or π and ρ but not x. However allow any single symbol if defined Allow H0 = p=0.05, Allow H0 : p=1/20 Do not allow H0 : P(X=x) = 0.05, H1 : P(X=x) > 0.05 Do not allow H0: =0.05, =5%, P(0.05), p(0052), p(x)=0.05, x=0.05 (unless x correctly defined as a probability) Do not allow H1:p≥0.05, Do not allow H0 and H1 reversed Allow NH and AH in place of H0 and H1 For hypotheses given in words allow Maximum B0B1B1 Hypotheses in words must include probability (or chance or proportion or percentage) and the figure 0.05 oe.
H1: p > 0.05 B1 P(X ≥ 4) B1 For notation P(X ≥ 4) or
1- P(X ≤ 3) This mark may be implied by 0.0109 as long as no incorrect notation.
No further marks if point probs used - P(X = 4) = 0.0094 DO NOT FT wrong H1 But if H1 is p ≥ 0.05 allow the rest of the marks if earned so max 7/8
= 1- P(X ≤ 3) = 1 – 0.9891 = 0.0109 B1* For 0.0109, indep of previous mark
Or for 1 – 0.9891
9

4766 Mark Scheme June 2012
Question Answer Marks Guidance 0.0109 < 0.05 M1*
dep For comparison with 5%
So reject H0 A1* or significant or ‘accept H1’
There is evidence to suggest that the proportion of faulty frames has increased.
E1* Dep on
A1
Must include ‘sufficient evidence’ or something similar such as ‘to suggest that’ ie an element of doubt for E1. ‘Sufficient evidence’ or similar can be seen in the either the A mark or the E mark.
[8] OR Critical region method: No marks if CR not justified Let X ~ B(18, 0.05)
P(X ≥ 3) = 1 – P(X ≤ 2) = 1 – 0.9419 = 0.0581 > 5%
(B1)
For 0.0581
Do not insist on correct notation as candidates have to work out two probabilities for full marks
P(X ≥ 4) = 1 – P(X ≤ 3) = 1 – 0.9891 = 0.0109 < 5%
(B1) For 0.0109
(M1)
For at least one correct comparison with 5%
So critical region is {4,5,6,7,8,9,10,11,12,13,14,15,16,17,18}
4 lies in the critical region, so significant,
(A1) CAO for critical region and significant oe
Condone {4,5 ..}, X ≥ 4, oe but not P(X ≥ 4)
There is evidence to suggest that the proportion of faulty frames has increased.
(E1)
10

4766 Mark Scheme June 2012
Question Answer Marks Guidance 6 (i) M1 At least 4 fds correct for M1
M1 can be also be gained from freq per 1000 – 14, 44, 52, 18, 3.5 (at least 4 correct) and A1 for all correct or freq per 500 - 7, 22, 26, 9, 1.75 Accept any suitable unit for fd, eg freq per 1000, BUT NOT FD per 1000 Allow fds correct to at least three dp If fd not explicitly given, M1 A1 can be gained from all heights correct (within one square) on histogram (and M1A0 if at least 4 correct) Allow restart with correct heights if given fd wrong
A1 For fd’s all correct
Engine size Frequency Group width Frequency density 500 ≤ x ≤ 1000 7 500 0.014
1000 < x ≤ 1500 22 500 0.044 1500 < x ≤ 2000 26 500 0.052 2000 < x ≤ 3000 18 1000 0.018 3000 < x ≤ 5000 7 2000 0.0035
G1(L1) linear scales on both axes and label on vertical axis Label required on vert axis IN RELATION to first M1 mark ie fd or frequency density or if relevant freq/1000, etc (NOT fd/1000, but allow fd×1000, etc) Accept f/w or f/cw (freq/width or freq/class width) Ignore horizontal label and allow horizontal scale to start at 500 Can also be gained from an accurate key
INCORRECT DIAGRAMS: Frequency diagrams can get M0, A0, G0, G1, G0 MAXIMUM Thus frequency density = frequency × width, frequency/midpoint etc gets MAX M0A0G0G1G0 Frequency polygons MAX M1A1G0G0G0
G1(W1) Width of bars Must be drawn at 500, 1000etc NOT 499.5 or 500.5 etc NO GAPS ALLOWED Must have linear scale. No inequality labels on their own such as 500≤S<1000, etc but allow if a clear horizontal linear scale is also given.
11

4766 Mark Scheme June 2012
Question Answer Marks Guidance G1(H1)
Height of bars FT of heights dep on at least 3 heights correct and all must agree with their fds If fds not given and one height is wrong then max M1A0G1G1G0 – visual check only (within one square) –no need to measure precisely
[5] 6 (ii) Do not know exact highest and lowest values so cannot tell what the
midrange is. OR No and a counterexample to show it may not be 2750 OR (500 + 5000) / 2 = 2750. But very unlikely to be absolutely correct but probably close to the true value. Some element of doubt needed. Allow ‘Likely to be correct’
E1
[1]
Allow comment such as 'Highest value could be 5000 and lowest could be 500 therefore midrange could be 2750' NO mark if incorrect calculation Sight of 1750 AND 3000 (min and max of midrange) scores E1
6 (iii) Mean =
80)74000()182500()261750()221250()7750(
M1 For midpoints (at least 3 correct)
No marks for mean or sd unless using midpoints Answer must NOT be left as improper fraction
1891
80151250
A1 CAO
Accept correct answers for mean (1890 or 1891) and sd (850 or 846 or 845.5) from calculator even if eg wrong Sxx given
2 2 2 2 2 2(750 7) (1250 22) (1750 26) (2500 18) (4000 7)x f = 3937500 + 34375000 + 79625000 + 112500000 + 112000000
M1 For sum of at least 3 correct multiples fx2 Allow M1 for anything which rounds to 342400000
=342437500
5648046980
151250-342437500S2
xx
846714943
7956480469
s A1
Only penalise once in part (iii) for over specification, even if mean and standard deviation both over specified. Allow SC1 for RMSD 840.2 or 840 from calculator
Only an estimate since the data are grouped. E1 indep
Or for any mention of midpoints or ‘don’t have actual data’ or ‘data are not exact’ oe
[5]
12

4766 Mark Scheme June 2012
Question Answer Marks Guidance 6 (iv) x – 2s = 1891 – (2 846) = 199
Allow 200 M1 For either.
FT any positive mean and their positive sd/rmsd for M1 Only follow through numerical values, not variables such as s, so if a candidate does not find s but then writes here ‘limit is 40.76+ 2 standard deviation’, do NOT award M1 No marks in (iv) unless using x + 2s or x – 2s
x + 2s = 1891 + (2 846) = 3583 Allow 3580 or 3600
A1 For both (FT) Do NOT penalise over specification here as it is not the final answer
So there are probably some outliers E1 Must include an element of doubt Dep on upper limit in range 3000 – 5000 Allow comments such as ‘any value over 3583 is an outlier’ Ignore comments about possible outliers at lower end.
[3] 6 (v) Number of cars over 2000 cm3 = 25/80 × 2.5 million = 781250 M1 For 25/80× 2.5 million or (18+7) /80× 2.5 million So duty raised = 781250 × £1000 = £781 million M1
indep For something × £1000 even if this is the first step
A1 CAO NB £781250000 is over specified so only 2/3 [3] 6 (vi) Because the numbers of cars sold with engine size greater than 2000 E1 Allow any other reasonable suggestion cm3 might be reduced due to the additional duty. Condone ‘sample may not be representative’ [1]
Allow ‘sample is not of NEW cars’
13
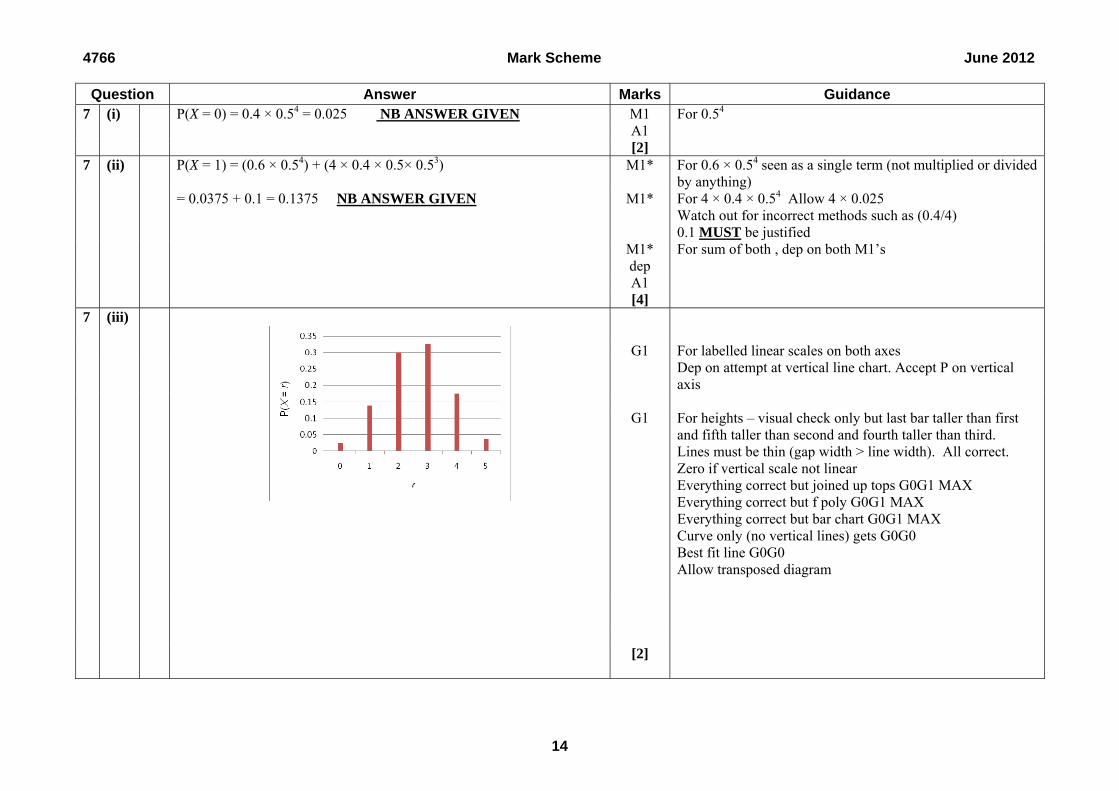
4766 Mark Scheme June 2012
Question Answer Marks Guidance 7 (i) P(X = 0) = 0.4 × 0.54 = 0.025 NB ANSWER GIVEN M1 For 0.54 A1 [2] 7 (ii) P(X = 1) = (0.6 × 0.54) + (4 × 0.4 × 0.5× 0.53) M1* For 0.6 × 0.54 seen as a single term (not multiplied or divided
by anything) = 0.0375 + 0.1 = 0.1375 NB ANSWER GIVEN M1* For 4 × 0.4 × 0.54 Allow 4 × 0.025
Watch out for incorrect methods such as (0.4/4) 0.1 MUST be justified
M1* dep
For sum of both , dep on both M1’s
A1 [4] 7 (iii) G1 For labelled linear scales on both axes Dep on attempt at vertical line chart. Accept P on vertical
axis G1 For heights – visual check only but last bar taller than first
and fifth taller than second and fourth taller than third. Lines must be thin (gap width > line width). All correct. Zero if vertical scale not linear Everything correct but joined up tops G0G1 MAX Everything correct but f poly G0G1 MAX Everything correct but bar chart G0G1 MAX Curve only (no vertical lines) gets G0G0 Best fit line G0G0 Allow transposed diagram
[2]
14

4766 Mark Scheme June 2012
Question Answer Marks Guidance 7 (iv) ‘Negative’ or ‘very slight negative’ E1 E0 for symmetrical [1] but E1 for (very slight) negative skewness even if also
mention symmetrical Ignore any reference to unimodal
7 (v) E(X) = (0×0.025) + (1×0.1375) + (2×0.3) + (3×0.325) + (4×0.175) M1 For Σrp (at least 3 terms correct) + (5×0.0375) A1 CAO = 2.6 E(X2) = (0×0.025) + (1×0.1375) + (4×0.3) + (9×0.325) + 16×0.175) M1* For Σr2p (at least 3 terms correct) + (25×0.0375) = 0 + 0.1375 + 1.2 + 2.925 + 2.8 + 0.9375 = 8 Var (X) = 8 – 2.62 M1*
dep for – their E( X )²
= 1.24 A1 FT their E(X) provided Var( X ) > 0 [5] USE of E(X-µ)2 gets M1 for attempt at (x-µ)2 should see (-
2.6)2, (-1.6)2, (-0.6)2, 0.42, 1.42, 2.42 (if E(X) correct but FT their E(X)) (all 5 correct for M1), then M1 for Σp(x-µ)2 (at least 3 terms correct) Division by 5 or other spurious value at end gives max M1A1M1M1A0, or M1A0M1M1A0 if E(X) also divided by 5. Unsupported correct answers get 5 marks.
7 (vi) P(Total of 3) = (3×0.325×0.0252) + (6×0.3×0.1375×0.025) + M1 For decimal part of first term 0.325×0.0252 0.13753 = 3 × 0.000203 + 6 × 0.001031 + 0.002600=
0.000609 + 0.006188 + 0.002600 = 0.00940 M1 For decimal part of second term 0.3×0.1375×0.025
(= 3×13/64000 + 6×33/32000 + 1331/512000) M1 For third term – ignore extra coefficient All M marks above depend on triple probability products
A1 CAO: AWRT 0.0094. Allow 0.009 with working. [4] NOTE RE OVER-SPECIFICATION OF ANSWERS If answers are grossly over-specified, deduct the final answer mark in every case. Probabilities should also be rounded to a sensible degree of accuracy. In general final non probability answers should not be given to more than 4 significant figures. Allow probabilities given to 5 sig fig. In general accept answers which are correct to 3 significant figures when given to 4 or 5 significant figures. If answer given as a fraction and as an over-specified decimal – ignore decimal and mark fraction.
15

4766 Mark Scheme June 2012
ADDITIONAL NOTES RE Q5 Comparison with 95% method If 95% seen anywhere then B1 for P(X ≤ 3) B1 for 0.9891 M1* for comparison with 95% dep on B1 A1* for significant oe E1* Smallest critical region method: Either: Smallest critical region that 4 could fall into is {4,5,6,7,8,9,10,11,12,13,14,15, 16, 17, 18} gets B1 and has size 0.0109 gets B1, This is < 5% gets M1*, A1*, E1* as per scheme NB These marks only awarded if 4 used, not other values. Use of k method with no probabilities quoted: P(X ≥ 3) = 1 – P(X ≤ 2) > 5% P(X ≥ 4) = 1 – P(X ≤ 3) < 5% These may be seen in terms of k or n. Either k = 4 or k – 1 = 3 so k = 4 gets SC1 so CR is {4,5,6,7,8,9,10,11,12,13,14,15, 16, 17, 18} gets another SC1and conclusion gets another SC1 Use of k method with one probability quoted: 1 - 0.9891 < 5% or 0.0109 < 5% gets B0B1M1 P(X ≤ k - 1) = P(X ≤ 3) so k – 1 = 3 so k = 4 (or just k = 8 ) so CR is {4,5,6,7,8,9,10,11,12,13,14,15, 16, 17, 18} and conclusion gets A1E1
16

4766 Mark Scheme June 2012
17
Two tailed test done but with correct H1: p>0.05 Hyp gets max B1B1B1 if compare with 5% ignore work on lower tail and mark upper tail as per scheme but withhold A1E1 if compare with 2.5% no marks B0B0M0A0E0 Line diagram method B1 for squiggly line between 3 and 4 or on 4 exclusively (ie just one line), B1dep for arrow pointing to right, M1 0.0109 seen on diagram from squiggly line or from 4, A1E1 for correct conclusion Bar chart method B1 for line clearly on boundary between 3 and 4 or within 4 block exclusively (ie just one line), B1dep for arrow pointing to right, M1 0.0109 seen on diagram from boundary line or from 8, A1E1 for correct conclusion. Using P(Not faulty) method H0: p=0.95, H1: p<0.95 where p represents the prob that a frame is faulty gets B1B1B1. P(X≤14)=0.0109 < 5% So significant, etc gets B1B1M1A1E1 NB If H0: p=0.5, H1: p>0.5, etc seen, but then revert to 0.05 in working allow marks for correct subsequent working. However if 0.5 used consistently throughout, then max B1 for definition of p and possibly B1 for notation P(X ≥ 4).

4766 Mark Scheme January 2013
6
Question Answer Marks Guidance 1 (i) Positive B1 CAO [1] 1 (ii) Mean = 5.064 allow 5.1 with working 126.6/25 or 5.06 without B1 SD = 1.324 allow 1.3 with working or 1.32 without B2 Allow B1 for RMSD =
1.297 or var =1.753 or MSD = 1.683
Also allow B1 for Sxx = 42.08 or for Σx2 = 683 SC1 for both mean = 50.64 and SD = 13.24 (even if over-specified)
[3] 1 (iii) x – 2s = 5.064 – 21.324 = 2.416 B1FT FT their mean and sd For use of quartiles and IQR
Q1 = 3.95; Q3 = 6.0; IQR = 2.05 3.95 – 1.5(2.05) gets M1 Allow other sensible definitions of quartiles
x + 2s = 5.064 + 21.324 = 7.712 M1
for x + 2s but withhold final E mark if their limits mean that there are no outliers.
6.0 + 1.5(2.05) gets M1
A1FT For upper limit Limits 0.875 and 9.075 So there is an outlier. E1 Incorrect statement such as
7.6 and 8.1 are outliers gets E0 Do not award E1 if calculation error in upper limit
So there are no outliers NB do not penalise over-specification here as not the final answer but just used for comparison. FT from SC1
[4] 2 (i)
r 2 3 4 5 P(X = r) 3k 8k 15k 24k
B1
For correct table (ito k or correct probabilities 0.06, 0.16, 0.30, 0.48)
3k + 8k + 15k + 24k = 1 M1 For their four multiples of k added and =1.
k = 0.02 A1 or k = 1/50 (with or without working)
Allow M1A1 even if done in part (ii) – link part (ii) to part (i)
[3]

4766 Mark Scheme January 2013
7
Question Answer Marks Guidance 2 (ii) E(X) = (2 0.06) (3 0.16) (4 0.30) (5 0.48) 4.2
M1
For Σrp (at least 3 terms correct Provided 4 reasonable probabilities seen.
If probs wrong but sum = 1 allow full marks here. If sum ≠ 1 allow max M1A0M1 M0A0 (provided all probabilities between 0 and 1)
or 21/5
A1 cao Or ito k NB E(X) = 210k , E(X2) = 924k gets M1A0M1M0A0. E(X) = 210k , Var (X) = 924k – (210k)2 gets M1A0M1M1A0.
E(X2) = (4 0.06) (9 0.16) (16 0.30) (25 0.48) 18.48 M1 For Σr2p (at least 3 terms correct)
Var(X) = 18.48 – 4.22 M1 dep for – their E(X)² = 0.84 = 21/25 A1 FT their E(X) provided
Var(X) > 0 (and of course E(X2) is correct)
Use of E(X – µ)2 gets M1 for attempt at (x – µ)2 should see (–2.2)2, (–1.2)2, (–0.2)2, 0.82, (if E(X) wrong FT their E(X)) (all 4 correct for M1), then M1 for Σp(x – µ)2 (at least 3 terms correct with their probabilities) Division by 4 or other spurious value at end gives max M1A1M1M1A0, or M1A0M1M1A0 if E(X) also divided by 4. Unsupported correct answers get 5 marks
[5] 3 (i)
( ) ( | ) ( ) 0.4 0.07 0.028P L W P L W P W
M1
For ( | ) ( )P L W P W
A1 cao [2]

4766 Mark Scheme January 2013
8
Question Answer Marks Guidance 3 (ii)
B1 For two labelled intersecting circles
B1 For at least 2 correct probabilities.
FT their 0.028 provided < 0.038
B1 For remaining probabilities
[3] 3 (iii)
( ) 0.028, ( ) ( ) 0.038 0.07 0.00266P L W P L P W
M1
For correct use of
( ) ( )P L P W If P(L) wrong, max M1A0E0. No marks if P(W) wrong
Or EG P( | ) 0.4,P( ) 0.038L W L Not equal so not independent M1 is for comparing with some attempt at numbers P( | ) with P( )L W L , A1 for 0.038 If P(L) wrong, max M1A0E0
A1 For 0.00266 Not equal so not independent E1*
dep on M1
Allow ‘they are dependent’ Do not award E1 if P( )wrongL W
[3] 4 (i)
113
M1
Seen
= 165 A1 Cao [2]
0.01 0.028
0.92
L W
0.042

4766 Mark Scheme January 2013
9
Question Answer Marks Guidance 4 (ii) 5 6 5 6
2 1 3 0 60 10 70 1411 11 165 165 165 333 3
= 0.424
M1
For intention to add correct two fractional terms
Or For attempt at correct two terms
M1 For numerator of first term For prod of 3 correct fractions =4/33 Alternative
1 – P(1 or 0) = 1 – 5 6 5 6 5 4311 10 9 11 10 9
= 5 4111 33
= 1433
M1 for 1 – P(1 or 0) , M1 for first product, M1 for ×3, M1 for
second product, A1
M1 For numerator of sec term Do not penalise omission
of 60
For whole expression ie 5 4 6 43
11 10 9 11
(= 3 × 0.1212…)
M1 For correct denominator For attempt at 5 4 3 2
11 10 9 33
A1 cao cao [5] Use of binomial can get max first M1 5 (i) 25 1 25
6 6 216
(= 0.116)
M1 For 5/6 (or 1 – 1/6) seen
If extra term or whole number factor present give M1M0A0
M1 For whole product A1 cao Allow 0.12 with working [3] 5 (ii) 1051 1 0.1615 0.8385
6
M1
For (5/6)10 (without extra terms)
Allow 0.838 or 0.839 without working and 0.84 with working. For addition P(X = 1) +…+ P(X = 10) give M1A1 for 0.84 or better, otherwise M0A0
A1 cao [2]
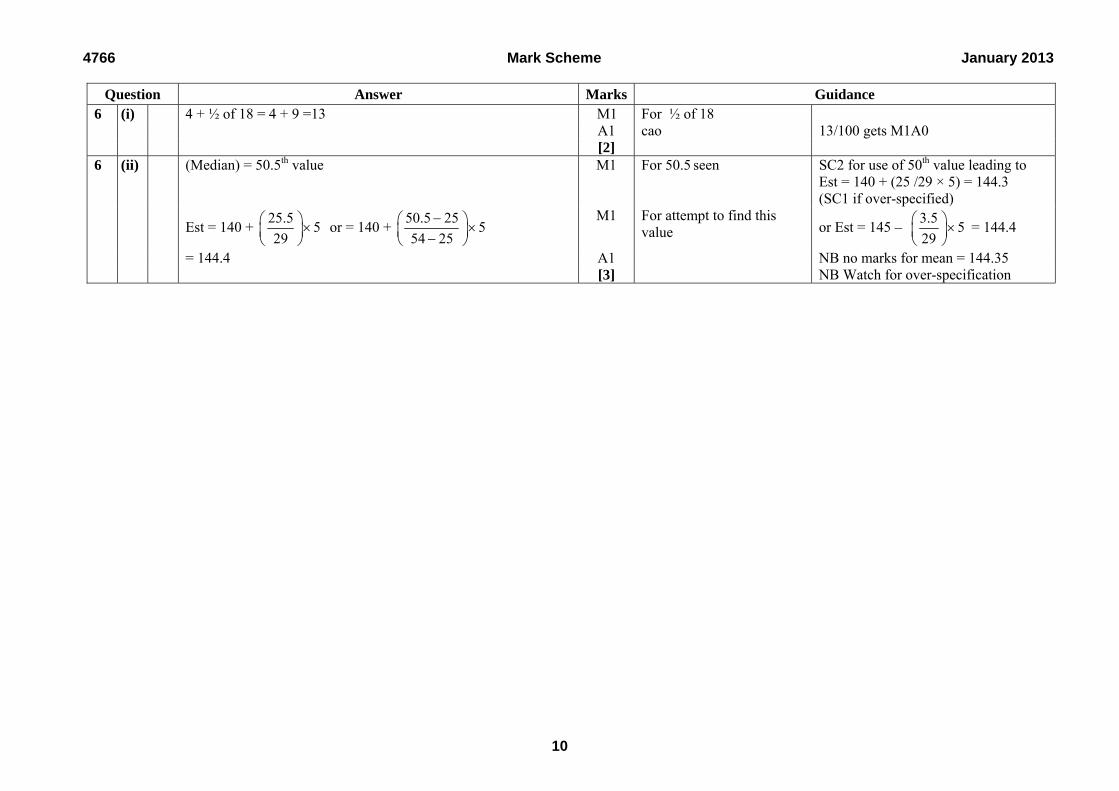
4766 Mark Scheme January 2013
10
Question Answer Marks Guidance 6 (i) 4 + ½ of 18 = 4 + 9 =13 M1 For ½ of 18 A1 cao 13/100 gets M1A0 [2] 6 (ii) (Median) = 50.5th value M1
For 50.5 seen SC2 for use of 50th value leading to
Est = 140 + (25 /29 × 5) = 144.3 (SC1 if over-specified)
Est = 140 + 25.5 5
29
or = 140 + 50.5 25 554 25
M1 For attempt to find this value or Est = 145 – 3.5 5
29
= 144.4
= 144.4 A1 NB no marks for mean = 144.35 [3] NB Watch for over-specification

4766 Mark Scheme January 2013
11
Question Answer Marks Guidance 6 (iii)
Height FrequencyGroup width
Frequency density
125 ≤ x ≤ 140 25 15 1.67 140 < x ≤ 145 29 5 5.80 145 < x ≤ 150 24 5 4.80 150 < x ≤ 160 18 10 1.80 160 < x ≤ 170 4 10 0.40
M1
For fd’s - at least 3 correct Accept any suitable unit for fd such as eg freq per cm.
M1 can be also be gained from freq per 10 – 16.7, 58, 48, 18, 4 (at least 3 correct) or freq per 5 – 8.35, 29, 24, 9, 2
A1 correct to at least one dp allow 1.66 but not 1.6 for first fd
for all correct. If fd not explicitly given, M1 A1 can be gained from all heights correct (within one square) on histogram (and M1A0 if at least 3 correct)
G1
linear scales on both axes and label on vertical axis
Linear scale and label on vertical axis IN RELATION to first M1 mark ie fd or frequency density or if relevant freq/10, etc (NOT eg fd/10). However allow scale given as fd×10, or similar Accept f/w or f/cw (freq/width or freq/class width) Can also be gained from an accurate key G0 if correct label but not fd’s.
W1
width of bars Must be drawn at 125, 140 etc NOT 124.5 or 125.5 etc NO GAPS ALLOWED Must have linear scale. No inequality labels on their own such as 125≤S<140, etc but allow if a clear horizontal linear scale is also given. Ignore horizontal label.
H1 height of bars Height of bars – must be linear vertical scale. FT of heights dep on at least 3 heights correct and all must agree with their
4766 Mark Scheme January 2013
12
Question Answer Marks Guidance fds If fds not given and at least 3 heights correct then max M1A0G1W1H0 Allow restart with correct heights if given fd wrong (for last three marks only)
[5] 6 (iv) 4 boys 0.6 × 15 M1 For 0.6 × 15 Or 45 × 0.2 = 9 (number of squares
and 0.2 per square) = 9 girls A1 For 9 girls So 5 more girls A1 cao [3] 6 (v)
Frequencies and midpoints for girls are Height 132.5 142.5 147.5 155 167.5 Frequency 18 23 31 19 9
B1
For at least three frequencies correct
B1 At least three midpoints correct
No further marks if not using midpoints
So mean = (132.5 18) (142.5 23) (147.5 31) (155 19) (167.5 9)
100
= (2385) (3277.5) (4572.5) (2945) (1507.5)
100
M1 For attempt at ∑xf For sight of at least 3 xf pairs M1*
Dep on M1
For division by 100
= 146.9 (Exact answer 146.875)
A1 Cao NB Watch for over-specification
Allow answer 146.9 or 147 but not 150 NB Accept answers seen without working (from calculator) Use of ‘not quite right’ midpoints such as 132.49 or 132.51 etc can get B1B0M1M1A0
[5]
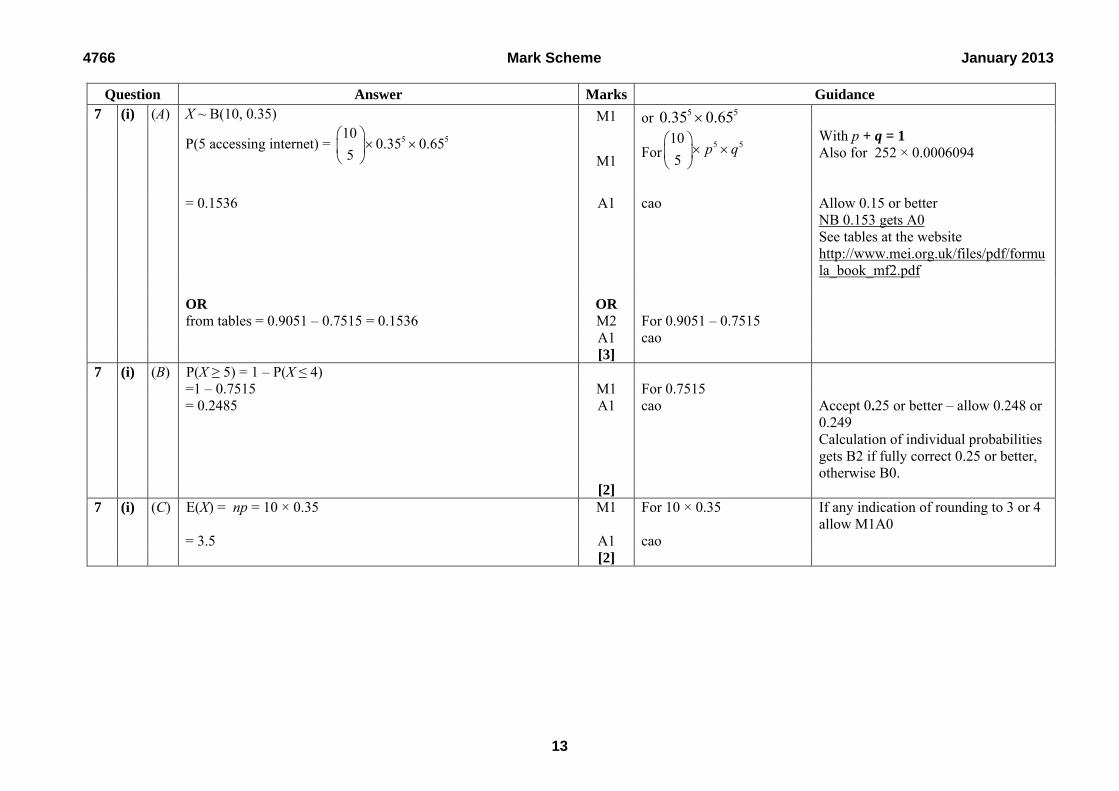
4766 Mark Scheme January 2013
13
Question Answer Marks Guidance 7 (i) (A) X ~ B(10, 0.35)
P(5 accessing internet) = 5 5100.35 0.65
5
M1 or 5 50.35 0.65
M1 For5 510
5p q
With p + q = 1 Also for 252 × 0.0006094
= 0.1536 A1 cao Allow 0.15 or better NB 0.153 gets A0 See tables at the website http://www.mei.org.uk/files/pdf/formula_book_mf2.pdf
OR OR from tables = 0.9051 – 0.7515 = 0.1536 M2 For 0.9051 – 0.7515 A1 cao [3] 7 (i) (B) P(X ≥ 5) = 1 – P(X ≤ 4) =1 – 0.7515 M1 For 0.7515 = 0.2485 A1 cao Accept 0.25 or better – allow 0.248 or
0.249 Calculation of individual probabilities gets B2 if fully correct 0.25 or better, otherwise B0.
[2] 7 (i) (C) E(X) = np = 10 × 0.35 M1 For 10 × 0.35 If any indication of rounding to 3 or 4
allow M1A0 = 3.5 A1 cao [2]

4766 Mark Scheme January 2013
14
Question Answer Marks Guidance 7 (ii) Let X ~ B(20, 0.35) Let p = probability of a customer using the internet (for
population) B1 For definition of p in
context Minimum needed for B1 is p = probability of using internet. Allow p = P(using internet) Definition of p must include word probability (or chance or proportion or percentage or likelihood but NOT possibility). Preferably as a separate comment. However can be at end of H0 as long as it is a clear definition ‘p = the probability of using internet’, Do NOT allow ‘p = the probability of using internet is different’
H0: p = 0.35 B1 For H0 Allow p=35%, allow only p or θ or π or ρ. However allow any single symbol if defined (including x) Allow H0 = p=0.35, Allow H0 : p=7/20or p=35/100 Allow NH and AH in place of H0 and H1 Do not allow H0 : P(X=x) = 0.35 Do not allow H0: =0.35, =35%, P(0.35), p(x)=0.35, x=0.35 (unless x correctly defined as a probability) Do not allow H0 and H1 reversed For hypotheses given in words allow Maximum B0B1B1 Hypotheses in words must include probability (or chance or proportion or percentage) and the figure 0.35 oe Thus eg H0 : p(using internet) = 0.35, H1 : p(using internet) ≠ 0.35 gets B0B1B1

4766 Mark Scheme January 2013
15
Question Answer Marks Guidance H1: p 0.35 B1 For H1 Allow ‘p < 0.35 or p > 0.35’in place of
p 0.35 H1 has this form because the test is to investigate whether the
proportion is different, (rather than lower or higher). E1 Do not allow if H1 wrong.
P(X ≥ 10) B1 For notation P(X ≥ 10) or P(X > 9) or 1 – P(X ≤ 9) (as long as no incorrect notation)
This mark may be implied by 0.1218 as long as no incorrect notation. No further marks if point probs used - P(X = 10) = 0.0686 (do not even give the notation mark for correct notation) DO NOT FT wrong H1, but see extra notes
= 1 – 0.8782 = 0.1218 B1* For 0.1218 Allow 0.12 Or for 1 – 0.8782 Indep of previous mark
> 2.5% M1* dep
For comparison with 2.5%
So not significant. A1* Allow ‘accept H0’ or ‘reject H1’ Conclude that there is not enough evidence to indicate that the
probability is different. (Must state ‘probability’, not just ‘p’) E1*
dep on A1
Must include ‘sufficient evidence’ or something similar such as ‘to suggest that’ ie an element of doubt either in the A or E mark.
ALTERNATIVE METHOD FOR FINAL 5 MARKS
Critical region method LOWER TAIL P(X ≤ 2) = 0.0121 < 2.5% P(X ≤ 3) = 0.0444 > 2.5%
B1
For either probability
Do not insist on correct notation as candidates have to work out two probabilities for full marks. If only upper tail of CR given (or only upper tail justified), allow max 4/5 for final 5 marks.
UPPER TAIL P(X ≥ 11) = 1 – P(X ≤ 10) = 1 – 0.9468 = 0.0532 > 2.5% P(X ≥ 12) = 1 – P(X ≤ 11) = 1 – 0.9804 = 0.0196 < 2.5%
B1
For either probability

4766 Mark Scheme January 2013
16
Question Answer Marks Guidance So critical region is {0,1,2,12,13,14,15,16,17,18,19,20} M1*
dep cao dep on at least one correct comparison with 2.5%
No marks if CR not justified Condone {0,1,2, 12, … 20}, X ≤ 2, X ≥ 12, oe but not P(X ≤ 2) etc
So not significant A1* Conclude that there is not enough evidence to indicate that the
probability is different. E1*
dep on A1
NB If CR found correctly then P(X = 10) subsequently found but cand says ’10 not in CR’ then allow up to all last five marks. If do not say ’10 not in CR’ allow none of last five marks
[9] 7 (iii) 0.0022 < 2.5% So reject Ho,
Significant. B1 For either reject Ho or
significant, dep on correct comparison
Conclude that there is enough evidence to indicate that the probability is different.
E1* dep
Dep on good attempt at correct hypotheses in part (ii)
If they have H1: p>0.35, allow SC1 if all correct including comparison with 5%.
[2]
4766 Mark Scheme January 2013
17
APPENDIX NOTE RE OVER-SPECIFICATION OF ANSWERS If answers are grossly over-specified, deduct the final answer mark in every case. Probabilities should also be rounded to a sensible degree of accuracy. In general final non-probability answers should not be given to more than 4 significant figures. Allow probabilities given to 5 sig fig. Additional notes re Q7 part ii Comparison with 97.5% method If 97.5% seen anywhere then B1 for P(X ≤ 9) B1 for 0.8782 M1* for comparison with 97.5% dep on second B1 A1* for not significant oe E1* Smallest critical region method: Smallest critical region that 10 could fall into is {10,11,12,13,14,15, 16, 17, 18,19,20} gets B1 and has size 0.1218 gets B1, This is > 2.5% gets M1*, A1*, E1* as per scheme NB These marks only awarded if 10 used, not other values. Use of k method with no probabilities quoted: This gets zero marks. Use of k method with one probability quoted: Mark as per scheme Line diagram method and Bar chart method No marks unless correct probabilities shown on diagram, then mark as per scheme. Upper tailed test done with H1: p>0.35 Hyp gets max B1B1B0E0 If compare with 5% give SC2 for P(X ≥ 10) = 1 – 0.8782 = 0.1218 > 5% and SC1 for final conclusion (must be ‘larger than’ not ‘different from’) If compare with 2.5% no further marks B0B0M0A0E0 Lower tailed test done with H1: p<0.35 No marks out of last 5.

4766 Mark Scheme June 2013
6
Question Answer Marks Guidance 1 (i)
Mean = 24940100
= 249.4g or 249g B1
Ignore units CAO
NB 249.40 gets B0 for over-specification
Sxx =
2249406240780100
= 20744 M1
For Sxx
M1 for 6240780 - 100 their mean2 BUT NOTE M0 if their Sxx < 0
s = 20744
99 = 209.53 = 14.4751 =14.5g
A1
CAO ignore units For s2 of 210 (or better) allow M1A0 with or without working For RMSD of 14.4 (or better) allow M1A0 provided working seen For RMSD2 of 207 (or better) allow M1A0 provided working seen Allow 14.48 but NOT 14.47
[3]
1 (ii) New mean = (0.9 × 249.4) – 15 = 209.5g B1 FT their mean provided answer is positive
If candidate ‘starts again’ only award marks for CAO Allow 209
New sd = 0.9 × 14.48 = 13.03g M1 A1
FT their sd FT Allow 13.0 to 13.1
Or for 0.92×14.52 Deduct at most 1 mark overall in whole question for over-specification of Mean and 1 mark overall for SD
[3]

4766 Mark Scheme June 2013
7
Question Answer Marks Guidance 2 (i) 5 4 5 300 53
10 9 8 720 12 = (0.4167)
M1 For 5/10 × 4/9 Correct working but then multiplied or divided by some factor scores M1M1M0A0
M1 For × 5/8 Zero for binomial Allow M2 for equivalent triple such as 5 5 4
10 9 8
M1 For 3 × triple product Or 3 separate equal triplets added A1 CAO (Fully simplified) Answer must be a fraction
[4] Or
5 52 1 10 5 5
10 120 123
M1* For
5 52 1
Seen
M1* For
103
Seen
M1* dep
For whole fraction Correct working but then multiplied or divided by some factor scores M1M1M0A0
A1
CAO (Fully simplified)
2 (ii) 3 47 5 5412 12 12
M1FT For first probability Allow 4C3
M1FT For (5/12)4 M1FT For sum of both correct
probabilities Provided sum <1
0.169 0.030 0.199
Or 875 625 13755184 20736 6912
A1 CAO Do not allow 0.2, unless fuller answer seen first
Alternative for 1- (P(0)+P(1)+P(2)) allow M1FT for two ‘correct’ probs, M1 for sum of three ‘correct’, M1 for 1 – answer, A1 CAO
[4]

4766 Mark Scheme June 2013
8
Question Answer Marks Guidance 3 (i) X ~ B(50, 0.1) M1 For 5 450.1 0.9
P(5 underweight) = 5 4550
0.1 0.95
= 0.1849
M1 For 5 4550
5p q
With p + q = 1 Also for 2118760 × 8.73 × 10-8
A1 CAO Allow 0.185 or better NB 0.18 gets A0
[3]
3 (ii) X ~ B(20, 0.1) P(X ≥ 1) = 1 – P(X = 0) M1 For 0.1216 Allow M1 for 0.920 = 1 – 0.1216 = 0.8784 A1 CAO Allow 0.878 or better [2] See tables at the website
http://www.mei.org.uk/files/pdf/formula_book_mf2.pdf
3 (iii) E(X) = 48 × 0.8784 = 42.16 (= 42.2) M1 A1
FT their probability from part (ii)
If any indication of rounding to 42 or 43 or to another integer on FT allow M1A0 SC1 for 48 ´ their p giving an integer answer. NB 0.6083 in (ii) leads to 29.20
[2]

4766 Mark Scheme June 2013
9
Question Answer Marks Guidance 4 (i)
P(X = 15) 3 2 16 5 4
M1 For product of three correct
fractions
= 6 1 0.05
120 20
Or 6 3
1 1 0.05C 20
Or 3! 3! 1 0.056! 20
A1
NB ANSWER GIVEN NB 1 – (0.45 + 0.45 + 0.05) = 0.05 scores M0A0
Full marks for 1 1 1 63! 0.056 5 4 120
Allow 3 ´ 2 in place of 3! SC1 for
1 1 1 66 0.056 5 4 120
[2] 4 (ii) E(X) = (15 × 0.05) + (1010 × 0.45) + (2005 × 0.45) + (3000 ×
0.05) M1
For Σrp (at least 3 terms correct)
= 1507.5 so 1508 (4sf) A1 CAO Allow 1507, 1510, 1507.5, 1507.50 or 3015/2
E(X2) = (152 × 0.05) + (10102 × 0.45) + (20052 × 0.45) + (30002 × 0.05) = 2718067.5
M1 For Σr2p (at least 3 terms correct)
Use of E(X-µ)2 gets M1 for attempt at (x-µ)2 should see (-1492.5)2, (-497.5)2, 497.52, 1492.52, (if E(X) wrong FT their E(X)) (all 4 correct for M1), then M1 for Σp(x-µ)2 (at least 3 terms correct with their probabilities) Division by 4 or other spurious value at end gives max M1A1M1M1A0, or M1A0M1M1A0 if E(X) also divided by 4. Unsupported correct answers get 5 marks
Var (X) = 2718067.5 – 21507.5 M1 dep for – their E(X)²
= 445511.25 so 445500 (4sf) A1
FT their E(X) provided Var(X) > 0 (and of course E(X2) is correct)
Allow 446000
[5]

4766 Mark Scheme June 2013
10
Question Answer Marks Guidance 5 (i) Because if people cannot make a correct identification, then the
probability that they guess correctly will be 0.5 For ‘equally likely to guess right or wrong’ or ‘two outcomes with equal probability’ or ‘50:50 chance of success’ or ‘right one in two occasions on average’ or ‘two (equally likely) outcomes’ etc
E1
E1
For idea of a guess or ‘chosen at random’ For idea of two outcomes
NB The question includes the sentence ‘She suspects that people do no better than they would by guessing.’, so this on its own does not get the mark for the idea of a guess
[2] 5 (ii) ‘Because people may do better than they would by guessing’
or similar B1 For idea of selecting
correctly /identifying /knowing
No marks if answer implies that it is because there are over half in the sample who make a correct identification
[1] 5 (iii) P(X ≥ 13) = 1– P(X ≤ 12) = 1 – 0.8684 = 0.1316
NB PLEASE ANNOTATE THE TOP AND BOTTOM OF THE EXTRA PAGE IF NOT USED
M1 For notation P(X ≥ 13) or P(X > 12) or 1– P(X ≤ 12)
Notation P(X = 13) scores M0. If they have the correct P(X ≥ 13) then give M1 and ignore any further incorrect notation.
B1* For 0.1316 Or for 1 – 0.8684 indep of previous mark
0.1316 > 0.05 M1* dep
For comparison with 5%
So not significant A1*
Allow ‘accept H0’ or ‘reject H1’
There is insufficient evidence to suggest that people can make a correct identification.
E1* dep
NB Point probabilities score zero.
Must include ‘insufficient evidence’ or something similar such as ‘to suggest that’ ie an element of doubt either in the A or E mark. Must be in context to gain E1 mark. Do not allow ‘sufficient evidence to suggest proportion making correct identification is 0.5’ or similar

4766 Mark Scheme June 2013
11
Question Answer Marks Guidance ALTERNATIVE METHOD – follow method above unless
some mention of CR seen
Must see some reference to CR to gain any marks
Critical region method UPPER TAIL P(X ≥ 14) = 1 – P(X ≤ 13) = 1 – 0.9423 = 0.0577 > 5% P(X ≥ 15) = 1 – P(X ≤ 14) = 1 – 0.9793 = 0.0207 < 5%
B1
M1*
For either probability For a correct comparison with 5%
Do not insist on correct notation as candidates have to work out two probabilities for full marks. Allow comparison in form of statement ‘critical region at 5% level is …’
So critical region is {15,16,17,18,19,20} M1* dep
cao dep on the two correct probabilities
No marks if CR not justified Condone {15, … 20}, X ≥ 15, oe but not P(X ≥ 15,) etc
13 not in CR so not significant A1* Must include ‘13 not in CR’
Allow ‘accept H0’ or ‘reject H1’
There is insufficient evidence to indicate that people can make a correct identification.
E1* dep on A1
Ignore any work on lower critical region
NB If CR found correctly, then P(X=13) subsequently found, but cand says ‘13 not in CR’ then allow up to all five marks. If do not say ’13 not in CR’ allow no marks
[5]

4766 Mark Scheme June 2013
12
Question Answer Marks Guidance 6 (i) Median = 3.32 kg B1
For Q1 allow 2.82 to 2.84 For Q3 allow 3.70 to 3.72 If no quartiles given allow B0B1 for
Q1 (= 6.5th value) = 2.83 Q3 (= 19.5th value) = 3.71 B1 For Q1 or Q3 Inter-quartile range = 3.71 – 2.83 = 0.88 B1 For IQR dep on both
quartiles correct [3] IQR in range 0.86 to 0.90 (ii)
G1
G1
G1
For reasonably linear scale shown. For boxes in approximately correct positions, with median just to right of centre For whiskers in approximately correct positions in proportion to the box FT their median and quartiles if sensible – guidance above is only for correct values
Dep on attempt at box and whisker plot with at least a box and one whisker. Condone lack of label. Do not award unless RH whisker significantly shorter than LH whisker Allow LH whisker going to 2.5 and outlier marked at 1.39
[3] 6 (iii) Lower limit 2.83 – (1.5 × 0.88) = 1.51 B1 For 1.51 FT Any use of median 1.5 × IQR scores
B0 B0 E0 No marks for ± 2 or 3 × IQR In this part FT their values from (i)or (ii) if sensibly obtained but not from location ie 6.5, 19.5
Upper limit 3.71 + (1.5 × 0.88) = 5.03 B1 For 5.03 FT Do not penalise over-specification as not the final answer
Exactly one baby weighs less than 1.51 kg and none weigh over 5.03 kg so there is exactly one outlier.
E1* Dep on their 1.51 and 5.03
Do not allow unless FT leads to upper limit above 4.34 and lower limit between 1.39 and 2.50

4766 Mark Scheme June 2013
13
Question Answer Marks Guidance ‘Nothing to suggest that this baby is not a genuine data value
so she should not be excluded’ or ‘This baby is premature and therefore should be excluded’.
E1* Dep
Any sensible comment in context
For use of mean ± 2sd allow B1 For 3.27 + 2 × 0.62= 4.51 B1 For 3.27 - 2 × 0.62= 2.03 Then E1E1 as per scheme
[4] 6 (iv) Median = 3.5 kg B1 Q1 = 50th value = 3.12 Q3 = 150th value = 3.84 B1 For Q1 or Q3 For Q1 allow 3.11 to 3.13
For Q3 allow 3.83 to 3.85 Inter-quartile range = 3.84 – 3.12 = 0.72 B1 For IQR FT their quartiles Dep on both quartiles correct [3] If no quartiles given allow B0B1 for
IQR in range 0.70 to 0.74 6 (v) Female babies have lower weight than male babies on the
whole E1 FT
Allow ‘on average’ or similar in place of ‘on the whole’
Do not allow lower median
Female babies have higher weight variation than male babies E1 FT
Allow ‘more spread’ or similar but not ‘higher range’ Condone less consistent
Do not allow higher IQR, but SC1 for both lower median and higher IQR, making clear which is which
[2] 6 (vi) Male babies must weigh more than 4.34 kg Approx 10 male babies weigh more than this. M1* For 10 or 9 or 8 Or 200 – 190, 200 –191 or 200 –192
Probability = 10 9 90 9 0.00226200 199 39800 3980
or 9 8 72 0.00181200 199 39800
or 8 7 56 7 0.00141200 199 39800 4975
M1* dep
A1
For first fraction multiplied by any other different fraction (Not a binomial probability) CAO Allow their answer to min of 2 sf
Allow any of these answers For spurious factors, eg 2 × correct answer allow M1M1A0 SC1 for n/200 × (n-1)/199
[3]

4766 Mark Scheme June 2013
14
0.1
0.9 Miss
0.05
0.95
Hit
Hit
Hit 0.2
0.8 Miss
Miss
First
Second Hit 0.2
0.8 Miss
Hit 0.2
0.8 Miss
Third
Hit
Hit
Miss
Miss
0.05
0.95
0.05
0.95
Question Answer Marks Guidance 7 (i)
G1
G1
G1
G1
For first set of branches For second set of branches (indep) For third set of branches (indep) For labels
All probabilities correct All probabilities correct All probabilities correct All correct labels for ‘Hit’ and ‘Miss’, ‘H’ and ‘M’ etc. Condone omission of First, Second, Third. Do not allow misreads here as all FT
[4] 7 (ii) A P(Hits with at least one) = 1 – P(misses with all) M1* For 0.9 × 0.95 × 0.95 FT their tree for both M marks, = 1 – (0.9 × 0.95 × 0.95) = 1 – 0.81225 = 0.18775 M1*
dep For 1 – ans provided three terms
A1 CAO 0.188 or better. Condone 0.1877 Allow 751/4000
ALTERNATIVE METHOD only if there is an attempt to add 7 probabilities
At least three correct triple products M1 Attempt to add 7 triple products M1 (not necessarily correct triple products) A1 CAO FURTHER ALTERNATIVE METHOD 0.1 + 0.9 × 0.05 M1 Above probability + 0.9 × 0.95 × 0.05 M1 A1 CAO [3]

4766 Mark Scheme June 2013
15
Question Answer Marks Guidance 7 (ii) B P(Hits with exactly one) M1 For two correct products FT their tree for all three M marks, = (0.1 × 0.8 × 0.95) + (0.9 × 0.05 × 0.8) + (0.9 × 0.95 × 0.05) M1 For all three correct
products provided three terms
= 0.076 + 0.036 + 0.04275 19 9 171
250 250 4000
M1 For sum of all three correct products
6194000
= 0.15475 A1 CAO Allow 0.155 or better
[4] 7 (iii) P(Hits with exactly one given hits with at least one)
=
P Hits with exactly one and hits with at least oneP Hits with at least one
If answer to (B) > than answer to (A) then max M1M0A0
= 0.15475
0.18775
M1 M1
For numerator FT For denominator FT
Both must be part of a fraction
= 0.8242 A1 CAO Allow 0.824 or better or 619/751 [3] 7 (iv) P(Hits three times overall) =
(0.1 × 0.2 × 0.2) + (0.9 × 0.95 × 0.95 × 0.05 × 0.2 × 0.2) M1 For 0.1 × 0.2 × 0.2 or 0.004
or 1/250 FT their tree for all three M marks
M1 For 0.9 × 0.95 × 0.95 × 0.05 × 0.2 × 0.2
provided three terms in first product and six in second product. Last three probs must be 0.05 × 0.2 × 0.2 unless they extend their tree
= 0.004 + 0.0016245 M1* Dep on both prev M1’s
For sum of both With no extras
= 0.0056245 A1 CAO Allow 0.00562 or 0.00563 or 0.0056 [4]

4766 Mark Scheme June 2013
16
NOTE RE OVER-SPECIFICATION OF ANSWERS If answers are grossly over-specified, deduct the final answer mark in every case. Probabilities should also be rounded to a sensible degree of accuracy. In general final non probability answers should not be given to more than 4 significant figures. Allow probabilities given to 5 sig fig. PLEASE HIGHLIGHT ANY OVER-SPECIFICATION Please note that there are no G or E marks in scoris, so use B instead
NB PLEASE ANNOTATE EVERY ADDITIONAL ANSWER SHEET EVEN IF FULL MARKS AWARDED OR THE PAGE IS BLANK

4766 Mark Scheme June 2013
17
Additional notes re Q5 part iii Comparison with 95% method If 95% seen anywhere then M1 for P(X ≤ 12) B1 for 0.8684 M1* for comparison with 95% dep on second B1 A1* for not significant oe E1* Comparison with 95% CR method If 95% seen anywhere then B1 for 0.9423 or 0.9793 M1 for correct comparison with 95% M1dep for correct CR provided both probs correct then follow mark scheme for CR method Smallest critical region method: Smallest critical region that 13 could fall into is {13, 14, 15, 16, 17, 18, 19, 20} gets B1 and has size 0.1316 gets B1, This is > 5% gets M1*, A1*, E1* as per scheme NB These marks only awarded if 13 used, not other values. Use of k method with no probabilities quoted: This gets zero marks. Use of k method with one probability quoted: Mark as per scheme Line diagram method and Bar chart method No marks unless correct probabilities shown on diagram, then mark as per scheme..

4766 Mark Scheme June 2014
1. Annotations and abbreviations
Annotation in scoris Meaning
Blank Page – this annotation must be used on all blank pages within an answer booklet (structured or unstructured) and on each page of an additional object where there is no candidate response.
and BOD Benefit of doubt FT Follow through ISW Ignore subsequent working M0, M1 Method mark awarded 0, 1 A0, A1 Accuracy mark awarded 0, 1 B0, B1 Independent mark awarded 0, 1 SC Special case ^ Omission sign MR Misread Highlighting Other abbreviations in mark scheme
Meaning
E1 Mark for explaining U1 Mark for correct units G1 Mark for a correct feature on a graph M1 dep* Method mark dependent on a previous mark, indicated by * cao Correct answer only oe Or equivalent rot Rounded or truncated soi Seen or implied www Without wrong working

4766 Mark Scheme June 2014
4
2. Subject-specific Marking Instructions for GCE Mathematics (MEI) Statistics strand a Annotations should be used whenever appropriate during your marking.
The A, M and B annotations must be used on your standardisation scripts for responses that are not awarded either 0 or full marks. It is vital that you annotate standardisation scripts fully to show how the marks have been awarded. For subsequent marking you must make it clear how you have arrived at the mark you have awarded.
b An element of professional judgement is required in the marking of any written paper. Remember that the mark scheme is designed to assist in marking incorrect solutions. Correct solutions leading to correct answers are awarded full marks but work must not be judged on the answer alone, and answers that are given in the question, especially, must be validly obtained; key steps in the working must always be looked at and anything unfamiliar must be investigated thoroughly. Correct but unfamiliar or unexpected methods are often signalled by a correct result following an apparently incorrect method. Such work must be carefully assessed. When a candidate adopts a method which does not correspond to the mark scheme, award marks according to the spirit of the basic scheme; if you are in any doubt whatsoever (especially if several marks or candidates are involved) you should contact your Team Leader.
c The following types of marks are available. M A suitable method has been selected and applied in a manner which shows that the method is essentially understood. Method marks are not usually lost for numerical errors, algebraic slips or errors in units. However, it is not usually sufficient for a candidate just to indicate an intention of using some method or just to quote a formula; the formula or idea must be applied to the specific problem in hand, eg by substituting the relevant quantities into the formula. In some cases the nature of the errors allowed for the award of an M mark may be specified. A Accuracy mark, awarded for a correct answer or intermediate step correctly obtained. Accuracy marks cannot be given unless the associated Method mark is earned (or implied). Therefore M0 A1 cannot ever be awarded. B Mark for a correct result or statement independent of Method marks.

4766 Mark Scheme June 2014
5
E A given result is to be established or a result has to be explained. This usually requires more working or explanation than the establishment of an unknown result. Unless otherwise indicated, marks once gained cannot subsequently be lost, eg wrong working following a correct form of answer is ignored. Sometimes this is reinforced in the mark scheme by the abbreviation isw. However, this would not apply to a case where a candidate passes through the correct answer as part of a wrong argument.
d When a part of a question has two or more ‘method’ steps, the M marks are in principle independent unless the scheme specifically says otherwise; and similarly where there are several B marks allocated. (The notation ‘dep *’ is used to indicate that a particular mark is dependent on an earlier, asterisked, mark in the scheme.) Of course, in practice it may happen that when a candidate has once gone wrong in a part of a question, the work from there on is worthless so that no more marks can sensibly be given. On the other hand, when two or more steps are successfully run together by the candidate, the earlier marks are implied and full credit must be given.
e The abbreviation ft implies that the A or B mark indicated is allowed for work correctly following on from previously incorrect results. Otherwise, A and B marks are given for correct work only — differences in notation are of course permitted. A (accuracy) marks are not given for answers obtained from incorrect working. When A or B marks are awarded for work at an intermediate stage of a solution, there may be various alternatives that are equally acceptable. In such cases, exactly what is acceptable will be detailed in the mark scheme rationale. If this is not the case please consult your Team Leader. Sometimes the answer to one part of a question is used in a later part of the same question. In this case, A marks will often be ‘follow through’. In such cases you must ensure that you refer back to the answer of the previous part question even if this is not shown within the image zone. You may find it easier to mark follow through questions candidate-by-candidate rather than question-by-question.
f Wrong or missing units in an answer should not lead to the loss of a mark unless the scheme specifically indicates otherwise. Candidates are expected to give numerical answers to an appropriate degree of accuracy. 3 significant figures may often be the norm for this, but this always needs to be considered in the context of the problem in hand. For example, in quoting probabilities from Normal tables, we generally expect some evidence of interpolation and so quotation to 4 decimal places will often be appropriate. But even this does not always apply – quotations of the standard critical points for significance tests such as 1.96, 1.645, 2.576 (maybe even 2.58 – but not 2.57) will commonly suffice, especially if the calculated value of a test statistic is nowhere near any of these values. Sensible discretion must be exercised in such cases. Discretion must also be exercised in the case of small variations in the degree of accuracy to which an answer is given. For example, if 3 significant figures are expected (either because of an explicit instruction or because the general context of a problem demands it) but only 2 are given, loss of an accuracy ("A") mark is likely to be appropriate; but if 4 significant figures are given, this should not normally be penalised. Likewise, answers which are slightly deviant from what is expected in a very minor manner (for example a Normal probability

4766 Mark Scheme June 2014
6
given, after an attempt at interpolation, as 0.6418 whereas 0.6417 was expected) should not be penalised. However, answers which are grossly over- or under-specified should normally result in the loss of a mark. This includes cases such as, for example, insistence that the value of a test statistic is (say) 2.128888446667 merely because that is the value that happened to come off the candidate's calculator. Note that this applies to answers that are given as final stages of calculations; intermediate working should usually be carried out, and quoted, to a greater degree of accuracy to avoid the danger of premature approximation. The situation regarding any particular cases where the accuracy of the answer may be a marking issue should be detailed in the mark scheme rationale. If in doubt, contact your Team Leader.
g Rules for replaced work If a candidate attempts a question more than once, and indicates which attempt he/she wishes to be marked, then examiners should do as the candidate requests.
If there are two or more attempts at a question which have not been crossed out, examiners should mark what appears to be the last (complete) attempt and ignore the others. NB Follow these maths-specific instructions rather than those in the assessor handbook.
h Genuine misreading (of numbers or symbols, occasionally even of text) occurs. If this results in the object and/or difficulty of the question being considerably changed, it is likely that all the marks for that question, or section of the question, will be lost. However, misreads are often such that the object and/or difficulty remain substantially unaltered; these cases are considered below. The simple rule is that all method ("M") marks [and of course all independent ("B") marks] remain accessible but at least some accuracy ("A") marks do not. It is difficult to legislate in an overall sense beyond this global statement because misreads, even when the object and/or difficulty remains unchanged, can vary greatly in their effects. For example, a misread of 1.02 as 10.2 (perhaps as a quoted value of a sample mean) may well be catastrophic; whereas a misread of 1.6748 as 1.6746 may have so slight an effect as to be almost unnoticeable in the candidate's work. A misread should normally attract some penalty, though this would often be only 1 mark and should rarely if ever be more than 2. Commonly in sections of questions where there is a numerical answer either at the end of the section or to be obtained and commented on (eg the value of a test statistic), this answer will have an "A" mark that may actually be designated as "cao" [correct answer only]. This should be interpreted strictly – if the misread has led to failure to obtain this value, then this "A" mark must be withheld even if all method marks have been earned. It will also often be the case that such a mark is implicitly "cao" even if not explicitly designated as such.

4766 Mark Scheme June 2014
7
On the other hand, we commonly allow "fresh starts" within a question or part of question. For example, a follow-through of the candidate's value of a test statistic is generally allowed (and often explicitly stated as such within the marking scheme), so that the candidate may exhibit knowledge of how to compare it with a critical value and draw conclusions. Such "fresh starts" are not affected by any earlier misreads. A misread may be of a symbol rather than a number – for example, an algebraic symbol in a mathematical expression. Such misreads are more likely to bring about a considerable change in the object and/or difficulty of the question; but, if they do not, they should be treated as far as possible in the same way as numerical misreads, mutatis mutandis. This also applied to misreads of text, which are fairly rare but can cause major problems in fair marking. The situation regarding any particular cases that arise while you are marking for which you feel you need detailed guidance should be discussed with your Team Leader. Note that a miscopy of the candidate’s own working is not a misread but an accuracy error.

4766 Mark Scheme June 2014
1
Question Answer Marks Guidance
1 (i) Upper Bound 20 30 40 50 60 70 80 90
Cumulative Freq 0 10 40 82 105 114 119 120
B1 Cumulative frequencies
All correct
G1
For plotted points
(Provided plotted at correct
UCB positions)
Plotted within ½ small square
If cf not given then allow G1 for
good attempt at cf. e.g. if they
have 0,10,40,72,95,104,109,110
G1
For joining points
(within ½ a square)
G1 For scales
G1 For labels
All marks dep on good
attempt at cumulative
frequency, but not
cumulative fx’s or other
spurious values.
[5]

4766 Mark Scheme June 2014
2
0.2
0.3
Accept
Retest
0.5
0. 3
0. 5 Reject
Accept
Reject
0.2
Reject
Accept
Retest
0.4
0.6
Question Answer Marks Guidance
1 (ii)
Median = 45 B1
Allow answers between 44
and 46 without checking
curve. Otherwise check
curve.
No marks if not using
diagram.
Based on 60th value
ft their curve (not LCB’s) Allow
40 for m.p. plot without
checking graph
B0 for interpolation
If max value wrong (eg 110) FT
their max value for all 3 marks
Q1 = 37 Q3 = 53 B1
For Q3 or Q1
Allow Q1 between 37 and
38 without checking
Allow Q3 between 52 and
54 without checking
Based on 30th and 90
th values
ft their curve (not LCB’s) Allow
Q1 = 32; Q3 = 48 without
checking graph
Inter-quartile range = 53 – 37 = 16 B1
For IQR providing both Q1
and Q3 are correct
B0 for interpolation
B2 for correct IQR from graph if
quartiles not stated but indicated
on graph
Allow from mid-point plot
Must be good attempt at
cumulative frequency in part (i)
to score any marks here
Lines of best fit: B0 B0 B0 here.
Also cumulative frequency bars:
B0 B0 B0 here
[3]
2 (i)
Alternative version of tree
diagram for Q2(i)

4766 Mark Scheme June 2014
3
0.2
0.5
Accept
Reject
0.3 Retest
0. 5
0. 3 Retest
Accept
0.2
Reject
Accept Reject
0.4
0.6
Question Answer Marks Guidance
2 (i) Do a vertical scan and give:
Allow labels such as A, R,
F(Fail) etc
G1 First column All probabilities correct
G1 Second column All probabilities correct
G1
Final column
Do not award if first two
branches missing
Branches two and three
should come out of ‘retest’
All probabilities correct
If any labels missing or incorrect
allow max 2/3
Do not allow misreads here as all
FT (eg 0.3 and 0.5 reversed)
[3]
2 (ii)
P(Accepted) = 0.2 + (0.3 × 0.2) + (0.3 × 0.3 × 0.4) M1 For second or third product
FT their tree provided correct
numbers of terms and correct
structure of 3, 3, 2 branches.
= 0.2 + 0.06 + 0.036 = 0.296 A1 CAO Allow 37/125 oe
[2]
2 (iii) P(At least one retest given accepted)
=P(At least one retest and accepted)
P(Accepted) M1
For numerator
FT their tree provided correct
numbers of terms and correct
structure of 3, 3, 2 branches. for
both M1’s
= 0.3 0.2 0.3 0.3 0.4
0.296=
0.096
0.296
M1 For denominator Both must be part of a fraction
Allow 12/125 oe
= 0.324 A1
FT their 0.296 and 0.096
Allow 0.32 with working Allow 12/37 oe
[3]

4766 Mark Scheme June 2014
4
0.286
0.099
0.729
L
R
0.121 0.051
Question Answer Marks Guidance
3 (i)
Because P(L | R) P(L) E1
If two or more methods
given and only one correct,
do not award the mark
Allow 0.45 ≠ 0.15
Either P(L ∩ R) (= 0.099) ≠ P(L)
× P(R), provided 0.099 in (ii)
or 0.099 ≠ 0.15 × 0.22 (= 0.033)
Look out for complement
methods, etc
[1]
3 (ii) P(L ∩ R) = P(L | R) × P(R) = 0.45 × 0.22 M1 For product Allow if done correctly in part(i)
= 0.099 A1 CAO Allow 99/1000
[2]
3 (iii)
G1
For two labelled
intersecting circles,
provided no incorrect
labelling.
Condone labels such as P(L) etc
Allow other shapes in place of
circles
No need for ‘box’
G1
For at least 2 correct
probabilities.
FT their P(L ∩ R) from part
(ii) provided ≤ 0.15
FT from 0.033 in (ii) gives
0.117, 0.033, 0.187, 0.663
In general 0.15 – x, x, 0.22 – x,
0.63 + x
May also see 0.0825, 0.0675,
0.1525, 0.6975
G1
For remaining probabilities.
FT their P(L ∩ R) providing
probabilities between 0 and
1.
[3]

4766 Mark Scheme June 2014
5
Question Answer Marks Guidance
4 (i)
P(All four are girls) = 16 15 14 13
30 29 28 27
M1 For
16
30
OR 16 30 1820 52
/ 0.06644 4 27405 783
M1 for either term in correct
position in a fraction
M1 for correct fraction
A1 CAO
Allow full marks for
unsimplified fractional answers
SC2 for
14 13 12 110.0365
30 29 28 27
M1
For product of other three
correct fractions
Without extra terms
= 0.0664 A1
CAO
Allow 0.066 with working
but not 0.07
[3] SC2 for 14 30 143
/ 0.03654 4 3915
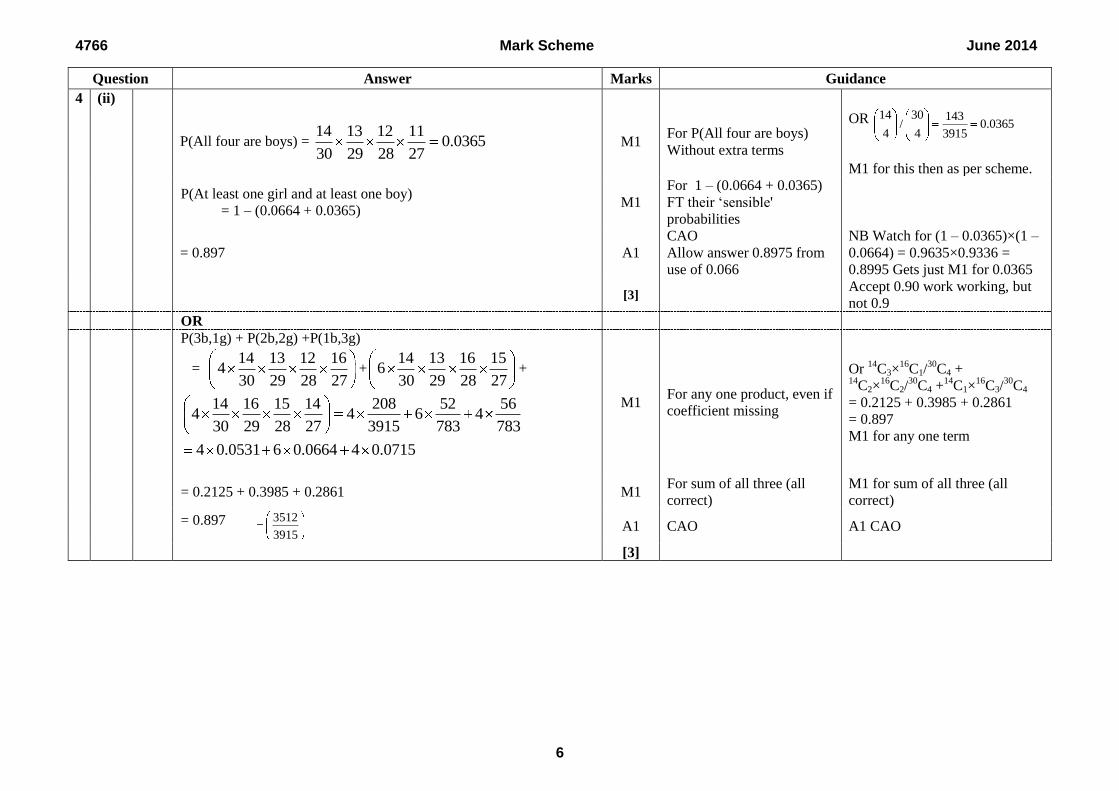
4766 Mark Scheme June 2014
6
Question Answer Marks Guidance
4 (ii)
P(All four are boys) = 14 13 12 11
0.036530 29 28 27
M1 For P(All four are boys)
Without extra terms
OR 14 30 143/ 0.0365
4 4 3915
M1 for this then as per scheme.
P(At least one girl and at least one boy)
= 1 – (0.0664 + 0.0365) M1
For 1 – (0.0664 + 0.0365)
FT their ‘sensible'
probabilities
= 0.897 A1
CAO
Allow answer 0.8975 from
use of 0.066
NB Watch for (1 – 0.0365)×(1 –
0.0664) = 0.9635×0.9336 =
0.8995 Gets just M1 for 0.0365
[3]
Accept 0.90 work working, but
not 0.9
OR P(3b,1g) + P(2b,2g) +P(1b,3g)
= 14 13 12 16
430 29 28 27
+14 13 16 15
630 29 28 27
+
14 16 15 14 208 52 564 4 6 4
30 29 28 27 3915 783 783
4 0.0531 6 0.0664 4 0.0715
M1 For any one product, even if
coefficient missing
Or 14
C3×16
C1/30
C4 + 14
C2×16
C2/30
C4 +14
C1×16
C3/30
C4
= 0.2125 + 0.3985 + 0.2861
= 0.897
M1 for any one term
= 0.2125 + 0.3985 + 0.2861 M1
For sum of all three (all
correct)
M1 for sum of all three (all
correct) = 0.897 3512
3915 A1 CAO A1 CAO
[3]

4766 Mark Scheme June 2014
7
Question Answer Marks Guidance
5 (i) k + 0.01 + k + 0.04 + k + 0.09 + k + 0.16 + k + 0.25 = 1
5k + 0.55 = 1
M1 For equation in k
k = 0.09 A1 NB Answer Given
Allow substitution of k = 0.09 to
show probabilities add to 1 with
convincing working
r 1 2 3 4 5
P(X= r) 0.1 0.13 0.18 0.25 0.34
B1 Complete correct table Must tabulate probabilities,
though may be seen in part(ii)
[3]
5 (ii)
E(X) = (1 0.1) (2 0.13) (3 0.18) (4 0.25) (5 0.34) M1
For Σrp (at least 3 terms
correct Provided 5
reasonable probabilities
seen.
If probs wrong but sum = 1
allow max M1A0M1M1A1. If
sum ≠ 1 allow max
M1A0M1M0A0 (provided all
probabilities ≥0 and <1)
No marks if all probs =0.2
.
Use of E(X-µ)2 gets M1 for
attempt at (x-µ)2 should see (-
2.6)2, (-1.6)
2, (-0.6)
2, 0.4
2, 1.4
2,
(if E(X) wrong FT their E(X))
(all 5 correct for M1), then M1
for Σp(x-µ)2 (at least 3 terms
correct with their probabilities)
Division by 5 or other spurious
value at end and/or rooting final
answer gives max
M1A1M1M1A0, or
M1A0M1M1A0 if E(X) also
divided by 5.
Unsupported correct answers get
5 marks (Probably from
calculator)
= 3.6 A1 CAO
E(X2) =
(1 0.1) (4 0.13) (9 0.18) (16 0.25) (25 0.34) 14.74 M1*
For Σr2p (at least 3 terms
correct)
Var(X) = 14.74 – 3.62
M1*
dep
for – their (E[X])²
FT their E(X) provided Var(
X ) > 0
= 1.78 A1 CAO
[5]
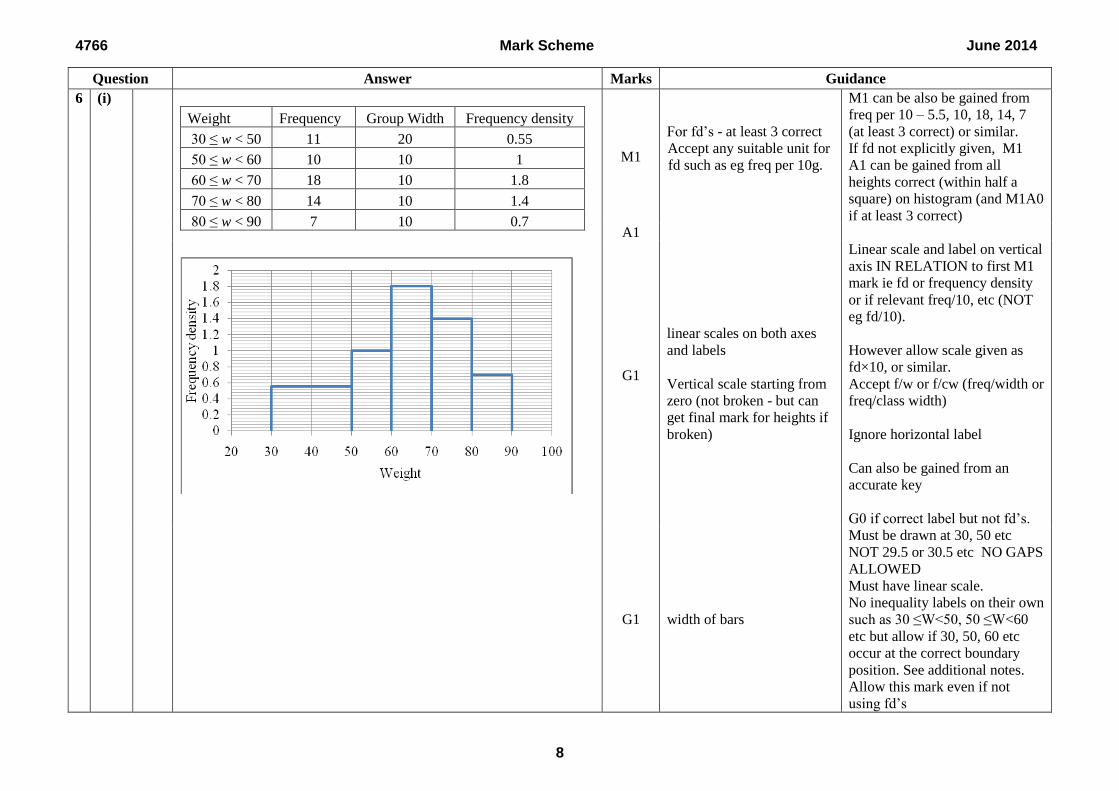
4766 Mark Scheme June 2014
8
Question Answer Marks Guidance
6 (i)
Weight Frequency Group Width Frequency density
30 ≤ w < 50 11 20 0.55
50 ≤ w < 60 10 10 1
60 ≤ w < 70 18 10 1.8
70 ≤ w < 80 14 10 1.4
80 ≤ w < 90 7 10 0.7
M1
For fd’s - at least 3 correct
Accept any suitable unit for
fd such as eg freq per 10g.
M1 can be also be gained from
freq per 10 – 5.5, 10, 18, 14, 7
(at least 3 correct) or similar.
If fd not explicitly given, M1
A1 can be gained from all
heights correct (within half a
square) on histogram (and M1A0
if at least 3 correct)
A1
G1
linear scales on both axes
and labels
Vertical scale starting from
zero (not broken - but can
get final mark for heights if
broken)
Linear scale and label on vertical
axis IN RELATION to first M1
mark ie fd or frequency density
or if relevant freq/10, etc (NOT
eg fd/10).
However allow scale given as
fd×10, or similar.
Accept f/w or f/cw (freq/width or
freq/class width)
Ignore horizontal label
Can also be gained from an
accurate key
G0 if correct label but not fd’s.
G1 width of bars
Must be drawn at 30, 50 etc
NOT 29.5 or 30.5 etc NO GAPS
ALLOWED
Must have linear scale.
No inequality labels on their own
such as 30 ≤W<50, 50 ≤W<60
etc but allow if 30, 50, 60 etc
occur at the correct boundary
position. See additional notes.
Allow this mark even if not
using fd’s
4766 Mark Scheme June 2014
9
Question Answer Marks Guidance
G1 height of bars Height of bars – must be linear
vertical scale.
FT of heights dep on at least 3
heights correct and all must
agree with their fds
If fds not given and at least 3
heights correct then max
M1A0G1G1G0
Allow restart with correct
heights if given fd wrong (for
last three marks only)
[5]

4766 Mark Scheme June 2014
10
Question Answer Marks Guidance
6 (ii) Mean = (40 11) (55 10) (65 18) (75 14) (85 7)
60
3805
60
M1
For midpoints
Products are 440, 550,
1170, 1050, 595
For midpoints (at least 3 correct)
No marks for mean or sd unless
using midpoints
= 63.4 (or 63.42) A1 CAO
(exact answer 63.41666…)
Answer must NOT be left as
improper fraction as this is an
estimate
Accept correct answers for mean
and sd from calculator even if eg
wrong Sxx given
x
2f =
2 2 2 2 2(40 11) (55 10) (65 18) (75 14) (85 7)
253225
23805
253225- 11924.660
xxS M1
For attempt at xxS
Should include sum of at
least 3 correct multiples fx2
– Ʃx2/n
Allow M1 for anything which
rounds to 11900
11924.6202.11 14.2
59s
A1
At least 1dp required
Use of mean 63.4 leading to
answer of 14.29199.. with
Sxx = 12051.4 gets full
credit.
63.42 leads to 14.2014…
Do not FT their incorrect
mean
(exact answer14.2166…)
Allow SC1 for RMSD 14.1
(14.0976…) from calculator.
Only penalise once in part (ii) for
over specification, even if mean
and standard deviation both over
specified.
If using (x – x )2 method, B2 if
14.2 or better (14.3 if use of
63.4), otherwise B0
[4]
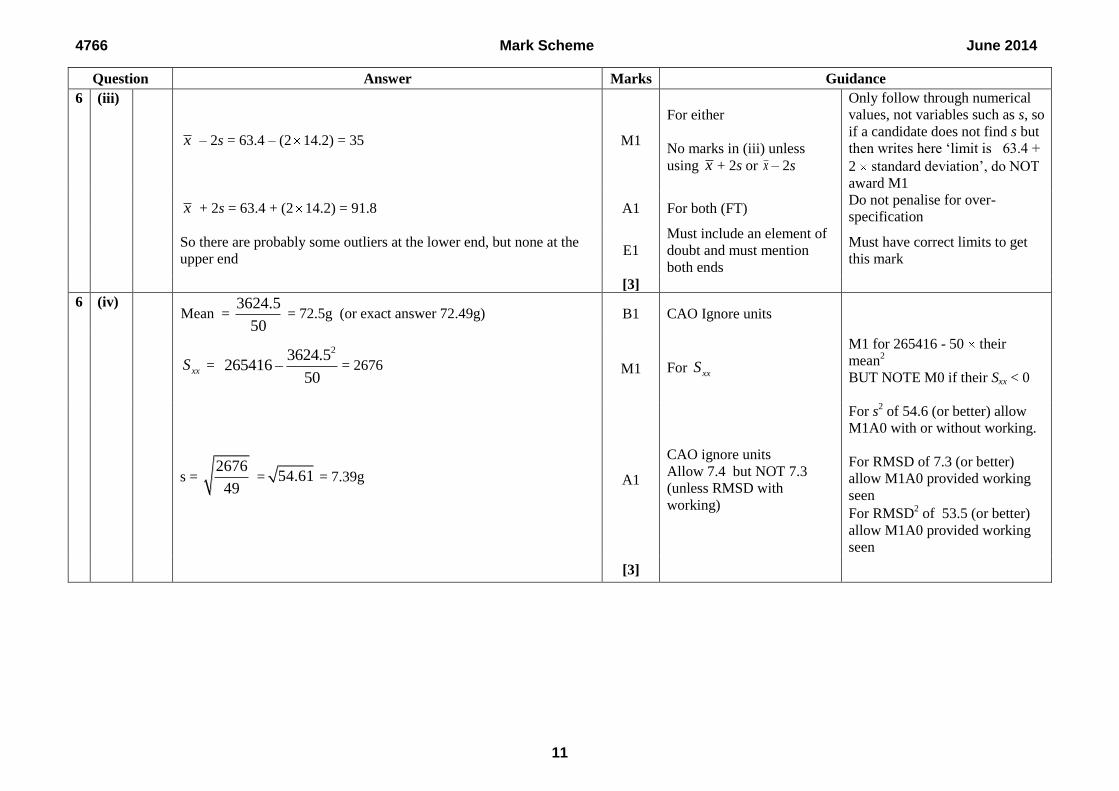
4766 Mark Scheme June 2014
11
Question Answer Marks Guidance
6 (iii)
x – 2s = 63.4 – (2 14.2) = 35 M1
For either
No marks in (iii) unless
using x + 2s or x – 2s
Only follow through numerical
values, not variables such as s, so
if a candidate does not find s but
then writes here ‘limit is 63.4 +
2 standard deviation’, do NOT
award M1
x + 2s = 63.4 + (2 14.2) = 91.8 A1 For both (FT)
Do not penalise for over-
specification
So there are probably some outliers at the lower end, but none at the
upper end E1
Must include an element of
doubt and must mention
both ends
Must have correct limits to get
this mark
[3]
6 (iv) Mean =
3624.5
50 = 72.5g (or exact answer 72.49g) B1 CAO Ignore units
xxS =
23624.5265416
50= 2676 M1 For xxS
M1 for 265416 - 50 their
mean2
BUT NOTE M0 if their Sxx < 0
s = 2676
49 = 54.61 = 7.39g A1
CAO ignore units
Allow 7.4 but NOT 7.3
(unless RMSD with
working)
For s2 of 54.6 (or better) allow
M1A0 with or without working.
For RMSD of 7.3 (or better)
allow M1A0 provided working
seen
For RMSD2 of 53.5 (or better)
allow M1A0 provided working
seen
[3]

4766 Mark Scheme June 2014
12
Question Answer Marks Guidance
6 (v)
Variety A have lower average than Variety B oe E1
FT their means
Do not condone lower
central tendency or lower
mean
Allow ‘on the whole’ or similar
in place of ‘average’.
Variety A have higher variation than Variety B oe E1 FT their sd
Allow ‘more spread’ or similar
but not ‘higher range’ or ‘higher
variance’
Condone less consistent.
[2]
7 (i) (A) X ~ B(15, 0.85)
P(exactly 12 germinate) = 12 3
150.85 0.15
12
M1 For 12 30.85 0.15
M1 For
12 315
12p q
= 0.2184 A1 CAO
OR OR
from tables: 0.3958 – 0.1773 M2 For 0.3958 – 0.1773
= 0.2185 A1 CAO
[3]
7 (i) (B) P(X <12) = P(X ≤ 11) = 0.1773 M1
For P(X ≤ 11) or P(≤11)
(With no extras)
A1
CAO (as final answer)
May see alternative method:
0.3958 – 0.2185 = 0.1773
0.3958 - their wrong answer
to part (i) scores M1A0
[2]

4766 Mark Scheme June 2014
13
Question Answer Marks Guidance
7 (ii) Let p = probability of a seed germinating (for the population) B1 For definition of p See below for additional notes
H0: p = 0.85 B1 For H0
H1: p < 0.85 B1 For H1
H1 has this form because the test is to investigate whether the
proportion of seeds which germinate is lower. E1
Dep on < 0.85 used in H1
Do not allow just
‘Germination rate will be
lower’ or similar.
For use of 0.15 as P(not
germinating), contact team
leader
E0 for simply stating H1 in
words
[4]
7 (iii) Let X ~ B(20, 0.85)
P(X 13) = 0.0219
M1*
For probability (provided
not as part of finding
P(X = 13)) Ignore notation
No further marks if point probs
used - P(X = 13) = 0.0160
DO NOT FT wrong H1, but see
extra notes
Allow ‘accept H0’ or ‘reject H1’
Must include ‘sufficient
evidence’ or something similar
such as ‘to suggest that’ ie an
element of doubt either in the A
or E mark.
0.0219 > 1%
M1*
dep For comparison
So not enough evidence to reject H0.
Not significant. A1
* For not significant oe
Conclude that there is not enough evidence to indicate that the
proportion of seeds which have germinated has decreased.
E1*
dep
For conclusion in context
Must mention decrease, not
just change
ALTERNATIVE METHOD – follow method above unless some
mention of CR seen
Critical region method
No marks if CR not justified
Condone {0,1,2,…, 12}, X ≤ 12,
oe but not P(X ≤ 12) etc
LOWER TAIL
P(X ≤ 13) = 0.0219 > 1%
P(X ≤ 12) = 0.0059 < 1%
M1 For either probability Could get M1A0A1E1 if poor
notation for CR
Do not allow just ’13 not in CR’
- Must say ‘not significant’ or
accept H0 or similar
So critical region is {0,1,2,3,4,5,6,7,8,9,10,11,12} A1
cao dep on at least one
correct comparison with 1%
13 not in CR so not significant A1*
There is insufficient evidence to indicate that the proportion of seeds
which have germinated has decreased.
E1*
dep
[4]

4766 Mark Scheme June 2014
14
Question Answer Marks Guidance
7 (iv) 33 < 35 M1 For comparison Allow ‘33 lies in the CR’
So there is sufficient evidence to reject H0 A1*
Must include ‘sufficient
evidence’ or something similar
such as ‘to suggest that’ ie an
element of doubt either in the A
or E mark.
Do not FT wrong H1: In part (iv)
ignore any interchanged H0 and
H1 seen in part (ii)
Conclude that there is enough evidence to indicate that the proportion
of seeds which have germinated has decreased.
E1*
dep
For conclusion in context
Must mention decrease, not
just change
If use a calculator to find
P(X ≤33) = 0.000661 and
compare with 1% then B2 for
P(X ≤ 33) = 0.000661 < 0.01 so
reject H0 then final E1 as per
scheme.
[3]
7 (v) For n = 3 , P(X 0) = 0.0034 < 0.01 M1 For P(X 0) = 0.0034 Allow 0.003
For n = 2 , P(X 0) = 0.0225 > 0.01 M1 For P(X 0) = 0.0225
So the least value of n for which the critical region is not empty and
thus H0 could be rejected is 3. A1 CAO
Condone just ‘n = 3’ for final A
mark dep on both M marks
If wrong H1 allow max M2A0 if
correct probabilities seen.
ALTERNATIVE METHOD using logs
0.15n < 0.01
n > log 0.01 / log 0.15
n > 2.427
Least n = 3
M1
M1
A1
[3]
GCE
Mathematics (MEI) Unit 4766: Statistics 1 Advanced Subsidiary GCE
Mark Scheme for June 2015
Oxford Cambridge and RSA Examinations

OCR (Oxford Cambridge and RSA) is a leading UK awarding body, providing a wide range of qualifications to meet the needs of candidates of all ages and abilities. OCR qualifications include AS/A Levels, Diplomas, GCSEs, Cambridge Nationals, Cambridge Technicals, Functional Skills, Key Skills, Entry Level qualifications, NVQs and vocational qualifications in areas such as IT, business, languages, teaching/training, administration and secretarial skills. It is also responsible for developing new specifications to meet national requirements and the needs of students and teachers. OCR is a not-for-profit organisation; any surplus made is invested back into the establishment to help towards the development of qualifications and support, which keep pace with the changing needs of today’s society. This mark scheme is published as an aid to teachers and students, to indicate the requirements of the examination. It shows the basis on which marks were awarded by Examiners. It does not indicate the details of the discussions which took place at an Examiners’ meeting before marking commenced. All Examiners are instructed that alternative correct answers and unexpected approaches in candidates’ scripts must be given marks that fairly reflect the relevant knowledge and skills demonstrated. Mark schemes should be read in conjunction with the published question papers and the Report on the Examination. OCR will not enter into any discussion or correspondence in connection with this mark scheme. © OCR 2015
4766 Mark Scheme June 2015 Annotations and abbreviations
Annotation in scoris Meaning and BOD Benefit of doubt FT Follow through ISW Ignore subsequent working M0, M1 Method mark awarded 0, 1 A0, A1 Accuracy mark awarded 0, 1 B0, B1 Independent mark awarded 0, 1 SC Special case ^ Omission sign MR Misread Highlighting Other abbreviations in mark scheme
Meaning
E1 Mark for explaining U1 Mark for correct units G1 Mark for a correct feature on a graph M1 dep* Method mark dependent on a previous mark, indicated by * cao Correct answer only oe Or equivalent rot Rounded or truncated soi Seen or implied www Without wrong working
3

4766 Mark Scheme June 2015 Subject-specific Marking Instructions for GCE Mathematics (MEI) Statistics strand
a Annotations should be used whenever appropriate during your marking. The A, M and B annotations must be used on your standardisation scripts for responses that are not awarded either 0 or full marks. It is vital that you annotate standardisation scripts fully to show how the marks have been awarded. For subsequent marking you must make it clear how you have arrived at the mark you have awarded.
b An element of professional judgement is required in the marking of any written paper. Remember that the mark scheme is designed to assist in marking incorrect solutions. Correct solutions leading to correct answers are awarded full marks but work must not be judged on the answer alone, and answers that are given in the question, especially, must be validly obtained; key steps in the working must always be looked at and anything unfamiliar must be investigated thoroughly. Correct but unfamiliar or unexpected methods are often signalled by a correct result following an apparently incorrect method. Such work must be carefully assessed. When a candidate adopts a method which does not correspond to the mark scheme, award marks according to the spirit of the basic scheme; if you are in any doubt whatsoever (especially if several marks or candidates are involved) you should contact your Team Leader.
c The following types of marks are available. M A suitable method has been selected and applied in a manner which shows that the method is essentially understood. Method marks are not usually lost for numerical errors, algebraic slips or errors in units. However, it is not usually sufficient for a candidate just to indicate an intention of using some method or just to quote a formula; the formula or idea must be applied to the specific problem in hand, eg by substituting the relevant quantities into the formula. In some cases the nature of the errors allowed for the award of an M mark may be specified. A Accuracy mark, awarded for a correct answer or intermediate step correctly obtained. Accuracy marks cannot be given unless the associated Method mark is earned (or implied). Therefore M0 A1 cannot ever be awarded. B Mark for a correct result or statement independent of Method marks. E A given result is to be established or a result has to be explained. This usually requires more working or explanation than the
4

4766 Mark Scheme June 2015
establishment of an unknown result. Unless otherwise indicated, marks once gained cannot subsequently be lost, eg wrong working following a correct form of answer is ignored. Sometimes this is reinforced in the mark scheme by the abbreviation isw. However, this would not apply to a case where a candidate passes through the correct answer as part of a wrong argument.
d When a part of a question has two or more ‘method’ steps, the M marks are in principle independent unless the scheme specifically says otherwise; and similarly where there are several B marks allocated. (The notation ‘dep *’ is used to indicate that a particular mark is dependent on an earlier, asterisked, mark in the scheme.) Of course, in practice it may happen that when a candidate has once gone wrong in a part of a question, the work from there on is worthless so that no more marks can sensibly be given. On the other hand, when two or more steps are successfully run together by the candidate, the earlier marks are implied and full credit must be given.
e The abbreviation ft implies that the A or B mark indicated is allowed for work correctly following on from previously incorrect results. Otherwise, A and B marks are given for correct work only — differences in notation are of course permitted. A (accuracy) marks are not given for answers obtained from incorrect working. When A or B marks are awarded for work at an intermediate stage of a solution, there may be various alternatives that are equally acceptable. In such cases, exactly what is acceptable will be detailed in the mark scheme rationale. If this is not the case please consult your Team Leader. Sometimes the answer to one part of a question is used in a later part of the same question. In this case, A marks will often be ‘follow through’. In such cases you must ensure that you refer back to the answer of the previous part question even if this is not shown within the image zone. You may find it easier to mark follow through questions candidate-by-candidate rather than question-by-question.
f Wrong or missing units in an answer should not lead to the loss of a mark unless the scheme specifically indicates otherwise. Candidates are expected to give numerical answers to an appropriate degree of accuracy. 3 significant figures may often be the norm for this, but this always needs to be considered in the context of the problem in hand. For example, in quoting probabilities from Normal tables, we generally expect some evidence of interpolation and so quotation to 4 decimal places will often be appropriate. But even this does not always apply – quotations of the standard critical points for significance tests such as 1.96, 1.645, 2.576 (maybe even 2.58 – but not 2.57) will commonly suffice, especially if the calculated value of a test statistic is nowhere near any of these values. Sensible discretion must be exercised in such cases. Discretion must also be exercised in the case of small variations in the degree of accuracy to which an answer is given. For example, if 3 significant figures are expected (either because of an explicit instruction or because the general context of a problem demands it) but only 2 are given, loss of an accuracy ("A") mark is likely to be appropriate; but if 4 significant figures are given, this should not normally be penalised. Likewise, answers which are slightly deviant from what is expected in a very
5

4766 Mark Scheme June 2015
minor manner (for example a Normal probability given, after an attempt at interpolation, as 0.6418 whereas 0.6417 was expected) should not be penalised. However, answers which are grossly over- or under-specified should normally result in the loss of a mark. This includes cases such as, for example, insistence that the value of a test statistic is (say) 2.128888446667 merely because that is the value that happened to come off the candidate's calculator. Note that this applies to answers that are given as final stages of calculations; intermediate working should usually be carried out, and quoted, to a greater degree of accuracy to avoid the danger of premature approximation. The situation regarding any particular cases where the accuracy of the answer may be a marking issue should be detailed in the mark scheme rationale. If in doubt, contact your Team Leader.
g Rules for replaced work If a candidate attempts a question more than once, and indicates which attempt he/she wishes to be marked, then examiners should do as the candidate requests.
If there are two or more attempts at a question which have not been crossed out, examiners should mark what appears to be the last (complete) attempt and ignore the others. NB Follow these maths-specific instructions rather than those in the assessor handbook.
h Genuine misreading (of numbers or symbols, occasionally even of text) occurs. If this results in the object and/or difficulty of the question being considerably changed, it is likely that all the marks for that question, or section of the question, will be lost. However, misreads are often such that the object and/or difficulty remain substantially unaltered; these cases are considered below. The simple rule is that all method ("M") marks [and of course all independent ("B") marks] remain accessible but at least some accuracy ("A") marks do not. It is difficult to legislate in an overall sense beyond this global statement because misreads, even when the object and/or difficulty remains unchanged, can vary greatly in their effects. For example, a misread of 1.02 as 10.2 (perhaps as a quoted value of a sample mean) may well be catastrophic; whereas a misread of 1.6748 as 1.6746 may have so slight an effect as to be almost unnoticeable in the candidate's work. A misread should normally attract some penalty, though this would often be only 1 mark and should rarely if ever be more than 2. Commonly in sections of questions where there is a numerical answer either at the end of the section or to be obtained and commented on (eg the value of a test statistic), this answer will have an "A" mark that may actually be designated as "cao" [correct answer only]. This should be interpreted strictly – if the misread has led to failure to obtain this value, then this "A" mark must be withheld even if all method marks have been earned. It will also often be the case that such a mark is implicitly "cao" even if not explicitly designated as such.
6

4766 Mark Scheme June 2015
On the other hand, we commonly allow "fresh starts" within a question or part of question. For example, a follow-through of the candidate's value of a test statistic is generally allowed (and often explicitly stated as such within the marking scheme), so that the candidate may exhibit knowledge of how to compare it with a critical value and draw conclusions. Such "fresh starts" are not affected by any earlier misreads. A misread may be of a symbol rather than a number – for example, an algebraic symbol in a mathematical expression. Such misreads are more likely to bring about a considerable change in the object and/or difficulty of the question; but, if they do not, they should be treated as far as possible in the same way as numerical misreads, mutatis mutandis. This also applied to misreads of text, which are fairly rare but can cause major problems in fair marking. The situation regarding any particular cases that arise while you are marking for which you feel you need detailed guidance should be discussed with your Team Leader. Note that a miscopy of the candidate’s own working is not a misread but an accuracy error.
7
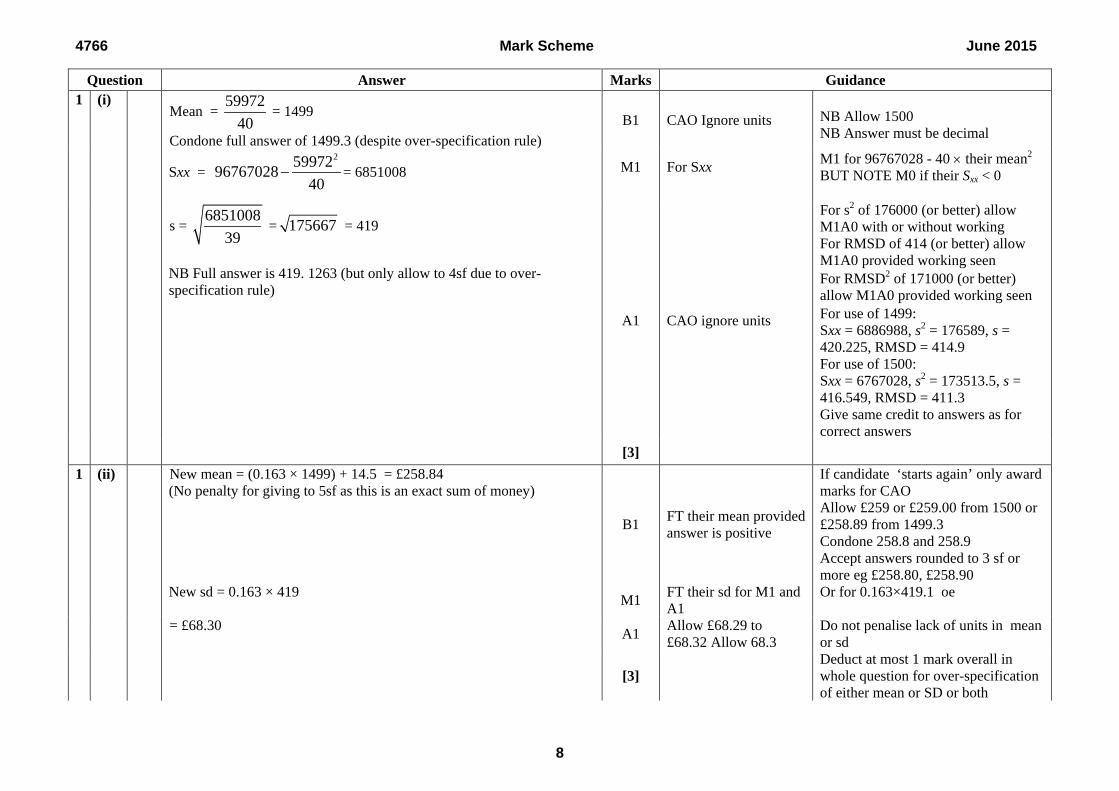
4766 Mark Scheme June 2015
Question Answer Marks Guidance 1 (i)
Mean = 59972
40 = 1499
Condone full answer of 1499.3 (despite over-specification rule) B1 CAO Ignore units
NB Allow 1500 NB Answer must be decimal
Sxx =
2599729676702840
− = 6851008 M1
For Sxx
M1 for 96767028 - 40 × their mean2 BUT NOTE M0 if their Sxx < 0
s =
685100839
= 175667 = 419
NB Full answer is 419. 1263 (but only allow to 4sf due to over-specification rule)
A1
CAO ignore units
For s2 of 176000 (or better) allow M1A0 with or without working For RMSD of 414 (or better) allow M1A0 provided working seen For RMSD2 of 171000 (or better) allow M1A0 provided working seen For use of 1499: Sxx = 6886988, s2 = 176589, s = 420.225, RMSD = 414.9 For use of 1500: Sxx = 6767028, s2 = 173513.5, s = 416.549, RMSD = 411.3 Give same credit to answers as for correct answers
[3]
1 (ii) New mean = (0.163 × 1499) + 14.5 = £258.84 (No penalty for giving to 5sf as this is an exact sum of money)
B1 FT their mean provided answer is positive
If candidate ‘starts again’ only award marks for CAO Allow £259 or £259.00 from 1500 or £258.89 from 1499.3 Condone 258.8 and 258.9 Accept answers rounded to 3 sf or more eg £258.80, £258.90
New sd = 0.163 × 419 M1 FT their sd for M1 and A1
Or for 0.163×419.1 oe
= £68.30 A1 Allow £68.29 to £68.32 Allow 68.3
Do not penalise lack of units in mean or sd
[3]
Deduct at most 1 mark overall in whole question for over-specification of either mean or SD or both
8
4766 Mark Scheme June 2015
Question Answer Marks Guidance 2 (i) (A)
P(Watched cyc but not fb) = 15250
=3
50 = 0.06 B1 CAO (aef)
[1] 2 (i) (B)
P(Watched one or two) = 33 12 21 14 3 65
250+ + + + +
M1
250 (64 38)OR: 250− +
=
For M1 terms must be added with no extra terms (added or subtracted)
148250
= =74
125= 0.592 A1 CAO (aef)
[2] 2 (ii)
P(Not watched fb|watched cyc) = 1567
= 0.224 (0.223880597…) M1 For denominator of either 67 or 67/250 or 0.268
A1 CAO (aef) Allow 0.22 with working [2] 3 (i)
P(Neither is an ace) = 241
52 −
M1 For 48/52 oe seen
2304 144 0.8522704 169
= = = (0.8572071…) A1 CAO Allow 0.85 with working
[2] 3 (ii) Expected number = 10 × 0.852 = 8.52 B1 FT their (i) if seen
Do not allow whole number final answer even if 8.52 seen first. Allow fractional answer
[1] 4 (i) 25
15
M1 Accept 25C15 or 25!/(15!10!) or equivalent
for M1 No marks for permutations
= 3268760 A1 Exact answer required [2] 4 (ii) 13
8
×127
= 1287 × 792 M1 For product of both
correct combinations No marks for permutations
= 1019304 A1 CAO Exact answer required [2]
9

4766 Mark Scheme June 2015
Question Answer Marks Guidance 4 (iii) 1019304/3268760 M1 For their (ii) divided by
their (i)
= 0.312 (0.311832) Allow fully simplified fraction11583/37145
A1 FT Allow 0.31 with working
[2] OR 15 13 12 11 10 9 8 7 6 12 11 10 9 8 7 6
8 25 24 23 22 21 20 19 18 17 16 15 14 13 12 11
× × × × × × × × × × × × × × ×
(M1) For product of fractions with coefficient
SC1 for 8 715 13 12
8 25 25 × ×
Allow 15 15 or
8 7
= 0.312 (A1) 5 (i) 0 6
1 5 8 2 1 5 8 3 1 1 3 5 8 9 Key 1 8 represents 18 people
G1
Stem (in either order) and leaves
Do not allow leaves 21 ,25, 28 etc Ignore commas between leaves Allow stem 0, 10, 20, 30
G1
Sorted and aligned
Allow errors in leaves if sorted and aligned. Use paper test if unsure about alignment – hold a piece of paper vertically and the columns of leaves should all be separate. Alternatively place a pencil vertically over each column. If any figures protrude then deem this as non-alignment. Highlight this error
G1 Key
[3] 5 (ii) Negative B1 Allow -ve but NOT skewed to the left
Do not allow ‘negative correlation’ [1] 5 (iii) Median = 29.5 B1 CAO Mean = 26.7 (26.6666) or 262/3 or 80/3 or 26.6 B1 CAO Do not allow 27
but condone 26.6 www Mode = 31 B1 CAO The mode is not at all useful as it is just by chance that it is 31. E1 Allow any reasonable
10

4766 Mark Scheme June 2015
Question Answer Marks Guidance Mark awarded for stating not useful and -not representative of data -does not represent Central Tendency -happened by chance (or similar) -comment about not appearing significantly more (only one repetition/only twice/ etc) No mark for stating it would be useful OR NOT USEFUL because of -spread/range -sample size -negatively skewed -unaffected by outliers -isn't close to mean and median
comment
[4] 6 (i)
P(X = 6) = 1 - P(X < 6) = 1 - 35
6
= 1 - 125216
M1 For 35
6
M1 For
3516
−
=
91216
A1 NB ANSWER GIVEN
[3]
OR: 3 2 21 5 1 5 13 3
6 6 6 6 6 = + × × + × ×
M1 For second or third product term
Correct, including ×3 or probabilities seen on correct tree diagram
M1 For attempt at three terms
With no extras, but allow omission of ×3
91216
= A1 NB ANSWER GIVEN
NB Zero for 1 – (sum of probs given in part (ii))
OR: 1 + 15 + 75 M1 for 15 or 75 seen 1 15 75
216+ +
= M1
11

4766 Mark Scheme June 2015
Question Answer Marks Guidance 91
216= A1 NB ANSWER
GIVEN
6 (ii) E(X) =
1 7 19 37 61 911 2 3 4 5 6216 216 216 216 216 216
× + × + × + × + × + ×
M1
For Σrp (at least 3 terms correct)
=
1071216
= 11924
= 4.96 (exact answer 4.9583333) A1 CAO Accept fractional answers Do not allow answer of 5 unless more accurate answer given first
E(X2) = 1 7 19 37 61 91
1 4 9 16 25 36216 216 216 216 216 216
× + × + × + × + × + ×
M1* For Σr2p (at least 3 terms correct)
Use of E(X-µ)2 gets M1 for attempt at (x-µ)2 should see (-3.96)2, (-2.96)2, (-1.96)2, (-0.96)2 0.042, 1.042, (if E(X) wrong FT their E(X)) (all 6 correct for M1), then M1 for Σp(x-µ)2 (at least 3 terms correct) Division by 6 or other spurious value at end and/or rooting final answer gives max M1A1M1M1A0, or M1A0M1M1A0 if E(X) also divided by 6.
=
5593216
= 25.89
Var(X) = 25.89.. – 4.958…2
M1* dep for – their (E( X ))²
= 1.31 Accept answers in range 1.28 to 1.31 with correct working or 2261/1728 (Exact answer 1.308449…)
A1 FT their E(X) provided Var( X ) > 0
Do not FT E(X) = 5 if full marks given for E(X) Deduct at most 1 mark for over-specification of either mean or variance or both Unsupported correct answers get 5 marks (Probably from calculator)
[5] 7 (i) (A) X ~ B(20, 0.78)
12
4766 Mark Scheme June 2015
Question Answer Marks Guidance
P(Exactly 19 cured) = 19 1200.78 0.22
19
× ×
M1 For 19 10.78 0.22× Allow M2A0 for linear interpolation
from tables leading to 0.9918 – 0.9488 = 0.0430 But zero for use of tables with 0.8 leading to 0.9885 - 0.9308 = 0.0577
M1 For 19 120
19p q
× ×
With p + q = 1 Also for 20 × 0.00196
= 0.0392 (0.039197)
A1 CAO Allow 0.039 or better Condone 0.03919 but not 0.0391
[3] 7 (i) (B)
P(Exactly 20 cured) = 20 0200.78 0.22
20
× ×
= 0.0069 M1
For 0.7820 oe
Allow M2 for 0.9488 for linear interpolation from tables or M1 for 1 – 0.9918 = 0.0082 and second M1 for correct FT using answer to (i)(A) Zero for use of p = 0.8 here
P(At most 18 cured) = 1 – (0.0069 + 0.0392) M1 For P(19) + P(20) Not necessarily correct, but both attempts at binomial, including coefficient in (i) and no extra terms (such as P(X=18)) Condone use of p = 0.8
= 0.954 (0.95385) A1 CAO Allow 0.95 with working [3] 7 (i) (C) E(X) = np = 20 × 0.78 = 15.6 B1 CAO Do not allow final answer of 15 or 16
even if correct 15.6 given earlier [1] 7 (ii) Let X ~ B(20, 0.78)
Let p = probability of a patient being cured (for population) B1 For definition of p In context See below for additional notes
H0: p = 0.78 B1 For H0 H1: p > 0.78
B1 For H1
No further marks if point probabilities
13

4766 Mark Scheme June 2015
Question Answer Marks Guidance used
P(X ≥ 19) = 0.0392 + 0. 0069 B1 For NOTATION P(X ≥ 19) or P(X > 18) or 1– P(X ≤ 18) or 1– P(X < 19)
Notation P(X = 19) scores B0. If they have the correct P(X ≥ 19) then give B1 and ignore any further incorrect notation.
= 0.0461
B1* CAO For 0.0461 allow 0.0462
FT answer to (i)B for following three marks provided based on 1 – (P(19) + P(20))
0.0461 > 1% M1* dep
For comparison with 1%
Dep on sensible attempt at P(X ≥ 19)
So not significant. A1 Allow ‘accept H0’ or ‘reject H1’ Conclude that there is not enough evidence to suggest that the new drug
is more effective than the old one. E1 Must include ‘insufficient evidence’
or something similar such as ‘to suggest that’ ie an element of doubt either in the A or E mark. Must be in context to gain E1 mark. Do NOT allow ‘sufficient evidence to suggest proportion cured is 0.78’ or similar 99% method: P(X≤18) = 0.9539 B1B1* CAO 0.9539 < 99% M1* then as per scheme
[8] ALTERNATIVE METHOD FOR FINAL 5 MARKS If combination of
methods used, mark both and give higher mark.
No further marks if point probabilities used
P(X ≥ 19) = 0.0461 > 1% B1 For either probability Do not insist on correct notation as candidates have to work out two probabilities for full marks.
14

4766 Mark Scheme June 2015
Question Answer Marks Guidance P(X ≥ 20) = 0.0069 < 1%
M1 For at least one
comparison with 1% Allow comparison in form of statement ‘critical region at 1% level is …’
So critical region is {20} B1* CAO dep on the two correct probabilities
No marks if CR not justified Condone X ≥ 20, X = 20, oe but not P(X ≥ 20,) etc
(19 not in CR so) not significant. A1* dep
Dep on correct CR Allow ‘accept H0’ or ‘reject H1’
Conclude that there is not enough evidence to suggest that the new drug is more effective than the old one.
E1* dep
Ignore any work on lower critical region
7 (iii) With a 5% significance level rather than a 1% level, the null hypothesis would have been rejected. OR: ‘there would be enough evidence to suggest that the new drug is more effective than the old one.’
B1* oe FT their probability from (ii) but NO marks if point probabilities used There must be a sensible attempt to use P(X = 19) + P(X =20) or must have correct CR.
This is because 0.0461 < 5% B1* dep
oe Dep on correct answer of 0.0461 compared with 5% or 0.9539 compared with 95% or correct CR.
[2]
8 (i) Inter-quartile range = 18.1 – 17.8 = 0.3 B1
Lower limit 17.8 – (1.5 × 0.3) (= 17.35) M1 FT their IQR for M marks only No outliers at lower end. A1 dep on 17.35
Allow ‘No values below 17.35 for first A1 Allow ‘Lower limit = 17.35 so no outliers (at lower end)’ Watch for use of median giving 17.45 which gets M0A0 You must be convinced that comments about no outliers refer to lower tail only.
Upper limit 18.1 + (1.5 × 0.3) ( = 18.55) M1 (Max is 18.6) so at least one outlier at upper end. A1 dep on 18.55 Allow ‘At least one value above
18.55’ for second A1 Allow ‘any value above 18.55 is an outlier’ so at least one outlier.
15

4766 Mark Scheme June 2015
Question Answer Marks Guidance Do not allow ‘There MAY be one outlier’ oe Condone ‘one outlier’ Condone ‘there are outliers’ Watch for use of median giving 18.35 which gets M0A0 You must be convinced that comments about some outliers refer to upper tail only.
[5] 8 (ii)
P(A) = P(All 3 have orange centres) = 7 6 5 720 19 18 228
× × = M1
For 7/20×
Allow final answer of 0.031 with working ALTERNATIVE SCHEME 7C3/20C3 = 35/1140 = 7/228 = 0.0307 M1 for either term in correct position in a fraction M1 for correct fraction A1 CAO
M1 For product of correct three fractions Without extra terms
= 0.0307 (0.030702) A1 CAO Allow full marks for fully simplified fractional answers
P(B) = P(All 3 have same centres) = 7 6 5 6 5 4 4 3 2 3 2 120 19 18 20 19 18 20 19 18 20 19 180.0307 0.0175 0.0035 0.0009
× × + × × + × × + × × = = + + +
M1
For at least two correct triple products or fractions or decimals
ALTERNATIVE SCHEME 7C3/20C3 + 6C3/20C3 +4C3/20C3 +3C3/20C3 M1 for at least two correct terms
M1 For sum of all four correct
M1 for sum of all four (all correct) either as combinations or decimals
0.0526=
119
= (0.052632) A1 CAO A1 CAO
7 1 1 1228 57 285 1140
= + + +
[6] Allow 0.053 or
anything which rounds up to 0.053 with working
Please check all of the answer space for this part
8 (iii) P( | )A B =
0.0307..0.0526..
M1 For their ‘A’ divided
by their ‘B’
Allow 0.584 from 0.03070.0526
16
4766 Mark Scheme June 2015
Question Answer Marks Guidance = 0.583 (= 0.58333) A1 FT their answers to (ii)
provided answer < 1 Allow 7
12
P( | )B A = 1 B1 CAO [3] 8 (iv)
P(All have orange centres) = 20.0307 0.00094= or = 49
51984
= (0.00094260)
M1 For their 0.03072 Allow 9.4 × 10⁻⁴
condone 0.0009 or 9 × 10⁻⁴
A1 FT [2] 8 (v) P(Has to select > 2) = 1 - P(Has to select ≤ 2)
= ( )14 6 141 1 0.7 0.221 1 0.92120 20 19
− + × = − + = −
M1 For
6 1420 19
×
For any of the methods below allow SC2 for 1 – 0.079 = 0.921 or 1 – 3/38 = 35/38 o.e. as final answer
M1 For 1 – sum of both This is 1 – P(C’ + CC’) = 0.079 (=0.078947) A1 CAO [3] OR
P(Has to select > 2) = P(First 2 both cherry) = 6 520 19
×
M2 For whole product Without extra terms added
M1 if multiplied by k/18 only where 0<k<18 (seen as a triple product only)
= 0.079
338
= A1 CAO This is P(CC).
OR 1 – (P(0 cherries) + P(1 cherry))=
( )
14 13 6 14 14 6120 19 20 19 20 19
1 0.4789 0.2211 0.2211 1 0.9209
− × + × + × = − + + = −
M1 For any term M1 For 1 – sum of all three This is 1 – P(C’C’ + CC’ + C’C)
= 0.079 A1 CAO OR 6 5 14 6 5 4 14 6 5 4 3 14 6 5 4 3 2 14 6 5 4 3 2 1 14
20 19 18 20 19 18 17 20 19 18 17 16 20 19 18 17 16 15 20 19 18 17 16 15 14
× × + × × × + × × × × + × × × × × + × × × × × ×
M1 For any term This is P(CCC’ + CCCC’ + CCCCC’ + CCCCCC’ + CCCCCCC’)
17
4766 Mark Scheme June 2015
Question Answer Marks Guidance
=7 14 7 7 1
114 969 2584 19380 38760+ + + +
M1 For sum of all five terms (all correct)
= 0.079
A1 CAO
NOTE RE OVER-SPECIFICATION OF ANSWERS If answers are grossly over-specified, deduct the final answer mark (max once per question). Probabilities should also be rounded to a sensible degree of accuracy. In general final non probability answers should not be given to more than 4 significant figures. Allow probabilities given to 5 sig fig. PLEASE HIGHLIGHT ANY OVER-SPECIFICATION and also non alignment in question 5(i) Please note that there are no G or E marks in scoris, so use B instead
NB Please annotate every additional answer sheet even if full marks awarded or the page is blank – Use BP symbol Other rules for annotation: In the 10 standardisation scripts annotate everything that gets anything other than zero or full marks. After this, annotate down the right hand side in Q7(ii), up to where marks stop being scored, in the order given in the mark scheme. Annotate anywhere else where necessary to clarify how you have awarded the marks. Additional notes re Q7 part ii (first three marks) Minimum needed for B1 is p = probability of being cured. Allow p = P(patient being cured) Definition of p must include word probability (or chance or proportion or percentage or likelihood but NOT possibility, number or amount). Preferably given as a separate comment. However can be at end of H0 as long as it is a clear definition ‘p = the probability of patient being cured.’ Do NOT allow ‘p = probability of patient in the sample being cured’
18

4766 Mark Scheme June 2015
Do NOT allow ‘p = the probability of patient being cured is different’ Allow p=78%, allow only p or θ or π or ρ. However allow any single symbol if defined (including x) Allow H0 = p=0.78, Allow H0 : p=39/50 or p=78/100 Allow NH and AH in place of H0 and H1 Do not allow H0 : P(X=x) = 0.78 Do not allow H0: =0.78, =78%, P(0.78), p(x)=0.78, x=0.78 (unless x correctly defined as a probability) Do not allow H0 and H1 reversed For hypotheses given in words allow Maximum B0B1B1 Hypotheses in words must include probability (or chance or proportion or percentage) and the figure 0.78 oe Thus eg H0 : P(patient being cured) = 0.78, H1 : P(patient being cured) > 0.78 gets B0B1B1 Do not allow if H1 wrong Additional notes re Q7 part ii Smallest critical region method: Smallest critical region that 19 could fall into is {19, 20} and has size 0.0461 gets B1, This is > 1% gets M1, B1, A1, E1 as per scheme NB These marks only awarded if 19 used, not other values. Use of k method with no probabilities quoted: This gets zero marks. Use of k method with one probability quoted: Mark as per scheme Line diagram method and Bar chart method No marks unless correct probabilities shown on diagram, then mark as per scheme. Lower tailed test done with H1: p<0.78 Hyp gets max B1B1B0 If compare with 1% give SC2 for P(X ≤ 19) = 1 – 0.0069 = 0.9931 > 1% and SC1 for final conclusion, otherwise give zero. Two-tailed test done with H1: p ≠ 0.78 Provided compare with 0.5% give SC2 for P(X ≥ 19) = 0.0461 > 0.5% and SC1 for final conclusion
19

OCR (Oxford Cambridge and RSA Examinations) 1 Hills Road Cambridge CB1 2EU OCR Customer Contact Centre Education and Learning Telephone: 01223 553998 Facsimile: 01223 552627 Email: [email protected] www.ocr.org.uk For staff training purposes and as part of our quality assurance programme your call may be recorded or monitored
Oxford Cambridge and RSA Examinations is a Company Limited by Guarantee Registered in England Registered Office; 1 Hills Road, Cambridge, CB1 2EU Registered Company Number: 3484466 OCR is an exempt Charity OCR (Oxford Cambridge and RSA Examinations) Head office Telephone: 01223 552552 Facsimile: 01223 552553 © OCR 2015

Oxford Cambridge and RSA Examinations
GCE
Mathematics (MEI)
Unit 4766: Statistics 1 Advanced Subsidiary GCE
Mark Scheme for June 2016

OCR (Oxford Cambridge and RSA) is a leading UK awarding body, providing a wide range of qualifications to meet the needs of candidates of all ages and abilities. OCR qualifications include AS/A Levels, Diplomas, GCSEs, Cambridge Nationals, Cambridge Technicals, Functional Skills, Key Skills, Entry Level qualifications, NVQs and vocational qualifications in areas such as IT, business, languages, teaching/training, administration and secretarial skills. It is also responsible for developing new specifications to meet national requirements and the needs of students and teachers. OCR is a not-for-profit organisation; any surplus made is invested back into the establishment to help towards the development of qualifications and support, which keep pace with the changing needs of today’s society. This mark scheme is published as an aid to teachers and students, to indicate the requirements of the examination. It shows the basis on which marks were awarded by Examiners. It does not indicate the details of the discussions which took place at an Examiners’ meeting before marking commenced. All Examiners are instructed that alternative correct answers and unexpected approaches in candidates’ scripts must be given marks that fairly reflect the relevant knowledge and skills demonstrated. Mark schemes should be read in conjunction with the published question papers and the Report on the Examination. OCR will not enter into any discussion or correspondence in connection with this mark scheme. © OCR 2016

4766 Mark Scheme June 2016
3
Annotations and abbreviations
Annotation in scoris Meaning and BOD Benefit of doubt FT Follow through ISW Ignore subsequent working M0, M1 Method mark awarded 0, 1 A0, A1 Accuracy mark awarded 0, 1 B0, B1 Independent mark awarded 0, 1 SC Special case ^ Omission sign MR Misread Highlighting Other abbreviations in mark scheme
Meaning
E1 Mark for explaining U1 Mark for correct units G1 Mark for a correct feature on a graph M1 dep* Method mark dependent on a previous mark, indicated by * cao Correct answer only oe Or equivalent rot Rounded or truncated soi Seen or implied www Without wrong working

4766 Mark Scheme June 2016
4
Subject-specific Marking Instructions for GCE Mathematics (MEI) Statistics strand a Annotations should be used whenever appropriate during your marking.
The A, M and B annotations must be used on your standardisation scripts for responses that are not awarded either 0 or full marks. It is vital that you annotate standardisation scripts fully to show how the marks have been awarded. For subsequent marking you must make it clear how you have arrived at the mark you have awarded.
b An element of professional judgement is required in the marking of any written paper. Remember that the mark scheme is designed to assist in marking incorrect solutions. Correct solutions leading to correct answers are awarded full marks but work must not be judged on the answer alone, and answers that are given in the question, especially, must be validly obtained; key steps in the working must always be looked at and anything unfamiliar must be investigated thoroughly. Correct but unfamiliar or unexpected methods are often signalled by a correct result following an apparently incorrect method. Such work must be carefully assessed. When a candidate adopts a method which does not correspond to the mark scheme, award marks according to the spirit of the basic scheme; if you are in any doubt whatsoever (especially if several marks or candidates are involved) you should contact your Team Leader.
c The following types of marks are available. M A suitable method has been selected and applied in a manner which shows that the method is essentially understood. Method marks are not usually lost for numerical errors, algebraic slips or errors in units. However, it is not usually sufficient for a candidate just to indicate an intention of using some method or just to quote a formula; the formula or idea must be applied to the specific problem in hand, eg by substituting the relevant quantities into the formula. In some cases the nature of the errors allowed for the award of an M mark may be specified. A Accuracy mark, awarded for a correct answer or intermediate step correctly obtained. Accuracy marks cannot be given unless the associated Method mark is earned (or implied). Therefore M0 A1 cannot ever be awarded. B Mark for a correct result or statement independent of Method marks.

4766 Mark Scheme June 2016
5
E A given result is to be established or a result has to be explained. This usually requires more working or explanation than the establishment of an unknown result. Unless otherwise indicated, marks once gained cannot subsequently be lost, eg wrong working following a correct form of answer is ignored. Sometimes this is reinforced in the mark scheme by the abbreviation isw. However, this would not apply to a case where a candidate passes through the correct answer as part of a wrong argument.
d When a part of a question has two or more ‘method’ steps, the M marks are in principle independent unless the scheme specifically says otherwise; and similarly where there are several B marks allocated. (The notation ‘dep *’ is used to indicate that a particular mark is dependent on an earlier, asterisked, mark in the scheme.) Of course, in practice it may happen that when a candidate has once gone wrong in a part of a question, the work from there on is worthless so that no more marks can sensibly be given. On the other hand, when two or more steps are successfully run together by the candidate, the earlier marks are implied and full credit must be given.
e The abbreviation ft implies that the A or B mark indicated is allowed for work correctly following on from previously incorrect results. Otherwise, A and B marks are given for correct work only — differences in notation are of course permitted. A (accuracy) marks are not given for answers obtained from incorrect working. When A or B marks are awarded for work at an intermediate stage of a solution, there may be various alternatives that are equally acceptable. In such cases, exactly what is acceptable will be detailed in the mark scheme rationale. If this is not the case please consult your Team Leader. Sometimes the answer to one part of a question is used in a later part of the same question. In this case, A marks will often be ‘follow through’. In such cases you must ensure that you refer back to the answer of the previous part question even if this is not shown within the image zone. You may find it easier to mark follow through questions candidate-by-candidate rather than question-by-question.
f Wrong or missing units in an answer should not lead to the loss of a mark unless the scheme specifically indicates otherwise. Candidates are expected to give numerical answers to an appropriate degree of accuracy. 3 significant figures may often be the norm for this, but this always needs to be considered in the context of the problem in hand. For example, in quoting probabilities from Normal tables, we generally expect some evidence of interpolation and so quotation to 4 decimal places will often be appropriate. But even this does not always apply – quotations of the standard critical points for significance tests such as 1.96, 1.645, 2.576 (maybe even 2.58 – but not 2.57) will commonly suffice, especially if the calculated value of a test statistic is nowhere near any of these values. Sensible discretion must be exercised in such cases.

4766 Mark Scheme June 2016
6
Discretion must also be exercised in the case of small variations in the degree of accuracy to which an answer is given. For example, if 3 significant figures are expected (either because of an explicit instruction or because the general context of a problem demands it) but only 2 are given, loss of an accuracy ("A") mark is likely to be appropriate; but if 4 significant figures are given, this should not normally be penalised. Likewise, answers which are slightly deviant from what is expected in a very minor manner (for example a Normal probability given, after an attempt at interpolation, as 0.6418 whereas 0.6417 was expected) should not be penalised. However, answers which are grossly over- or under-specified should normally result in the loss of a mark. This includes cases such as, for example, insistence that the value of a test statistic is (say) 2.128888446667 merely because that is the value that happened to come off the candidate's calculator. Note that this applies to answers that are given as final stages of calculations; intermediate working should usually be carried out, and quoted, to a greater degree of accuracy to avoid the danger of premature approximation. NB See note below scheme The situation regarding any particular cases where the accuracy of the answer may be a marking issue should be detailed in the mark scheme rationale. If in doubt, contact your Team Leader.
g Rules for replaced work If a candidate attempts a question more than once, and indicates which attempt he/she wishes to be marked, then examiners should do as the candidate requests.
If there are two or more attempts at a question which have not been crossed out, examiners should mark what appears to be the last (complete) attempt and ignore the others. NB Follow these maths-specific instructions rather than those in the assessor handbook.
h Genuine misreading (of numbers or symbols, occasionally even of text) occurs. If this results in the object and/or difficulty of the question being considerably changed, it is likely that all the marks for that question, or section of the question, will be lost. However, misreads are often such that the object and/or difficulty remain substantially unaltered; these cases are considered below. The simple rule is that all method ("M") marks [and of course all independent ("B") marks] remain accessible but at least some accuracy ("A") marks do not. It is difficult to legislate in an overall sense beyond this global statement because misreads, even when the object and/or difficulty remains unchanged, can vary greatly in their effects. For example, a misread of 1.02 as 10.2 (perhaps as a quoted value of a sample mean) may well be catastrophic; whereas a misread of 1.6748 as 1.6746 may have so slight an effect as to be almost unnoticeable in the candidate's work. A misread should normally attract some penalty, though this would often be only 1 mark and should rarely if ever be more than 2. Commonly in sections of questions where there is a numerical answer either at the end of the section or to be obtained and commented on (eg the value of a test statistic), this answer will have an "A" mark that may actually be designated as "cao" [correct answer only]. This should be interpreted strictly – if the misread has led to failure to obtain this value, then this "A" mark must be withheld even if all method marks have been earned. It will also often be the case that such a mark is implicitly "cao" even if not explicitly designated as such.

4766 Mark Scheme June 2016
7
On the other hand, we commonly allow "fresh starts" within a question or part of question. For example, a follow-through of the candidate's value of a test statistic is generally allowed (and often explicitly stated as such within the marking scheme), so that the candidate may exhibit knowledge of how to compare it with a critical value and draw conclusions. Such "fresh starts" are not affected by any earlier misreads. A misread may be of a symbol rather than a number – for example, an algebraic symbol in a mathematical expression. Such misreads are more likely to bring about a considerable change in the object and/or difficulty of the question; but, if they do not, they should be treated as far as possible in the same way as numerical misreads, mutatis mutandis. This also applied to misreads of text, which are fairly rare but can cause major problems in fair marking. The situation regarding any particular cases that arise while you are marking for which you feel you need detailed guidance should be discussed with your Team Leader. Note that a miscopy of the candidate’s own working is not a misread but an accuracy error.

4766 Mark Scheme June 2016
8
Question Answer Marks Guidance
1 (i) Median = 29.0 B1 Condone wrong method
IQR = 31.8 – 27.8
= 4.0
M1
A1
[3]
For either quartile – allow
alternative definitions of
quartiles
Allow 27.75 and 31.9 leading to
4.15
Do not allow 27.7, 27.9, 31.6,32.0
1 (ii) Lower limit = 27.8 - 1.5 × 4.0 = 21.8
27.75, 31.9 lead to 21.525 and 38.125
27.7, 31.6 lead to 21.85 and 37.45
M1
A1
Method for either
FT sensible quartiles and
IQR
For use of mean (29.44) and SD
(2.516765…)
29.44 ± 2×2.516765 M1
Lower Limit = 24.4 A1
Upper limit = 34.5 A1
So no outliers B1 Upper limit = 31.8 + 1.5 × 4.0 = 37.8 A1 FT sensible quartiles and
IQR
So there are no outliers (at either end of the distribution) B1
[4]
Dep on at least one A1
Use of median scores 0/4
2 (i) P(Does not lose any match) = 0.83 = 0.512 =
64/125 B1
[1]
2 (ii) P(Wins all 3 or draws all 3 or loses all 3) = 0.53 + 0.3
3 + 0.2
3
M1
Including addition
= 0.16 = 4/25 A1
[2]
2 (iii) P(all three outcomes occur) = 3! × 0.5 × 0.3 × 0.2 M1* Allow M1 for k × 0.5 × 0.3 × 0.2
even if k = 1 Even if cubed
= 0.18 A1
Required probability = 1 – ‘0.18’ – 0.16
*M1
dep
Not if cubed
= 0.66 = 33
/50 A1
[4]
CAO
OR:
P(WWW’) + P(DDD’) + P(LLL’) M1 For any one product (no
need for ‘3 ×’)
Even if cubed
3 × 0.52 × 0.5 + 3 × 0.3
2 × 0.7 + 3 × 0.2
2 × 0.8 M1 For ‘3 ×’ Dep on at least 1 correct term
0.375 + 0.189 + 0.096 M1 For sum of three correct
terms (no need for ‘3 ×’)
And no incorrect terms
NB common wrong answer of 0.22
from omitting ‘3 ×’ or 0.44 from
‘2×’ scores M1M0M1A0
Not if cubed
0.66 A1 CAO
4766 Mark Scheme June 2016
9
Question Answer Marks Guidance
OR:
P(WWD) + P(WWL) + P(DDW) + P(DDL) + P(LLW) + P(LLD) M1 For any one product (no
need for ‘3 ×’)
Even if cubed
3×0.52×0.3+3×0.5
2×0.2+3×0.3
2×0.5+3×0.3
2×0.2+3×0.2
2×0.5+3×0.2
2×0.3 M1 For ‘3 ×’ Dep on at least 1 correct term
0.225 + 0.15 + 0.135 + 0.054 + 0.06 + 0.036 M1 For sum of six correct
terms (no need for ‘3 ×’)
And no incorrect terms
Not if cubed
0.66 A1 CAO
3 (i) Number of ways = 5! = 120 B1
[1]
3 (ii) Probability = 2/120 M1
For division by their 120 M1 for k/120
= 1/60 or 0.0167 or 0.01 6 A1
[2]
CAO Condone final answer of 2/120
Do not allow 0.016
3 (iii) 1 1 1 1
5 4 3 60 or 0.0167 or 0.01 6
B1
[1]
Condone 2/120 for B1 Do not allow 0.016
3 (iv) 3 2 1 1
5 4 3 10 M1
A1
For 3/5 ×
CAO
Listing options gives 12/120
Or (3! / 120) × 2
Or (3P3×
2P2)/120)
or 1/5C3 = 1/10 M1
A1
[2]
For division by 5C3 SC2 for 3! × their part (iii) or 6 ×
their part (iii)

4766 Mark Scheme June 2016
10
Question Answer Marks Guidance
4 (i) k /2 + k /6 + k /12 + k /20 + k /30 = 1
(30 + 10 + 5 + 3 + 2)k/60 = 1
50k = 60
k = 1.2
M1
A1
For correct equation
including = 1
Need one further
intermediate step after
equation
NB Answer Given
Allow substitution of k = 1.2 to
show probabilities add to 1 with
convincing working which must be
more than just
1.2/2+1.2/6+1.2/12+1.2/20+1.2/30
= 1 This latter gets M1A0
r 2 3 4 5 6
P(X = r)
0.6
= 3/5
0.2
= 1/5
0.1
= 1/10
0.06
= 3/50
0.04
= 1/25
B1
[3]
Complete correct table in
fraction or decimal form
NOT in terms of k
Must tabulate probabilities, though
may be seen in part(ii)
If fractions any denominator is ok
provided numerators are integers
4 (ii) E(X) = (2 0.6) (3 0.2) (4 0.1) (5 0.06) (6 0.04)
E(X) = 2.74 or 137
/50
M1
A1
For Σrp (at least 3 terms
correct) Provided 5
reasonable probabilities
seen.
CAO
If probs wrong but sum =
1 allow max
M1A0M1M1A1. If sum ≠
1 allow max
M1A0M1M1A0 (provided
all probabilities ≥ 0 and
<1)
Use of E(X-µ)2 gets M1 for
attempt at (x-µ)2 should see (-
0.74)2, 0.26
2, 1.26
2, 2.26
2, 3.26
2,
(if E(X) wrong FT their E(X)) (all
5 correct for M1), then M1 for
Σp(x-µ)2 (at least 3 terms correct
with their probabilities)
E(X2) = (4 0.6) (9 0.2) (16 0.1) (25 0.06) (36 0.04)
= 8.74 or 437
/50
M1*
For Σr2p (at least 3 terms
correct)
Division by 5 or other spurious
value at end and/or rooting final
answer gives max
M1A1M1M1A0, or
M1A0M1M1A0 if E(X) also
divided by 5.
Var(X) = 8.74 – 2.742 = 1.23 or 1.232 or
3081/2500
M1*
dep
A1
[5]
for – their E( X )²
FT their E(X) provided
Var(X ) > 0
Unsupported correct answers get 5
marks (Probably from calculator)
Condone 1.2324 despite the fact
that this is over-specified since it is
the exact answer

4766 Mark Scheme June 2016
11
0.286
0.21
0.06
R
S
0.66 0.07
Question Answer Marks Guidance
5 (i) P(R ∩ S) = P(R) + P(S) – P(R ∪ S)
= 0.28 + 0.87 – 0.94
M1 For correct use of formula Or 0.28 – x + 0.87 – x + x = 0.94
= 0.21 A1
[2]
5 (ii)
G1
G1
G1
[3]
For two labelled
intersecting circles
For at least 2 correct
probabilities.
FT their P(R ∩ S)
For remaining
probabilities. FT their P(R
∩ S)
Allow labels such as P(R) and P(S)
Allow other sensible shapes in
place of circles
Allow their P(R ∩ S) rounded to
2dp
For both G1 marks FT their 0.21
provided < 0.28
For FT if P(R ∩ S) = x then others
are 0.28 – x, 0.87 – x , x – 0.15
0.2436 leads to 0.0364, 0.6264,
0.0936
5 (iii)
( ) 0.21 21( | ) 0.241
( ) 0.87 87
P R SP R S
P S
Exact answer 0.241379…
M1
A1
for fraction
CAO
FT their part (i) (for M1
only) but M0 if their
answer to part (i) is P(R) ×
P(S)
Allow 7 21
or 29 87
as final answer
Allow 0.24 with working
Condone ‘if’ or ‘when’ for ‘given
that’ but not the words ‘and’ or
‘because’ or ‘due to’ for E1.
E1 (independent of M1): the
order/structure must be correct i.e.
no reverse statement
Allow ‘The probability that on a
randomly selected day when there
is at least 1 hour of sun there is at
least 1 mm of rain.’ oe
This is the probability that (on a randomly selected day) there is at
least 1 mm of rain, given that there is at least 1 hour of sun.
E1
[3]
Need more than just
probability of rain given
sun
Must include ‘probability’
or ‘chance’ oe
Do not allow just P(at least
1 mm of rain, given that
there is at least 1 hour of
sun)
4766 Mark Scheme June 2016
12
Question Answer Marks Guidance
6 (i) Mean =
(25 147) (45 109) (55 182) (70 317) (140 175)
930
= (£)70.19 or
(£)70.2
M1
A1
For midpoints (at least 3
correct)
(allow 25.005, 45.005 etc
leading to answer 70.20)
CAO
(exact answer 70.19355…)
Correct answers obtained
from use of calculator
statistical functions gain
full marks
Condone answer of
(£)70.20
M0A0M0A0 unless using
midpoints
Answer must NOT be left as
improper fraction as this is an
estimate
Accept correct answers for mean
and sd from calculator even if eg
wrong Sxx given
x2f =
2 2 2 2 2(25 147) (45 109) (55 182) (70 317) (140 175)
= 91875 + 220725 + 550550 + 1553300 + 3430000
= 5846450
2652805846450 1264215.161
930xxS or 5846450 – 930×70.19
2
12642151360.83 36.89
929s or (£)36.9
Allow any answer between 36.87 and 36.90 without checking working
M1
A1
[4]
For attempt at xxS
Should include sum of at
least 3 correct multiples fx2
– Ʃx2/n
Do not FT their incorrect
mean for A1
(exact answer 36.88949…)
Condone answer of
(£)36.90
If both mean and sd over-
specified, just deduct one
mark
For use of midpoints 25.5, 45.5,
55.5, 70.5, 140.5 allow SC1 for
£70.69 and SC1 for 36.89
If using (x – x )2 method, B2 if
36.9 or better, otherwise B0
Allow use of 70.2 in calculation of
Sxx = 1263372.8 leading to
36.87719…
Condone RMSD of 36.87
(36.86985…) since n is so large
6 (ii) 100/120 × 175 = 145.83
145.83/930 = 0.1568
So 15.7%
M1*
*M1dep
A1
[3]
For 175/120 Or 20/120 × 175 = 29.166 oe
(175 – 29.166)/930
Accept 16% with working

4766 Mark Scheme June 2016
13
Question Answer Marks Guidance
6 (iii)
Price Frequency
Group
width
Frequency
density
10 ≤ x ≤ 40 147 30 4.90
40 < x ≤ 50 109 10 10.90
50 < x ≤ 60 182 10 18.20
60 < x ≤ 80 317 20 15.85
80 < x ≤ 200 175 120 1.46
M1
A1
For fds - at least 3 correct
Accept any suitable unit
for fd such as eg freq per
cm.
Allow 15.9 and 1.5 and
condone 1.45
M1 can be also be gained from
freq per 10 – 4.9, 10.9, 18.2,
15.35, 0.146 (at least 3 correct) or
similar.
If fd not explicitly given, M1 A1
can be gained from all heights
correct (within ≤ one square) on
histogram (and M1A0 if at least 3
correct)
NB If not using fd’s only mark available is B1 for width of bars
Heights must be within ≤ 1 square of overlay (only for scales 2cm = 4
units (blue) or 5 units (red)) – otherwise check heights.
Note that you must make sure that the overlay is aligned correctly
with the vertical axis.
B1
B1
B1
[5]
linear scales on both axes
and label on both axes
(Allow horizontal axis
labelled x)
Vertical scale starting
from zero (not broken -
but can get final mark for
heights if broken)
width of bars (within half
a square)
(NO GAPS ALLOWED)
height of bars
Linear scale and label on vertical
axis IN RELATION to first M1
mark ie fd or frequency density or
if relevant freq/10, etc (NOT eg
fd/10).
However allow scale given as
fd×10, or similar
Accept f/w or f/cw (freq/width or
freq/class width)
Can also be gained from an
accurate key
G0 if correct label but not fd’s.
Must have linear scale. Condone
starting at 10 rather than 0.
For inequality labels see additional
notes below.
Height of bars – must be linear
vertical scale.
FT of heights dep on at least 3
heights correct and all must agree
with their fds
If fds not given and 3 or 4 heights
correct then max M1A0G1G1G0

4766 Mark Scheme June 2016
14
Question Answer Marks Guidance
6 (iv) Positive skewness B1
[1]
Allow +ve
6 (v) Area for men from 100 to 200 = 100 × 2 = 200 M1 Or 100
/120 × 240
200/990 = 0.202
So 20.2%
A1
20% with working
Cannot be certain as both figures are estimates E1
[3]
Independent Allow comments such as ‘grouped
data so cannot be certain’
or ‘Values are not exact so cannot
be certain’ oe
or ‘midpoints have been used so
cannot be certain’ oe
6 (vi) Men’s running shoes have a lower average price than women’s (as
their mean is only £68.83 compared to £70.19).
Or equivalent for women
Men’s running shoes have a more variation in price than women’s (as
their sd is £42.93 compared to £36.89).
Or equivalent for women
E1
E1
[2]
FT their mean
Do NOT condone lower
central tendency or lower
mean
FT their SD
Allow ‘on the whole’ or similar in
place of ‘average’.
Allow ‘more spread’ or similar but
not ‘higher range’ or ‘higher
variance’ or ‘less distributed’
Condone less consistent
7 (i) (A) X ~ B(16, 0.1)
P(X = 3) = = 0.1423
M1
M1
A1
For 3 130.1 0.9
For 3 13
16
3p q
CAO
With p + q = 1
Also for 560 × 0.000254..
Allow 0.14 or better
Or: From tables
P(X ≤ 3) – P(X ≤ 2) = 0.9316 – 0.7892 = 0.1424
M2
A1
[3]
For 0.9316 – 0.7892
CAO
7 (i) (B)
P(X ≥ 3) = 1 – P(X ≤ 2) = 1 – 0.7892 = 0.2108
M1
A1
[2]
For 0.7892
CAO
If calculating P(X = 0)+ P(X = 1)+
P(X = 2) allow M1 for 0.79 or
better and A1 for 0.21 or better.
4766 Mark Scheme June 2016
15
Question Answer Marks Guidance
7 (i) (C) Expected number = 16 × 0.1 = 1.6 B1
[1]
Do not allow final answer of 1 or 2
even if correct 1.6 given earlier
7 (ii) Let p = probability of a randomly chosen person using 1234 as their
PIN (in the population)
H0: p = 0.1
H1: p < 0.1
B1
B1
B1
For definition of p (in
context)
For H0
For H1
Do NOT allow number in place of
probability.
See below for additional notes
The alternative hypothesis has this form as the advertising campaign
aims to reduce the proportion of the population who use 1234 as their
PIN.
B1
[4]
Dep on < 0.1 used in H1
Do Not allow just
‘proportion will be lower’
or similar.
For use of 0.9 as P(do not use
1234), contact team leader.
E0 for simply stating H1 in words
Condone number instead of
proportion.
7 (iii) (A) For n = 20 , P(X 0) = 0.1216
0.1216 > 0.10
M1*
*M1dep
For sight of 0.1216
For > 0.10 or > 10% Do
NOT FT wrong H1
Condone P(X = 0) in place of P(X
≤ 0)
Need to see a comparison with 0.1
or 10% explicitly, not just
mentioning significance level.
So no point in carrying out the test as H0 could not be rejected (even if
nobody in the sample uses 1234 as their PIN). oe
A1
[3]
or state ‘There is no
critical region’ oe
For A1 need P(X 0) or
P(X = 0) somewhere oe
Allow SC2 for clearly indicating
use of B(20, 0.1) but with no
mention of 0.1216 with convincing
reasoning and final answer correct
Allow CR is empty but NOT CR is
zero
(B) Lowest value of k is 13 B1
[1]
Or 13%
7 (iv) P(X ≤ 2) = 0.0530 B1 For use of P(X ≤ 2) only No marks unless H1 correct
If B0 then no further marks
Allow ‘accept H0’ or ‘reject H1’
Must include ‘insufficient
evidence to suggest that’ or
something similar i.e. an element
of doubt either in the A or E mark.
0.0530 > 0.05 M1 For comparison of 0.0530
with 5%
So not significant. Do not reject H0
Conclude that there is not enough evidence to support the suggestion
that the advertising campaign has been successful.
Reminder: When you mark this question part, if you ‘fit to height’
you can check the last page for working or mark it BP if there none
A1*
*E1
dep
[4]
Also allow P(X ≤ 2) >
0.05, (P(X ≤ 1) < 0.05) so
CR is {0, 1} for first two
marks then A1E1 as usual
Condone ‘number of
people’ in conclusion

4766 Mark Scheme June 2016
16
NOTE RE OVER-SPECIFICATION OF ANSWERS
If answers are grossly over-specified, deduct the final answer mark. Note in Q6i only deduct 1 mark even if both mean and sd over-specified. Probabilities should
also be rounded to a sensible degree of accuracy. In general final non probability answers should not be given to more than 4 significant figures. Allow probabilities
given to 5 sig fig.
ANNOTATION RULES
See note 12 above and particularly 12a. Remember to put full annotation on all practice and standardisation scripts unless the candidate has scored full marks or
zero. In addition for all marking in Q6(iii), if the candidate has not scored full marks then show which B marks have been awarded in the right hand margin, in the
same order as they are given in the mark scheme. You should indicate any errors made. Additional notes re Q6 part iii G mark
10 ≤ x < 40 ≤ x < 50 ≤ x < 60 SCORES G1
10 ≤ x < 40 40 ≤ x <50 50 ≤ x < 60 SCORES G0
BUT
30 10 ≤ x < 40 40 40≤ x<50 50 50≤x<60 60 SCORES G1

4766 Mark Scheme June 2016
17
Additional notes re Q7 part ii Minimum needed for B1 is p = probability of using 1234.
Allow p = P(using 1234)
Definition of p must include word probability (or chance or proportion or percentage or likelihood but NOT possibility, number or amount).
Preferably given as a separate comment. However can be at end of H0 as long as it is a clear definition ‘p = the probability of using 1234.’
Do NOT allow ‘p = the probability of using 1234 is different’
Allow p=10%, allow only p or θ or π or ρ. However allow any single symbol if defined (including x)
Allow H0 = p=0.1, Allow H0 : p=1/10
Allow NH and AH in place of H0 and H1
Do not allow H0 : P(X=x) = 0.1
Do not allow H0: =0.1, =10%, P(0.1), p(x)=0.1, x=0.1 (unless x correctly defined as a probability)
Do not allow H0 and H1 reversed
For hypotheses given in words allow Maximum B0B1B1
Hypotheses in words must include probability (or chance or proportion or percentage) and the figure 0.1 oe
Thus eg H0 : P(using 1234) = 0.1, H1 : P(using 1234) < 0.1 gets B0B1B1

Oxford Cambridge and RSA Examinations is a Company Limited by Guarantee Registered in England Registered Office; 1 Hills Road, Cambridge, CB1 2EU Registered Company Number: 3484466 OCR is an exempt Charity OCR (Oxford Cambridge and RSA Examinations) Head office Telephone: 01223 552552 Facsimile: 01223 552553 © OCR 2016
OCR (Oxford Cambridge and RSA Examinations) 1 Hills Road Cambridge CB1 2EU OCR Customer Contact Centre Education and Learning Telephone: 01223 553998 Facsimile: 01223 552627 Email: [email protected] www.ocr.org.uk For staff training purposes and as part of our quality assurance programme your call may be recorded or monitored


