
Investigating the relationship between
subjective and objective exertion during a
cardiovascular fitness test in minority obese youth
Presented by: Marissa MenendezMajor Professor: Dr. Kathryn
Brogan

IntroductionAdolescent (12-19 yrs.) obesity rates have
5% -18% in last 30 years. (Ogden et. al., 2012)
Obesity rates as high as 21% in non-Hispanic black adolescents. (Ogden et al., 2012)
Physical activity (PA): engaging in bodily movements that increase heart rate & breathing difficulty (aerobic).
PA Guidelines for adolescents (12-17 yrs.) : Aerobic – moderate (M) (50-70% HR Max) to vigorous (V) (70-85% HR Max) intensity ≥ 60 minutes daily, including VPA at least 3 days/week. (Physical Activity Guidelines, 2008)

What % of adolescents (12-15 yrs.) engaged in moderate-to-vigorous PA
for ≥ 60 minutes/day?
SOURCE (16): CDC/NCHS, National Health and Nutrition Examination Survey and National Youth Fitness Survey, 2012.

Introduction
PA levels of ≥60 minutes are lowest in adolescent females compared to males and in African Americans compared to Caucasians. (Kann et al., 2014)
Physical inactivity during adolescence is a strong predictor of sedentary adulthood. (Alfano et al., 2002)
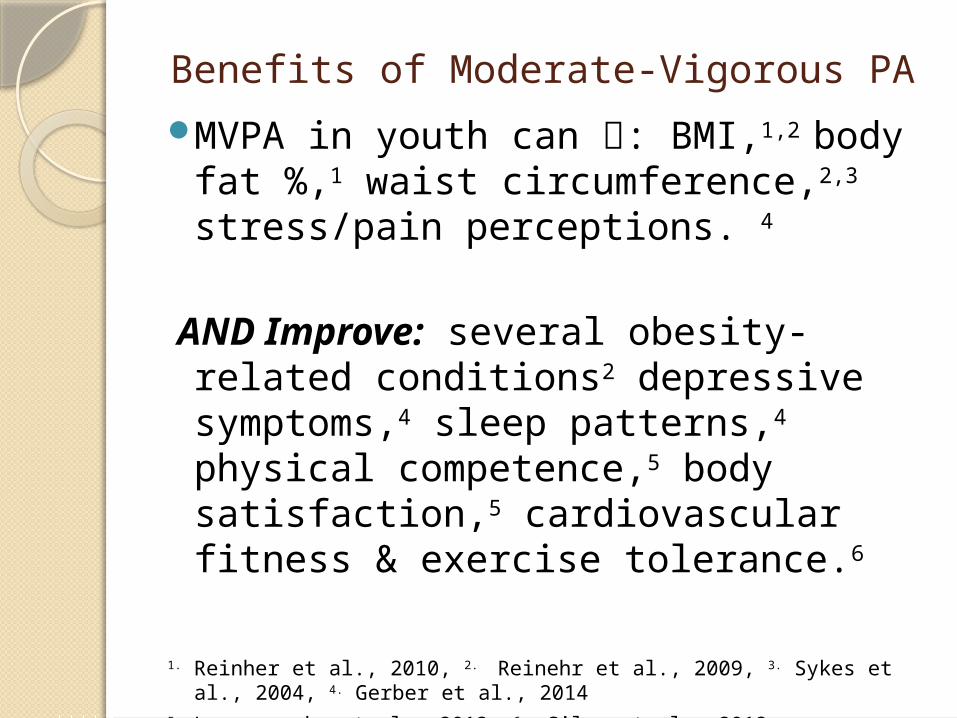
Benefits of Moderate-Vigorous PAMVPA in youth can : BMI,1,2 body fat
%,1 waist circumference,2,3 stress/pain perceptions. 4
AND Improve: several obesity-related conditions2 depressive symptoms,4 sleep patterns,4 physical competence,5 body satisfaction,5 cardiovascular fitness & exercise tolerance.6
1. Reinher et al., 2010, 2. Reinehr et al., 2009, 3. Sykes et al., 2004, 4. Gerber et al., 2014
5. Luszczynska et al., 2012, 6. Silva et al., 2012

Does engagement in moderate-to-vigorous PA among 12-15 yr. old youth differ by weight status?
SOURCE (16): CDC/NCHS, National Health and Nutrition Examination Survey and National Youth Fitness Survey, 2012.

Subjective vs. Objective Exertion
Rate of perceived exertion (RPE): subjective measure of exercise intensity that can safely regulate exercise intensities in non-clinical settings (Borg’s 6-20 RPE scale). (Buckley et al., 2004)
Objective exertion: actual heart rate (HR) values can be use to regulate exercise intensities via HR monitor. (Buckley et al., 2004; Conley et al., 2011; McManus et al., 2008)

Literature ReviewChildren and adolescents vary widely in their
abilities to rate their perceived exertions during physical activity, even with HR biofeedback. (Conley et al., 2011; McManus et al., 2008)
Youth commonly over-or-underestimate their actual (objective) exertion during MVPA.
(Pianosi et al., 2014)
Children and adolescents lack the prior experiences and PA perceptions to accurately gauge the varying amounts of perceived exertion at different intensities of exercise. (Huebner et al, 2014)

SignificanceThere is limited research on
subjective (RPE) and objective (HR) exertion levels in African American obese youth.
Adolescents who are able to successfully associate their subjective and objective exertion may be better able to properly regulate their exercise intensities during PA & effectively achieve PA recommendations.

Aim 1

Aim 2

Aim 3

Methods
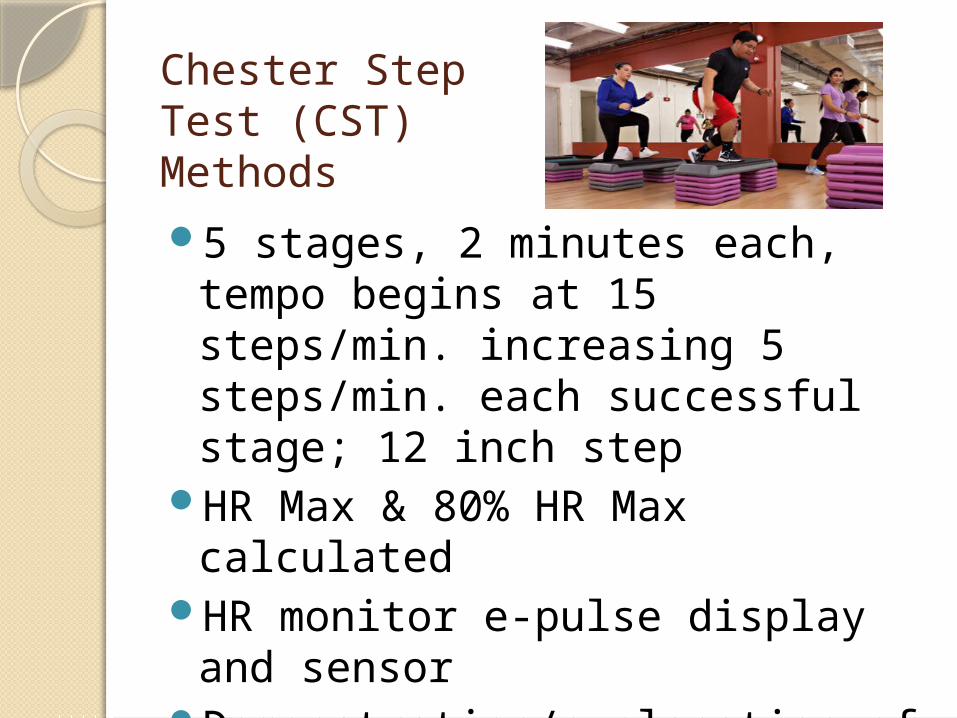
Chester Step Test (CST) Methods
5 stages, 2 minutes each, tempo begins at 15 steps/min. increasing 5 steps/min. each successful stage; 12 inch step
HR Max & 80% HR Max calculated
HR monitor e-pulse display and sensor
Demonstration/explanation of CST & stepping technique to metronome tempo


Chester step test: Instructions & Flow
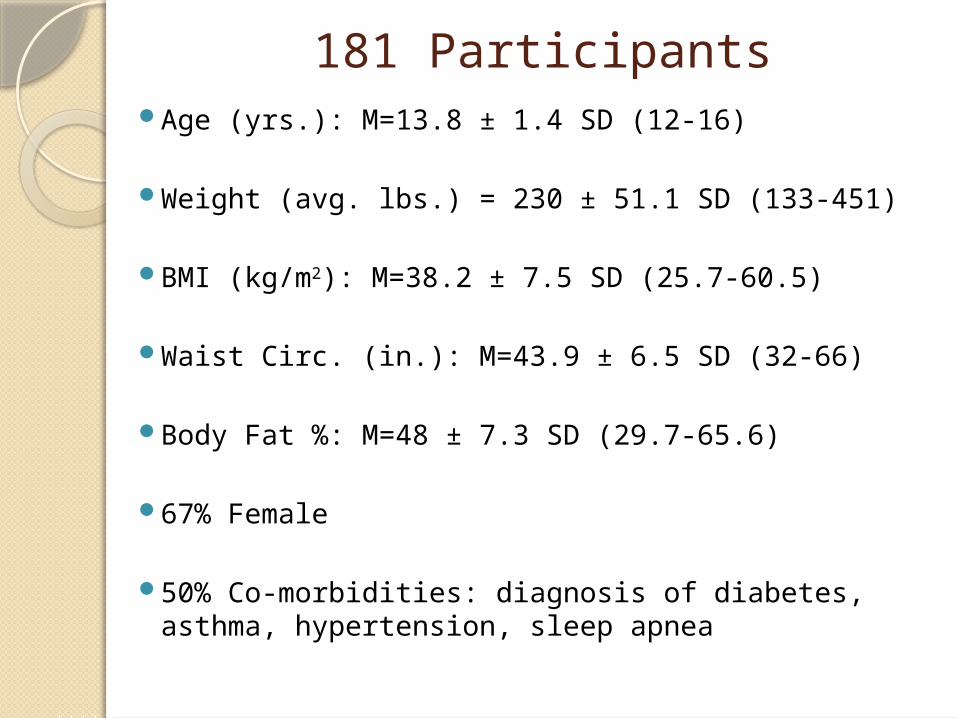
181 ParticipantsAge (yrs.): M=13.8 ± 1.4 SD (12-16)
Weight (avg. lbs.) = 230 ± 51.1 SD (133-451)
BMI (kg/m2): M=38.2 ± 7.5 SD (25.7-60.5)
Waist Circ. (in.): M=43.9 ± 6.5 SD (32-66)
Body Fat %: M=48 ± 7.3 SD (29.7-65.6)
67% Female
50% Co-morbidities: diagnosis of diabetes, asthma, hypertension, sleep apnea
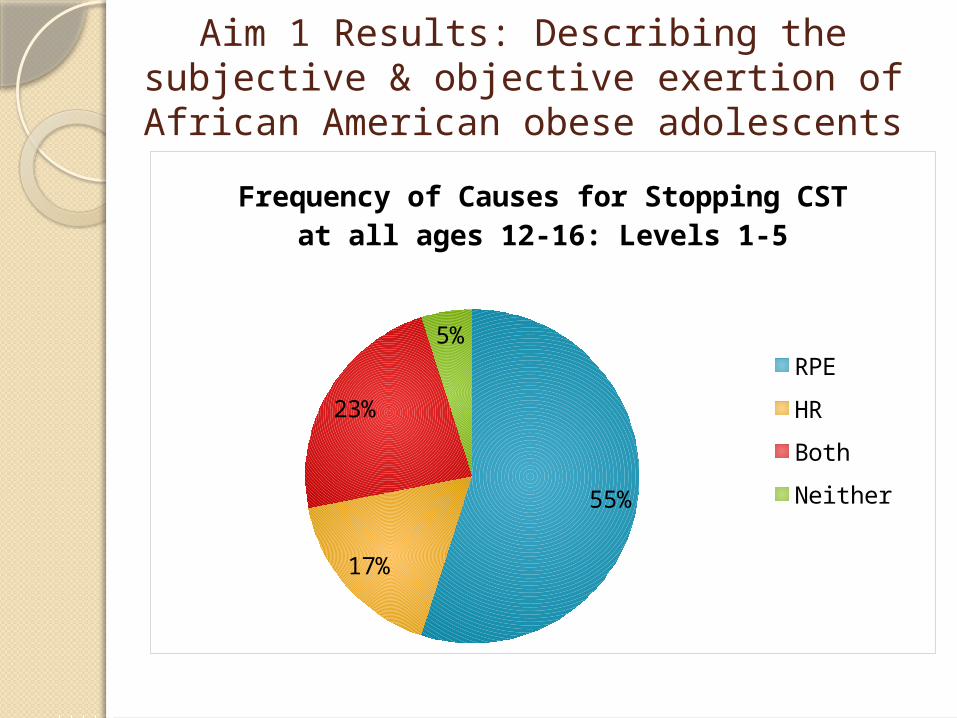
Aim 1 Results: Describing the subjective & objective exertion of African American
obese adolescents
55%
17%
23%
5%
Frequency of Causes for Stopping CST at all ages 12-16: Levels 1-5
RPE
HR
Both
Neither

Frequency of Causes for Stopping CST Levels 1-5: Ages
12-16
66%10%
22%
2%
Age 12
RPEHRBothNeither 56%
18%
20%
6%
Age 13
47%
31%
19%
3%
Age 14
44%
13%
38%
5%
Age 15
62%14%
14%
10%
Age 16
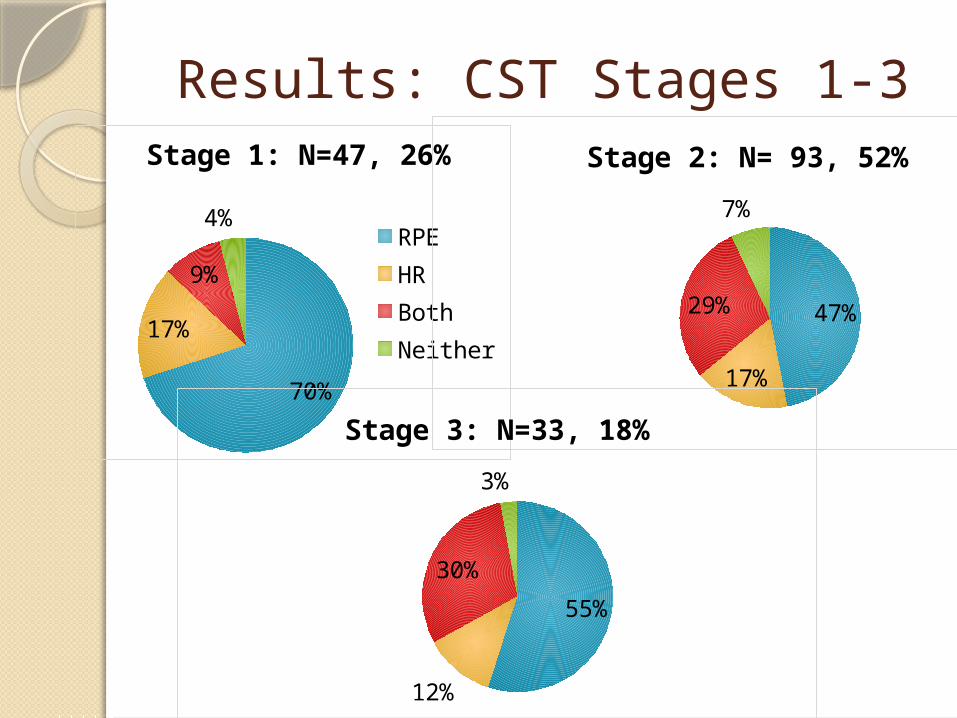
Results: CST Stages 1-3
70%
17%
9% 4%
Stage 1: N=47, 26%
RPEHRBothNeither
47%
17%
29%
7%
Stage 2: N= 93, 52%
55%
12%
30%
3%
Stage 3: N=33, 18%

Aim 2 Results: Relationship between subjective and objective exertion
Regression Model Summary
R R2 Adjusted R St. Error of Estimate
.134a .018 .012 2.038
Coefficientsb
Unstandardized Coef.
Standardized Coef.
B St. Error Beta t Sig.
Constant
17.177 1.400 12.270 0.000
HR at completed step level
-0.016 0.009 -0.134 -1.790 0.075
a. Predictors: (Constant), HR Heart rate at completed step level
b. Dependent Variable: RPE Rate of perceived exertion at completed step level

Aim 3 Results: Which variables affect the relationship between subjective &
objective exertion?Regression Model Summary
Variables
R R2Adjusted
R2
Std. Error of
the Estimat
e
St. Coef. Beta
t Sig.
Age .135 .018 .001 2.049 -.019 -.246 .806
Gender .144 .021 .004 2.047 -.057 -.549 .584
BMI .178 .032 .015 2.035 .107 1.359 .176
Waist Circ.
.181 .033 .016 2.034 .087 1.124 .263
Co-morb.
.150 .023 .006 2.045 .030 .284 .777
Body fat %
.234 .055 .038 2.020 .170 2.255 .025Dependent Variable: RPE at completed step levelPredictor Variables: HR at completed step level X moderator variables
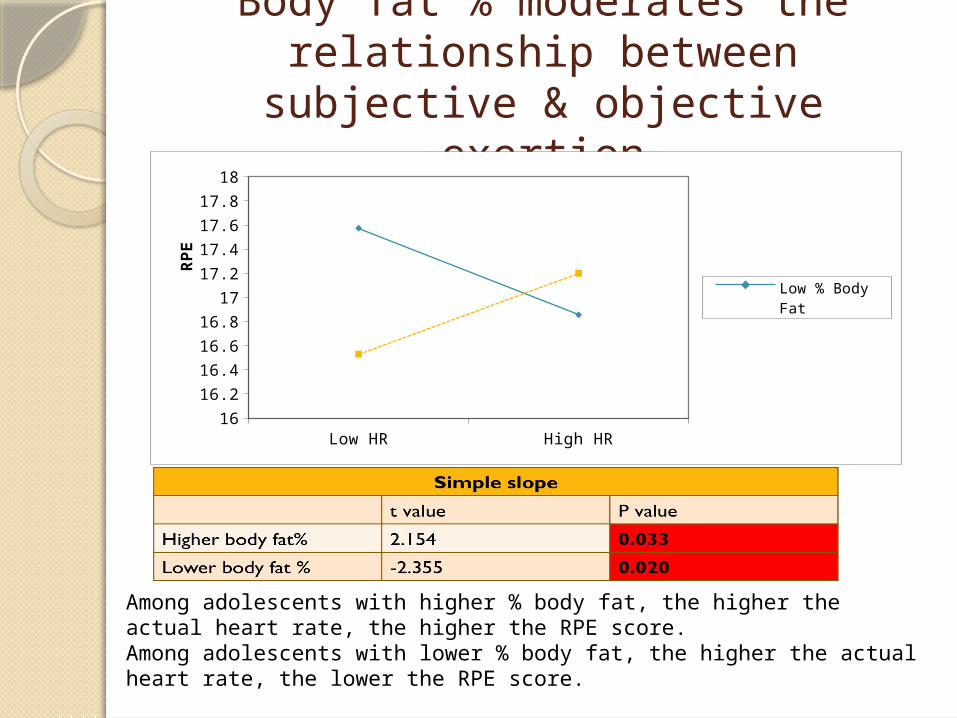
Body fat % moderates the relationship between subjective &
objective exertion
Low HR High HR16
16.2
16.4
16.6
16.8
17
17.2
17.4
17.6
17.8
18
Low % Body FatHigh % Body Fat
RPE
Among adolescents with higher % body fat, the higher the actual heart rate, the higher the RPE score.Among adolescents with lower % body fat, the higher the actual heart rate, the lower the RPE score.

Summary

DiscussionBorg’s 6-20 scale of RPE extensively used
in CST, although OMNI & Dalhousie pictorial scales may be more appropriate for youth. (Pianosi, 2014; Barkley, 2011; Elliott, 2008; Alves de Camargo, 2011)
With/without HR biofeedback youth over-and-under estimate time spent in MVPA, but higher % overestimate. (Conley et al., 2011)
Limited evidence on how body fat % moderates the relationship between HR and RPE – fitness levels could be involved

Limitations

ConclusionAdolescents need to be well-trained to
identify their exercise intensities to appropriately self-regulate their PA to achieve recommended guidelines of ≥ 60 minutes of MVPA daily, including VPA ≥ 3 days/wk. (Physical Activity Guidelines, 2008).
Youth could greatly benefit from dietitians assisting them in accurately identifying MVPA and closely matching subjective & objective exertion, to successfully overcome this barrier.

Implications for Dietetic Practice: AND
Weight management interventions combining PA, dietary intake/nutrition education, behavior counseling & caregiver engagement have achieved successful outcomes in overweight and obese adolescents (Reinehr et al., 2010; Covelli, 2008; Hoelscher et al., 2013)
Nutrition professionals: role/responsibility to utilize nutrition & PA recommendations to promote and maintain optimum health throughout the lifecycle. (Fitzgerald and Slawson, 2013)
RDs need adequate training/skills for challenges of child-obesity epidemic: assessment of body size, diet & PA; knowledge of weight management strategies and PA recommendations. (Hoelscher et al. 2013)
Future Research
Culturally targeted long-term interventions needed for different types and intensities of exercise in African American obese adolescents. (Zoorob et al., 2013)
Research investigating the effects of age, gender, BMI, waist circumference, co-morbidities & body fat % on RPE & HR during different physical activities.
Investigating the PA knowledge/skills of nutrition professionals and implementation strategies of the youth physical activity recommendations (utilization of the AND PA toolkit for RDs).

Thank You!Dr. BroganDr. TiuraFamilyA Teacher Affects Eternity. She
can never tell where her influence stops.
Author Unknown
Exercise is King, Nutrition is Queen. Put them together and you have a Kingdom! Jack Lalane

References 1. Ogden CL, Carroll MD, Kit BK, Flegal KM. Prevalence of
obesity and trends in body mass index among US children and adolescents. JAMA. 2012;307:483-490.
2. Kann L, Kinchen S, Shanklin SL et al. Youth risk behavior surveillance — United States, 2013. MMWR. 2014;63(4):35-36.
3. Alfano, CM, Klesges, RC, Murray, DM, Beech, BM, & McClanahan, BS. History of sport participation in relation to obesity and related health behaviors in women. Preventive Medicine. 2002;34(1):82-89.
4. Reinehr T, Kleber M, Toschke AM. Lifestyle intervention in obese children is associated with a decrease of the metabolic syndrome prevalence. Atherosclerosis. 2009;207(1):174-180.
5. Reinehr T, Schaefer A, Winkel K, Finne E, Toschke AM, Kolip P. An effective lifestyle intervention in overweight children: Findings from a randomized controlled trial on “Obeldicks light”. Clinical Nutrition. 2010;29(3):331-336.
6. Gerber M, Brand S, Herrmann C, Colledge F, Holsboer-Trachsler E, Pühse U. Increased objectively assessed vigorous-intensity exercise is associated with reduced stress, increased mental health and good objective and subjective sleep in young adults. Physiol Behav. 2014;135(0):17-24.

References 7. Luszczynska A, Abraham C. Reciprocal relationships
between three aspects of physical self-concept, vigorous physical activity, and lung function: A longitudinal study among late adolescents. Psychol Sport Exerc. 2012;13(5):640-648.
8. Silva DAS, Petroski EL, Pelegrini A, Guglielmo LGA. Effect of physical exercise on the cardiorespiratory response in overweight adolescents. Turkish Journal of Endocrinology and Metabolism. 2012;16:14-18.
9. Healthy People 2020 Topics and Objectives: Physical Activity. U.S. Department of Health and Human Services. http://www.healthypeople.gov/2020/topicsobjectives2020/overview.aspx?topicid=33. Updated June 9, 2014. Accessed June 9, 2014.
10. Physical Activity Guidelines Advisory Committee: Physical activity guidelines advisory committee report. U.S. Department of Health and Human Services. http://www.health.gov/PAGuidelines/Report/pdf/CommitteeReport.pdf. Published 2008. Accessed June 9, 2014.
11. Morris M, Lamb K, Cotterrell D, Buckley J. Predicting maximal oxygen uptake via a perceptually regulated exercise test (PRET). Journal of Exercise Science & Fitness. 2009;7(2):122-128.
References 12. Pianosi PT, Huebner M, Zhang Z, McGrath PJ. Dalhousie
dyspnea and perceived exertion scales: Psychophysical properties in children and adolescents. Respiratory Physiology & Neurobiology. 2014;199(0):34-40.
13. Buckley JP, Sim J, Eston RG, Hession R, Fox R. Reliability and validity of measures taken during the chester step test to predict aerobic power and to prescribe aerobic exercise. Br J Sports Med. 2004;38:197-205.
14. Sykes K, Roberts A. The chester step test—a simple yet effective tool for the prediction of aerobic capacity. Physiotherapy. 2004;90(4):183-188.
15. Conley MM, Gastin PB, Brown H, Shaw C. Heart rate biofeedback fails to enhance children's ability to identify time spent in moderate to vigorous physical activity. Journal of Science and Medicine in Sport. 2011;14(2):153-158.
16. Fakhouri THI, Hughes JP, Burt VL, et al. Physical activity in U.S. youth aged 12–15 years, 2012. NCHS data brief, no 141. Hyattsville, MD: National Center for Health Statistics. 2014. http://www.cdc.gov/nchs/data/databriefs/db141.htm. Accessed September 6, 2014.

References17.
Cook S, Auinger P, Huang TTK. Growth Curves for Cardio-Metabolic Risk Factors in Children. J Pediatr. 2009;155(3): S6.e15–S6.e26.
18. Huebner M, Zhang Z, Therneau T, McGrath P, Pianosi P. Modeling trajectories of perceived leg exertion during maximal cycle ergometer exercise in children and adolescents. BMC Medical Research Methodology. 2014;14(4):1-9.
19. Fitzgerald N., Slawson D. Practice paper of the Academy of Nutrition and Dietetics: The Role of Nutrition is Health Promotion and Chronic Disease Prevention. J Acad Nutr Diet. 2013:1-13.
20. Barkley JE, Roemmich JN. Validity of a pediatric RPE scale when different exercise intensities are completed on separate days. Journal of Exercise Science & Fitness. 2011;9(1): 52-57
21. Elliott D, Abt G, Barry T. The effect of an active arm action on heart rate and predicted VO2max during the Chester step test. Journal of Science and Medicine in Sport. 2008;11(2):112-115.
22. Alves de Camargo A, Justino T, Silva de Andrade CH, Malaguti C, Dal Corso S. Chester step test in patients with COPD: Reliability and correlation with pulmonary function test results. Respiratory Care. 2011;56(7):995-1001.
23. Hoelscher DM, Kirk S, Ritchie L, Cunningham-Sabo L. J Acad Nutr Diet. Position of the Academy of Nutrition and Dietetics: Interventions for the Prevention and Treatment of Pediatric Overweight and Obesity. 2013;113(10):1375-1394.
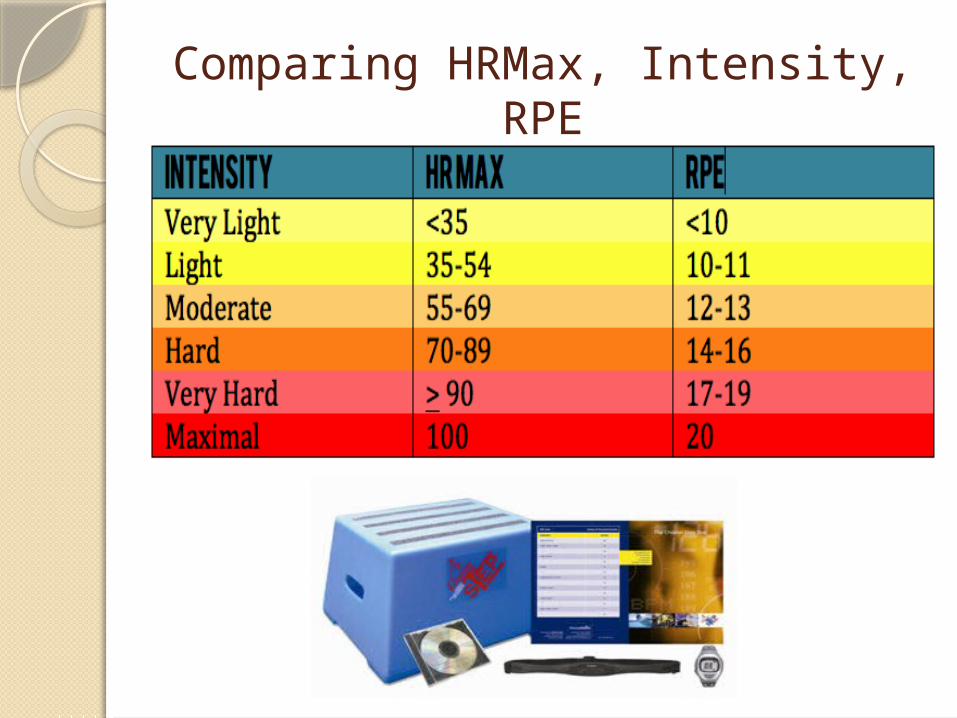
Comparing HRMax, Intensity, RPE

Descriptive Statistics: CSTN Minimum Maximum Mean
Std. Deviation
Aerobic Capacity (mlsO2/kg/min)
178 17 67 31.70 9.975
Fitness Rating 178 1 5 4.01 1.107
Step level completed 178 1 5 1.98 .770
HR at completed step level (bpm)
178 78 197 157.99 17.393
RPE at completed step level
178 8 20 14.69 2.051
Chester step test validity
166 1 2 1.01 .078
Fitness Rating: 1 = Excellent, 2 = Above Average, 3 = Average, 4 = Below Average, 5 = PoorBorg’s RPE Scale: 6 = Very, Very Light; 20 = ExhaustionChester step test validity: 1 = Valid, no reason for concern; 2 = Uncertain, some reason for concern

80% Age-predicted HRMax

Results: CST Stages 1-5
70%
17%
9% 4%
Stage 1: N=47, 26%
RPEHRBothNeither
47%
17%
29%
7%
Stage 2: N= 93, 52%
55%
12%
30%
3%
Stage 3: N=33, 18%
50%25%
25%
Stage 4: N=4, 2%
100%
Stage 5: N=1, 1%

Aim 2 Results: Relationship between subjective and objective exertion
ANOVAb
Sum of Squares
df Mean Square
F Sig.
Regression
13.313 1 13.313 3.205 0.075a
Residual
731.069
176 4.154
Total 744.382
177
a. Predictors: (Constant), HR Heart rate at completed step levelb. Dependent Variable: RPE Rate of perceived exertion at
completed step level
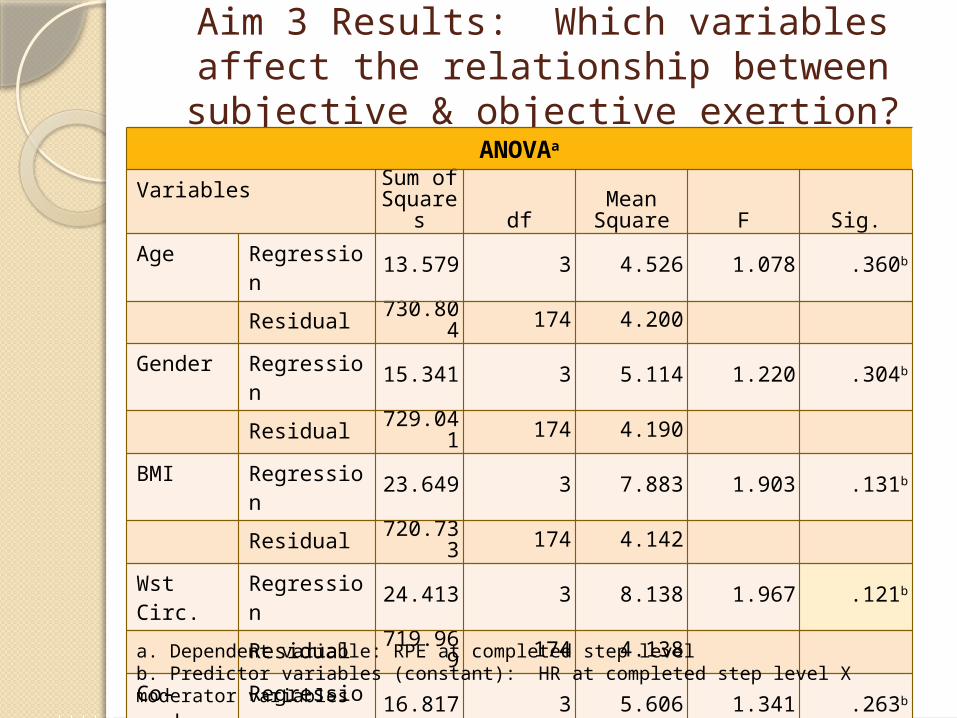
Aim 3 Results: Which variables affect the relationship between subjective &
objective exertion?ANOVAa
Variables Sum of Square
s dfMean
Square F Sig.Age Regression 13.579 3 4.526 1.078 .360b
Residual 730.804 174 4.200
Gender Regression 15.341 3 5.114 1.220 .304b
Residual 729.041 174 4.190
BMI Regression 23.649 3 7.883 1.903 .131b
Residual 720.733 174 4.142
Wst Circ.
Regression 24.413 3 8.138 1.967 .121b
Residual 719.969 174 4.138
Co-morb.
Regression 16.817 3 5.606 1.341 .263b
Residual 727.565 174 4.181
BF % Regression 40.820 3 13.607 3.335 .021b
Residual 701.719 172 4.080
a. Dependent variable: RPE at completed step levelb. Predictor variables (constant): HR at completed step level X moderator variables

CST participant form


