Download - Mapping The Digital Silk Road
Mapping The Digital Silk Road Jim Cowie Chief Scientist
ENOG 8
Baku, Azerbaijan
Pg. 2
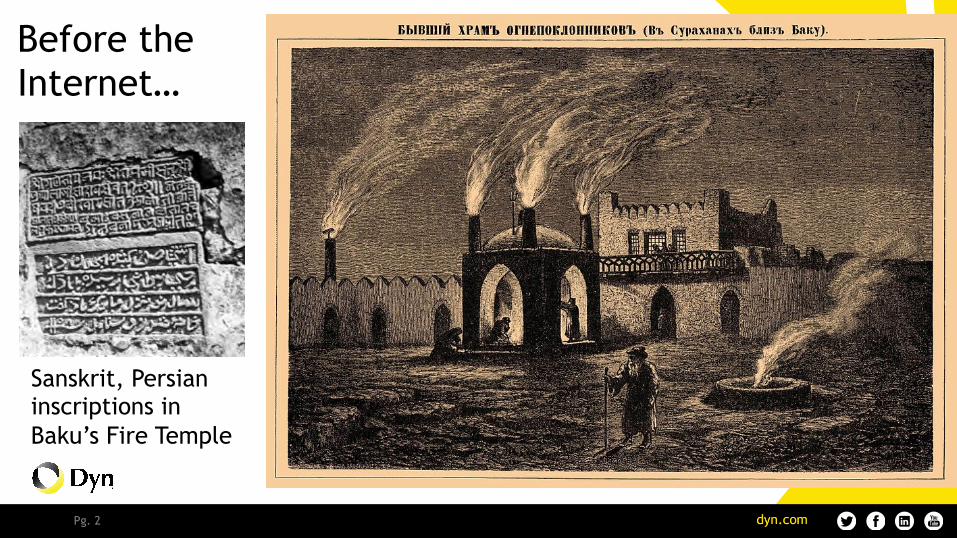
Before the Internet…
Sanskrit, Persian inscriptions in Baku’s Fire Temple
Pg. 3
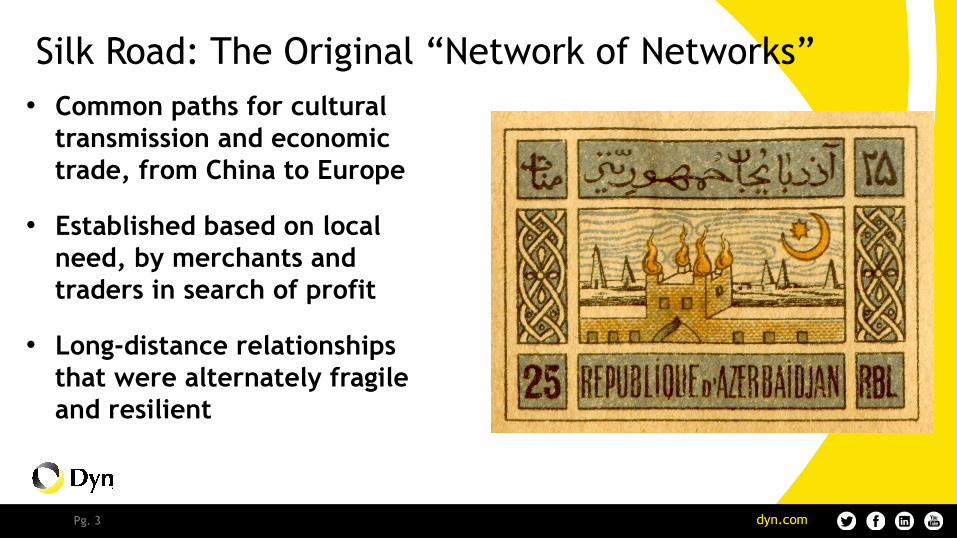
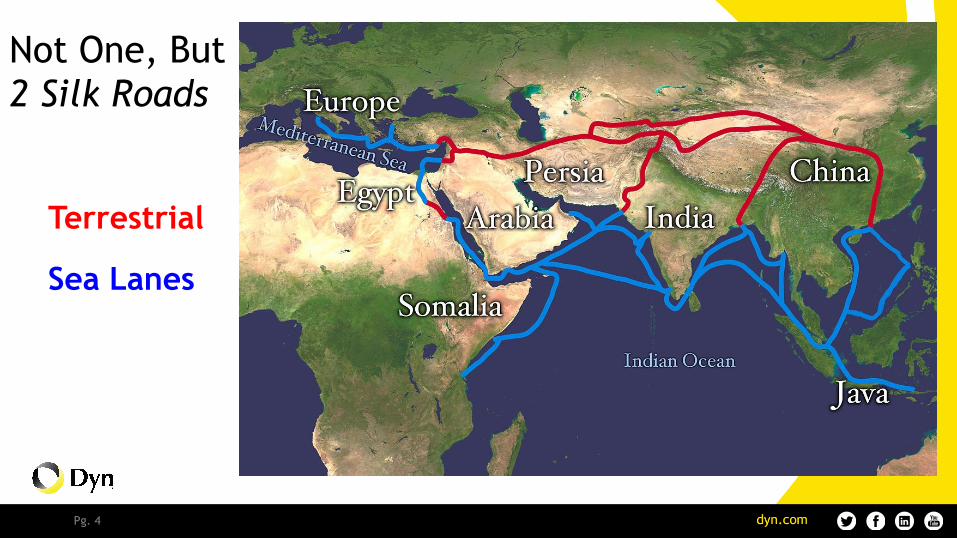
• Common paths for cultural transmission and economic trade, from China to Europe
• Established based on local need, by merchants and traders in search of profit
• Long-distance relationships that were alternately fragile and resilient
Silk Road: The Original “Network of Networks”
Pg. 4
Terrestrial
Sea Lanes
Not One, But 2 Silk Roads
Pg. 5
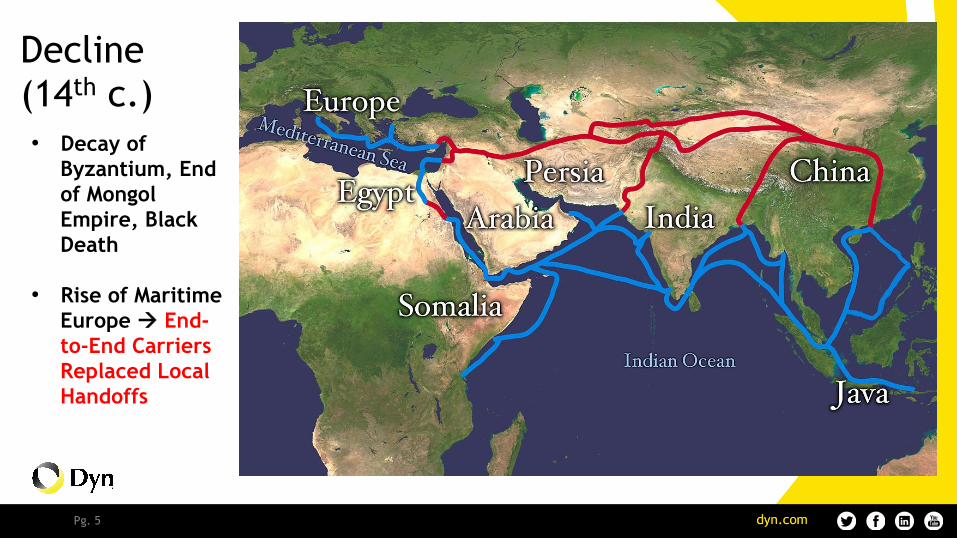
• Decay of Byzantium, End of Mongol Empire, Black Death
• Rise of Maritime Europe ! End-to-End Carriers Replaced Local Handoffs
Decline (14th c.)
Pg. 6
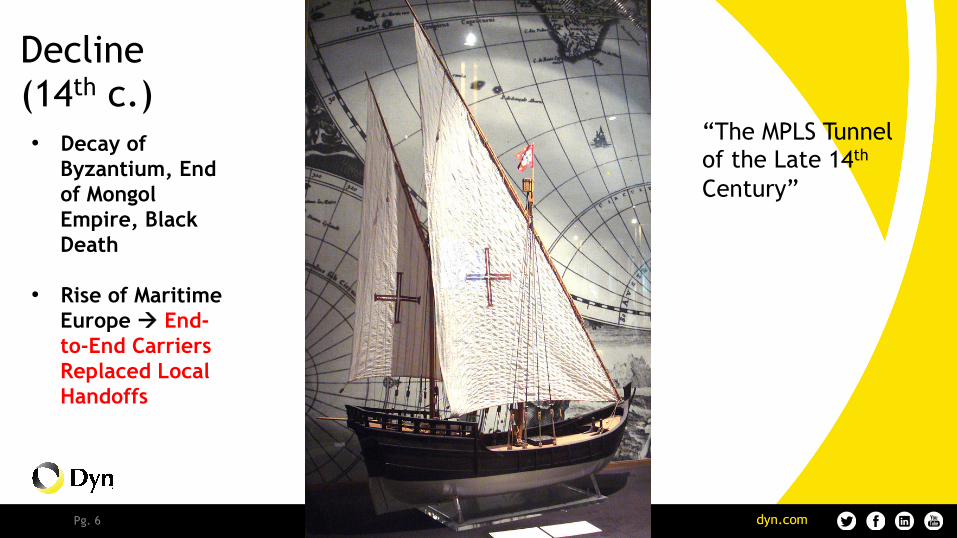
• Decay of Byzantium, End of Mongol Empire, Black Death
• Rise of Maritime Europe ! End-to-End Carriers Replaced Local Handoffs
Decline (14th c.)
“The MPLS Tunnel of the Late 14th Century”
Pg. 7
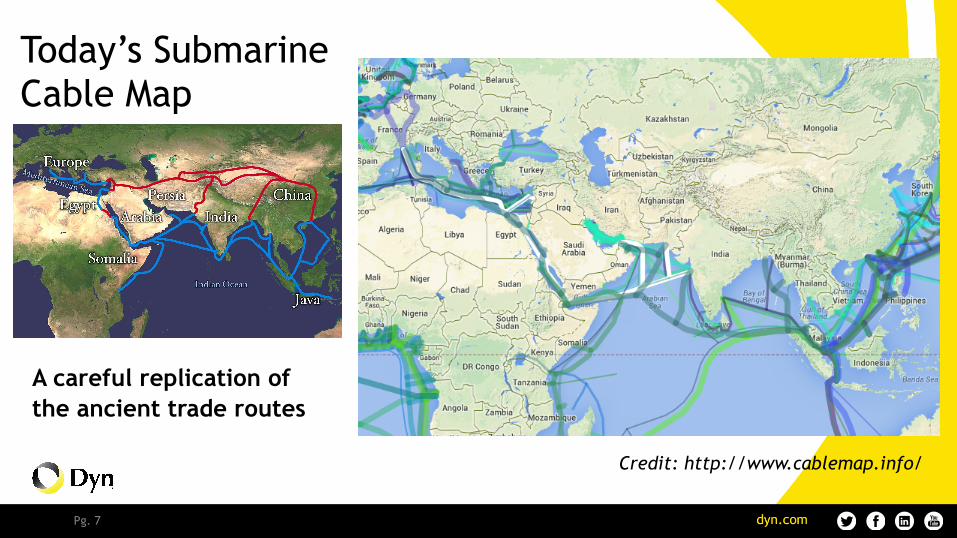
A careful replication of the ancient trade routes
Today’s Submarine Cable Map
Credit: http://www.cablemap.info/
Pg. 8
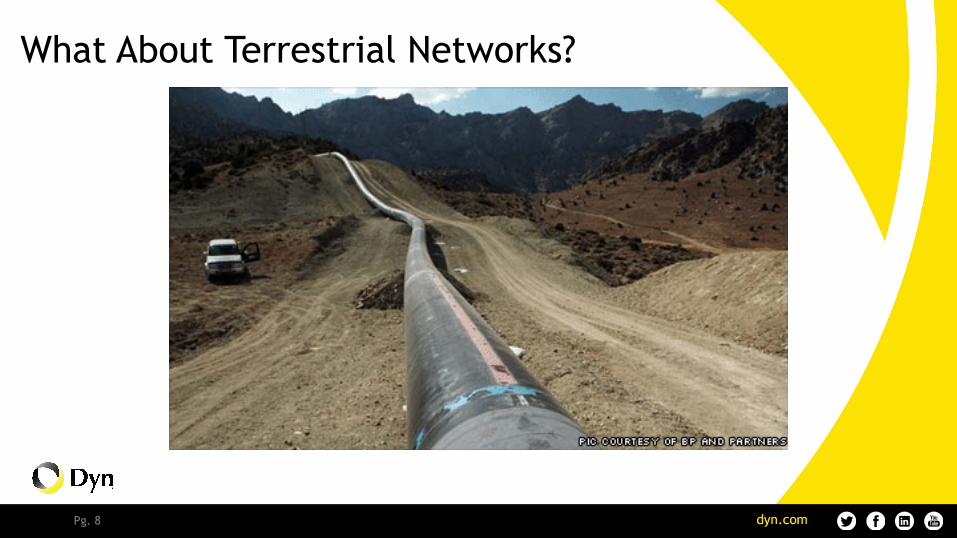
What About Terrestrial Networks?
Pg. 9
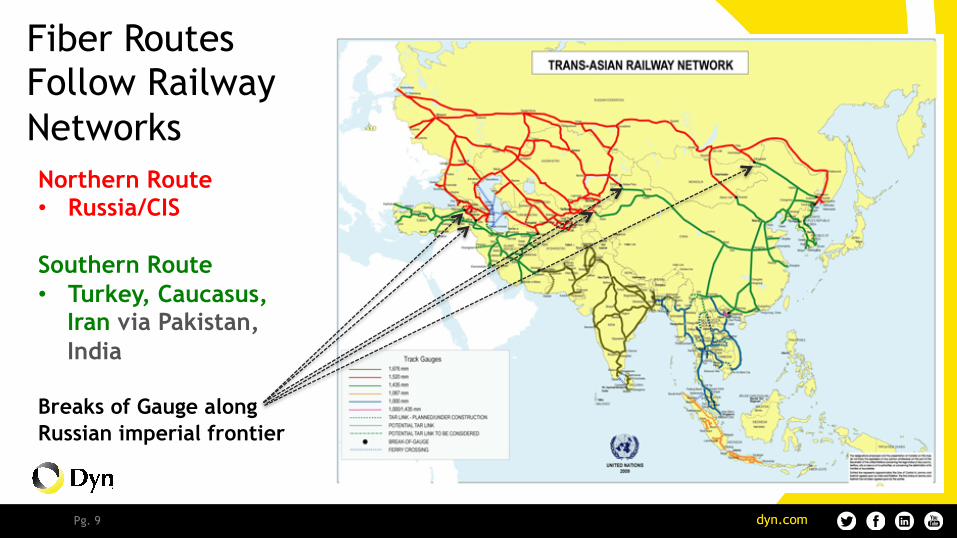
Fiber Routes Follow Railway Networks Northern Route • Russia/CIS Southern Route • Turkey, Caucasus,
Iran via Pakistan, India
Breaks of Gauge along Russian imperial frontier
Pg. 10
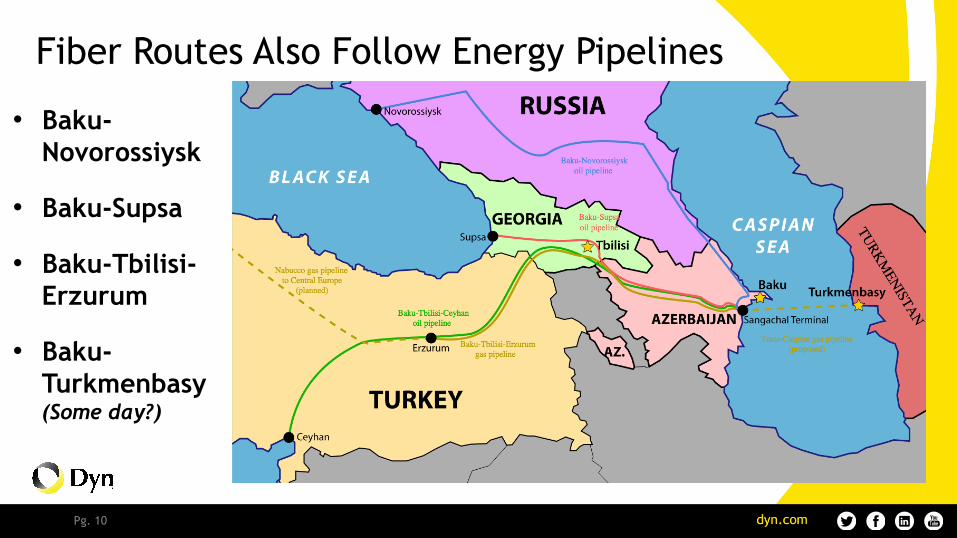
• Baku-Novorossiysk
• Baku-Supsa
• Baku-Tbilisi-Erzurum
• Baku-Turkmenbasy (Some day?)
Fiber Routes Also Follow Energy Pipelines
Pg. 11
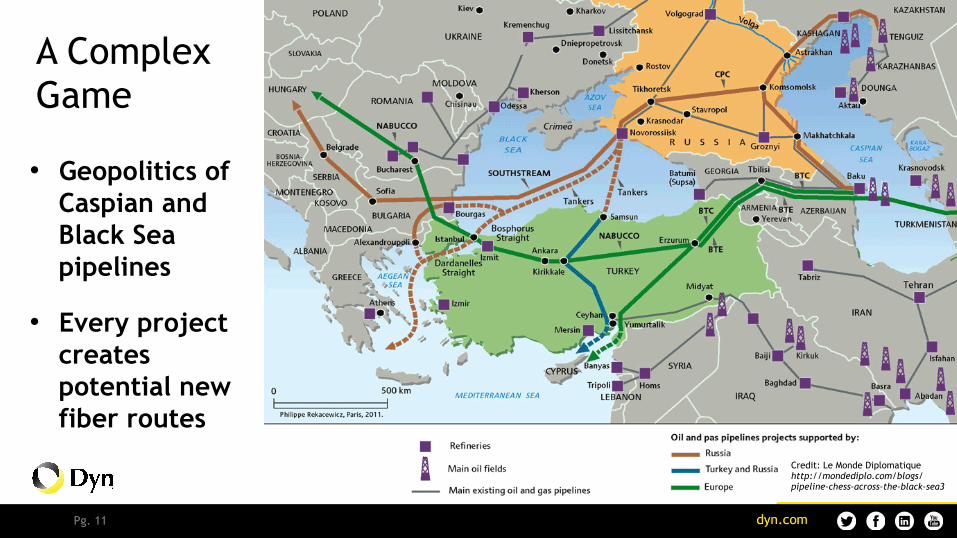
• Geopolitics of Caspian and Black Sea pipelines
• Every project creates potential new fiber routes
A Complex Game
Credit: Le Monde Diplomatique http://mondediplo.com/blogs/pipeline-chess-across-the-black-sea3
Pg. 12
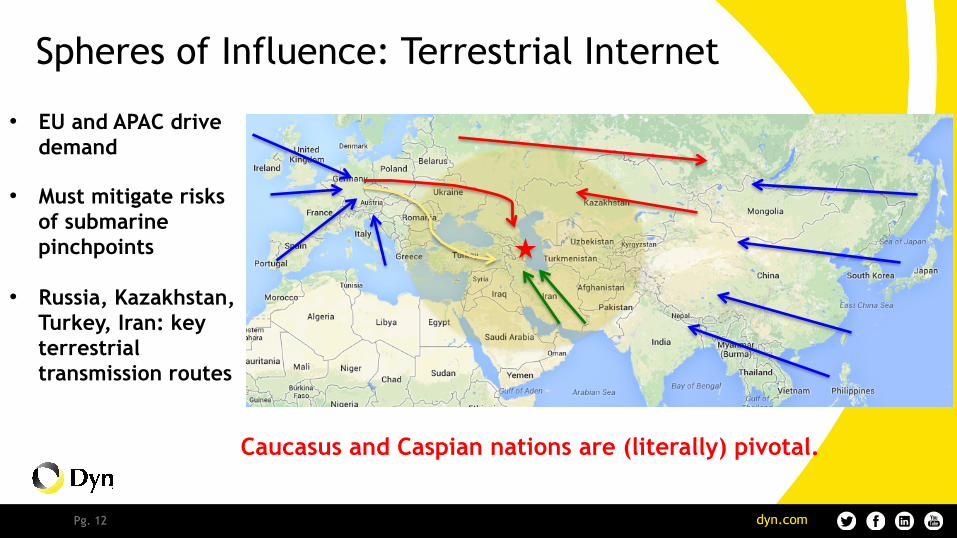
• EU and APAC drive demand
• Must mitigate risks of submarine pinchpoints
• Russia, Kazakhstan, Turkey, Iran: key terrestrial transmission routes
Spheres of Influence: Terrestrial Internet
★
Caucasus and Caspian nations are (literally) pivotal.
Pg. 13
Pg. 14
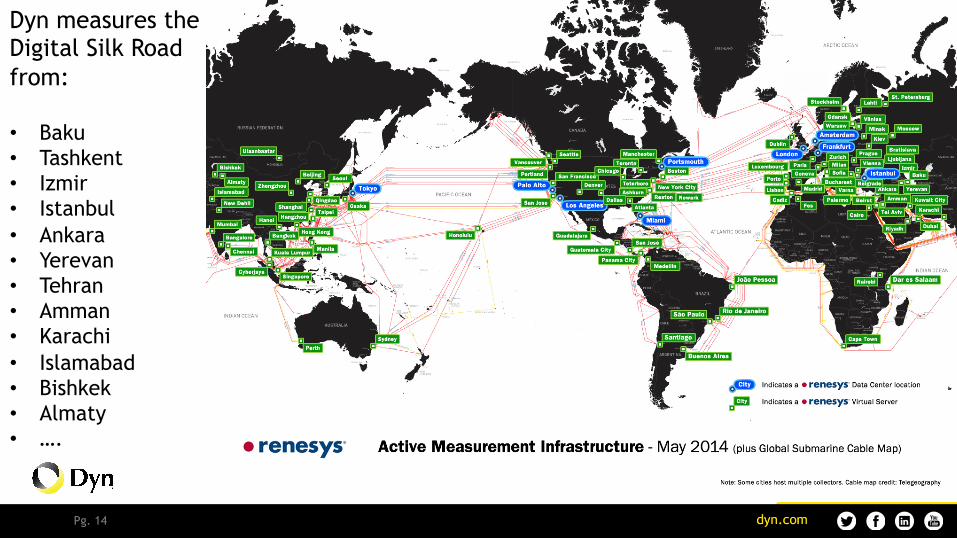
Dyn measures the Digital Silk Road from: • Baku • Tashkent • Izmir • Istanbul • Ankara • Yerevan • Tehran • Amman • Karachi • Islamabad • Bishkek • Almaty • ….
Pg. 15
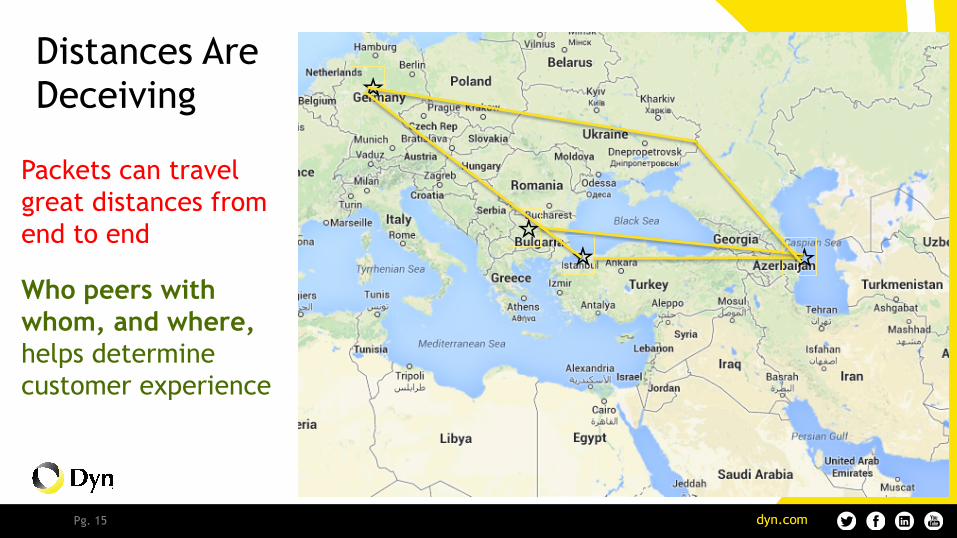
Packets can travel great distances from end to end
Who peers with whom, and where, helps determine customer experience
Distances Are Deceiving
☆☆☆
☆
Pg. 16
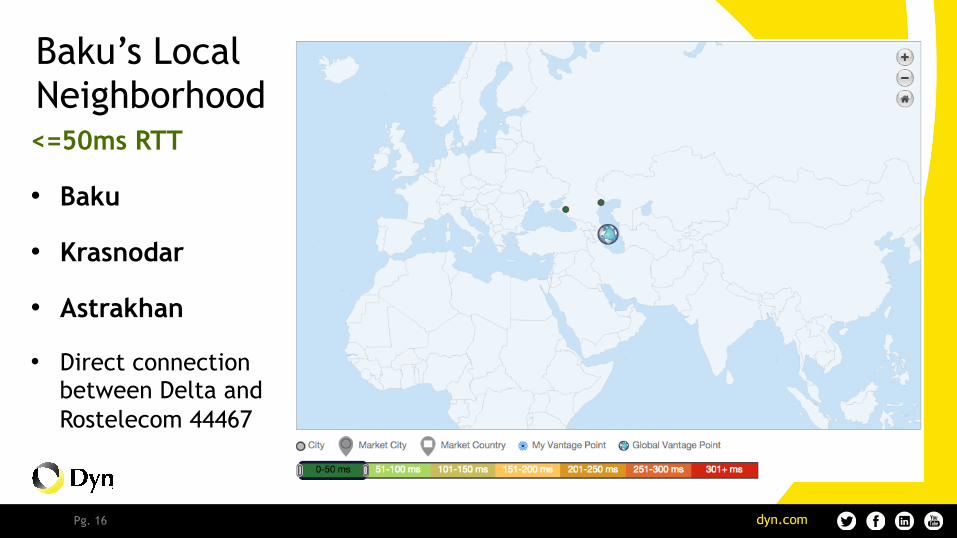
<=50ms RTT
• Baku
• Krasnodar
• Astrakhan
• Direct connection between Delta and Rostelecom 44467
Baku’s Local Neighborhood
Pg. 17
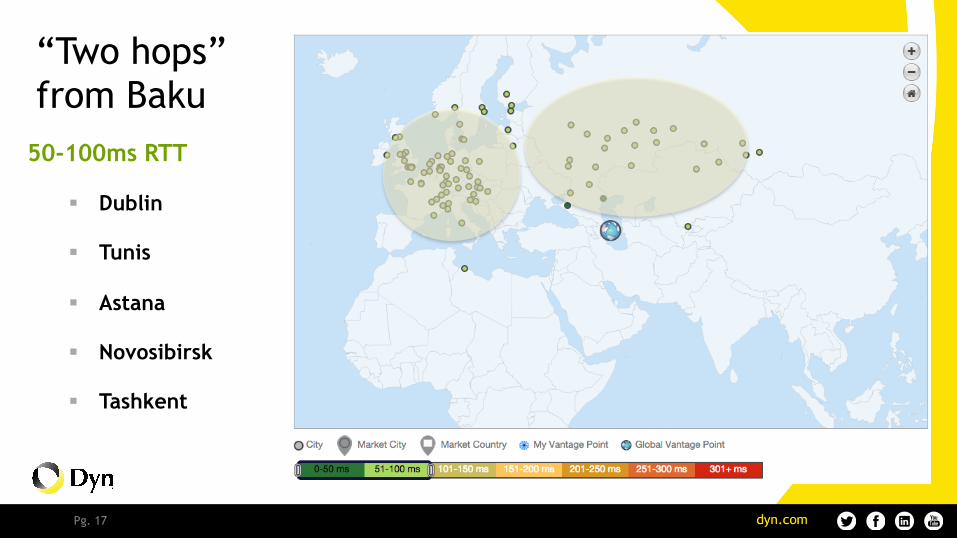
50-100ms RTT
§ Dublin
§ Tunis
§ Astana
§ Novosibirsk
§ Tashkent
“Two hops” from Baku
Pg. 18
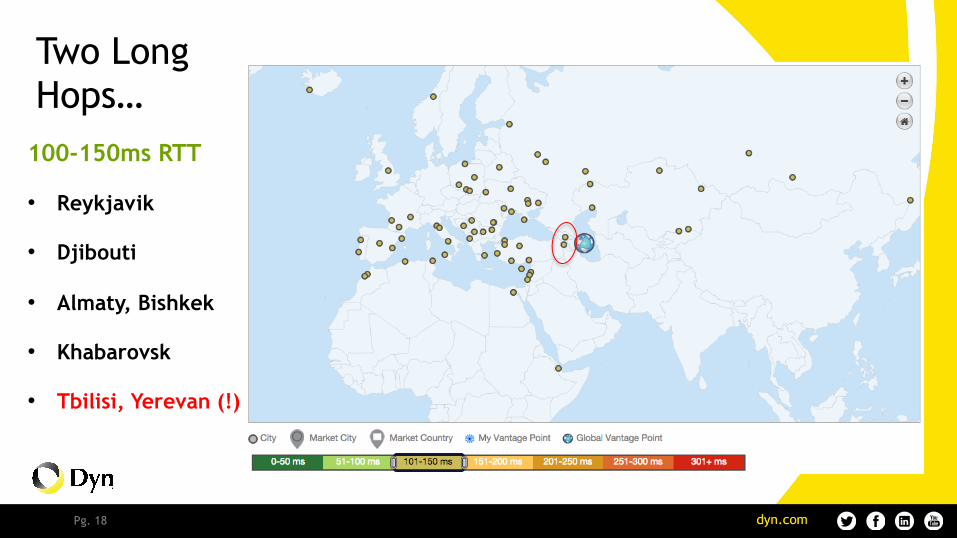
100-150ms RTT
• Reykjavik
• Djibouti
• Almaty, Bishkek
• Khabarovsk
• Tbilisi, Yerevan (!)
Two Long Hops…
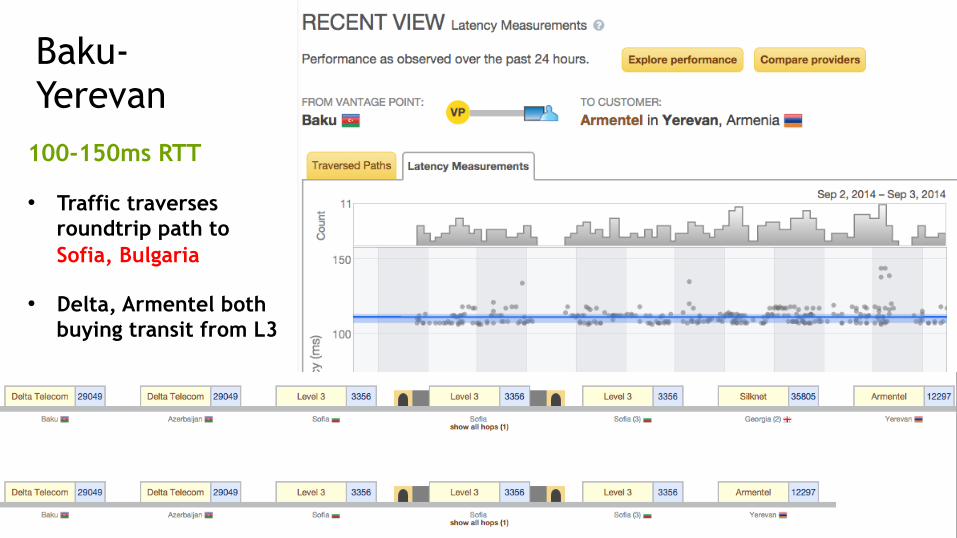
100-150ms RTT
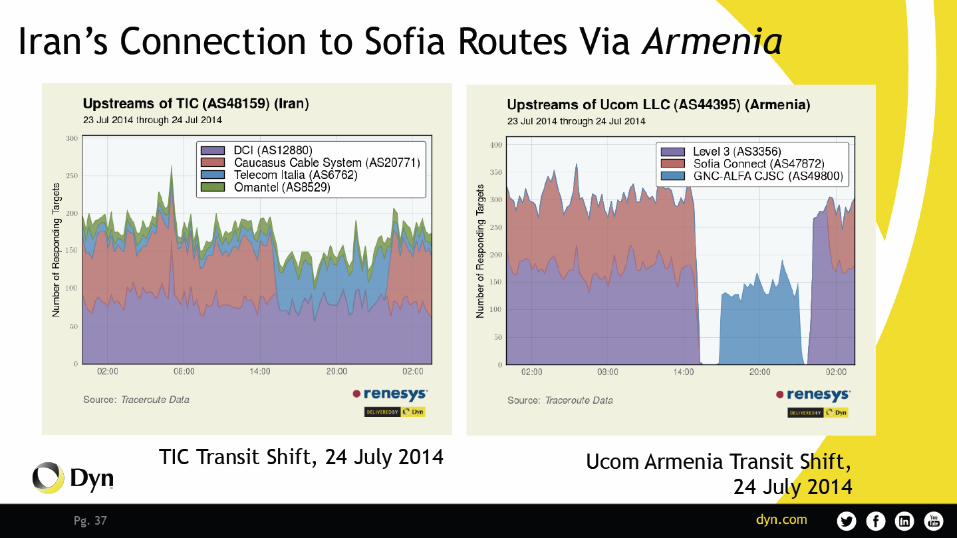
• Traffic traverses roundtrip path to Sofia, Bulgaria
• Delta, Armentel both buying transit from L3
Baku-Yerevan
Pg. 20
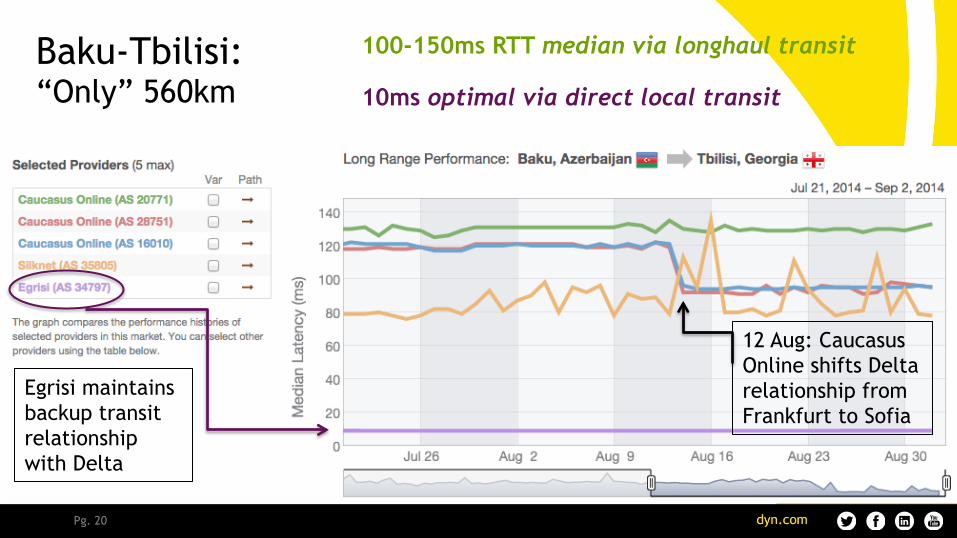
100-150ms RTT median via longhaul transit
10ms optimal via direct local transit
Baku-Tbilisi: “Only” 560km
12 Aug: Caucasus Online shifts Delta relationship from Frankfurt to Sofia
Egrisi maintains backup transit relationship with Delta
Pg. 21
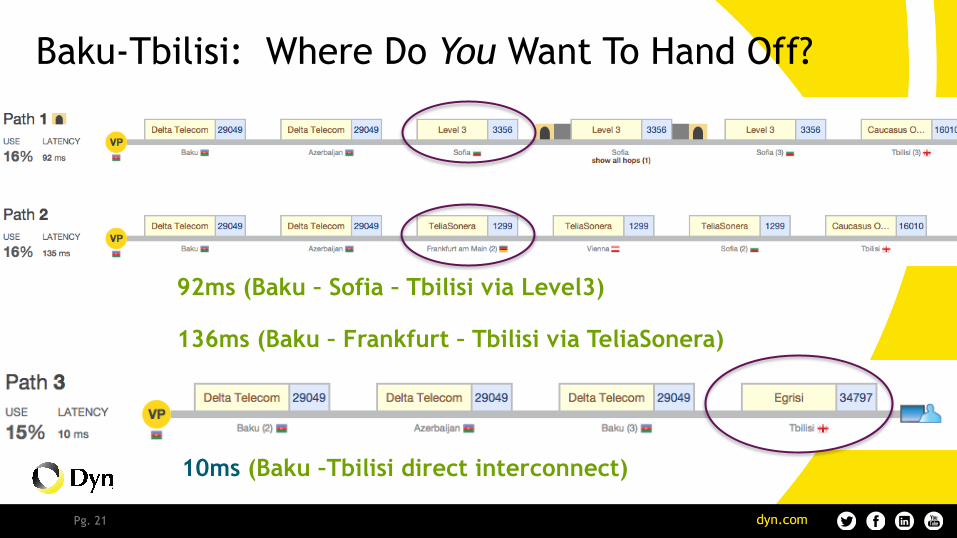
92ms (Baku – Sofia – Tbilisi via Level3)
136ms (Baku – Frankfurt – Tbilisi via TeliaSonera)
Baku-Tbilisi: Where Do You Want To Hand Off?
10ms (Baku –Tbilisi direct interconnect)
Pg. 22
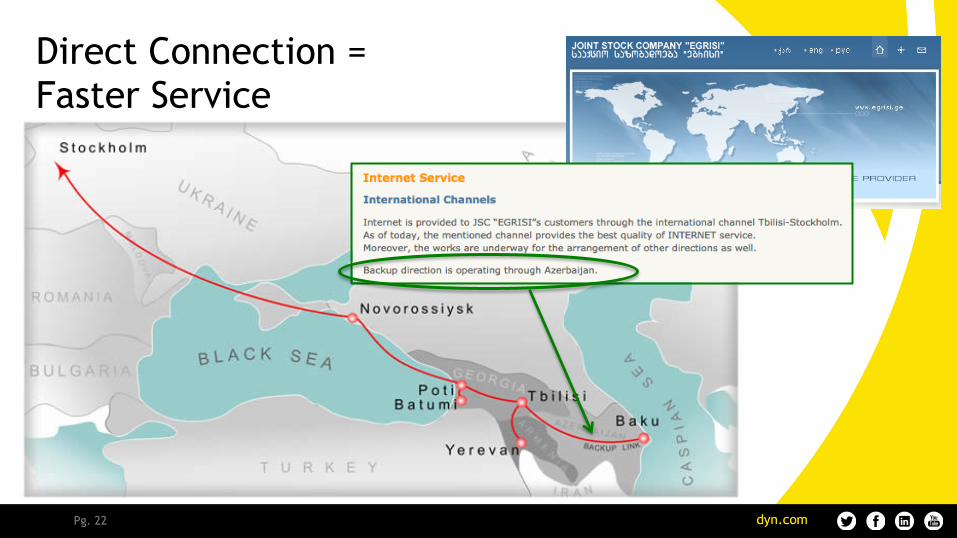
Direct Connection = Faster Service
Pg. 23
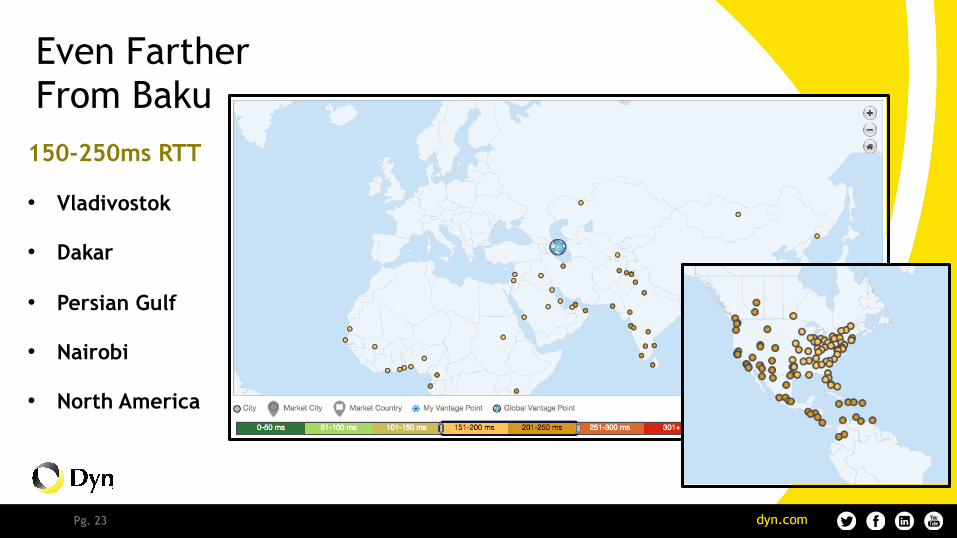
150-250ms RTT
• Vladivostok
• Dakar
• Persian Gulf
• Nairobi
• North America
Even Farther From Baku
Pg. 24
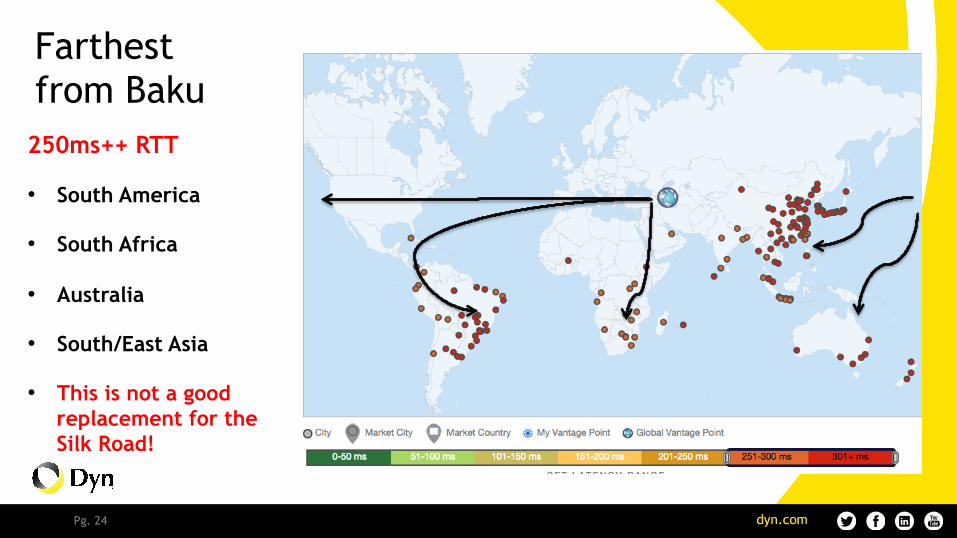
250ms++ RTT
• South America
• South Africa
• Australia
• South/East Asia
• This is not a good replacement for the Silk Road!
Farthest from Baku
Pg. 25
2. By The Numbers:
Inferring Diversity and Competition Among Regional Providers
Pg. 26
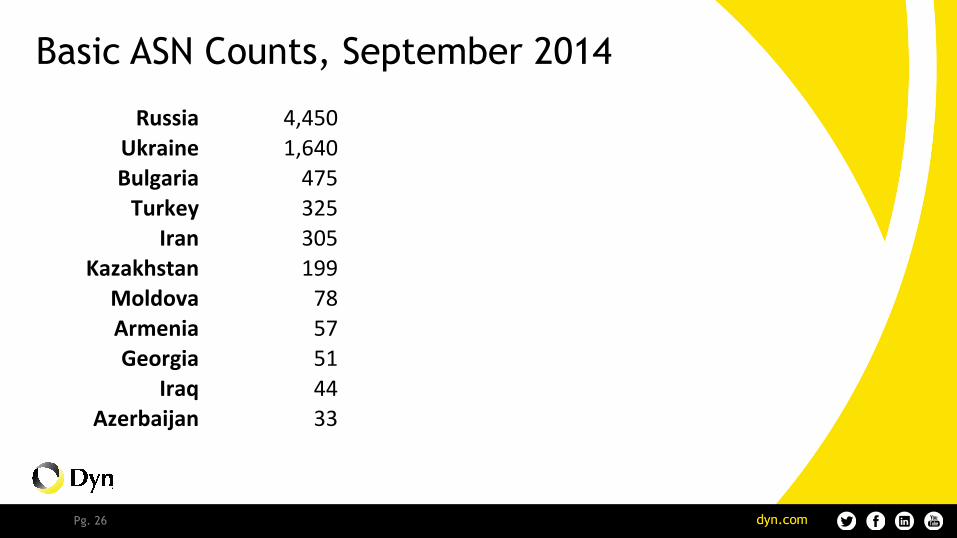
Basic ASN Counts, September 2014
Russia 4,450Ukraine 1,640Bulgaria 475Turkey 325
Iran 305Kazakhstan 199
Moldova 78Armenia 57Georgia 51
Iraq 44Azerbaijan 33
Pg. 27
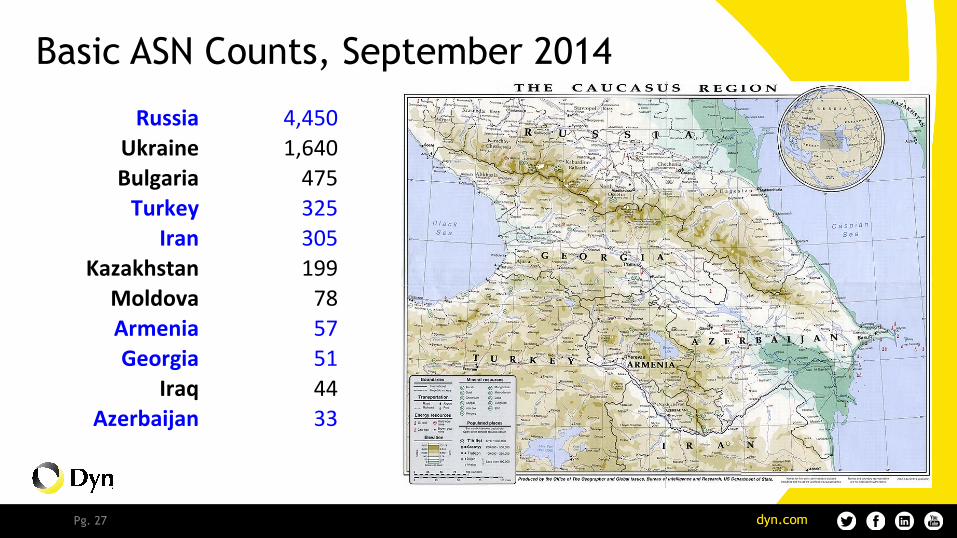
Basic ASN Counts, September 2014
Russia 4,450Ukraine 1,640Bulgaria 475Turkey 325
Iran 305Kazakhstan 199
Moldova 78Armenia 57Georgia 51
Iraq 44Azerbaijan 33
Pg. 28
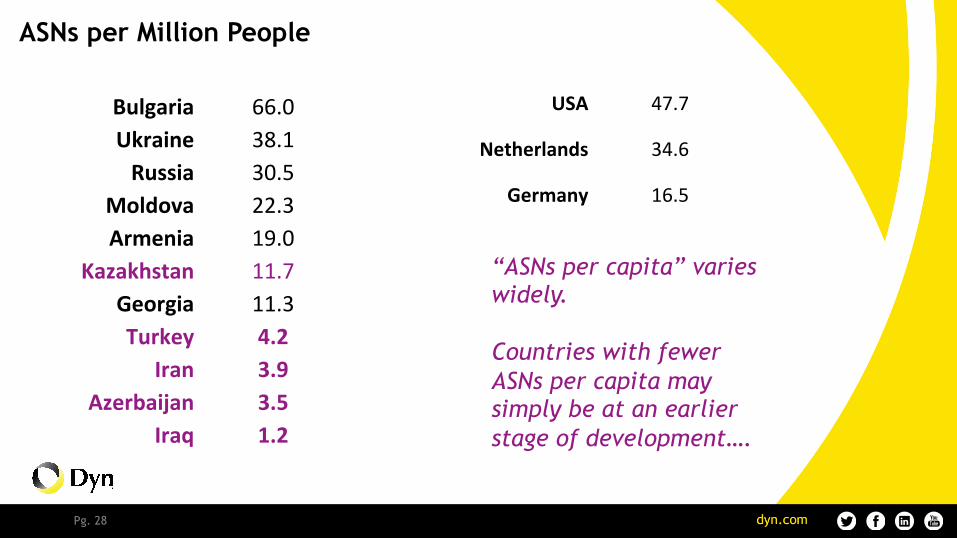
ASNs per Million People
Bulgaria 66.0Ukraine 38.1Russia 30.5
Moldova 22.3Armenia 19.0
Kazakhstan 11.7Georgia 11.3Turkey 4.2
Iran 3.9Azerbaijan 3.5
Iraq 1.2
“ASNs per capita” varies widely. Countries with fewer ASNs per capita may simply be at an earlier stage of development….
USA 47.7
Netherlands 34.6
Germany 16.5
Pg. 29
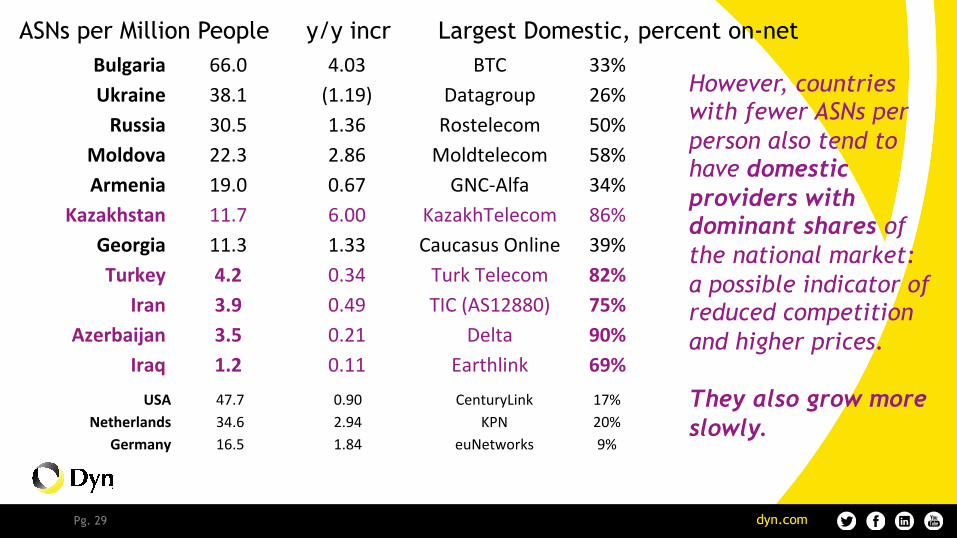
ASNs per Million People y/y incr Largest Domestic, percent on-net Bulgaria 66.0 4.03 BTC 33%Ukraine 38.1 (1.19) Datagroup 26%Russia 30.5 1.36 Rostelecom 50%
Moldova 22.3 2.86 Moldtelecom 58%Armenia 19.0 0.67 GNC-‐Alfa 34%
Kazakhstan 11.7 6.00 KazakhTelecom 86%Georgia 11.3 1.33 Caucasus Online 39%Turkey 4.2 0.34 Turk Telecom 82%
Iran 3.9 0.49 TIC (AS12880) 75%Azerbaijan 3.5 0.21 Delta 90%
Iraq 1.2 0.11 Earthlink 69%
However, countries with fewer ASNs per person also tend to have domestic providers with dominant shares of the national market: a possible indicator of reduced competition and higher prices. They also grow more slowly.
USA 47.7 0.90 CenturyLink 17%Netherlands 34.6 2.94 KPN 20%
Germany 16.5 1.84 euNetworks 9%
Pg. 30
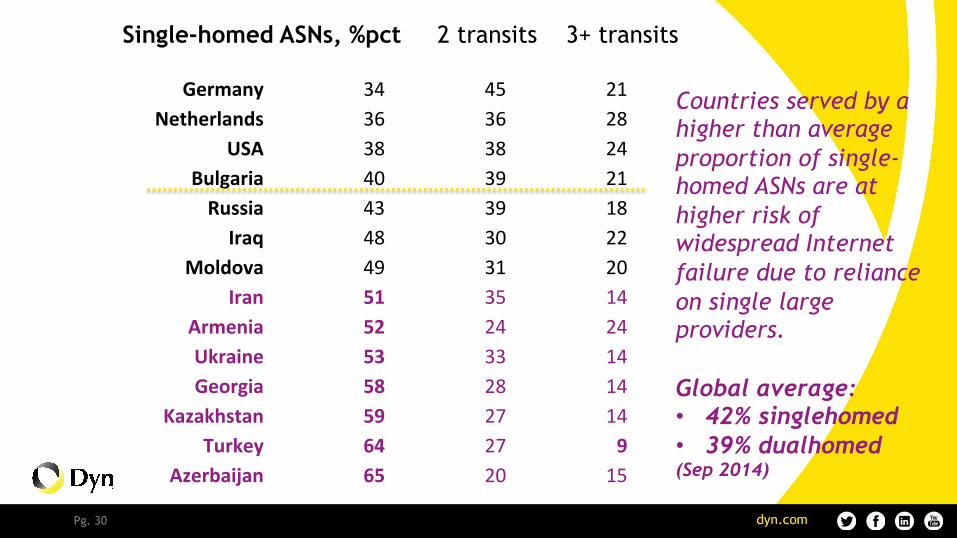
Single-homed ASNs, %pct 2 transits 3+ transits
Countries served by a higher than average proportion of single-homed ASNs are at higher risk of widespread Internet failure due to reliance on single large providers. Global average: • 42% singlehomed • 39% dualhomed (Sep 2014)
Germany 34 45 21Netherlands 36 36 28
USA 38 38 24Bulgaria 40 39 21Russia 43 39 18Iraq 48 30 22
Moldova 49 31 20Iran 51 35 14
Armenia 52 24 24Ukraine 53 33 14Georgia 58 28 14
Kazakhstan 59 27 14Turkey 64 27 9
Azerbaijan 65 20 15
Pg. 31
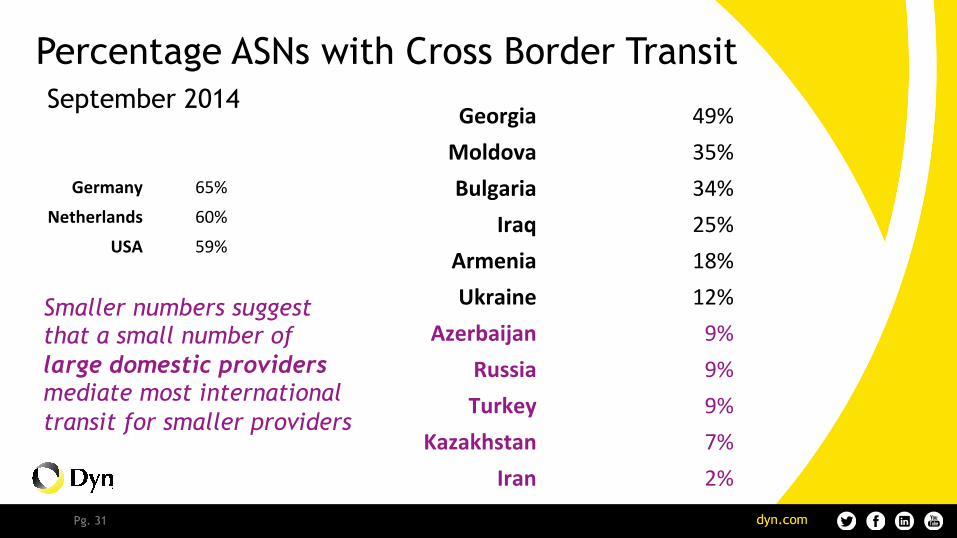
Percentage ASNs with Cross Border Transit September 2014
Georgia 49%Moldova 35%Bulgaria 34%
Iraq 25%Armenia 18%Ukraine 12%
Azerbaijan 9%Russia 9%Turkey 9%
Kazakhstan 7%Iran 2%
Germany 65%
Netherlands 60%
USA 59%
Smaller numbers suggest that a small number of large domestic providers mediate most international transit for smaller providers

Pg. 32
3. Navigating the Shifting Sands
Pg. 33
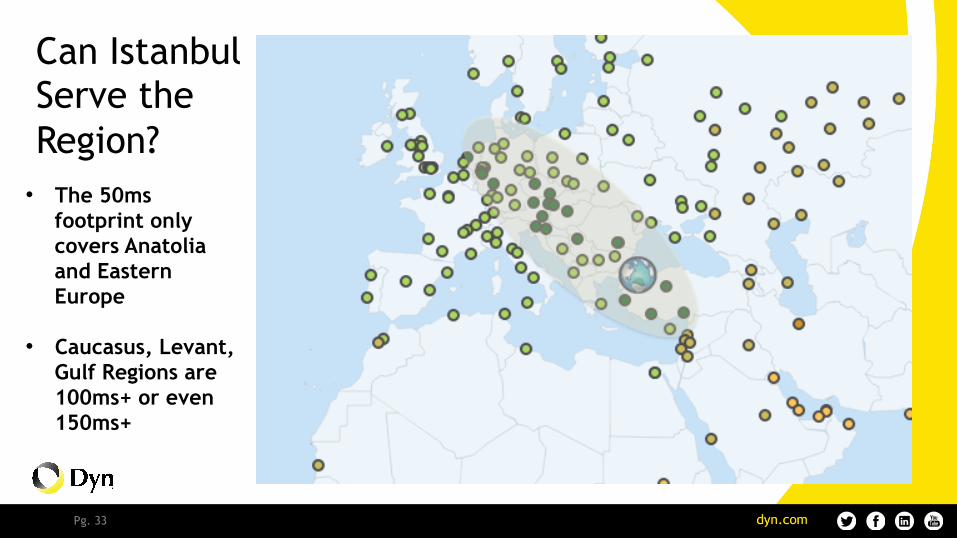
• The 50ms footprint only covers Anatolia and Eastern Europe
• Caucasus, Levant, Gulf Regions are 100ms+ or even 150ms+
Can Istanbul Serve the Region?
Pg. 34
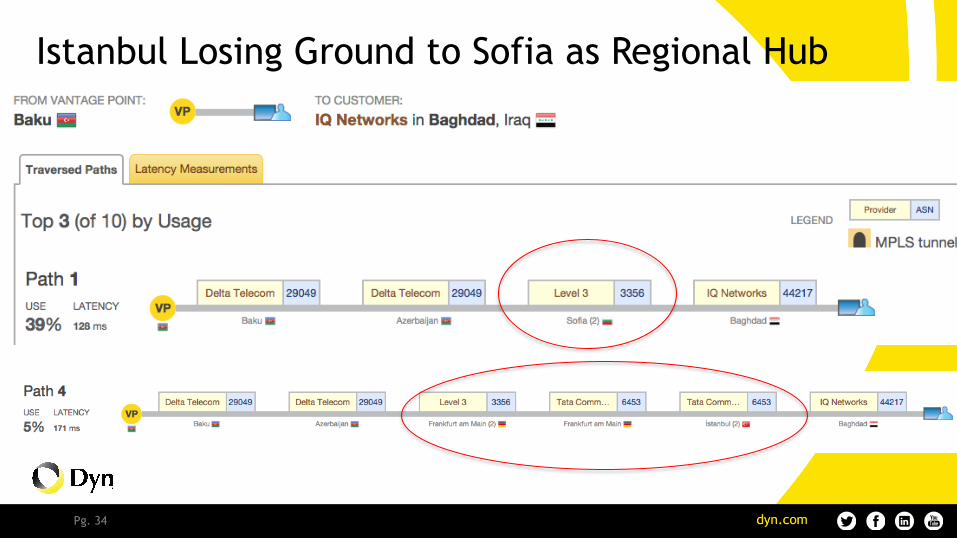
Istanbul Losing Ground to Sofia as Regional Hub
Pg. 35
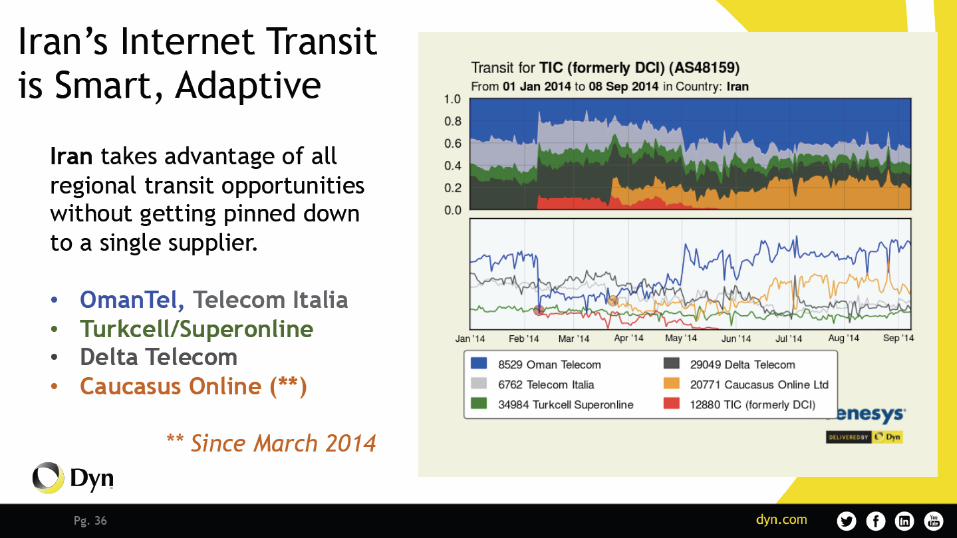
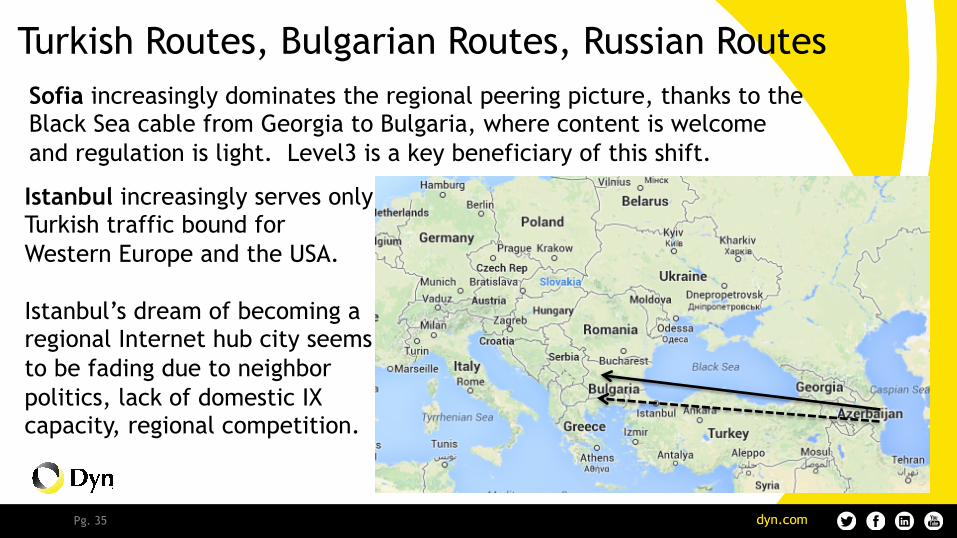
Turkish Routes, Bulgarian Routes, Russian Routes
Sofia increasingly dominates the regional peering picture, thanks to the Black Sea cable from Georgia to Bulgaria, where content is welcome and regulation is light. Level3 is a key beneficiary of this shift. Istanbul increasingly serves only Turkish traffic bound for Western Europe and the USA.
Istanbul’s dream of becoming a regional Internet hub city seems to be fading due to neighbor politics, lack of domestic IX capacity, regional competition.