TR
AN
SA
CT
ION
S O
N S
CIE
NC
E A
ND
TE
CH
NO
LO
GY
Transactions on Science and Technology Vol. 4, No. 1, 38 - 47, 2017
Al-Awadhi & AlKandary, 2017. Transactions on Science and Technology. 4(1), 38 - 47
Mapping and Validation of Noise Level in Kuwait City
Jasem M. Al-Awadhi*, Dhary S. AlKandary Faculty of Science, Department of Earth and Environmental Sciences, Kuwait University, P.O. Box 5969, 13060 Safat, KUWAIT.
*Corresponding author. E-Mail: [email protected]; Tel: +96524987252; Fax: +965 9980 6320.
ABSTRACT: Noise Pollution Modeling Software “CUSTIC 2.0” has been used to assess the noise level due to traffic flow in Kuwait City during weekdays and weekends at three different time slots. Geographical Information System (GIS) was used to generate, store and retrieve the spatial data and map the sound levels using an interpolation technique. In general as the traffic flow increases the noise pollution levels tend to increase in their magnitude. During the weekdays, the traffic noise is generally higher in the morning period than in the afternoon time due to higher car numbers, while in the weekends, the traffic noise is higher in the afternoon than in morning time due to increase of traffic movement for shopping purposes. In general, the maximum noise level was measured between March 2011 and February 2012 was 83 dBA and 82 dBA for weekdays and weekends respectively. The predicted levels of noise have been calculated as 80 and 70.5 dBA for weekdays and weekends. The two predicted and measured noise levels were compared with the noise level measurements at 25 different locations in Kuwait City. A good agreement between the measured and predicted results was found. KEYWORDS: Traffic noise; Noise model; Traffic flow; Noise measure; Noise prediction
Received 31 August 2016 Revised 26 September 2016 Accepted 5 October 2016 In press 26 February 2017 Online 20 March 2017 © Transactions on Science and Technology 2017
INTRODUCTION
Noise pollution of the vehicular traffic has undesirable impact not only on the human health but
also on the quality of life, thus it becomes one of the serious factors in urban development planning
(Lipfert et al., 2006; Belojevic et al., 2008). There are various factors that contribute to increase of noise
levels. One of main factors is increasing urban population, which contributes to higher traffic
volume and intensity (Al-Awadhi, 2014). Due to cost and time restrictions, the modeling of noise is
often preferred to its measurement in most cities (Abo-Qudais & Alhiary, 2007) and such modeling
takes into account various traffic parameters.
Noise dispersion modeling can be helpful in decision making processes for reducing the noise
pollution in the capital cities (Gündoğdua et al., 2005). The influence of excess noise on human body
can be due to direct effects upon the auditory system, non-auditory physiological processes and on
purely psychological mechanisms (Tonin, 2000). The level of noise pollution in Kuwait’s urban areas
is high enough to adversely affect the human health and well-being of the residents (Al-Mutairi et
al., 2011). Also, due to the exponential growth of the population in Kuwait, the number of private
vehicles owned by individual citizens has increased and hence this adds up to the noise pollution in
the roads. With the rapid expansion of the infrastructures in metropolitan Kuwait, it is virtually
definite that traffic noise will shortly assume a dangerous dimension, and will be a ground of
escalating fear for both the public and liable policy makers. Accordingly, this paper aims to provide
a widespread picture on the current status of traffic noise levels in one of rapidly growing city in the
Arab Gulf countries, using a simple, low cost software solution ‚CUSTIC 2.0‛. This study aimed at:
quantifying temporal and spatial dynamics of urban traffic-induced noise pollution in Kuwait city;
assessing noise levels based on national noise standards; evaluating the results of the model with the
noise level measurements.

TR
AN
SA
CT
ION
S O
N S
CIE
NC
E A
ND
TE
CH
NO
LO
GY
Al-Awadhi & AlKandary, 2017. Transactions on Science and Technology. 4(1), 38 - 47 39
ISSN 2289-8786. http://transectscience.org/
METHODOLOGY
The CUSTIC 2.0 Noise Pollution Modeling Software was used to assess the noise level due to
traffic flow in Kuwait city. The model calculates attenuation due to noise source enclosures and
other noise control measures, the distance from the source to the receiver, the noise source size, type
and directivity, barriers and natural topographical features and sound absorption in the air. Figure 1
illustrates the input data including sources (traffic roads presents line source), ambient (climate)
data, grid size and scale. Based on data entered the software calculates noise levels and presents
those levels in form of iso-lines, numerical grid or color gradient.
Figure 1. Input and output data of the software
In the calculation of CUSTIC 2.0, a road traffic noise level is estimated through average vehicle
velocity and vehicles number data. Automatic traffic counts were carried out by the Ministry of
Interior- Traffic Department for one week at thirty roadway intersections in Kuwait city (Fig. 2).The
volume counts included all vehicle-size categories. The locations of traffic survey were spread over
the network of main roadways in Kuwait city. Table 1 presents the average hourly number of
vehicles running on the main roads in Kuwait city; it ranges from 611 to 2792 vehicles/hr. Traffic
volumes were considerably heavier during the afternoon (peak hours). The maximum speed of
traffic assigned in the city road ranged between 60 to 80 Km / hr (Table 2).
Figure 2. Selected intersections for traffic survey

TR
AN
SA
CT
ION
S O
N S
CIE
NC
E A
ND
TE
CH
NO
LO
GY
Al-Awadhi & AlKandary, 2017. Transactions on Science and Technology. 4(1), 38 - 47 40
ISSN 2289-8786. http://transectscience.org/
Table 1. Traffic survey counts
Location Working days Weekend
7-14 14-22 22-7 7-14 14-22 22-7
1-1 A 3262 2432 445 1617 2323 635
C 2022 1322 169 712 1318 178
1-2 A 2600 2084 403 1437 2108 493
B 1569 1205 154 892 1150 160
1-3 A 3074 2203 384 1258 2104 612
B 316 170 22 93 41 17
1-4 A 3014 2072 383 1092 2013 642
D 347 420 98 281 480 193
1-5 B 2289 1148 287 654 1370 448
1-7 A 1776 1652 214 712 1462 381
C 2549 1270 332 691 1644 521
3-1 A 1068 855 94 490 702 83
B 1444 1236 194 901 1140 171
3-2 A 1746 1541 236 1016 1348 232
3-3 A 2039 1562 243 959 1278 225
3-5 A 1628 1117 181 739 822 152
D 1646 1235 155 749 1014 148
3-8 A 1344 1084 179 652 823 154
D 887 562 102 339 386 144
3-9 D 1163 866 145 514 781 151
4-1
A 1861 1704 217 1985 1879 232
B 1610 1313 187 1501 1347 181
D 825 671 85 927 782 82
4-2 A 1583 1111 120 585 845 130
B 1594 1075 145 749 914 119
4-3 A 1514 1381 172 860 1209 159
B 1348 1069 104 783 1060 143
4-4
A 1735 1282 165 728 1058 131
B 926 950 172 755 637 150
D 1174 1125 116 660 939 106
4-5 A 1970 1502 190 820 1185 187
D 1839 1604 212 993 1354 213
4-7 A 1066 945 110 490 754 108
D 1769 1431 217 795 1023 190
4-8 A 763 565 99 441 596 130
D 953 845 125 478 695 136
4-9
A 1128 859 176 480 819 248
D 1705 1411 213 695 1031 185
E 785 574 110 364 397 100
5-2 A 3125 2584 362 1895 2400 400
B 744 428 88 328 355 94
5-3 A 1453 942 99 503 727 70
D 1442 1030 123 475 780 128

TR
AN
SA
CT
ION
S O
N S
CIE
NC
E A
ND
TE
CH
NO
LO
GY
Al-Awadhi & AlKandary, 2017. Transactions on Science and Technology. 4(1), 38 - 47 41
ISSN 2289-8786. http://transectscience.org/
Location Working days Weekend
7-14 14-22 22-7 7-14 14-22 22-7
5-4 A 747 567 39 271 396 41
D 2033 1562 164 854 1231 154
5-5 A 1699 1526 228 820 1215 243
D 2053 1981 303 1266 1649 282
6-1
A 2537 2451 336 2557 2209 316
B 1217 1009 95 811 928 80
C 1284 941 235 994 798 186
D 1484 1451 283 866 1186 218
F 145 140 16 120 117 15
6-2
A 3170 2751 427 2089 2201 440
B 1654 1172 147 801 819 113
C 3252 2081 363 1260 1703 205
6-3
A 1626 1499 260 698 1158 200
B 2845 1702 439 1634 1778 337
D 3842 2465 370 1552 2049 267
6-4
A 1192 1029 150 510 1053 149
B 1334 783 109 433 605 83
D 1951 1574 153 892 1220 142
6-5
A 2422 2027 404 1121 1931 345
B 3333 2598 638 1949 2811 543
D 3285 3268 491 1972 3017 509
6-6
A 2984 2725 526 1420 2118 456
B 401 412 79 170 453 120
D 87 96 14 47 75 17
Table 2. Vehicle Velocity (Km/h) for main streets
Location Vehicle Velocity
(Km/h) Location
Vehicle Velocity
(Km/h)
Fahad Al-Salem St. 60 East Maqwa Rd. 60
Soor St. 80 Mobarak Al Kabeer St. 60
Jahra Rd. 80 Khalid Ibn Al Waleed St. 60
Riyath St. 100 Ali Al Salem St. 60
First Ring Road 100 Ahmad Al Jaber St. 60
Maghreb Expy. 120 Gulf St. 80
Cairo St. 80 Sharq Market 60
Istiqlal St. 100 Jaber Al Mobarak St. 60
RESULT AND DISCUSSION
Ambient data used in the current study are 25ºC for temperature and 40% relative humidity.
This data is used as an input to describe the change of sound levels as one move toward or away
from a sound source; i.e., attenuation coefficient related with temperature and relative humidity,
describes the reduction of sound per unit distance.

TR
AN
SA
CT
ION
S O
N S
CIE
NC
E A
ND
TE
CH
NO
LO
GY
Al-Awadhi & AlKandary, 2017. Transactions on Science and Technology. 4(1), 38 - 47 42
ISSN 2289-8786. http://transectscience.org/
The following assumptions of input data were taken into consideration to generate noise mapping
model:
• Assumption for building data:
• All the buildings have same type of construction material.
• The built-up area will be assumed acoustically hard because it is easy to check in the field.
• There is no occurrence of noise due to façade effect from the wall of the buildings.
• Assumption for traffic data:
• The road traffic includes all types of vehicles such as light vehicles, small vehicles, heavy vehicles
and light trucks.
• The noise is emitted from the centerline of roads.
• The type of road surface is same in the entire study area and it is assumed to be asphaltic concrete.
• The road surface of study area is flat without any undulations in ground surface.
• Assumption for noise absorbing area like open ground:
• The noise absorbing areas such as road material, trees and water is not considered in the noise
calculation model.
• In the noise calculation, only the noise from road traffic is considered not the background noise.
• During noise calculation it is assumed that there is no noise barriers located in the noise map.
GIS has been used to map noise pollution by displaying spatial variations of pollution is via a
contour map. Accordingly, the software generated noise levels model, for three periods of time
during working days as well as weekend, and presented in form of iso-lines, numerical grid. For the
purpose of model calibration, a Sound Level Meter, Casella CEL-490, was utilized to measure the
noise level at 25 different locations in Kuwait city (Fig. 3). The Sound Level Meter (SLM) used for
noise assessment, consists of microphone, amplifier, electronic filter and digital readout. SLM shows
the Sound Pressure Level (SPL),measured in decibel (dB), instant-by-instant using standard
specified time constant responses designated ‘Fast’ and ‘Slow’. Sound Level Meter was calibrated
before and after each measurement. The microphone was set-up on tripods at a height of
approximately 1.5m above the grounds and included full environmental protection against adverse
weather conditions. All noise sources (e.g., traffic, human voices, pumps and other machinery,
wind) were included in the analysis and a distance of at least five meters was maintained from
traffic noise sources during the measurements.
Figure 3. Noise Measurement locations in Kuwait City
TR
AN
SA
CT
ION
S O
N S
CIE
NC
E A
ND
TE
CH
NO
LO
GY
Al-Awadhi & AlKandary, 2017. Transactions on Science and Technology. 4(1), 38 - 47 43
ISSN 2289-8786. http://transectscience.org/
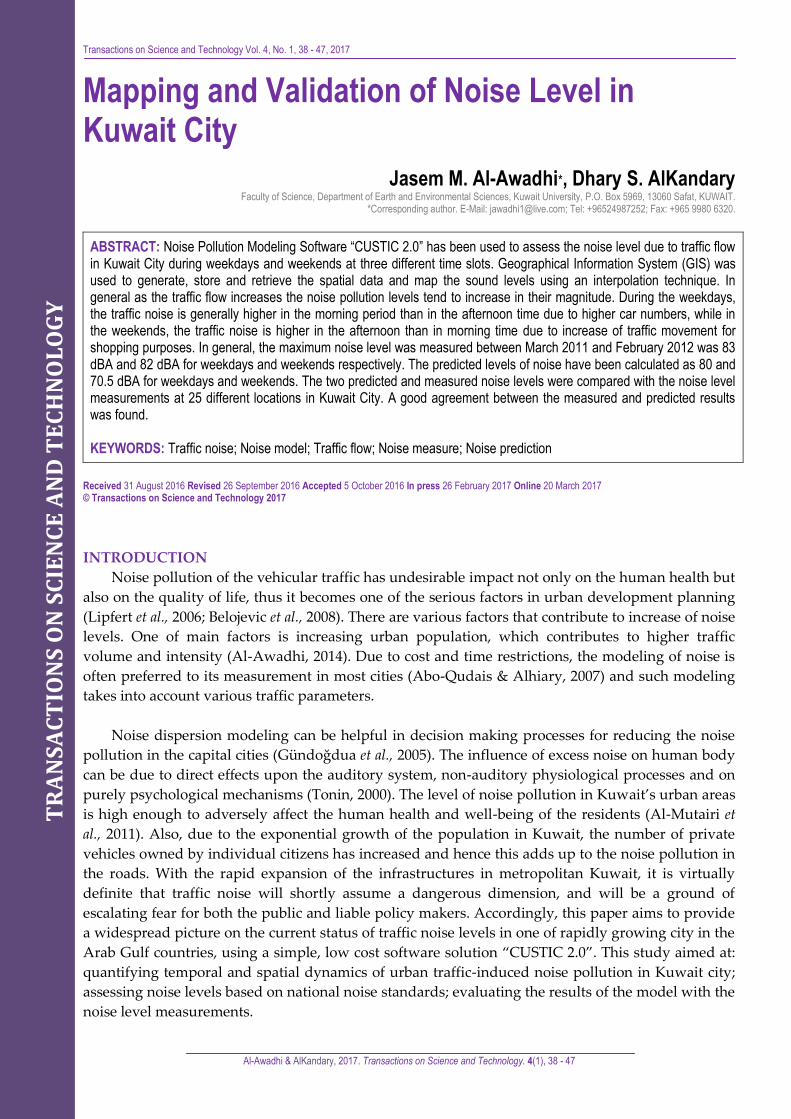
Table 3. Traffic noise level (dBA) during different periods of time
Period Working Days Weekend
Layer Area (km) Percentage Layer Area (km) Percentage
7-14
55-60 1.14 12.21 55-60 3.9 41.65
60-65 4.83 51.61 60-65 3.36 38.84
65-70 2.75 29.46 65-70 1.64 17.54
>70 0.63 6.73 >70 0.18 1.97
14-2
2
55-60 2.06 22.06 55-60 2.7 28.89
60-65 4.55 48.57 60-65 4.32 46.19
65-70 2.35 25.15 65-70 2.04 21.79
>70 0.39 4.22 >70 0.29 3.14
22-7
50-55 0.86 9.16 45-50 0.76 8.09
50-55 4.47 47.76 50-55 4.34 46.44
55-60 2.73 29.27 55-60 2.91 31.13
60-65 1.23 13.21 >60 1.34 14.34
>65 0.06 0.59
Spatial Noise Level
The spatial noise pollution level (Leq) resulting contour maps for Kuwait city during working
days and weekends, and during day and evening times are illustrated in Figures 4 and 5.
(A) (B)
(C)
Figure 4. Contour plots for noise dispersion modeling for morning (period 7-14h), afternoon (period
14-22h) and evening (period 22-7h) during working days

TR
AN
SA
CT
ION
S O
N S
CIE
NC
E A
ND
TE
CH
NO
LO
GY
Al-Awadhi & AlKandary, 2017. Transactions on Science and Technology. 4(1), 38 - 47 44
ISSN 2289-8786. http://transectscience.org/
(A) (B)
(C)
Figure 5. Contour plots for noise dispersion modeling for morning (period 7-14h), afternoon (period
14 22h) and evening (period 22-7h) during working days
The distribution patterns of noise levels in morning and evening periods are generally similar
during weekends, with elevated noise level during evening time. This may confirm that a significant
portion of the noise is generated from vehicles in the city, mostly due to increase of traffic movement
for shopping purposes in the weekend’s evenings. However, distribution patterns of noise levels in
morning and evening period differ during working days; with obvious elevated noise level during
the morning time in the downtown area where many governmental offices, headquarters of most
Kuwaiti corporations and banks are located, while the distribution patterns of noise levels in the
vicinity of the area covering the southwestern entrance to the city remain similar. Table 4 shows the
maximum noise levels predicted by the model during morning, afternoon and evening periods at
working and weekend days.
Table 4. Maximum sound level predicted by the model

TR
AN
SA
CT
ION
S O
N S
CIE
NC
E A
ND
TE
CH
NO
LO
GY
Al-Awadhi & AlKandary, 2017. Transactions on Science and Technology. 4(1), 38 - 47 45
ISSN 2289-8786. http://transectscience.org/
Model calibration
For the purpose of model calibration the measured noise levels at 25 locations in the study area
have been compared with noise levels predicted at the same locations at three time periods during
working and weekend days. The comparison is illustrated in Figures 6 and 7. It appears that there is
a good agreement between the measured and predicted values of the noise level. The predicted
noise levels at most of the locations are lower than noise level values measured with an average
percentage of 8.2%. This might be due to the effect of other noise sources in the vicinity of the
surrounding area beside the traffic noise. Also it may be attributed to the limitations of the acoustic
modeling with respect to ground absorption and meteorological conditions. Nevertheless, noise
attenuates quickly with distance, generally within the range of six dB(A) for every doubling of the
distance between the noise source and the receptor.
(A)
(B)
(C)
Figure 6. Comparison between measured and modeled values of Leq during working days, (A)
period 7-14h, (B) period 14-22h and (C) period 22-7h.

TR
AN
SA
CT
ION
S O
N S
CIE
NC
E A
ND
TE
CH
NO
LO
GY
Al-Awadhi & AlKandary, 2017. Transactions on Science and Technology. 4(1), 38 - 47 46
ISSN 2289-8786. http://transectscience.org/
(A)
(B)
(C)
Figure 7. Comparison between measured and modeled values of Leq during weekend days. (A)
period 7-14h, (B) period 14-22h and (C) period 22-7h.
CONCLUSION
In summary, the following conclusions can be drawn from the current study:
(1) The results demonstrate that the levels of noise in the study area are greater than the national
standard for urban areas (60dBA).
(2) Predicted Equivalent Average Sound Levels were mainly determined by traffic volume.
(3) The adopted model can be used to successfully predict noise pollution and could be useful in
assessing the efficiency of any abatement techniques.
In order to achieve a sustainable transport, a fleet composition change is required. However,
during recent years, number of cars has been increased. As a consequence raising awareness on the
TR
AN
SA
CT
ION
S O
N S
CIE
NC
E A
ND
TE
CH
NO
LO
GY
Al-Awadhi & AlKandary, 2017. Transactions on Science and Technology. 4(1), 38 - 47 47
ISSN 2289-8786. http://transectscience.org/
environmental benefits of non-motorized vehicles can encourage people to reduce noise pollution as
well. This is especially practicable as the city is flat and with no considerable gradient.
ACKNOWLEDGEMENTS
This work was supported by Kuwait University Research Grant No. [SE02/15].The authors
gratefully acknowledge the assistance, co-operation and logistical support provided by Ms Shahrzad
Gashasi from Solutions for Environmental Consultancy Office.
REFERENCES
[1] Abo-Qudais, S. & Alhiary, A. (2007). Statistical models for traffic noise at signalized
intersections. Building and Environment, 42(8), 2939-2948.
[2] Al-Awadhi, J. M. (2014). Noise levels in Kuwait City. Journal of the Gulf and Arabian Peninsula
Studies, 40(154).
[3] Al-Mutairi, N. Z., Al-Attar, M. A. & Al-Rukaibi, F. S. (2011). Traffic-generated noise pollution:
exposure of road users and populations in Metropolitan Kuwait. Evironmental Monitoring and
Assesment, 183, 65–75.
[4] Belojevic, G., Jakovljevic, B., Stojanov, V., Paunovic, K. & Ilic, J. (2008). Urban road-traffic noise
and blood pressure and heart rate in preschool children. Environment International, 34(2), 226-
231.
[5] Gündoğdua, Ö., Gökdağb, M. & Yüksela, F. (2005). A traffic noise prediction method based on
vehicle composition using genetic algorithms. Applied Acoustics, 66(7), 799-809.
[6] Lipfert, F. W., Wyzga, R. E., Baty, J. D. & Miller, J. P. (2006). Traffic density as a surrogate
measure of environmental exposures in studies of air pollution health effects: Long-term
mortality in a cohort of US veterans. Atmospheric Environment, 40(1), 154-169.
[7] Lisa Goines, R. N. & Louis Hagler, M. D. (2007). Noise Pollution, A Modern Plague. Southern
Medical Journal, 100, 287-294.
[8] Tonin, R. (2000). Validation of Environmental Noise Model. Sidney: Renzo Tonin & Pty Ltd.


![Political Theology with a Difference - UCI Lawlaw.uci.edu/lawreview/vol4/no1/Stolzenberg.pdf2014] POLITICAL THEOLOGY WITH A DIFFERENCE 409 intellectual tradition of political theology](https://cdn.vdocuments.us/doc/165x107/5e6ffa4305721f79573f1209/political-theology-with-a-difference-uci-2014-political-theology-with-a-difference.jpg)


