Mapping and Functional Characterization of Candidate Genes
and Mutations for Chicken Growth
An Approach Combining Computational Genetics and Bioinformatics
Muhammad Ahsan Faculty of Veterinary Medicine and Animal Science
Department of Clinical Sciences Uppsala
Doctoral Thesis Swedish University of Agricultural Sciences
Uppsala 2014

Acta Universitatis agriculturae Sueciae 2014:49
ISSN 1652-6880 ISBN (print version) 978-91-576-8046-4 ISBN (electronic version) 978-91-576-8047-1 © 2014 Muhammad Ahsan, Uppsala Print: SLU Service/Repro, Uppsala 2014
Cover: The cover picture is designed by Ronald Nelson. (photo: GeneticAssociation)
Mapping and Functional Characterization of Candidate Genes and Mutations for Chicken Growth. An Approach Combining Computational Genetics and Bioinformatics
Abstract Knowledge of the genetics related to growth is important for breeding chickens with the desired traits of rapid and efficient growth. A long-term selection experiment in the domestic chicken (Gallus gallus) has resulted in two highly divergent lines selected for juvenile body weight. These lines are a great genetic resource to identify the genetic basis of phenotypic variation mainly for growth traits.
The aim of this thesis was to map the relationship between the genotype and phenotype and thereby reveal the genetic architecture of growth in the chicken. To this end, high-density genotyping and whole-genome resequencing of the lines were used to explore the genetics of the body weight difference between these lines. We further fine-mapped previously identified Quantitative Trait Loci (QTLs) for body weight and used bioinformatics approaches to identify the most promising candidate genes, mutations and biological pathways for growth for further functional evaluations. We also studied a previously mapped radial network of interacting QTLs to reveal potential biological interactions by analyzing biological pathways. In addition, we developed new computational genetic method and tools and used them to functionally explore specific genetic variants in selected regions in the genome. To functionally evaluate the effect of identified amino acid substitutions (AAS), we developed and implemented a bioinformatics method in a tool called PASE.
The predictions of PASE, using physicochemical properties of amino acids, were consistent with other widely available homology-based tools. Our mapping strategy successfully fine-mapped the QTLs, and our bioinformatic strategies were efficient in identifying the candidate mutations and biological pathways for growth. The methods we developed could be applied to the genetic dissection of other complex traits. Keywords: SNP, QTL, NGS, Candidate mutations, Association mapping, Imputation, Virginia chicken lines, divergent selection
Author’s address: Muhammad Ahsan, SLU, Department of Clinical Sciences, P.O. Box 7078, 750 07 Uppsala, Sweden E-mail: Muhammad.Ahsan @slu.se

Dedication
To my beloved parents, wife and daughters…

Contents List of Publications 7!
Abbreviations 9!
1! Introduction 11!
2! Background 15!2.1! Animal Models 16!2.2! Research into the Genetics of Growth: Virginia Chicken Lines 17!2.3! Chicken Karyotype 17!2.4! Gene Mapping and Association Studies 19!
2.4.1! QTL Analysis 19!2.4.2! Genome-Wide Association Analysis 21!
2.5! Genome Resequencing and High-Density SNP Genotyping 22!2.6! Genotype Imputation 24!2.7! Functional Annotation 25!
3! Aims of the thesis 27!
4! Summaries of the investigations 29!4.1! Paper I 29!
4.1.1! Method implementation 31!4.1.2! Results and discussion 33!
4.2! Paper II 34!4.2.1! Materials and methods 35!4.2.2! Results and discussion 36!
4.3! Paper III 39!4.3.1! Materials and methods 40!4.3.2! Results and discussion 41!
4.4! Paper IV 45!4.4.1! Materials and method 45!4.4.2! Results and discussion 46!
5! Future Research Strategies 49!
6! Conclusions 51!6.1! Paper I 51!6.2! Paper II 52!

6.3! Papers III and IV 52!
References 53!
Acknowledgements 57!

7
List of Publications
This thesis is based on the work contained in the following papers, referred to by Roman numerals in the text:
I Xidan Li, Marcin Kierczak, Xia Shen, Muhammad Ahsan, Örjan Carlborg and Stefan Marklund. PASE: a novel method for functional prediction of amino acid substitutions based on physicochemical properties. Frontiers in Genetics, 2013, doi: 10.3389/fgene.2013.00021
II Muhammad Ahsan, Paul B. Siegel and Örjan Carlborg. Evaluation of an imputation-based fine-mapping strategy in an outbred chicken Advanced Intercross Line (AIL). (manuscript)
III Muhammad Ahsan, Xidan Li, Andreas E Lundberg, Marcin Kierczak, Paul B Siegel, Örjan Carlborg and Stefan Marklund. Identification of candidate genes and mutations in QTL regions for chicken growth using bioinformatic analysis of NGS and SNP-chip data. Frontiers in Genetics, 2013. doi: 10.3389/fgene.2013.00226.
IV Xidan Li, Muhammad Ahsan, Andreas E Lundberg, Marcin Kierczak, Paul B Siegel, Örjan Carlborg and Stefan Marklund. Revealing candidate biological interactions underlying epistatic QTLs for chicken growth. (manuscript)
Papers I and III are reproduced with the permission of the publishers.

8
The contribution of Muhammad Ahsan to the papers included in this thesis was as follows:
I Partly planned the study, evaluated the algorithm and contributed towards manuscript drafting and revision.
II Planned the study, performed the whole statistical analysis, compiled the results and wrote the manuscript.
III Partly planned the study, performed majority of the region-targeted computations and analysis, compiled the results and wrote the manuscript.
IV Partly planned the study, performed half of the analysis, compiled the results and revised the drafted manuscript.

9
Abbreviations
AAS Amino Acid Substitution AF Allele Frequency AFD Allele Frequency Difference AIL Advanced Intercross Line BW56 Body Weight at 56 days of age DAVID Database for Annotation, Visualization and Integrated Discovery DNA Deoxyribo Nucleic Acid FSV Flanking SNP Value GGA Gallus gallus (chicken) Autosome HWS High-Weight-Selected KEGG Kyoto Encyclopaedia of Genes and Genomes LWS Low-Weight-Selected NGS Next Generation Sequencing nsSNP non-synonymous Single Nucleotide Polymorphism PASE Predicting Amino acid Substitutions’ Effect QTL Quantitative Trait Loci RJF Red Jungle Fowl SNP Single Nucleotide Polymorphism VEP Variant Effect Predictor

10
11
1 Introduction
The hereditary material DNA is structured to carry the genes, the basic unit of heredity, in the chromosomes within the nucleus of all cells. The genetic information is transmitted from parent to offspring. According to the central dogma of molecular biology, the genetic information flows from DNA to RNA and finally to proteins. These proteins play a major role in determining different phenotypes, such as body weight, height and colour. Diploid organisms carry two copies of every chromosome, receiving one copy from each parent, therefore, receiving two copies of every gene, one from each parental chromosome. Different forms of the gene are called alleles. These alleles give rise to a genotype at a particular locus, a location on a chromosome. Same alleles of a gene result in homozygous genotype whereas different alleles give rise to heterozygoous genotypes. The adjacent set of alleles of different genes along a chromosome of an individual is characterized as a haplotype and each individual carry two haplotypes owing to homologous chromosomes. Related individuals resemble each other because they carry shared alleles (Lynch & Walsh, 1998).
Two types of traits have been classified in plants and animals, generally based on the number of genes involved in their expression of phenotypes. Qualitative traits are influenced only by a single gene or very few genes and their gene effects can be easily classified into distinct phenotype classes due to their discrete expressions, whereas the quantitative (multifactorial or complex) traits are not only controlled by multiple genes but also by multiple non-genetic environmental factors showing a continuous variation in the trait phenotype (Lynch & Walsh, 1998). Mendelian traits are qualitative where, for instance, the phenotype of seed colour of pea plants can be classed into different colours. Most traits and diseases in human and animals are quantitative in nature and result from an interplay of genetic and environmental

12
factors, making the genetic architecture of such traits and disease challenging to reveal.
DNA variation (or genetic variation) is an important contributor to the phenotypic differences observed among individuals of a species. Selective breeding for desired phenotypes of animals, such as meat and egg traits in the domestic chicken, has resulted in different genetic makeups of selected individuals and an enrichment of variants essential for the expression of traits. Functional annotation and characterization of the identified DNA variation is necessary to pinpoint the functional variants associated with complex traits. DNA and/or RNA sequencing is conducted in most genome projects for various kinds of functional genomic studies that also generate genetic variation data. Many bioinformatics integrated resources are freely available for researchers to characterize these mutations. The functional characterization of genetic variation enables the researchers to identify putative functional mutations underlying traits of interest.
Lines of animals divergently selected for particular traits in controlled environments are a great genetic resource to identify the genetic basis of phenotypic variation in complex traits and a good model for identifying genes involved in the regulation of related traits in humans (Hill, 2005; Simmons, 2008). The selected populations display greater phenotypic divergence for the selected phenotypes than populations, which are bred commercially for composite phenotypes. Such divergent lines provide opportunities for in-depth research of genetic factors underlying the selection response for the trait (Andersson & Georges, 2004). Many of the important agricultural traits in animals are concerned with metabolism, growth and feeding-behaviour. Therefore, these divergently selected lines of domesticated species of animals ultimately become a good model for translational studies in human medicine for exploring the genetic architecture of related problems of e.g. obesity and diabetes (Andersson, 2001).
Initiated in 1957, a long-term selection experiment in chicken has resulted in two chicken lines divergently selected for either high or low body weight at 56-days of age: the High-Weight-Selected (HWS) and the Low-Weight-Selected (LWS) Virginia lines, which after about 50 generations of selection, display a 12-fold difference in body weight at selection age (Marquez et al., 2010; Dunnington et al., 2013). Genotype data from a SNP-chip with nearly 60,000 genetic markers and SNPs called from whole-genome resequencing of the divergent lines, were used to explore the genetic basis of the differences in body weight between these lines (Ahsan et al., 2013; Marklund & Carlborg, 2010).

13
Quantitative Trait Loci (QTL) mapping endeavours to statistically associate phenotypic data of a quantitative trait with the genotypic data to explain the variation in the trait phenotype due to genetic variation. QTL mapping reveals chromosomal segments, including a single gene or many genes, which affect the studied phenotypes through their independent additive effects or by gene-gene interaction (epistatic interactions). To reveal the genomic loci underlying different metabolic traits, body-weight and body-stature in Virginia lines, an F2-cross was performed in generation 40 of HWS and LWS lines, and many QTLs with small marginal effects on body weight at 56 days of age (BW56) and a network of interacting QTLs for the same trait were reported (Carlborg et al., 2006; Jacobsson et al., 2005; Park et al., 2006; Wahlberg et al., 2009). From the parents of the same F2-cross, a nine-generation Advanced Intercross Line (AIL) was developed to replicate and fine-map the QTLs reported in the earlier F2-cross studies (Besnier et al., 2011; Pettersson et al., 2011).
In this thesis, my aim was to use genetic variation in Virginia lines to elucidate the underlying genetic mechanism responsible for enormous body weight difference between these lines, and to reveal genes and mutations that can be considered as candidates for further functional studies of their effects on growth. Specific genetic variants in coding regions of genes may cause amino acid substitutions (AAS) in proteins. Therefore, we started by developing a bioinformatics method to functionally evaluate the effect of these AAS. This bioinformatics method was developed and implemented in a tool to evaluate all these potentially functional variants based on the physicochemical properties of the substituted amino acids.
Previously identified QTLs for BW56 in the Virginia chicken lines were so spread out along the chromosomes that it included millions of basepairs for further bioinformatic investigations for candidate genes and mutations for growth. It was imperative, therefore, to further fine-map the reported QTLs. Starting from a previously reported fine-mapping experiment using AIL, the QTLs were further fine-mapped through an imputation-based association-mapping based approach utilizing data from 60K individual SNP-chip genotyping from these lines. Fine-mapped regions were analysed bioinformatically to identify the most promising candidate genes, mutations and biological pathways for body weight for further functional evaluations. A previously mapped radial-network of interacting QTLs (Carlborg et al., 2006; Pettersson et al., 2011) was also studied in detail to reveal potential biological interactions by analysing pathways including genes and mutations from the genomic regions harbouring the interacting QTLs.
The results and methods are important for future animal improvement programmes, but that can be generalized to study related traits in any species

14
including humans. In this way, this thesis presents an important insight into complex trait genetics.
15
2 Background
The central dogma of molecular biology describes the flow of genetic information from genetic material DNA (Deoxyribonucleic acid) to RNAs (Ribonucleic acid) to proteins. Specifically, a protein-coding gene is transcribed into mRNA (messenger RNA) and that, in turn, is translated into a protein. These proteins carry out a number of cellular functions thereby play an important role in determining phenotypes within a living organism. The field of quantitative genetics endeavours to find the relationship between genotype i.e. the genetic makeup of the organisms and their complex phenotypes.
In this thesis the prime aim was to reveal the relationship of the growth, in terms of juvenile body weight in chicken, and the genetic variations present in outbred Virginia chicken lines, selected for divergent body weight at 8-weeks of age. These lines show an enormous difference (12-fold) in body weight at selection age after about 50 generations of selection (Marquez et al., 2010, Dunnington et al., 2013). We were particularly interested in understanding how this large phenotypic difference for body weight between these divergent lines occurred and which is the most candid underlying genetic variation contributing to this phenotypic variation. To achieve this aim, we, first, developed and implemented a bioinformatics method in a tool, called PASE (Prediction of Amino Acid’s Substitution Effect). The PASE uses physicochemical properties of amino acids to predict the effects of amino acid substitutions (AAS) on protein structure and function. The PASE software was used to evaluate the genetic variations that led to AASs in proteins in the selected genomic regions in these chicken lines. Second, a previous study mapped QTLs (Quantitative Trait Loci) of large confidence interval for body weight at 8-weeks of age using linkage analysis approach (Jacobsson et al., 2005; Besnier et al., 2011). As the bioinformatic analysis of the genomic regions for identifying phenotype-contributing genes and mutations is more efficient for smaller regions including fewer genes, therefore, we developed a
16
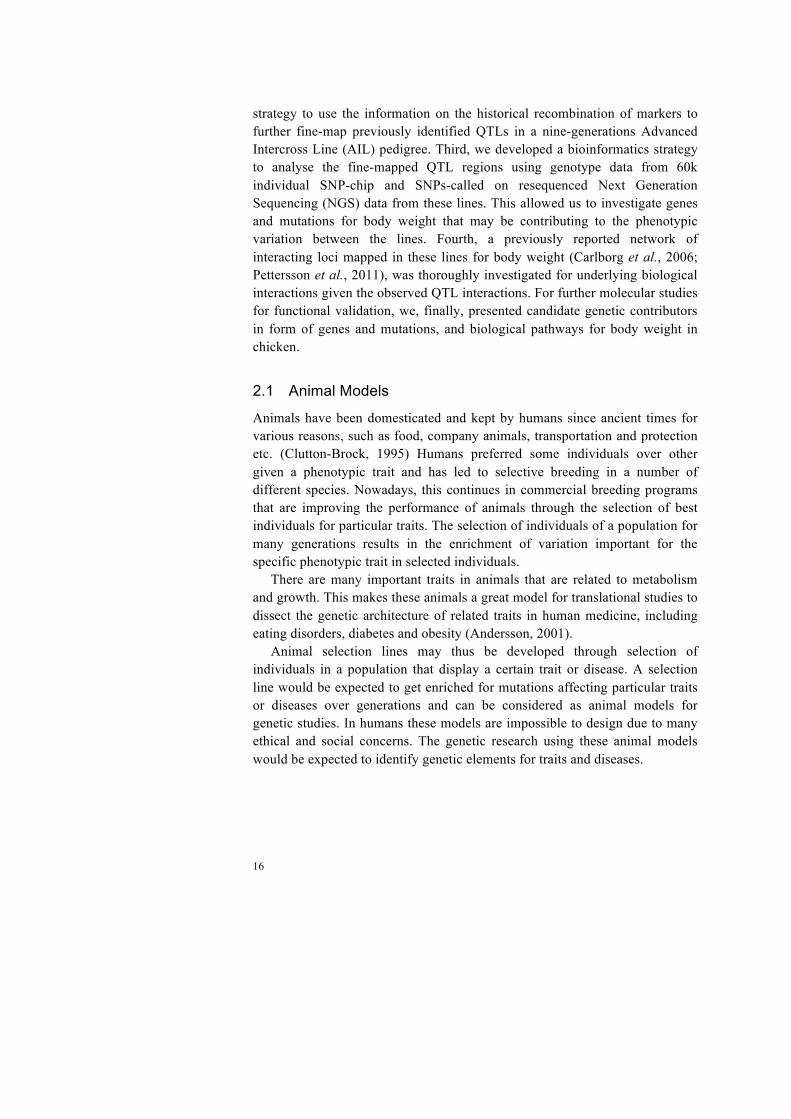
strategy to use the information on the historical recombination of markers to further fine-map previously identified QTLs in a nine-generations Advanced Intercross Line (AIL) pedigree. Third, we developed a bioinformatics strategy to analyse the fine-mapped QTL regions using genotype data from 60k individual SNP-chip and SNPs-called on resequenced Next Generation Sequencing (NGS) data from these lines. This allowed us to investigate genes and mutations for body weight that may be contributing to the phenotypic variation between the lines. Fourth, a previously reported network of interacting loci mapped in these lines for body weight (Carlborg et al., 2006; Pettersson et al., 2011), was thoroughly investigated for underlying biological interactions given the observed QTL interactions. For further molecular studies for functional validation, we, finally, presented candidate genetic contributors in form of genes and mutations, and biological pathways for body weight in chicken.
2.1 Animal Models
Animals have been domesticated and kept by humans since ancient times for various reasons, such as food, company animals, transportation and protection etc. (Clutton-Brock, 1995) Humans preferred some individuals over other given a phenotypic trait and has led to selective breeding in a number of different species. Nowadays, this continues in commercial breeding programs that are improving the performance of animals through the selection of best individuals for particular traits. The selection of individuals of a population for many generations results in the enrichment of variation important for the specific phenotypic trait in selected individuals.
There are many important traits in animals that are related to metabolism and growth. This makes these animals a great model for translational studies to dissect the genetic architecture of related traits in human medicine, including eating disorders, diabetes and obesity (Andersson, 2001).
Animal selection lines may thus be developed through selection of individuals in a population that display a certain trait or disease. A selection line would be expected to get enriched for mutations affecting particular traits or diseases over generations and can be considered as animal models for genetic studies. In humans these models are impossible to design due to many ethical and social concerns. The genetic research using these animal models would be expected to identify genetic elements for traits and diseases.
17
2.2 Research into the Genetics of Growth: Virginia Chicken Lines
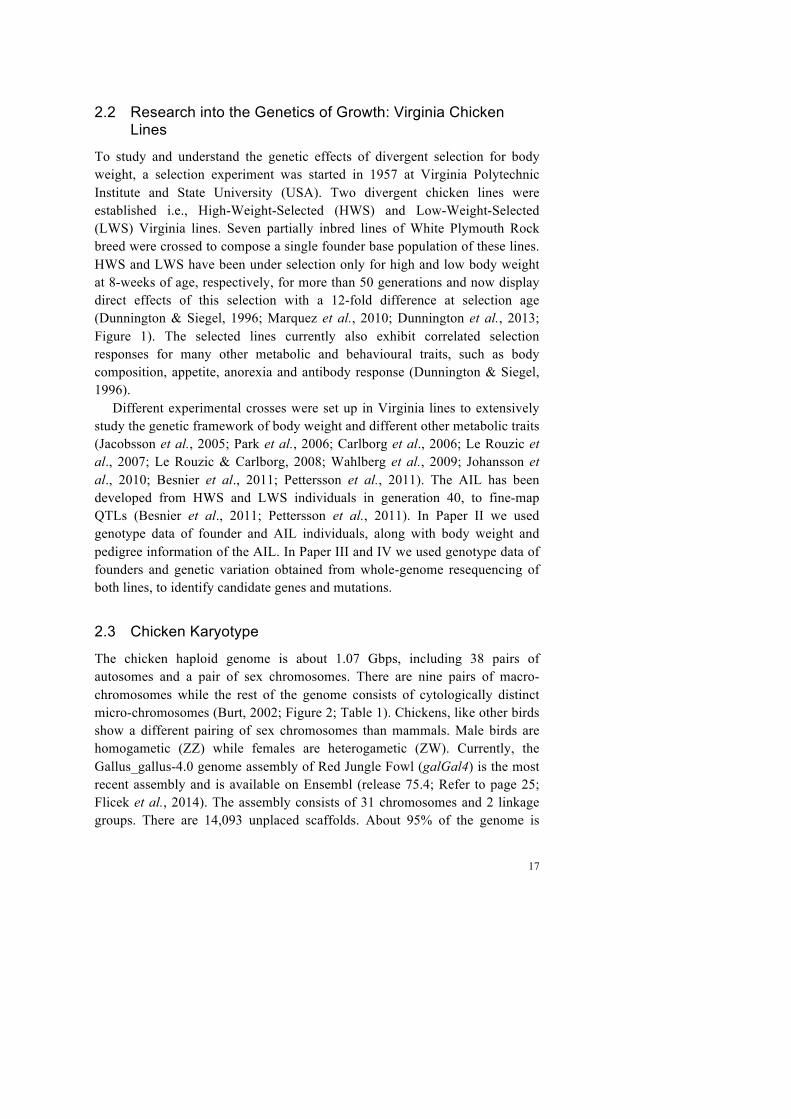
To study and understand the genetic effects of divergent selection for body weight, a selection experiment was started in 1957 at Virginia Polytechnic Institute and State University (USA). Two divergent chicken lines were established i.e., High-Weight-Selected (HWS) and Low-Weight-Selected (LWS) Virginia lines. Seven partially inbred lines of White Plymouth Rock breed were crossed to compose a single founder base population of these lines. HWS and LWS have been under selection only for high and low body weight at 8-weeks of age, respectively, for more than 50 generations and now display direct effects of this selection with a 12-fold difference at selection age (Dunnington & Siegel, 1996; Marquez et al., 2010; Dunnington et al., 2013; Figure 1). The selected lines currently also exhibit correlated selection responses for many other metabolic and behavioural traits, such as body composition, appetite, anorexia and antibody response (Dunnington & Siegel, 1996).
Different experimental crosses were set up in Virginia lines to extensively study the genetic framework of body weight and different other metabolic traits (Jacobsson et al., 2005; Park et al., 2006; Carlborg et al., 2006; Le Rouzic et al., 2007; Le Rouzic & Carlborg, 2008; Wahlberg et al., 2009; Johansson et al., 2010; Besnier et al., 2011; Pettersson et al., 2011). The AIL has been developed from HWS and LWS individuals in generation 40, to fine-map QTLs (Besnier et al., 2011; Pettersson et al., 2011). In Paper II we used genotype data of founder and AIL individuals, along with body weight and pedigree information of the AIL. In Paper III and IV we used genotype data of founders and genetic variation obtained from whole-genome resequencing of both lines, to identify candidate genes and mutations.
2.3 Chicken Karyotype
The chicken haploid genome is about 1.07 Gbps, including 38 pairs of autosomes and a pair of sex chromosomes. There are nine pairs of macro-chromosomes while the rest of the genome consists of cytologically distinct micro-chromosomes (Burt, 2002; Figure 2; Table 1). Chickens, like other birds show a different pairing of sex chromosomes than mammals. Male birds are homogametic (ZZ) while females are heterogametic (ZW). Currently, the Gallus_gallus-4.0 genome assembly of Red Jungle Fowl (galGal4) is the most recent assembly and is available on Ensembl (release 75.4; Refer to page 25; Flicek et al., 2014). The assembly consists of 31 chromosomes and 2 linkage groups. There are 14,093 unplaced scaffolds. About 95% of the genome is

18
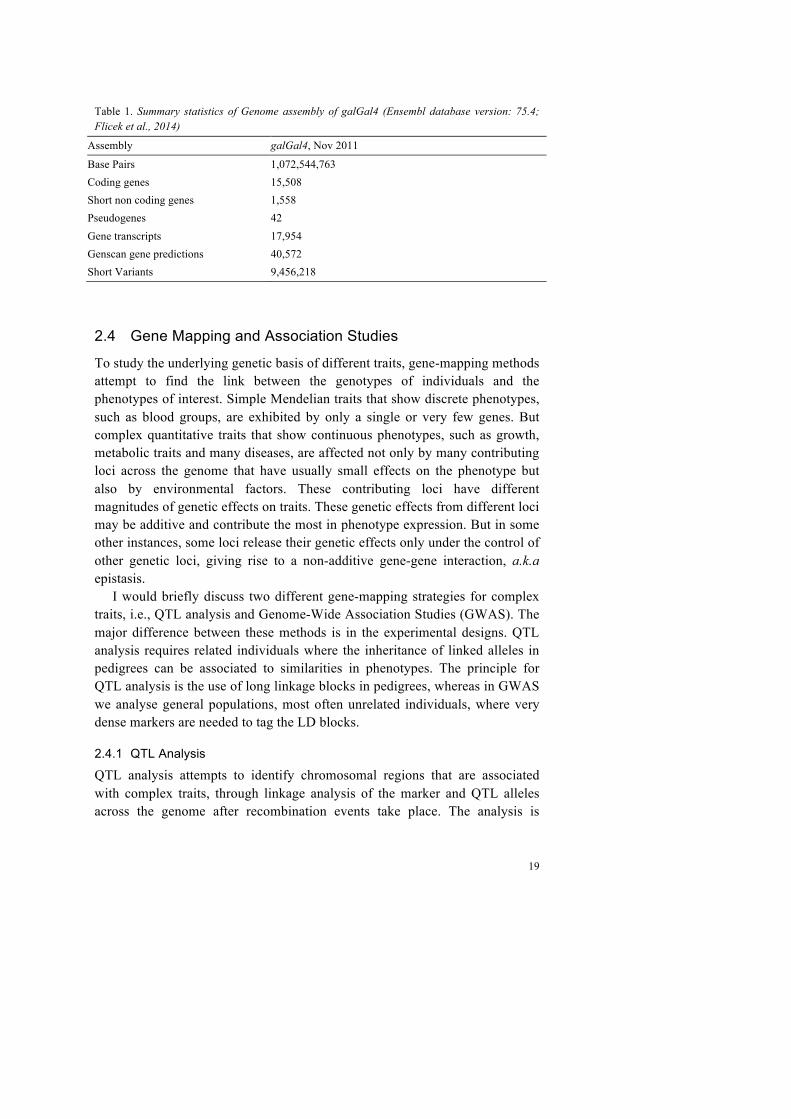
anchored to Chromosome 1-28, 32, sex chromosomes and two linkage groups (Ensembl release 70; Refer to page 25; Flicek et al., 2014). Table 1 summarizes the genomic information for galGal4.
Figure 1. The figure shows a LWS bird on the back of an HWS bird, both at the selection age of 8-weeks at generation 49 of selection (Photo: Paul B. Siegel). Note the difference in size.
Figure 2. Chicken karyotype (Ensembl database version: 75.4)
19
Table 1. Summary statistics of Genome assembly of galGal4 (Ensembl database version: 75.4; Flicek et al., 2014)
Assembly galGal4, Nov 2011
Base Pairs 1,072,544,763
Coding genes 15,508
Short non coding genes 1,558
Pseudogenes 42
Gene transcripts 17,954
Genscan gene predictions 40,572
Short Variants 9,456,218
2.4 Gene Mapping and Association Studies
To study the underlying genetic basis of different traits, gene-mapping methods attempt to find the link between the genotypes of individuals and the phenotypes of interest. Simple Mendelian traits that show discrete phenotypes, such as blood groups, are exhibited by only a single or very few genes. But complex quantitative traits that show continuous phenotypes, such as growth, metabolic traits and many diseases, are affected not only by many contributing loci across the genome that have usually small effects on the phenotype but also by environmental factors. These contributing loci have different magnitudes of genetic effects on traits. These genetic effects from different loci may be additive and contribute the most in phenotype expression. But in some other instances, some loci release their genetic effects only under the control of other genetic loci, giving rise to a non-additive gene-gene interaction, a.k.a epistasis.
I would briefly discuss two different gene-mapping strategies for complex traits, i.e., QTL analysis and Genome-Wide Association Studies (GWAS). The major difference between these methods is in the experimental designs. QTL analysis requires related individuals where the inheritance of linked alleles in pedigrees can be associated to similarities in phenotypes. The principle for QTL analysis is the use of long linkage blocks in pedigrees, whereas in GWAS we analyse general populations, most often unrelated individuals, where very dense markers are needed to tag the LD blocks.
2.4.1 QTL Analysis
QTL analysis attempts to identify chromosomal regions that are associated with complex traits, through linkage analysis of the marker and QTL alleles across the genome after recombination events take place. The analysis is

20
performed often on a crossed population originating from crosses of two or more founder populations. The founder populations differ in phenotype of interest. There are two common types of experimental crosses that are used in QTL mapping analysis, i.e., F2-cross and Backcross design. The F2-cross is advantageous over backcross in that the parents that are homozygous for alternative alleles produce all three genotypes in the F2 generation, i.e., heterozygotes and both homozygous genotypes. This allows the estimation of additive, dominance and epistatic genetic effects. On the other hand, a single-backcross design would produce heterozygotes and only one homozygous genotype from the same parental populations. Backcrossing to both homozygous parental populations is therefore needed to produce all three genotypes. The prerequisites of QTL mapping are, therefore, (1) two or more founder populations that differ distinctly in the trait of interest, to produce an F2 or a Backcross generation and (2) genetic markers (SNPs, microsatellites etc.) that tags the DNA at different position preferably evenly spread through the genome in all three generations of the experimental cross. Parental lines are often assumed to be fixed for alternative alleles at QTL when they are crossed and produce heterozygous F1 individuals. Intercrossing of F1 individuals would recombine these marker and QTL alleles in F2. Through linkage analysis in F2 individuals, the linked markers and QTLs segregating together with trait values can be traced and only the linked markers would show significant association with the phenotype.
The simplest statistical method for QTL mapping is a single factor Analysis of Variance (ANOVA) modelled with different genotypes of a single marker at each marker loci (Broman, 2000; Model 1). A significant difference in phenotypes between marker genotypes indicates a marker linked to a QTL.
!!" = !! + !!! + !!" (Model 1) where !!" is the phenotype value of the ith individual with marker genotype j, ! is the overall mean, !! is the effect of marker j!and !!" is the residual error term which is assumed to be normally distributed.
A genome-wide significance threshold is needed to cater for multiple testing and is usually calculated using permutation testing.
The currently used technique for QTL analysis is Interval mapping (modified from Lander & Botstein, 1989), which estimates the QTL position in the interval between two adjacent markers and their associations with the trait. Test statistics of Logarithms of the Odds (LOD) score or Likelihood ratios are calculated to represents statistical support for QTL in this method (Figure 3). QTL mapping using F2-crosses results in the identification of long QTL

21
regions between very distant markers owing to only one generation of recombination. More generations of intercrossing (for instance, Advanced Intercross Lines) are needed to allow more recombinations to happen between linked alleles at marker and QTL in individuals. Genotyping of individuals in every generation at higher marker resolution may be needed to detect these recombination events for fine-mapping of regions with smaller confidence intervals.
2.4.2 Genome-Wide Association Analysis
GWAS require general populations, usually of unrelated individuals. Sampling could be from random mating populations but experimental crosses are not precluded from GWAS. Large sample size to increase power in association analysis is, however, often considered an important factor in GWAS (Wang et al., 2005; Liu et al., 2014). The F2-cross individuals exhibit large LD blocks and require fewer markers to map QTLs but in GWAS there are usually no such large blocks when individuals are randomly sampled from a natural population. Therefore, a very high-density marker map is needed to detect very small LD blocks in these individuals. The simplest way to test for association is single marker analysis. All markers can be modelled as in Model 1 for association analysis. A Manhattan plot represents the test statistics for all the tested markers along the genome to detect the associations with the phenotype (Figure 4). A group of markers linked to a specific chromosomal region would show association that could be significant. To correct for multiple testing
Figure 3. Hypothetical test statistics (coloured red) plotted at tested position along the chromosome in QTL analysis. Only the positions that show scores greater than the genome-wide significance threshold (blue line) are considered significantly associated with the phenotype.

22
Bonferroni correction or permutation testing can be chosen to set a genome-wide significance threshold.
Nowadays, GWAS is the method of choice in most genetic association studies in humans as well as in other species due to the availability of high-density genotyping of markers. Humans can be phenotyped for traits of interest and genotyped on high-density SNP arrays to carry out GWAS.
Figure 4. A Manhattan plot of markers tested for association in a GWAS along the genome. X-axis shows the tested markers on each chromosome (coloured differently to delimit markers on adjacent chromosomes). Y-axis represents the transformed value of the test statistic (P-value) for each marker in the study. Only the markers that show values greater than the genome-wide significance threshold (red line) are considered significantly associated with the phenotype. The plot is not based on a real dataset
2.5 Genome Resequencing and High-Density SNP Genotyping
With the advent of the Next Generation Sequencing (NGS), more and more genomes are being sequenced generating data at an unprecedented scale. Many biologically important species have their complete genomes sequenced and are available as a reference for resequencing of interesting populations in different
23
studies. It has now become affordable to resequence interesting sub-populations as well as individuals to mine virtually every genetic polymorphism. Currently, there are several NGS platforms available and any of these may be chosen according to the specific needs of the research projects.
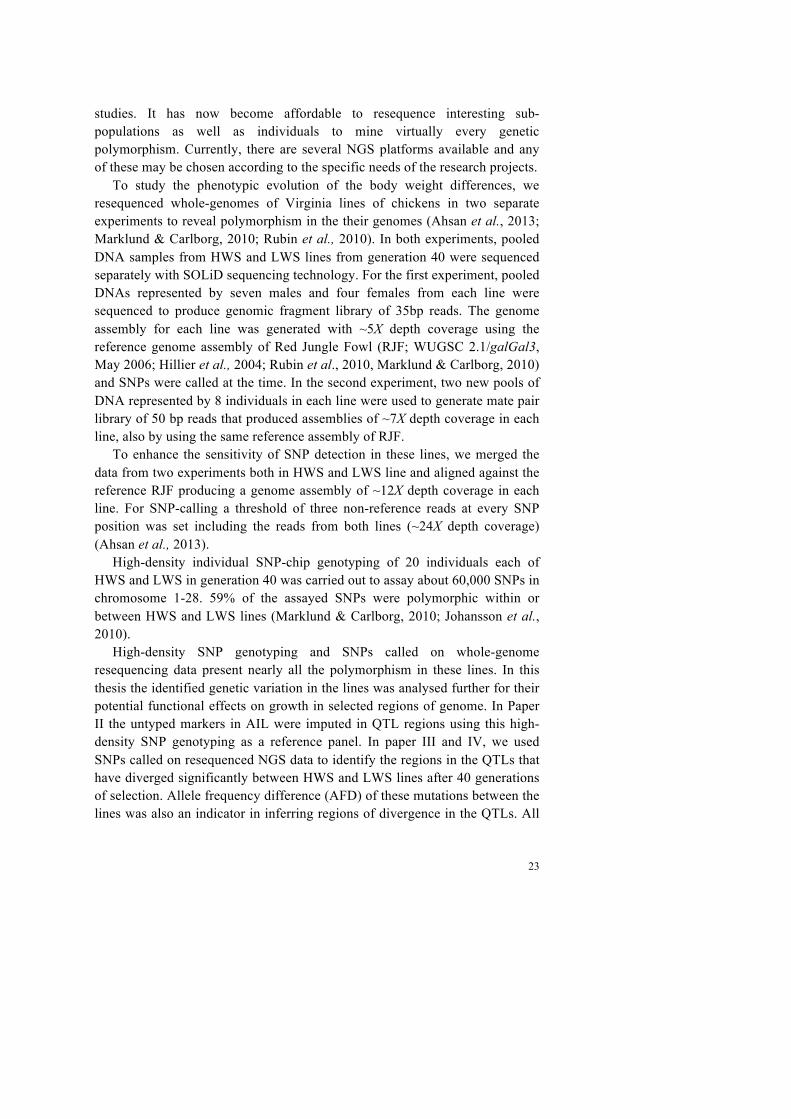
To study the phenotypic evolution of the body weight differences, we resequenced whole-genomes of Virginia lines of chickens in two separate experiments to reveal polymorphism in the their genomes (Ahsan et al., 2013; Marklund & Carlborg, 2010; Rubin et al., 2010). In both experiments, pooled DNA samples from HWS and LWS lines from generation 40 were sequenced separately with SOLiD sequencing technology. For the first experiment, pooled DNAs represented by seven males and four females from each line were sequenced to produce genomic fragment library of 35bp reads. The genome assembly for each line was generated with ~5X depth coverage using the reference genome assembly of Red Jungle Fowl (RJF; WUGSC 2.1/galGal3, May 2006; Hillier et al., 2004; Rubin et al., 2010, Marklund & Carlborg, 2010) and SNPs were called at the time. In the second experiment, two new pools of DNA represented by 8 individuals in each line were used to generate mate pair library of 50 bp reads that produced assemblies of ~7X depth coverage in each line, also by using the same reference assembly of RJF.
To enhance the sensitivity of SNP detection in these lines, we merged the data from two experiments both in HWS and LWS line and aligned against the reference RJF producing a genome assembly of ~12X depth coverage in each line. For SNP-calling a threshold of three non-reference reads at every SNP position was set including the reads from both lines (~24X depth coverage) (Ahsan et al., 2013).
High-density individual SNP-chip genotyping of 20 individuals each of HWS and LWS in generation 40 was carried out to assay about 60,000 SNPs in chromosome 1-28. 59% of the assayed SNPs were polymorphic within or between HWS and LWS lines (Marklund & Carlborg, 2010; Johansson et al., 2010).
High-density SNP genotyping and SNPs called on whole-genome resequencing data present nearly all the polymorphism in these lines. In this thesis the identified genetic variation in the lines was analysed further for their potential functional effects on growth in selected regions of genome. In Paper II the untyped markers in AIL were imputed in QTL regions using this high-density SNP genotyping as a reference panel. In paper III and IV, we used SNPs called on resequenced NGS data to identify the regions in the QTLs that have diverged significantly between HWS and LWS lines after 40 generations of selection. Allele frequency difference (AFD) of these mutations between the lines was also an indicator in inferring regions of divergence in the QTLs. All

24
these mutations were annotated using Variant Effect Predictor (VEP; McLaren et al., 2010) to identify their locations relative to genes in chicken genome and their potential functional effects on proteins. Identified AASs, resulting from non-synonymous SNPs, were scored using PASE software to estimate their potential impact on protein structure and/or function.
2.6 Genotype Imputation
A number of factors may contribute to the lack of signal in association studies including no association at all, sparseness of typed SNPs and false negatives etc. Genotype imputation has been shown to enhance power, fine-map association signals and enable meta-analysis studies to be conducted after combining results from different studies (Marchini & Howei, 2010). The association signals may be boosted through testing for association at imputed SNPs (Figure 5). The genotype imputation methods are used mainly to impute untyped as well as missing SNP genotypes using reference marker data. This is also used to correct genotype errors that may help control false positives. In human studies reference data could be any of these datasets: (1) HapMap data, (2) 1000 genomes data, (3) SNP array data etc., but for non-human species only resequencing and SNP array data may be available as reference data. Knowledge about the haplotype structure in the population is required for imputation. Imputation methods usually phase individuals at all typed SNPs before the haplotypes from the dense reference data can be used to impute untyped and missing SNPs into the haplotypes of individuals that are genotyped for a subset of SNPs (Marchini & Howei, 2010; Daetwyler et al., 2011).
The fine-mapping study in this thesis (Paper II) took advantage of the genotype imputation to boost power and resolution of the QTLs. ChromoPhase software (Daetwyler et al., 2011) utilizes pedigree information to gain the knowledge about the haplotype structure in the population. We used ChromoPhase to phase and impute genotypes in a nine-generation AIL pedigree (1529 individuals) by using high-density SNP-chip genotypes from founders as a reference panel. The individuals in the pedigree are from closely related subsequent generations, sharing relatively long and similar haplotypes to help efficient and precise phasing and imputation.

25
Figure 5. Comparison of association signals from hypothetical different marker sets: The plot on the left shows typed (coloured green) markers only, whereas the plot on the right shows both typed (coloured green) and imputed (coloured orange) markers that boost the association signal.
2.7 Functional Annotation
Most genomic projects use DNA and/or RNA sequencing to carry out different kinds of functional studies. In these studies reference genomic databases are useful for annotation of identified genomic elements. Nowadays, many integrated bioinformatic resources are available online for researchers to utilize genomic information in their own projects. The most popular genomic resources include Ensembl (Flicek et al., 2014) and UCSC (Karolchik et al., 2014) genome browsers (Barnes, 2010). Several sources of information including known EST, mRNAs, genes and protein information are used to annotate new genes in different species. The ab initio tools for gene identification, such as GenScan (Burge & Karlin, 1997) and N-Scan (Gross & Brent, 2006), are also used for newly sequenced species. These genome browsers deliver fundamental information for genomes including e.g. genes, genetic variation, regulatory elements and conservation. They also supply different levels of annotation in several species, from a single base to full chromosomes and by that address many problems in genomics (Pevsner, 2009).
To functionally characterize genes and gene products, Gene Ontology database (GO; Ashburner et al, 2000) is widely used in life sciences. This database provides consistent biological ontology that can be widely applied to any species. The structured and controlled vocabulary of GO terms makes it possible to consistently describe the biological functions of gene products (Yu & Hinchcliffe, 2011).
Biological pathways are involved in metabolism, gene regulation and signal transduction. These pathways are comprised of interacting biological molecules to perform different functions. Many of these pathways are curated in Kyoto Encyclopaedia of Genes and Genomes (KEGG; Kanehisa et al., 2012,

26
2014). Papers III and IV in this thesis used KEGG pathways. The genes in selected genomic regions within QTLs were mapped to several KEGG pathways to reveal biological interaction networks that underlie interacting loci.
There are many bioinformatic resources available for genomics research and investigating them individually for annotation of a large set of genes is laborious and very time consuming. The Database for Annotation, Visualization and Integrated Discovery (DAVID; Huang et al., 2009a, 2009b) provides functional analysis tools for batches of genes. A gene list can be submitted to DAVID for annotation enrichment analysis. There are almost 40 categories to which the annotations for the submitted genes can be combined and analysed. These categories include e.g. GO terms, biological pathways, protein-protein interactions, homology, disease associations and literature mining. The functional analysis provides a consistent and organized annotation originating from several biological angles for all the genes in the batch. DAVID also provides the Pathway Viewer tool to visualize genes in the batch on pathway maps useful to decipher biological interaction networks. In Paper III and IV we analysed genes in selected regions of fine-mapped QTLs using DAVID and presented candidate genes associated with body weight in chicken.

27
3 Aims of the thesis
This thesis aims at revealing the genetic architecture of complex trait of growth in the chicken using computational and bioinformatics methods. This involves mapping genetic associations of the trait of growth and further exploring the genetic elements involved in this complex trait efficiently, utilizing data both from high-throughput Next Generation Sequencing (NGS) and high-density individual SNP-chip genotyping. This also requires the development of new bioinformatics methods to identify and characterize mutations that cause highly divergent growth phenotype in Virginia chicken lines.

28

29
4 Summaries of the investigations
To study the effects of long-term divergent selection for juvenile body weight, the Virginia lines have previously been used extensively to map the genetic regions underlying huge body weight differences between these lines after 40 generations of selection. We were interested in understanding how the lines have diverged phenotypically for body weight. Since we knew that polymorphisms in the mapped QTL regions existed across the genome, which could contribute to the differences between lines, we resequenced the HWS and LWS lines to identify all polymorphisms in these regions. We devised efficient bioinformatic strategies to prioritize and identify the candidate causative polymorphism. To do this, we first developed a method (Paper I) to evaluate which coding mutations were most likely to alter protein function. As the QTL regions were spread out over megabases even after fine-mapping, we also developed a method to narrow down the QTL regions using an association mapping approach that utilizes historical recombinations to increase resolution compared to the earlier-used linkage mapping approach (Besnier et al., 2011). Papers III & IV describe how such information is implemented in bioinformatics pipelines where multiple sources of information are integrated to prioritize the most interesting polymorphisms for further molecular studies.
4.1 Paper I
PASE: A novel method for functional prediction of amino acid substitutions based on physicochemical properties
High-throughput Next Generation Sequencing (NGS) data of DNA from the resequenced individuals, when compared with genome sequence of the reference individuals of the same species, provides millions of DNA bases that

30
Figure 6. Algorithm of PASE
31
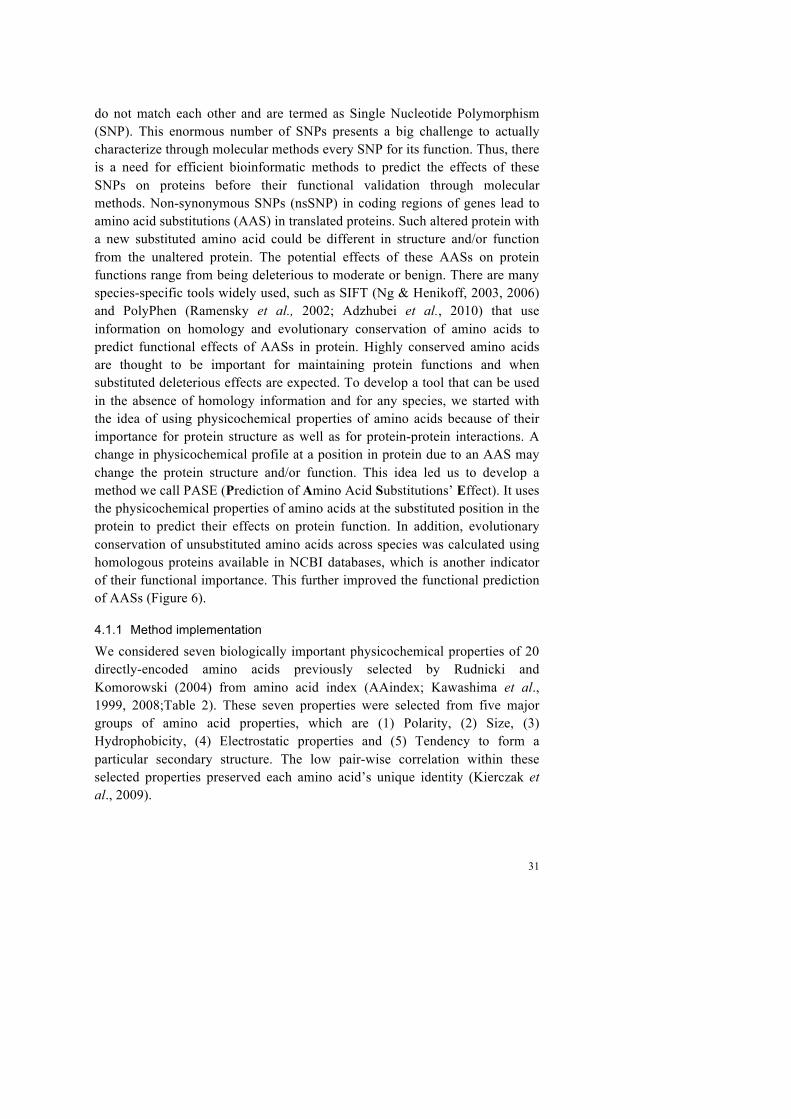
do not match each other and are termed as Single Nucleotide Polymorphism (SNP). This enormous number of SNPs presents a big challenge to actually characterize through molecular methods every SNP for its function. Thus, there is a need for efficient bioinformatic methods to predict the effects of these SNPs on proteins before their functional validation through molecular methods. Non-synonymous SNPs (nsSNP) in coding regions of genes lead to amino acid substitutions (AAS) in translated proteins. Such altered protein with a new substituted amino acid could be different in structure and/or function from the unaltered protein. The potential effects of these AASs on protein functions range from being deleterious to moderate or benign. There are many species-specific tools widely used, such as SIFT (Ng & Henikoff, 2003, 2006) and PolyPhen (Ramensky et al., 2002; Adzhubei et al., 2010) that use information on homology and evolutionary conservation of amino acids to predict functional effects of AASs in protein. Highly conserved amino acids are thought to be important for maintaining protein functions and when substituted deleterious effects are expected. To develop a tool that can be used in the absence of homology information and for any species, we started with the idea of using physicochemical properties of amino acids because of their importance for protein structure as well as for protein-protein interactions. A change in physicochemical profile at a position in protein due to an AAS may change the protein structure and/or function. This idea led us to develop a method we call PASE (Prediction of Amino Acid Substitutions’ Effect). It uses the physicochemical properties of amino acids at the substituted position in the protein to predict their effects on protein function. In addition, evolutionary conservation of unsubstituted amino acids across species was calculated using homologous proteins available in NCBI databases, which is another indicator of their functional importance. This further improved the functional prediction of AASs (Figure 6).
4.1.1 Method implementation
We considered seven biologically important physicochemical properties of 20 directly-encoded amino acids previously selected by Rudnicki and Komorowski (2004) from amino acid index (AAindex; Kawashima et al., 1999, 2008;Table 2). These seven properties were selected from five major groups of amino acid properties, which are (1) Polarity, (2) Size, (3) Hydrophobicity, (4) Electrostatic properties and (5) Tendency to form a particular secondary structure. The low pair-wise correlation within these selected properties preserved each amino acid’s unique identity (Kierczak et al., 2009).

32
Table 2. Physicochemical properties of amino acids as described in AAindex (Kawashima et al., 1999)
Descriptions Terms from AAindex
Transfer of free energy from octanol to water RADA880102 Normalized van der Waals volume FAUJ880103
Isoelectric point ZIMJ680104 Polarity GRAR740102 Normalized frequency of turn CRAJ730103 Normalized frequency of alpha-helix BURA740101
Free energy of solution in water CHAM820102
The physicochemical substitution score (P) due to an AAS was calculated using the Euclidean distance formula given by the following equation 1.
! = ! !!!! − !!!!!!!!
! , (Equation 1)
where ! is the physicochemical substitution score, !!!! and !!!! are the seven physicochemical property scores of original and substituted amino acid, respectively.
To calculate the conservation score of the original amino acid in a protein, its homologous and orthologous polypeptides were obtained using NCBI-blastp (Thompson et al., 1994) and were aligned using ClustalW (Larkin et al., 2007). The fraction of polypeptides in the multiple sequence alignment that carry the original amino acid was calculated and was used for the conservation score. Finally the conservation score (C) of the amino acid was calculated using the formula given by the following equation 2.
! = !(1!– !0.95!) (Equation 2)
where ! is the conservation score of amino acid, ! is the number of assessed polypeptide sequences in the alignment (p-value threshold of 0.01), ! is the fraction of polypeptides carrying original (non-substituted) amino acid in !. The term (1!– !0.95!) comes from Pei and Grishin (2001) and it implies that when N=1 the probability of each of the 20 amino acids is 1/20 at a particular position.
A combined score ! is also calculated by multiplying the ! (from equation 1) and ! (from equation 2) scores.

33
4.1.2 Results and discussion
The algorithm was tested on the already published and validated functional mutations in human Cx50 and porcine PRKAG3 genes. Higher PASE scores for AAS in these genes were consistent with the published deleterious effects of these substitutions as well as with SIFT predictions. AASs on human chromosome 22 were also scored with PASE, SIFT and PolyPhen to compare their predictions. The comparison among these tools showed that the higher scores of P, C and S were consistent with the severity of the predicted effects in SIFT and PolyPhen (Table 3; Figure 7). This shows that PASE is a good alternative for predicting functional effects of AASs, especially in the absence of or little information about their homology and conservation. This tool was used to characterizing AASs in paper III & IV for identifying candidate mutations for growth using resequenced NGS data from LWS and HWS.
Table 3. Functional predictions of AASs in Human chromosome 22
Tools Classifications AAS C a P b S c
SIFT Tolerated 1987 0.47 0.39 0.18 Deleterious 1351 0.6 0.51 0.3
PolyPhen Benign 1637 0.44 0.37 0.16 Possibly damaging 539 0.56 0.43 0.24 Probably damaging 1162 0.63 0.53 0.33
a Conservation score, b Physicochemical properties change score and c Combined score of PASE

34
Figure 7. The distribution of (A) MSAC, (B) PASE and (C) PASEC scores within different SIFT and PolyPhen prediction classes. Blue solid and dashed lines in panel (C) correspond to the probability of deleterious/damaging prediction from AAS’s PASEC scores.
4.2 Paper II
Evaluation of an imputation-based fine-mapping strategy in an outbred chicken Advanced Intercross Line (AIL)
In previous studies, QTLs for weight differences between divergent Virginia chicken lines were mapped in an F2-cross of founders in generation 40 of the selection experiment (Jacobsson et al., 2005). In a follow-up study these QTLs were replicated and fine-mapped in a nine generation Advanced Intercross Line (AIL) that was developed from the crosses of HWS and LWS parents in generation 40 but genotyped with higher resolution of markers (~1 marker/cM)
0.0 0.2 0.4 0.6 0.8 1.0
0.0
0.5
1.0
1.5
2.0
2.5
3.0
MSACD
ensi
ty
SIFT categorytolerateddeleterious
0.0 0.2 0.4 0.6 0.8 1.0
01
23
MSAC
Den
sity
PolyPhen categorybenignpossibly damagingprobably damaging
0.0 0.2 0.4 0.6 0.8 1.0
0.0
0.5
1.0
1.5
2.0
2.5
PASE
Den
sity
SIFT categorytolerateddeleterious
0.0 0.2 0.4 0.6 0.8 1.0
0.0
0.5
1.0
1.5
2.0
2.5
PASE
Den
sity
PolyPhen categorybenignpossibly damagingprobably damaging
0.0 0.2 0.4 0.6 0.8 1.0
0.0
0.5
1.0
1.5
2.0
2.5
3.0
3.5
PASEC
Den
sity
025
5075
100%
SIFT categorytolerateddeleterious
0.0 0.2 0.4 0.6 0.8 1.0
01
23
4
PASEC
Den
sity
025
5075
100%
PolyPhen categorybenignpossibly damagingprobably damaging
35
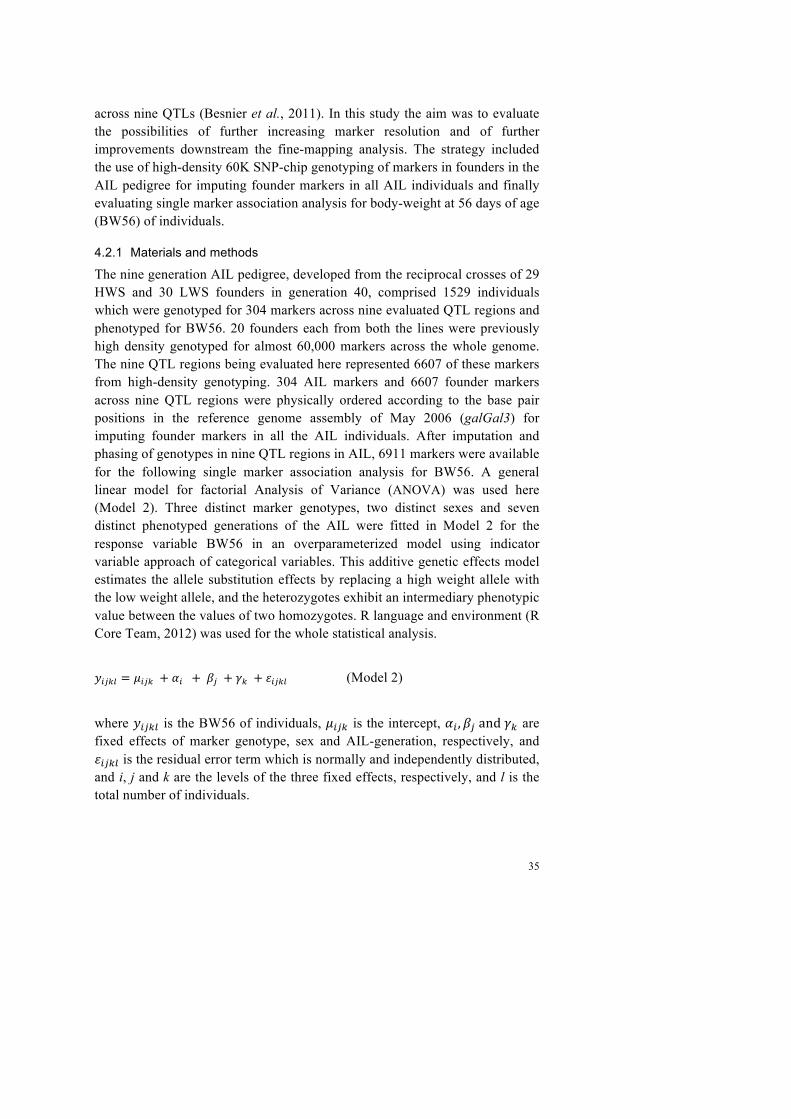
across nine QTLs (Besnier et al., 2011). In this study the aim was to evaluate the possibilities of further increasing marker resolution and of further improvements downstream the fine-mapping analysis. The strategy included the use of high-density 60K SNP-chip genotyping of markers in founders in the AIL pedigree for imputing founder markers in all AIL individuals and finally evaluating single marker association analysis for body-weight at 56 days of age (BW56) of individuals.
4.2.1 Materials and methods
The nine generation AIL pedigree, developed from the reciprocal crosses of 29 HWS and 30 LWS founders in generation 40, comprised 1529 individuals which were genotyped for 304 markers across nine evaluated QTL regions and phenotyped for BW56. 20 founders each from both the lines were previously high density genotyped for almost 60,000 markers across the whole genome. The nine QTL regions being evaluated here represented 6607 of these markers from high-density genotyping. 304 AIL markers and 6607 founder markers across nine QTL regions were physically ordered according to the base pair positions in the reference genome assembly of May 2006 (galGal3) for imputing founder markers in all the AIL individuals. After imputation and phasing of genotypes in nine QTL regions in AIL, 6911 markers were available for the following single marker association analysis for BW56. A general linear model for factorial Analysis of Variance (ANOVA) was used here (Model 2). Three distinct marker genotypes, two distinct sexes and seven distinct phenotyped generations of the AIL were fitted in Model 2 for the response variable BW56 in an overparameterized model using indicator variable approach of categorical variables. This additive genetic effects model estimates the allele substitution effects by replacing a high weight allele with the low weight allele, and the heterozygotes exhibit an intermediary phenotypic value between the values of two homozygotes. R language and environment (R Core Team, 2012) was used for the whole statistical analysis.
!!"#$ = !!"# !+ !! !!+ !!! !+ !! !+ !!"#$ (Model 2)
where !!"#$ is the BW56 of individuals, !!"# is the intercept, !! ,!! !and!!! are fixed effects of marker genotype, sex and AIL-generation, respectively, and !!"#$ is the residual error term which is normally and independently distributed, and i, j and k are the levels of the three fixed effects, respectively, and l is the total number of individuals.

36
4.2.2 Results and discussion
The imputation of markers in all the AIL individuals through high density genotyping increased the marker density 20 times across the nine QTL regions being evaluated here (Table 4).
Table 4. Genotyped and imputed markers across the nine analysed QTL regions
GGA QTL a Start (Mb) b
End (Mb) b
QTL Size (Mb)
Markers AIL c
Markers 60k d
Markers Total e
Marker Density f
1 Growth1 169.6 181.1 11.5 27 504 531 46 2 Growth2 47.9 65.5 17.6 36 667 703 40 2 Growth3 124.3 133.6 9.3 19 395 414 45 3 Growth4 24.0 68.1 44.0 61 1885 1946 44 4 Growth6 1.3 13.6 12.2 24 514 538 44 4 Growth7 85.4 88.9 3.4 15 141 156 46 5 Growth8 33.6 39.1 5.4 5 221 226 42 7 Growth9 10.9 35.5 24.6 88 1397 1485 60 20 Growth12 7.1 13.9 6.8 29 883 912 134
a QTL names as in Jacobsson et al. (2005); b Base pair position according to Chicken genome assembly of May 2006; c Markers as in Besnier et al. (2011); d Markers as in Johansson et al.(2010a); e Total markers in c and d; f Markers/Mb
Our approach of imputation-based association analysis showed seven regions with experiment-wide significant signals in nine QTLs. The resolution of the associated regions was also increased in the imputation-based analysis as compared to previously used linkage-based analysis by Besnier et al., (2011), mostly to 2-3 Mb (~1 cM) (Figure 8). The strongest experiment-wide significant markers in each QTL region with their estimated genotypic effects are summarized in Table 5. Further, We found multiple associated regions in several QTLs, revealing the complex nature of their genetic architecture and showing that the combined effects are probably due to multiple, linked causal loci on independent haplotypes that segregate among the founders of the population. We concluded that imputation-based association analysis is a promising approach for the fine-mapping of outbred AIL, but to validate the approach, further analyses based on genotyping of selected markers in the newly-detected associated regions will be necessary.

37
Figu
re 8
. Com
paris
on b
etw
een
linka
ge-
and
asso
ciat
ion-
base
d fin
e-m
appi
ng a
naly
ses
of n
ine
QTL
reg
ions
in a
n A
dvan
ced
Inte
rcro
ss L
ine
chic
ken
popu
latio
n.
Gre
en li
nes
show
the
stat
istic
al s
uppo
rt cu
rve
(sco
re s
tatis
tics
from
mod
el A
) for
the
linka
ge-b
ased
map
ping
stu
dy o
f Bes
nier
et a
l. (2
011)
and
the
red
dots
sho
w
asso
ciat
ions
to
each
ana
lyze
d m
arke
r in
the
new
im
puta
tion-
base
d as
soci
atio
n an
alys
is.
The
gree
n an
d re
d ho
rizon
tal
dotte
d lin
es i
ndic
ate,
res
pect
ivel
y th
e si
gnifi
canc
e th
resh
olds
for l
inka
ge-a
naly
sis
and
expe
rimen
t-wid
e B
onfe
rron
i thr
esho
ld in
the
impu
tatio
n-ba
sed
asso
ciat
ion
anal
ysis
.
● ● ●●●● ●●●●●●● ● ●●● ●● ●●●● ●● ●●●● ●●● ●● ●
● ●● ●● ● ●●● ●●●● ●● ●●● ●● ●●● ●●●●●● ● ●●●●
●● ●● ●●● ●●●● ●● ●● ●● ● ● ●●●● ●● ●● ●● ● ●● ●●● ● ●● ●● ●● ● ●● ●● ● ●●● ●● ● ● ● ●● ● ●●●● ●● ● ● ● ●●● ● ●●● ●●● ● ●●●● ● ● ●● ● ●● ●●●● ●● ●● ● ●●●● ● ● ●● ● ●
●● ● ● ● ● ● ●● ● ●●● ●● ● ●●● ● ●●● ● ●●● ●● ●● ●● ●● ●●● ●●● ●● ● ●● ●● ●● ●●● ● ● ●● ● ● ● ●● ● ●●● ●●●● ● ● ●●● ●● ● ●●● ●●●● ●● ●●● ● ●● ● ●● ● ●● ●● ●●●● ● ●● ●● ●●● ●● ● ●● ● ●●●
170
175
181
●●●
●
●●
● ●●●
●
●
●●
●
●
●● ●
●●
●●●
●●●
Gro
wth
1
0
100
200
300
400
500
600
700
800
900
1000
1100
1200
Score
● ●● ● ● ●● ● ●●● ● ●●●●●● ●●● ●●● ●
●●● ●●●●●
●● ●●●●● ●● ●●●●●●●●● ● ● ●
● ●●
●●●● ●●●●●●● ●●●● ●●●● ●● ●●●●●
●● ●●●●●● ●●●● ●●● ●●● ●
●●●
● ● ●●
● ●● ●●●● ●●●●●●● ●●●●●●●●● ●●●●●● ●● ●● ●● ● ●● ●● ●●●●
●●●
●●●● ● ●● ● ●● ●●● ●● ● ●● ● ●●● ●● ●●●● ● ●● ●● ●
● ●
● ● ● ●● ●● ●●● ● ● ● ●● ● ●● ●● ●●● ● ●● ● ●● ●●● ●● ●● ● ● ●● ●●●● ● ●● ●● ●●● ●● ●●● ● ● ●●●●
● ●● ● ●● ●●●●●● ● ●● ●●●● ● ●● ●● ●
●● ●● ● ●●● ● ●●● ●● ● ● ●
●● ●● ●● ●●● ●
● ●● ●● ●● ● ● ●●● ● ●●● ● ●●●●
● ●●● ● ●● ●● ●●●●● ●● ●●● ●● ●● ●● ●● ●● ●● ●●● ●● ●● ●●● ●● ●● ●●●● ●● ●● ● ●● ● ●● ●● ●● ●●● ● ●●●● ●●
4852
5761
65
●
●
●
●●●
●●●
●●●
●● ●●
●●●
●●
● ●●●●
●
●
●●●
● ●
●
●●
●●●●●●
●●
Gro
wth
2
●
●●●●●●●● ● ●●●●●● ●●● ● ●●
●● ● ●●●●
●●●●●●●●●
●●● ●●●● ●
●●●●●●● ●● ●
●● ● ●●
●●● ●●
● ●●● ● ●●● ● ●●● ● ●● ●● ●● ●● ●
●●●● ●●●●
●● ●●● ●●● ●
●●●● ● ●
●●● ● ●● ●●
● ●●
●● ●● ●●●● ●●
● ●● ●● ●● ●
●●●
124
129
134
●●●
●●
●●
●●●
●●
●
●●
●●●
Gro
wth
3
●●●● ●● ●●● ●● ●● ●● ●● ● ●●●●
● ●● ● ●● ●● ●●●●● ● ●● ●●
●
● ● ● ●●● ●● ●
● ●● ● ●● ●● ● ●● ●●● ●●
●● ● ● ●
●●
●
● ●●● ●●● ●● ●● ●● ●●
● ●●● ● ●● ●●●● ● ●●● ● ●● ●●● ● ●● ● ●●● ●●● ●● ● ●
●● ●● ●●● ● ●●●● ●● ●●● ●● ●● ●●● ● ●●● ● ● ●●●
●●●● ● ●● ●● ● ●
●●● ● ●● ● ●● ●●● ● ●● ● ● ●● ● ●●● ● ●
●●●●
●
● ● ●● ●●●● ●● ● ●● ● ● ●● ●● ● ●● ● ●
●● ●● ● ●● ● ●●●●● ● ●●●● ●●●● ●● ●●●● ●● ● ●●
●● ● ● ●● ● ●●● ●●● ●● ●●● ●● ●● ●● ●●●● ● ●●● ●● ● ●● ●●● ● ●● ● ●●●
●●● ●●● ● ●● ● ●●● ●● ● ●●●●● ● ● ●●●●●● ●● ● ●● ● ●● ● ●
●●● ●●● ●●●● ●●●● ●
●●● ●● ●● ●● ●
●●● ●● ●● ● ● ●● ●● ● ●
●
● ●●●● ●● ● ● ●●
● ● ●●●● ●●●●●●●●●●●● ●●●●●●●●●●● ●●●● ●●
●●●●●●● ● ●● ● ●● ● ● ● ●● ● ●● ●●●●●
● ●●● ●● ● ● ●●● ●● ●● ●
●●●
● ● ●● ●●● ●● ●●● ●●● ●● ●● ● ● ● ●●● ●● ● ● ● ●● ●● ●● ●● ●● ● ●● ● ●● ●● ● ●● ●● ●● ●● ● ●● ●●● ●● ● ● ●
●●● ● ● ●●●● ●● ● ●● ●● ●● ●●● ● ●● ●●● ●● ●● ●● ●●● ●● ●●
● ●● ●● ●● ●●● ●●●● ●
●● ●●● ●●● ●●● ●●●●●●● ●
●●● ●● ●●● ● ●● ●●●●●●●●●
●●● ●●● ● ●●● ●●● ● ● ●● ●● ● ●●
●● ●● ● ● ● ●● ● ● ●●● ●● ●
●●●●●
● ●●● ● ●
● ● ● ●●
● ●● ● ● ●● ● ● ● ● ●
● ● ●●● ● ●● ●●●● ●●
●● ●● ●●●● ●●● ●● ●● ●●●● ●● ●● ●● ●●
● ● ●●● ●●● ●●●●● ● ●●● ●● ● ●● ● ●
● ●● ●●● ●● ● ●●●●
● ●● ●● ●● ●●●
●
●● ●●● ●● ●●●●● ●● ●● ●●●● ● ●● ● ●
● ●● ● ●●●● ●●●●●
● ●
● ●
●●● ● ● ●
● ●●● ●● ●● ● ●●
● ●● ●● ●●
● ●● ●●
●
●●● ● ●●● ●●
● ● ●●●●●●●●●● ●●● ● ● ●●
●
●●
●●●●●● ●
● ●● ●● ●● ● ●●● ●●
●●● ●● ● ●●● ●●●● ● ●●● ●● ● ●● ● ●● ●● ●● ●●● ●● ●●●
●●
● ●●● ● ●● ● ●● ●● ●
●● ●● ●●
●●● ●● ●●●● ●● ●● ●● ●●● ●●● ●●●● ●●●● ●
●●●
2435
4657
68
●
●
●
●
●●
●●
●●
●●
●
●●
●
●●
●
●
●
●
● ●
●●●
●●
●
●
●
●
●
●
●
●
●
●
●
● ●
●●
●
●●
●
●
● ●
●
●●
●●
●●
●●
●●
●●
●●
●●
●●
●●
Gro
wth
4
● ●
QTL
Mod
elA
Impu
ted
Mar
kers
Posi
tion
(Mbp
)
●● ●● ● ●●● ● ●● ● ● ●● ● ●● ●
●●●● ●● ●●● ● ●● ●●● ●●●●● ● ●● ● ●● ● ●
●● ●●● ●● ●● ●●●● ● ●● ●●● ● ● ●●●● ●●● ●● ●●● ● ●● ●●● ●● ● ●● ●●
●● ● ●● ●●●●● ●● ●●● ●
●● ●● ●●●●●
● ●● ● ●●● ●● ●
● ●● ●
●● ●●●● ● ●●● ● ●●
●●●● ●●● ●●●●●●● ● ●●● ●●● ●● ●● ●● ●● ●● ● ●● ● ● ●
●●
● ●● ● ●● ●
●● ● ●● ● ● ●●●●● ●●●● ● ●●●●
●●
●●
●● ● ● ● ●●●● ●●● ● ● ● ●
●●● ●● ● ●●● ● ●● ●●● ●●● ●● ●● ●●●● ●● ● ● ●● ●● ● ●●● ● ●●●● ●●●● ●● ● ● ●●●●● ●● ● ● ●●●● ●● ● ●●●●●
●● ●● ● ● ●● ●●●
14
710
14
●●
●●
●●
●●
●●
●●
●●
●●
●●●●●●
●
●
●
Gro
wth
6
● ● ● ●●
● ●●●● ●● ●● ●● ●●
● ●●
● ●● ●● ●● ●● ●● ● ●●● ● ●● ●●●
●● ● ●●●● ● ● ●
●
●●●
● ●● ●●● ●●
● ●●● ●● ●●● ● ●●●●●
● ● ● ●●●●●● ●● ●●
● ●●
●●●
●●● ● ●●●
8587
89
●●
●●
●●
●
●
●
●
●
●●
●
Gro
wth
7
●●●● ●
●●
●● ●
●●
●
● ● ●
●● ●●● ●●● ● ●●● ● ● ●●● ●●●●
● ●●
●●●
● ●●●●
● ● ●● ●● ●●● ●●● ●● ●●●●● ●●
3436
39
●
●
●
●
Gro
wth
8
● ●
● ● ●● ●● ● ●●●●● ● ●● ● ●● ●●● ●● ●●●● ●●●●●●● ●●●
●●●●●●● ●●
●●●
●● ● ●● ●●●● ●● ●●●● ●●● ● ● ●●●● ● ●●● ●● ●● ●● ● ● ●●● ●●● ●● ● ●
●● ● ●●● ●●●● ● ● ●● ●●● ●● ●●● ● ●●● ●●● ●●●●● ● ●●● ● ●
●●● ●●● ● ●●●● ●●● ●● ● ● ● ●● ●●● ●● ●●● ●● ●● ●● ● ● ●● ●● ●●●●● ● ●● ● ●●●● ● ●●● ●●● ● ● ●● ●●●●● ●
● ●●● ●●● ●● ●● ●● ●● ●● ● ●
● ●● ●●●● ● ● ●●●● ●● ●●●● ●●●● ●● ●● ●●●●●
●●● ●● ● ●● ●● ● ●● ● ●● ● ●● ●● ●●● ●● ●●●● ● ● ●●●●●● ●● ● ●●● ●●● ●●●●● ● ●● ● ●● ●● ●●● ● ●●●● ●● ●● ● ●● ● ● ●● ●● ●●● ●●●●● ● ● ●●● ●● ● ●● ● ●● ●●●●●●●●●● ● ●● ●●● ● ●● ● ●●●● ● ●●● ●● ● ●● ● ●● ●● ●● ● ●●● ●●●●● ●●● ●●●●●●●● ● ●● ●● ●● ●● ● ●●● ● ●● ● ●●● ●●● ● ● ●●●● ● ●● ●● ●
●● ●● ●● ●● ●●● ● ● ●● ●● ● ●●● ●● ● ● ●● ●● ●● ● ●●●●●● ●● ●●● ●●●●● ● ●●● ●
● ●● ●● ● ●● ●●● ●● ● ●● ●● ● ●●● ● ● ●●●● ●●●● ●● ●● ● ●●● ●●● ● ● ●● ●● ●● ● ●● ● ●● ● ● ●●
●● ●● ●●● ●● ●●● ●● ●● ● ●●●● ● ● ● ●● ●● ●●● ●●●● ● ● ●● ●●● ●●● ●●● ●● ●● ●●● ●●●● ● ●● ● ●●●● ● ●●● ●● ● ●● ●● ●●● ●●●● ● ● ●●●● ● ● ●●
● ● ●●●●● ●●●● ●● ● ● ● ●● ●● ●●● ● ●● ●● ●● ●● ● ●●● ●● ●● ●● ●●● ●● ● ● ●● ●●● ●● ●● ●●● ●●● ●●● ●● ● ●●● ●● ● ●● ● ●●●● ● ●● ● ●●● ●●●●● ● ●●● ●●●●●● ● ●● ● ●● ● ●● ● ●●● ● ●● ● ●● ●●●● ●● ● ●● ●●● ●● ●●●● ● ● ●●
● ●●● ●●●●● ● ● ●● ● ●● ● ●● ●● ●● ●● ●● ●●● ●● ●● ● ●● ● ●● ●●●● ●● ●● ●● ● ●● ●● ●● ●●●● ●●● ●● ● ●●● ●
● ● ●●● ● ●●● ●●●● ● ●● ● ● ●● ●● ●●
1117
2329
35
●●
●●●
●●
●●
●●
●●●
●●●
●
●● ●
●● ●●
●●●●●●●●
●●●●●●●
●●
●●
●
●
●
●●
●
●●
● ●
●
●
●
●●●
●●
●
●●●● ●●●
●● ●●
● ●
● ●
● ●
●●
●●
●
●
●
●
●
●●●●●
●● ●●
●
●
●
●●●
Gro
wth
9
● ●●● ● ●● ●● ●● ●●● ●●●●●● ●● ●●●● ● ●● ●●●● ●● ● ●● ●● ● ●●● ●● ●●● ●●●●● ● ● ●●● ● ●● ● ●●● ●●●●● ●●● ●● ●● ●●● ●● ●● ●●● ●● ●●●● ●● ●●● ●●● ●● ● ●●● ● ●●●● ● ●●●● ● ●●●
●● ● ●● ● ●●● ● ●● ● ●● ●● ●● ●● ● ● ● ●● ● ●● ●● ●●● ●●● ●●● ●● ● ●● ●● ●● ●●●●● ●●● ●● ●●● ●●●● ● ●● ●●● ● ●● ●● ● ●● ● ●● ●● ● ●●● ●●● ● ●● ●●● ● ●● ●●●●● ●●●● ● ● ● ●● ●●● ●● ● ●● ● ●● ● ● ● ●● ●● ●● ●● ●● ●● ● ●●● ●● ● ●● ● ● ●●● ● ●●● ●●● ● ●●● ●● ● ● ●● ● ● ● ●● ● ●●●● ● ●● ● ●●●● ● ● ●●● ●●● ● ●●●● ●●●●●●● ●● ● ●● ● ● ●● ● ●● ● ● ● ●●● ● ●● ●●● ●● ● ● ●● ●● ● ● ● ●● ●●● ● ●● ●● ● ●● ● ●●●●●● ● ●●● ●● ● ●● ●●● ● ●●●● ●● ●●●● ● ●●● ●●●●●●● ●●● ● ●●● ●●● ●● ● ● ●●● ● ●● ●● ●● ● ●●●●●● ●●●● ●●● ● ●● ● ●● ● ●● ●●● ●
79
1112
14
●● ●●
●
●
●●
● ●
●
●●
●●
●
●
●
●●●
●
●
●●●
●●●●●
Gro
wth
120123456789101112
−log10(pvalue)

38
Tabl
e 5.
Sum
mar
y of
the
mos
t sig
nific
ant m
arke
rs in
the
regi
ons
with
exp
erim
ent-w
ide
sign
ifica
nce
mar
kers
in th
e im
puta
tion-
base
ass
ocia
tion
anal
ysis
GG
A
QTL
a Po
sitio
n
(bp)
b
Mar
ker
Marker&
Origin&
Genotypic&effects&of&pp&
(mea
n ± S
E)&
Genotypic&effects&of&qq&
(mea
n ± S
E)&
p-va
lue
c p
HW
S d
p LW
S d
1 G
row
th1
1737
0960
8 rs
1491
6997
A
IL
CC
: 656
.4 ±
11.0
A
A: 5
82.7
± 16
.3
2.5
x 10
-11
0.94
0.
08
1 G
row
th1
1705
1116
9 G
ga_r
s154
8932
7 60
K
AA
: 718
.9 ±
20.3
G
G: 6
13.1
± 15
.0
2.3
x 10
-07
0.50
0.
19
3 G
row
th4
3772
4193
G
Gal
uGA
2167
62
60K
G
G: 6
40.2
± 10
.6
AA
: 584
.3 ±
16.8
1.
8 x
10-0
7 0.
84
0.33
3 G
row
th4
2584
4633
G
Gal
uGA
2126
78
60K
G
G: 6
46.8
± 10
.4
AA
: 596
.3 ±
16.5
1.
3 x
10-0
6 0.
79
0.30
4 G
row
th6
8761
7364
G
Gal
uGA
2690
58
60K
G
G: 6
48.8
± 10
.3
AA
: 600
.6 ±
16.0
3.
1 x
10-0
6 0.
43
0.43
4 G
row
th7
1351
1203
rs
1550
0313
A
IL
AA
: 657
.4 ±
11.0
G
G: 6
03.4
± 16
.1
9.9
x 10
-07
0.90
0.
16
5 G
row
th8
3629
1277
rs
1358
5490
A
IL
AA
: 652
.4 ±
10.8
G
G: 5
86.1
± 16
.7
1.3
x 10
-09
0.74
0.
32
7 G
row
th9
2374
8014
G
ga_r
s135
9548
7 60
K
AA
: 633
.1 ±
11.0
G
G: 5
61.8
± 17
.1
1.3
x 10
-09
0.74
0.
33
20
Gro
wth
12
1166
8906
G
Gal
uGA
1810
27
60K
G
G: 6
50.4
± 10
.9
AA
: 597
.1 ±
16.0
1.
0 x
10-0
6 0.
56
0.20
a Q
TL n
ames
as
in J
acob
sson
et a
l. (2
005)
; b Ba
se p
air
posi
tion
acco
rdin
g to
Chi
cken
gen
ome
asse
mbl
y of
May
200
6; c
p-va
lue
here
sho
ws
the
sign
ifica
nce
of
the
diffe
renc
e in
mea
n ge
netic
effe
cts
of w
eigh
t-inc
reas
ing
hom
ozyg
otes
(pp
) fr
om th
e w
eigh
t-dec
reas
ing
hom
ozyg
otes
). Al
l the
mar
kers
in th
e ta
ble
show
hi
ghly
sig
nific
ant d
iffer
ence
s be
twee
n ge
netic
effe
cts
of tw
o ho
moz
ygot
e cl
asse
s; d
Alle
le fr
eque
ncy
of w
eigh
t-inc
reas
ing
alle
le (p
) in
foun
ders
(HW
S an
d LW
S)

39
4.3 Paper III
Identification of candidate genes and mutations in QTL regions for chicken growth using bioinformatic analysis of NGS and SNP-chip data This study describes the development and use of a bioinformatic strategy to efficiently utilize various genomic information to determine the most divergent regions between chicken lines in fine-mapped QTLs for the identification of candidate genes and mutation for phenotypes of interest. In previous studies several QTLs were mapped for growth in an F2-cross of outbred and divergently selected Virginia chicken lines for high or low body-weight at 56 days of age (Dunnington et al., 2013; Marquez et al., 2010) and these QTLs were subsequently replicated and fine-mapped in an AIL pedigree (Besnier et al., 2011). In this study the aim was to identify candidate genes and mutations for growth in chicken for further functional validation studies but the QTL regions to be investigated were spread out across many megabases even after fine-mapping and presented a large set of genes to begin with the identification of the candidates. It was expected that the divergent lines had been nearing fixation for functional
2nd 7X genome resequencing
Variant effect predictor (VEP) annotations of SNP-called data in selected candidate segments
Selection of candidate segments in each fine-mapped QTL for further bioinformatic analysis of
candidate genes and mutations
Available datasets 1: Fine-mapped QTLs 2: 60k SNP chip genotyping 3: 1st round of whole genome resequencing 4: SNP-calling from 1st 5X resequencing
SNP-calling on merged datasets from 1st and 2nd round of whole genome resequencing
Genetic divergence analysis using the flanking SNP value (FSV) method on SNP-called data in fine-
mapped QTLs
Functional prediction of amino acid substitutions using the PASE software
Annotating Ensembl genes in candidate segments with DAVID bioinformatics resources
Analysis of DAVID-annotated Ensembl genes along with VEP annotations and PASE predictions
Candidate genes and mutations for further functional validation studies
Figure 9. Bioinformatic analysis method used here to identify candidate genes and mutations

40
alleles after 40 generations of selection. We developed a strategy to identify the most divergent regions in terms of allele frequency differences in the QTLs between the HWS and LWS lines using whole genome NGS and high-density individual SNP-chip genotyping data from these lines.
4.3.1 Materials and methods
A bioinformatic strategy was devised here to identify the most likely candidate mutations for growth in chicken in previously fine-mapped QTLs (Figure 9). First, we used a method called the Flanking SNP Value (FSV; Marklund & Carlborg, 2010), which uses the SNP information from resequenced NGS data from both of the chicken lines together to identify the most divergent regions between lines using the below equation below (Equation 3). High FSV scores indicate high allele frequency differences between the lines and vice versa.
!"# = ! !!!! !!!!!!
!!!!!!
!!!× !
!!!! !!!!!!
!!!!!!
!! , (Equation 3)
where !!!! and !!!! are the resequencing scores in the HWS and LWS line, respectively, for SNP i detected in the HWS at position coordinate c. Likewise, !!!! !and !!!! are the corresponding scores for SNP j detected in the LWS at position coordinate d. !! and !! are the total number of HWS SNPs and LWS SNPs, respectively, scored within the flanking regions. (Marklund & Carlborg, 2010) Whole genome resequencing of HWS and LWS lines was performed using a pooled DNA approach in two separate experiments, and data from both experiments were combined separately for each line to maximize the sensitivity of SNP detection in both lines against the reference Red Jungle Fowl assembly of May 2006 (galGal3). We combined three sources of information in each QTL region, which were FSV estimates from NGS-SNP data, allele frequencies from individual SNP-chip genotyping and QTL score statistics of model B from the fine-mapping study of Besnier et al. (2011) so that a combined data score (CDS, equation 4) was calculated for every SNP position in the nine QTLs. Model B (Besnier et al., 2011) takes into account the random polygenic effect for detecting QTLs, whereas model A does not. The CDS was used to identify the most promising divergent regions between lines.

41
!"# ={[(!"#!"#$%!! + !!"#$ℎ!"_!""#"#!!"#$%#&'()/2] +!(!"#$%&'()*!!"#$%!!"!!"#_!"#$%&)}/2, (Equation 4) Identified divergent regions were investigated for genes and mutations using the Ensembl (version 70; Flicek et al., 2014). To identify growth relevant genes, the DAVID bioinformatics resource (Huang et al., 2009, 2009a) was used to extensively annotate the genes in these regions. The Variant Effect Predictor tool (VEP; McLaren et al., 2010) was used to annotate mutations found in the regions, which were detected through SNP-calling on the whole genome resequenced NGS data of the lines. The in-house developed software, PASE, (Li et al., 2013) was used to functionally evaluate the amino acid substitutions (resulting from non-synonymous mutations) on protein functions.
4.3.2 Results and discussion
Nine QTL regions, which are being evaluated here, are taken from Besnier et al. (2011). The bioinformatics method applied here to find highly divergent regions between lines identified 37% (~45 Mb) of the original fine-mapped QTL regions (Table 6; Figure 10). Because these regions are found to be divergent, we believe that the genetic variation underlying the observed QTL effects on body weight lies in these sub-regions. Finally combining all the information for growth-relevant genes along with allele frequency differences between lines and predicted functional effects for their mutations, we present a prioritised subset of mutations for growth in chicken to be used in further functional validation studies (Table 7).
42
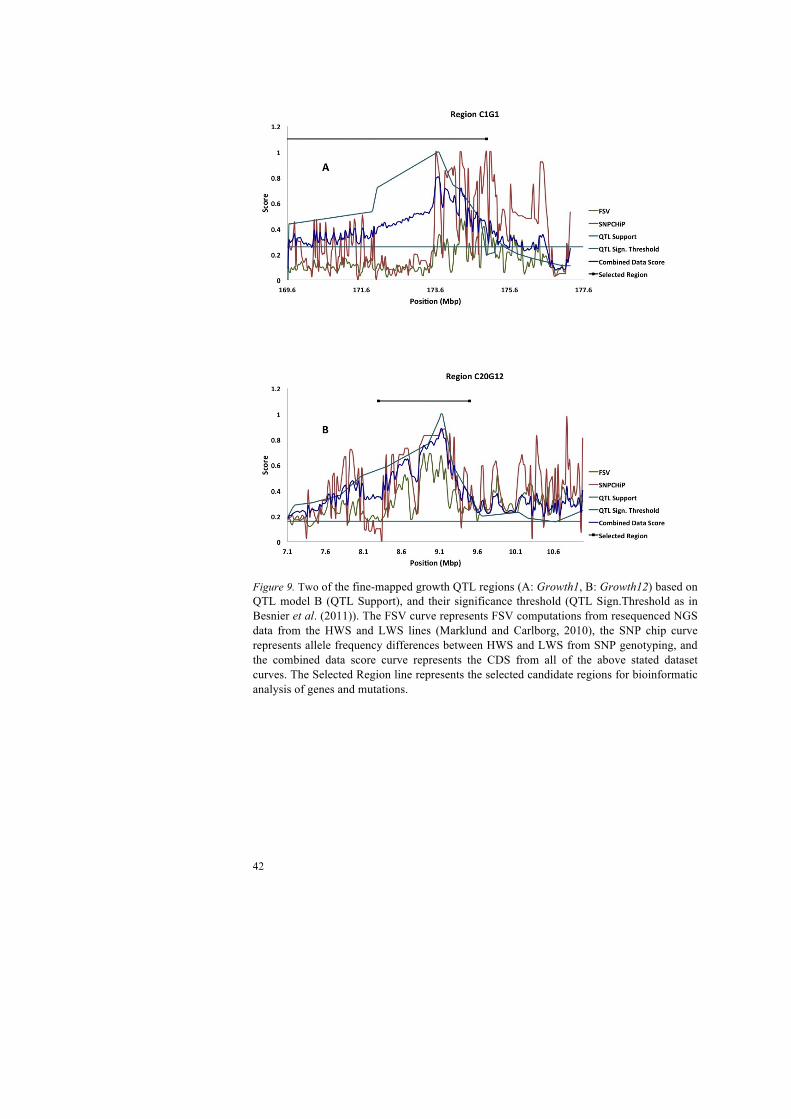
Figure 9. Two of the fine-mapped growth QTL regions (A: Growth1, B: Growth12) based on QTL model B (QTL Support), and their significance threshold (QTL Sign.Threshold as in Besnier et al. (2011)). The FSV curve represents FSV computations from resequenced NGS data from the HWS and LWS lines (Marklund and Carlborg, 2010), the SNP chip curve represents allele frequency differences between HWS and LWS from SNP genotyping, and the combined data score curve represents the CDS from all of the above stated dataset curves. The Selected Region line represents the selected candidate regions for bioinformatic analysis of genes and mutations.

43
Table 6. Candidate regions selected based on QTL data and allele frequency differences between the lines inferred from SNP chip genotyping and FSV computation from resequencing.
GGA QTL Name a
Start (Mbp) b
End (Mbp) b
Size (Mbp)
QTL Support c
Ensembl Genes d
1 Growth1 169.6 175.0 5.4 5.4 97
2 Growth2 59.7 65.4 5.7 2.1 52
3 Growth4 24.1 35.8 11.7 10.3 142
4 Growth6 10.6 12.9 2.3 0.0 62
5 Growth8 34.2 36.8. 2.6 0.0 20
5 Growth8 38.2 39.0 0.8 0.0 16
7 Growth9 20.4 35.4 15.0 4.3 209
20 Growth12 8.3 9.5 1.2 1.2 38
Total 44.7 23.3 636
aQTL names as in Jacobsson et al. (2005); bBase pair position according to Chicken genome assembly of May 2006; cSize of the selected regions significant with QTL model B (Besnier et al., 2011); d Number of Ensembl genes in the initial list in the selected regions

44
Tabl
e 7.
Can
dida
te m
utat
ions
iden
tifie
d in
the
eval
uate
d Q
TL r
egio
ns
QTL
R
egio
n a
SNP
(bp)
b G
ene
SNP
loca
tion/
type
c A
Ad ;
cove
rage
Qua
le A
FDf
PC g
EC h
PEi
Gro
wth
1 17
4634
021
aspa
ragi
ne-li
nked
gly
cosy
latio
n 11
hom
olog
(ALG
11)
CpG
isla
nd, u
pstre
am
7 ; 1
0 72
0.
97
N/A
N
/A
N/A
Gro
wth
2 63
8235
23
endo
thel
in 1
(ED
N1)
C
pG is
land
, ups
tream
3
; 13
53
0.95
N
/A
N/A
N
/A
Gro
wth
4 33
6782
70
cyst
eine
rich
tran
smem
bran
e B
MP
regu
lato
r 1 (C
RIM
1)
Prot
ein
NS
codi
ng, K
/I 10
; 19
18
2 0.
97
0.67
0.
63
0.42
Gro
wth
6 12
0440
24
sim
ilar t
o re
cept
or ty
rosi
ne k
inas
e (V
EGFR
-2)
CpG
isla
nd, u
pstre
am
4 ; 8
82
0.
97
N/A
N
/A
N/A
Gro
wth
6 12
9024
14
fibro
blas
t gro
wth
fact
or 1
6 (F
GF1
6)
CpG
isla
nd, d
owns
tream
8
; 16
175
0.95
N
/A
N/A
N
/A
Gro
wth
8 38
3163
01
sorti
ng n
exin
6 (S
NX6
) C
pG is
land
, ups
tream
8
; 14
142
0.97
N
/A
N/A
N
/A
Gro
wth
9 21
6866
25
grow
th fa
ctor
rece
ptor
-bou
nd p
rote
in 1
4 (G
RB14
) C
pG is
land
, dow
nstre
am
3 ; 1
2 52
0.
97
N/A
N
/A
N/A
Gro
wth
9 22
7119
10
Glu
cago
n (G
CG
) C
pG is
land
, dow
nstre
am
3 ; 9
46
0.
87
N/A
N
/A
N/A
Gro
wth
9 24
8026
16
insu
lin-li
ke g
row
th fa
ctor
bin
ding
pro
tein
2 (I
GFB
P2)
Prot
ein
SN c
odin
g, C
pG is
land
4
; 8
69
0.95
N
/A
N/A
N
/A
Gro
wth
12
8715
398
bacu
lovi
ral I
AP
repe
at-c
onta
inin
g 7
(BIR
C7)
Pr
otei
n co
de, N
S I/
V
5 ; 8
65
0.
97
0.29
0.
14
0.04
a QTL
nam
es a
s in
Jac
obss
on e
t al.
(200
5);
b Coo
rdin
ates
bas
ed o
n th
e C
hick
en (
Gal
lus
gallu
s) a
ssem
bly
v 2.
1/ga
lGal
3; c Lo
catio
n of
the
SNP
in g
ene
and
also
am
ino
acid
sub
stitu
tion
in c
ase
of n
on-s
ynon
ymou
s (N
S) a
nd s
ynon
ymou
s (S
N )
SNP;
d Tota
l num
ber
of r
eads
in b
oth
lines
rep
rese
ntin
g th
e al
tern
ate
alle
le (A
A)
vers
us th
e to
tal d
epth
cov
erag
e ac
ross
the
SNP
posi
tion
(AA3 r
eads
;dep
th c
over
age)
; e The
Phre
d-sc
aled
pro
babi
lity
that
a R
EF/A
LT p
olym
orph
ism
exi
sts
at th
is
site
giv
en s
eque
ncin
g da
ta. B
ecau
se t
he P
hred
sca
le i
s -1
0 *
log(
1-p)
, a v
alue
of
10 i
ndic
ates
a 1
in
10 c
hanc
e of
err
or, w
hile
a 1
00 i
ndic
ates
a 1
in
10^1
0 ch
ance
; f Alle
le fr
eque
ncy
diffe
renc
e be
twee
n th
e ch
icke
n lin
es a
s es
timat
ed u
sing
the
Gig
aBay
es s
oftw
are
give
n th
at a
tota
l of 1
9 in
divi
dual
s fr
om e
ach
line
wer
e in
clud
ed in
the
pool
s ;
g Phys
ico-
chem
ical
sco
re o
f am
ino
acid
sub
stitu
tion
calc
ulat
ed u
sing
PAS
E (L
i et a
l., 2
013)
. h Evol
utio
nary
con
serv
atio
n sc
ore
of a
min
o ac
id s
ubst
itutio
n ca
lcul
ated
usi
ng P
ASE
(Li e
t al.,
201
3); i C
ombi
ned
scor
e of
PC
and
EC
of a
min
o ac
id s
ubst
itutio
n ca
lcul
ated
usi
ng P
ASE
(Li e
t al.,
201
3).

45
4.4 Paper IV
Revealing candidate biological interactions underlying epistatic QTLs for chicken growth. The aim of this paper is to explore genetic elements underlying the radial network of interacting QTLs for body-weight at 56 days of age (BW56) in Virginia chicken on chromosomes 2, 3, 4, 7 and 20, previously mapped in an F2-cross of outbred divergent Virginia chicken lines and subsequently replicated in a follow-up study in an AIL pedigree (Carlborg et al., 2006; Pettersson et al., 2011). We assumed that the pathways that carried strong mutations within growth-relevant genes, of many interacting QTLs simultaneously, might be considered as candidate pathways for the observed QTL interaction effects to be validated further. Therefore, to get a biological interpretation of the interaction found in radial-network of interacting QTLs in replication study, the genes and mutations in these QTLs need to be explored extensively for interactions in the available biological pathways databases.
4.4.1 Materials and method
In the replication study of Pettersson et.al. (2011) replicated interacting QTLs were screened for evaluating the pair-wise interactions, using the conditioned subset of data where each growth QTL, in turn, served as a conditioning locus for the screening of the rest of growth QTLs. We analysed these QTL screening data to extract significantly
Variant Effect Predictor (VEP) annotation of called SNPs
Candidate pathways, genes and mutations of highest priority
Analysis of KEGG Pathway using genes and mutations in significant regions of epistatic
QTLs
Available datasets 1: Replicated Epistatic QTLs + Fine-mapped QTLs 2: SNP-calling on merged datasets from 1st and 2nd round (5X and 7X coverage, respectively) of whole genome resequencing
Functional annotation of the Ensembl genes
Functional prediction of amino acid substitutions using the PASE software
Allele frequency differences of SNPs
Figure 11. Flow diagram of the bioinformatic analysis for candidate pathways

46
associated regions in these QTLs. These regions are not independent QTLs but represent only the significant regions within replicated growth QTLs. The imputation-based fine-mapping study (Paper II) provided higher resolution of mapped QTLs that are interacting in the radial network of loci. The significantly associated regions from Paper II in the replicated interacting QTLs (Pettersson et al., 2013) were also analysed. We investigated these regions here for candidate biological pathways including candidate genes and mutations from interacting QTLs for growth trait in chicken (Figure 11) The Ensembl genes (version 70; Flicek et al., 2014) in these regions were extracted and extensively annotated with DAVID bioinformatics resources (Huang et al., 2009a, 2009b). Growth-relevant genes were identified in each region. SNPs from resequencing NGS data in these regions were characterized using Variant Effect Predictor (VEP; McLaren et al., 2010). The PASE was employed here to predict functional effects of AASs on proteins in the regions. Allelic differences between HWS and LWS lines were investigated at each SNP position. Biological pathways from Kyoto Encyclopaedia of Genes and Genomes (KEGG; Kanehisa et al., 2012, 2014) database were analysed with annotated genes and mutations in these fine-mapped regions. Finally, taking into account all the extracted information about genes and pathways, growth-related pathways carrying growth-related genes and mutations represented from interacting QTLs were presented as candidates for further functional validation.
4.4.2 Results and discussion
The joint analysis of results from the replicated interacting QTLs (Pettersson et al., 2011) and the fine-mapped QTLs from imputation-based analysis (Paper II) revealed that many regions of association from both studies either overlapped or were in close proximity. Table 8 shows the positions of strongly associated markers in the interacting QTLs from imputation-based analysis and also the significant regions from replication study. The significant regions both from the replication study and the imputation-based analysis overlap in Growth4 and Growth9, whereas, the imputation-based analysis could not find any significant region in Growth2. Moreover, imputation-based analysis revealed strongly associated markers only 1.6 and 2.3 Mb downstream of the significant regions of the replication analysis, in Growth6 and Growth12, respectively. The strategy of finding growth-relevant biological pathways represented by growth-related genes, which are represented from interacting QTLs revealed 11 candidate pathways for further validation (Table 9). Most importantly, these pathways were represented from at least one gene from Growth9 because the genotype at this QTL always determines the release of
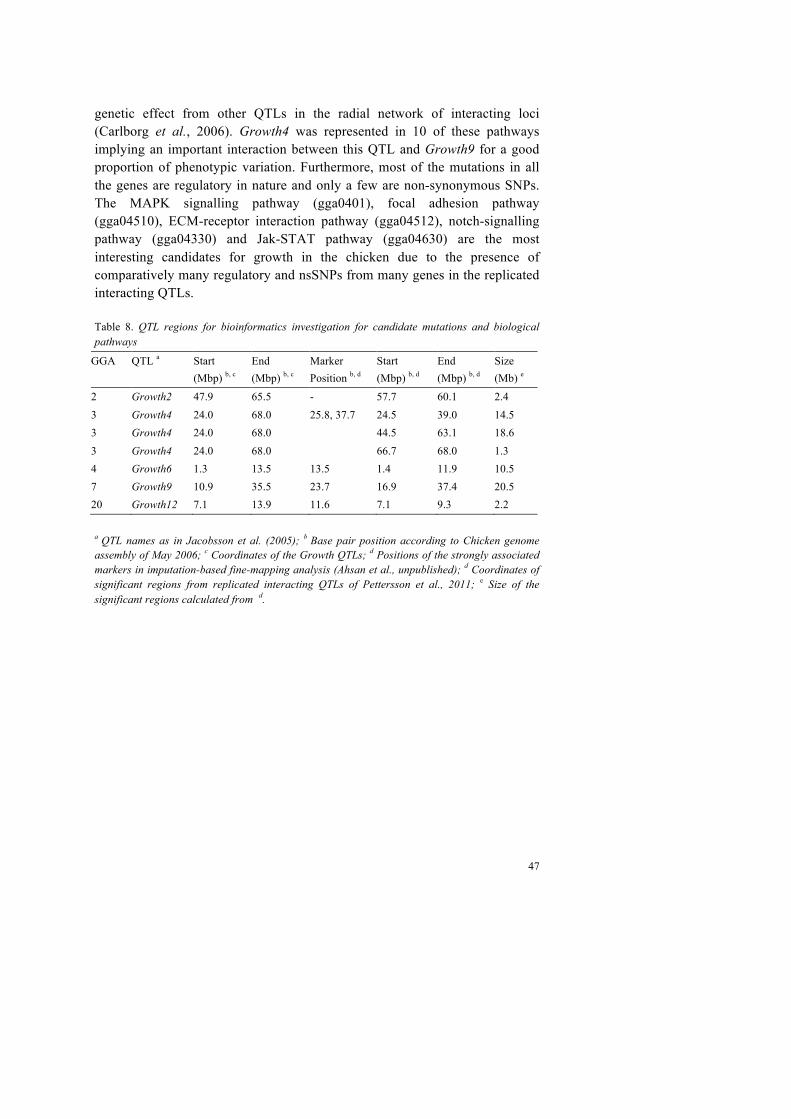
47
genetic effect from other QTLs in the radial network of interacting loci (Carlborg et al., 2006). Growth4 was represented in 10 of these pathways implying an important interaction between this QTL and Growth9 for a good proportion of phenotypic variation. Furthermore, most of the mutations in all the genes are regulatory in nature and only a few are non-synonymous SNPs. The MAPK signalling pathway (gga0401), focal adhesion pathway (gga04510), ECM-receptor interaction pathway (gga04512), notch-signalling pathway (gga04330) and Jak-STAT pathway (gga04630) are the most interesting candidates for growth in the chicken due to the presence of comparatively many regulatory and nsSNPs from many genes in the replicated interacting QTLs.
Table 8. QTL regions for bioinformatics investigation for candidate mutations and biological pathways
GGA QTL a Start (Mbp) b, c
End (Mbp) b, c
Marker Position b, d
Start (Mbp) b, d
End (Mbp) b, d
Size (Mb) e
2 Growth2 47.9 65.5 - 57.7 60.1 2.4
3 Growth4 24.0 68.0 25.8, 37.7 24.5 39.0 14.5
3 Growth4 24.0 68.0 44.5 63.1 18.6
3 Growth4 24.0 68.0 66.7 68.0 1.3
4 Growth6 1.3 13.5 13.5 1.4 11.9 10.5
7 Growth9 10.9 35.5 23.7 16.9 37.4 20.5
20 Growth12 7.1 13.9 11.6 7.1 9.3 2.2
a QTL names as in Jacobsson et al. (2005); b Base pair position according to Chicken genome assembly of May 2006; c Coordinates of the Growth QTLs; d Positions of the strongly associated markers in imputation-based fine-mapping analysis (Ahsan et al., unpublished); d Coordinates of significant regions from replicated interacting QTLs of Pettersson et al., 2011; e Size of the significant regions calculated from d.

48
Tabl
e 9.
Can
dida
te K
EGG
pat
hway
s w
ith im
port
ant m
utat
ions
in s
igni
fican
t QTL
reg
ions
and
with
gen
es r
epre
sent
ed fr
om d
iffer
ent Q
TLs
KEG
G p
athw
ay n
ame
CpG
is
land
a U
TR a
Splic
ing
site
s a
nsSN
P a,
b
Gro
wth
2 c
gene
s G
row
th4
c ge
nes
G
row
th6
c ge
nes
Gro
wth
9 c
gene
s G
row
th12
c ge
nes
Tota
l ge
nes
gga0
4010
: MA
PK s
igna
ling
path
way
58
1
5 1
0 2
1 5
0 8
gga0
4020
: Cal
cium
sig
nalin
g pa
thw
ay
19
4 1
1 0
1 1
1 1
4
gga0
4115
: p53
sig
nalin
g pa
thw
ay
11
0 0
0 0
1 0
1 0
2
gga0
4310
: Wnt
sig
nalin
g pa
thw
ay
5 1
1 0
1 0
0 2
0 3
gga0
4330
: Not
ch s
igna
ling
path
way
17
1
0 3
0 1
0 2
0 3
gga0
4510
: Foc
al a
dhes
ion
35
3 0
4 0
2 0
3 0
5
gga0
4512
: EC
M-r
ecep
tor i
nter
actio
n 25
2
0 4
0 1
0 3
0 4
gga0
4514
: Cel
l adh
esio
n m
olec
ules
(CA
Ms)
19
0
0 0
0 1
1 1
1 4
gga0
4530
: Tig
ht ju
nctio
n 17
0
0 0
0 1
1 1
0 3
gga0
4630
: Jak
-STA
T si
gnal
ing
path
way
21
3
1 3
1 4
3 1
0 9
gga0
4910
: Ins
ulin
sig
nalin
g pa
thw
ay
2 1
0 0
0 1
0 1
0 2
Tota
l 22
9 16
8
16
2 15
7
21
2 47
a N
umbe
r of
mut
atio
ns in
impo
rtan
t reg
ions
of r
epre
sent
ed g
enes
; b N
on-s
ynon
ymou
s si
ngle
nuc
leot
ide
poly
mor
phis
m; c
QTL
nam
es a
s in
Jac
obss
on e
t al.
(200
5)

49
5 Future Research Strategies There are many aspects regarding future research strategies from my work. Here I mention some of them:
It would be appropriate that the QTL results could be replicated to validate their genetic effects in other populations. We have developed a multi-locus Introgression Line using the High-Weight-Selected (HWS) and Low-Weight-Selected (LWS) lines to replicate these genetic effects in a more homogeneous background (Ek et al., 2011). We are currently analysing the data from this line.
Fine-mapping study (Paper II) in this thesis used the nine-generation Advanced Intercross Line (AIL) pedigree to evaluate the marker imputation strategy. Intercrossing in AIL is ongoing and we have the data for seven more generations. The data for all the generations can be combined to increase the power in an analysis to validate the identified associations. Moreover, highly significant imputed markers can be typed in future generations of AIL to validate their genetic effects. This will also confirm whether the imputation strategy is precise and efficient.
The candidate mutations presented in paper III and IV need to be further investigated in molecular studies to elucidate their presumed effects on growth in the chicken. So far, all our focus in dissecting the genetic basis underlying growth trait is at the DNA level. Tissue sampling, on the other hand, can provide information at RNA level, which would enable us to unravel the genetic mechanisms further. Tissue samples from HWS, LWS, AIL and Introgression Line are at currently at our disposal. Using these samples RNA-seq analysis can be planned to study the gene expression of the candidate genes presented in Paper III & IV. Moreover, the candidate mutations can also be confirmed through RNA-seq analysis.

50

51
6 Conclusions
To understand the genetic control of the phenotypic diversity is one of the most challenging problems in biology. Genetic association studies have shown to be fruitful in mapping genomic regions, which anchor mutations that contribute to the expression of polygenic traits of interest (Stranger et al., 2011). Typically, the identified regions harbour a huge number of mutations and not all are equally functional in contributing their effects in the expression of such traits. However, the task of actually pinpointing the functionally most important mutations has proved to be much more challenging (Stranger et al., 2011). With the advances in Next Generation Sequencing and being able to afford resequencing of populations for their complete genomes, and the availability of high-density genotyping methodologies, we are now well set to evaluate all the mutations in the identified regions and predict their functional roles through the development of bioinformatics algorithms, methods and tools.
In this thesis I developed a strategy to fine-map genomic regions associated with juvenile body weight in chicken, devised a set of bioinformatics pipelines to identify first and then predict the functional effects of all mutations in these regions that are made available through high-density genotyping and resequencing of studied populations. These methods identified and functionally characterized most likely candidate genes, mutations and biological pathways underlying the observed QTL effects on juvenile body weight. Therefore, this thesis provides an important insight into the understanding and dissecting genetic basis of complex traits. The specific conclusions from each study are presented below.
6.1 Paper I
The PASE software we developed and described here is a useful tool to predict functional effects of amino acid substitutions on proteins. Changes in
52
physicochemical properties at an amino acid position due to a substitution in a protein may have effects ranging from being neutral to deleterious with regards to functional effect on a protein. The PASE not only uses these properties but also includes the degree of conservation of original amino acid in homologs and orthologs to predict these effects efficiently. Its results are consistent with widely used homology-based tools.
6.2 Paper II
The strategy to further increase marker resolution in AIL pedigree through imputation of genotypes from densely genotyped founders was shown to be effective. The following single marker association analysis approach for mapping has produced results that have replicated and fine-mapped many of the studied QTLs. But a further genotyping of the markers in the newly identified associated regions in subsequent generations would be necessary to validate these markers and associations in further analyses.
6.3 Papers III and IV
The aim of these two studies was to untangle the underlying biological mechanisms of the observed QTL effects on growth in Virginia chicken lines using NGS and high-density genotyping data in fine-mapped QTL regions. In paper III the additive QTLs were investigated bioinformatically to detect highly divergent regions between lines and a subset of highly prioritized candidate mutations in growth-related genes in the chicken were presented for further molecular characterization. In paper IV the radial network of epistatic QTLs was investigated for underlying biological interactions in terms of the presence of mutations of genes from interacting loci in biological pathways related to growth. Biological pathways with growth-related genes and mutations contributing from interacting loci were presented as the most interesting candidates for further functional validation.

53
References Adzhubei, I.A., Schmidt, S., Peshkin, L., Ramensky, V.E., Gerasimova, A., Bork, P.,
Kondrashov, A.S. & Sunyaev, S.R. (2010). A method and server for predicting damaging missense mutations. Nature methods, 7(4), pp. 248-249.
Ahsan, M., Li, X., Lundberg, A.E., Kierczak, M., Siegel, P.B., Carlborg, Ö. & Marklund, S. (2013). Identification of candidate genes and mutations in QTL regions for chicken growth using bioinformatic analysis of NGS and SNP-chip data. Frontiers in genetics, 4.
Andersson, L. (2001). Genetic dissection of phenotypic diversity in farm animals. Nature Reviews Genetics, 2(2), pp. 130-138.
Andersson, L. & Georges, M. (2004). Domestic-animal genomics: deciphering the genetics of complex traits. Nature Reviews Genetics, 5(3), pp. 202-212.
Ashburner, M., Ball, C.A., Blake, J.A., Botstein, D., Butler, H., Cherry, J.M., Davis, A.P., Dolinski, K., Dwight, S.S. & Eppig, J.T. (2000). Gene Ontology: tool for the unification of biology. Nature genetics, 25(1), pp. 25-29.
Barnes, M.R. (2010). Exploring the landscape of the genome. In: Genetic Variation Springer, pp. 21-38.
Besnier, F., Wahlberg, P., Rönnegård, L., Ek, W., Andersson, L., Siegel, P.B. & Carlborg, O. (2011). Fine mapping and replication of QTL in outbred chicken advanced intercross lines. Genet. Sel. Evol, 43(3).
Broman, K.W. (2000). Review of statistical methods for QTL mapping in experimental crosses. Lab animal, 30(7), pp. 44-52.
Burge, C. & Karlin, S. (1997). Prediction of complete gene structures in human genomic DNA. Journal of molecular biology, 268(1), pp. 78-94.
Burt, D. (2002). Origin and evolution of avian microchromosomes. Cytogenetic and genome research, 96(1-4), pp. 97-112.
Carlborg, Ö., Jacobsson, L., Åhgren, P., Siegel, P. & Andersson, L. (2006). Epistasis and the release of genetic variation during long-term selection. Nature genetics, 38(4), pp. 418-420.
Clutton-Brock, J. (1995). Origins of the dog: domestication and early history. The domestic dog: Its evolution, behaviour and interactions with people, pp. 7-20.
Daetwyler, H.D., Wiggans, G.R., Hayes, B.J., Woolliams, J.A. & Goddard, M.E. (2011). Imputation of missing genotypes from sparse to high density using long-range phasing. Genetics, 189(1), pp. 317-327.

54
Dunnington, E., Honaker, C., McGilliard, M. & Siegel, P. (2013). Phenotypic responses of chickens to long-term, bidirectional selection for juvenile body weight—Historical perspective. Poultry science, 92(7), pp. 1724-1734.
Dunnington, E. & Siegel, P. (1996). Long-term divergent selection for eight-week body weight in White Plymouth Rock chickens. Poultry science, 75(10), pp. 1168-1179.
Ek, W., Marklund, S., Ragavendran, A., Siegel, P., Muir, W. & Carlborg, O. (2011). Generation of a multi-locus chicken introgression line to study the effects of genetic interactions on metabolic phenotypes in chickens. Frontiers in genetics, 3, pp. 29-29.
Flicek, P., Amode, M.R., Barrell, D., Beal, K., Billis, K., Brent, S., Carvalho-Silva, D., Clapham, P., Coates, G. & Fitzgerald, S. (2014). Ensembl 2014. Nucleic acids research, 42(D1), pp. D749-D755.
Gross, S.S. & Brent, M.R. (2006). Using multiple alignments to improve gene prediction. Journal of Computational Biology, 13(2), pp. 379-393.
Hill, W.G. (2005). A century of corn selection. Science, 307(5710), pp. 683-684. Hillier, L.W., Miller, W., Birney, E., Warren, W., Hardison, R.C., Ponting, C.P., Bork, P., Burt,
D.W., Groenen, M.A. & Delany, M.E. (2004). Sequence and comparative analysis of the chicken genome provide unique perspectives on vertebrate evolution. Nature, 432(7018), pp. 695-716.
Huang, D.W., Sherman, B.T. & Lempicki, R.A. (2008). Systematic and integrative analysis of large gene lists using DAVID bioinformatics resources. Nature protocols, 4(1), pp. 44-57.
Huang, D.W., Sherman, B.T. & Lempicki, R.A. (2009). Bioinformatics enrichment tools: paths toward the comprehensive functional analysis of large gene lists. Nucleic acids research, 37(1), pp. 1-13.
Jacobsson, L., Park, H.-B., Wahlberg, P., Fredriksson, R., Perez-Enciso, M., Siegel, P.B. & Andersson, L. (2005). Many QTLs with minor additive effects are associated with a large difference in growth between two selection lines in chickens. Genetical research, 86(02), pp. 115-125.
Johansson, A.M., Pettersson, M.E., Siegel, P.B. & Carlborg, Ö. (2010). Genome-wide effects of long-term divergent selection. PLoS genetics, 6(11), p. e1001188.
Kanehisa, M., Goto, S., Sato, Y., Furumichi, M. & Tanabe, M. (2012). KEGG for integration and interpretation of large-scale molecular data sets. Nucleic acids research, 40(D1), pp. D109-D114.
Kanehisa, M., Goto, S., Sato, Y., Kawashima, M., Furumichi, M. & Tanabe, M. (2014). Data, information, knowledge and principle: back to metabolism in KEGG. Nucleic acids research, 42(D1), pp. D199-D205.
Karolchik, D., Barber, G.P., Casper, J., Clawson, H., Cline, M.S., Diekhans, M., Dreszer, T.R., Fujita, P.A., Guruvadoo, L. & Haeussler, M. (2014). The UCSC Genome Browser database: 2014 update. Nucleic acids research, 42(D1), pp. D764-D770.
Kawashima, S., Ogata, H. & Kanehisa, M. (1999). AAindex: amino acid index database. Nucleic acids research, 27(1), pp. 368-369.
Kawashima, S., Pokarowski, P., Pokarowska, M., Kolinski, A., Katayama, T. & Kanehisa, M. (2008). AAindex: amino acid index database, progress report 2008. Nucleic acids research, 36(suppl 1), pp. D202-D205.
55
Kierczak, M., Ginalski, K., Dramiński, M., Koronacki, J., Rudnicki, W. & Komorowski, J. (2009). A rough set-based model of HIV-1 reverse transcriptase resistome. Bioinformatics and biology insights, 3, p. 109.
Lander, E.S. & Botstein, D. (1989). Mapping mendelian factors underlying quantitative traits using RFLP linkage maps. Genetics, 121(1), pp. 185-199.
Larkin, M., Blackshields, G., Brown, N., Chenna, R., McGettigan, P.A., McWilliam, H., Valentin, F., Wallace, I.M., Wilm, A. & Lopez, R. (2007). Clustal W and Clustal X version 2.0. Bioinformatics, 23(21), pp. 2947-2948.
Le Rouzic, A. & Carlborg, Ö. (2008). Evolutionary potential of hidden genetic variation. Trends in Ecology & Evolution, 23(1), pp. 33-37.
Le Rouzic, A., Siegel, P.B. & Carlborg, Ö. (2007). Phenotypic evolution from genetic polymorphisms in a radial network architecture. BMC biology, 5(1), p. 50.
Li, X., Kierczak, M., Shen, X., Ahsan, M., Carlborg, Ö. & Marklund, S. (2013). PASE: a novel method for functional prediction of amino acid substitutions based on physicochemical properties. Frontiers in genetics, 4.
Liu, D.J., Peloso, G.M., Zhan, X., Holmen, O.L., Zawistowski, M., Feng, S., Nikpay, M., Auer, P.L., Goel, A. & Zhang, H. (2014). Meta-analysis of gene-level tests for rare variant association. Nature genetics, 46(2), pp. 200-204.
Lynch, M. & Walsh, B. (1998). Genetics and analysis of quantitative traits. Marchini, J. & Howie, B. (2010). Genotype imputation for genome-wide association studies.
Nature Reviews Genetics, 11(7), pp. 499-511. Marklund, S. & Carlborg, Ö. (2010). SNP detection and prediction of variability between chicken
lines using genome resequencing of DNA pools. BMC genomics, 11(1), p. 665. Marquez, G., Siegel, P. & Lewis, R. (2010). Genetic diversity and population structure in lines of
chickens divergently selected for high and low 8-week body weight. Poultry science, 89(12), pp. 2580-2588.
McLaren, W., Pritchard, B., Rios, D., Chen, Y., Flicek, P. & Cunningham, F. (2010). Deriving the consequences of genomic variants with the Ensembl API and SNP Effect Predictor. Bioinformatics, 26(16), pp. 2069-2070.
Ng, P.C. & Henikoff, S. (2003). SIFT: Predicting amino acid changes that affect protein function. Nucleic acids research, 31(13), pp. 3812-3814.
Ng, P.C. & Henikoff, S. (2006). Predicting the effects of amino acid substitutions on protein function. Annu. Rev. Genomics Hum. Genet., 7, pp. 61-80.
Park, H.-B., Jacobsson, L., Wahlberg, P., Siegel, P.B. & Andersson, L. (2006). QTL analysis of body composition and metabolic traits in an intercross between chicken lines divergently selected for growth. Physiological genomics, 25(2), pp. 216-223.
Pei, J. & Grishin, N.V. (2001). AL2CO: calculation of positional conservation in a protein sequence alignment. Bioinformatics, 17(8), pp. 700-712.
Pettersson, M., Besnier, F., Siegel, P.B. & Carlborg, Ö. (2011). Replication and explorations of high-order epistasis using a large advanced intercross line pedigree. PLoS genetics, 7(7), p. e1002180.
Pevsner, J. (2009). Analysis of genomic DNA with the UCSC genome browser. In: Bioinformatics for DNA Sequence Analysis Springer, pp. 277-301.

56
Ramensky, V., Bork, P. & Sunyaev, S. (2002). Human non!synonymous SNPs: server and survey. Nucleic acids research, 30(17), pp. 3894-3900.
Rubin, C.-J., Zody, M.C., Eriksson, J., Meadows, J.R., Sherwood, E., Webster, M.T., Jiang, L., Ingman, M., Sharpe, T. & Ka, S. (2010). Whole-genome resequencing reveals loci under selection during chicken domestication. Nature, 464(7288), pp. 587-591.
Rudnicki, W.R. & Komorowski, J. Feature synthesis and extraction for the construction of generalized properties of amino acids. In: Proceedings of Rough Sets and Current Trends in Computing2004: Springer, pp. 786-791.
Simmons, D. (2008). The use of animal models in studying genetic disease: transgenesis and induced mutation. Nature education, 1(1), p. 70.
Stranger, B.E., Stahl, E.A. & Raj, T. (2011). Progress and promise of genome-wide association studies for human complex trait genetics. Genetics, 187(2), pp. 367-383.
Team, R.C. (2012). R: A Language and Environment for Statistical Computing. R Foundation for Statistical Computing, Vienna, Austria, 2012: ISBN 3-900051-07-0.
Thompson, J.D., Higgins, D.G. & Gibson, T.J. (1994). CLUSTAL W: improving the sensitivity of progressive multiple sequence alignment through sequence weighting, position-specific gap penalties and weight matrix choice. Nucleic acids research, 22(22), pp. 4673-4680.
Wahlberg, P., Carlborg, Ö., Foglio, M., Tordoir, X., Syvänen, A.-C., Lathrop, M., Gut, I.G., Siegel, P.B. & Andersson, L. (2009). Genetic analysis of an F2 intercross between two chicken lines divergently selected for body-weight. BMC genomics, 10(1), p. 248.
Wang, W.Y., Barratt, B.J., Clayton, D.G. & Todd, J.A. (2005). Genome-wide association studies: theoretical and practical concerns. Nature Reviews Genetics, 6(2), pp. 109-118.
Yu, B. & Hinchcliffe, M. (2011). In silico tools for gene discovery: Springer.

57
Acknowledgements
First and foremost thanks to Almighty Allah for everything. I am greatly indebted to Higher Education Commission of Pakistan (HEC) for providing me such an opportunity of postgraduate education. This research work was carried out at the Department of Clinical Sciences (and previously at Department of Animal Breeding and Genetics for the first two years) at Swedish University of Agricultural Sciences, Uppsala, Sweden. I am grateful to these departments and the university itself for providing an excellent platform for my research studies. I am really grateful to my main supervisors Örjan Carlborg and Stefan Marklund for their supervision and support throughout this period. I always enjoyed very friendly and open discussions with you guys on every aspect of life, especially with Örjan while sharing the same office. I really admire you. Thank you for that and all the parties at your places! ! I am also thankful to my co-supervisors Lucy Crooks, Anna Johansson, and Marcin Kierczak for extending all the help, support and guidance. I am very pleased with everyone (past and present members) in the Computational Genetics group for providing such an excellent academic and social environment. Thank you guys! ! I would like to recognise here the hospitality extended to me by Dr. Paul B. Siegel during my visit to his lab in US. Thank you Paul !

58
I take this opportunity to thank Dr. Erik Bongcam-Rudloff for enabling me to come to Sweden and for his help and support throughout this period. I also take this opportunity to thank all my “Friends and Families” for all the fun and parties. Without them our social and cultural life could have been really hard here. Thanks again. Last but not least I want to thank my wife’s and my loving parents, and my family here and back in Pakistan for all their support and prayers. My wife took every care of the family here during this time purely out of love and affection between us. My wife and my two daughters are always a great source of joy and happiness. Thank you Sweden! We will miss you.


![E-commerce ^]vPo [ Çîìíò Results and review...4,000+ KFC outlets, 500+ cinemas, and department stores such as Intime, Xidan Joy City participated in this game. In this game, there](https://cdn.vdocuments.us/doc/165x107/5f8567a04112597eb809ef06/e-commerce-vpo-results-and-review-4000-kfc-outlets-500-cinemas.jpg)


