MAP4K3 Is a Component of the TORC1 SignallingComplex that Modulates Cell Growth and Viability inDrosophila melanogasterMartın Resnik-Docampo, Jose F. de Celis*
Centro de Biologıa Molecular Severo Ochoa, Consejo Superior de Investigaciones Cientıficas and Universidad Autonoma de Madrid, Madrid, Spain
Abstract
Background: MAP4K3 is a conserved Ser/Thr kinase that has being found in connection with several signalling pathways,including the Imd, EGFR, TORC1 and JNK modules, in different organisms and experimental assays. We have analyzed theconsequences of changing the levels of MAP4K3 expression in the development of the Drosophila wing, a convenientmodel system to characterize gene function during epithelial development.
Methodology and Principal Findings: Using loss-of-function mutants and over-expression conditions we find that MAP4K3activity affects cell growth and viability in the Drosophila wing. These requirements are related to the modulation of theTORC1 and JNK signalling pathways, and are best detected when the larvae grow in a medium with low proteinconcentration (TORC1) or are exposed to irradiation (JNK). We also show that MAP4K3 display strong genetic interactionswith different components of the InR/Tor signalling pathway, and can interact directly with the GTPases RagA and RagC andwith the multi-domain kinase Tor.
Conclusions and Significance: We suggest that MAP4K3 has two independent functions during wing development, onerelated to the activation of the JNK pathway in response to stress and other in the assembling or activation of the TORC1complex, being critical to modulate cellular responses to changes in nutrient availability.
Citation: Resnik-Docampo M, de Celis JF (2011) MAP4K3 Is a Component of the TORC1 Signalling Complex that Modulates Cell Growth and Viability in Drosophilamelanogaster. PLoS ONE 6(1): e14528. doi:10.1371/journal.pone.0014528
Editor: Patrick Callaerts, Katholieke Universiteit Leuven, Belgium
Received June 29, 2010; Accepted December 17, 2010; Published January 18, 2011
Copyright: � 2011 Resnik-Docampo, de Celis. This is an open-access article distributed under the terms of the Creative Commons Attribution License, whichpermits unrestricted use, distribution, and reproduction in any medium, provided the original author and source are credited.
Funding: Grants BFU2009-09403 and CSD2007-00008 were given to J.F.dC., and an institutional grant from Fundacin Ramn Areces to the Centro de BiologıaMolecular Severo Ochoa. The funders had no role in study design, data collection and analysis, decision to publish, or preparation of the manuscript.
Competing Interests: The authors have declared that no competing interests exist.
* E-mail: [email protected]
Introduction
The Drosophila wing imaginal disc is a model system to study
epithelial development, and is particularly well suited to analyse
the involvement of signalling pathways in the regulation of organ
growth and pattern formation [1–4]. The wing disc primordium is
specified in the embryonic ectoderm as a group of approximately
30 cells that proliferate during the larval stages to form the mature
disc [1]. The proliferative stage of the disc is accompanied by the
specification of different territories, and by the commitment of
cells to specific cell fates [2]. Most conserved signalling pathways
have being shown to play determining roles in the control of cell
proliferation, cell survival and during the specification of cell
identities in the wing disc. Furthermore, genetic modifications in
the activity of individual pathways result in very specific
phenotypes in the wing, the adult structure that differentiates
from the central region of the wing disc epithelium. These
phenotypes can be used as a diagnostic to assign genes identified
through genetic screens to individual signalling pathways [5,6]. In
addition, the proliferation and differentiation of wing cells is very
sensitive to changes in the level of signalling, allowing the
identification of additional components of these pathways by both
loss- and gain-of-function genetic screens.
One of the pathways that play a prominent role in the
regulation of cell growth is the Insulin receptor pathway (InR),
which activity is required to promote cellular growth and
progression through the cell cycle in response to growth factors
[7–11]. In general, mutations that decrease Insulin signalling in
the wing cause the formation of smaller than normal wings, due to
a reduced number of cells, and more prominently, to a reduction
in cell size. Insulin signalling is to a large extent mediated by the
activation of the TORC1 complex [12], following a linear
pathway that is well characterised in both vertebrates and
invertebrates [13–16]. This pathway involves the inactivation of
the GTPase activating protein TSC1/2 by Protein Kinase B
(PKB/Akt)-mediated phosphorylation [17–19]. The inactivation
of TSC1/2 allows the accumulation of the small GTPase Rheb in
its GTP-bound form [20–23], and the assembly of a multiprotein
complex containing the Ser/Thr kinase protein Tor (Target of
Rapamicin) and the substrate adaptor protein Raptor, among
other components. This complex, named TORC1 is able to
activate ribosomal S6 kinase (S6K) [24–26] and to inactivate 4E-
binding protein (4E-BP) [24,27], an inhibitor of the eukaryotic
initiation factor 4E (eIF-4E). These effects lead to ribosome
complex formation and translation, and to the regulation of
protein synthesis and cellular growth. In addition to Insulin
PLoS ONE | www.plosone.org 1 January 2011 | Volume 6 | Issue 1 | e14528
signalling, the activity of TORC1 is also regulated by intracellular
levels of aminoacids, using a parallel pathway that is independent
of Rheb [28,29]. This branch of the pathway confers to TORC1
the ability to act as a sensor for nutrients, and although it is less-
well characterized, recent studies have implicated several aminoa-
cid transporters [30,31], the Ras-related proteins RagA, RagB,
RagC and RagD [32–34], and MAP4K3 as upstream components
of TORC1 [35,36]. Thus, it appears that the nucleotide status of
Rag proteins is regulated by amino acids and perhaps by
MAP4K3, and when RagA/B dimmers are in a GTP-bound
form and RagC/D dimmers in a GDP-bound form they can
interact with and activate TORC1.
We isolated one P-UAS insertion in the 59 region of CG7097
[5], a gene recently named happyhour (hppy) due to the increased
resistance to ethanol-induced sedation displayed by hypomorphic
alleles [37]. hppy encodes the Drosophila orthologue of MAP4K3, a
Ser/Thr Kinase belonging to the Germinal Center Kinase I
(GCK-I) family of Ste20-related kinases [38]. This protein is
characterized by a Ser/Thr Kinase catalytic domain and by a
Citron-homology domain that might be involved in protein-
protein interactions. MAP4K3 has being implicated in different
cellular processes based in biochemical and cellular assays carried
out in different experimental systems. The proposed requirements
of MAP4K3 include the regulation of the Imd pathway in
response to E. coli infection in fly cells, the inhibition of EGFR
signalling in fly brain neurons, the nutrient regulation of TORC1
signalling in fly and human cell cultures and the induction of the
intrinsic cell death pathway [16,35–37,39–42]. More recently, a
MAP4K3 mutant has being found to display phenotypes
characteristic of low TORC1 activity [36]. We have used the
advantages of the Drosophila wing model to analyze the functional
requirements of hppy/MAP4K3 in epithelial development. We
show that loss of MAP4K3 results in a weak reduction in cell size,
and that this phenotype is very sensitive to nutrient availability. In
addition, increased expression of MAP4K3 induces cell death and
strongly down-regulates TORC1 signalling. The MAP4K3
protein is expressed in the cytoplasm of all wing disc cells, and
pull-down experiments indicate that this protein can interact with
Rag GTPases and Tor, suggesting that it is a component of the
TORC1 complex. Cells expressing increased levels of MAP4K3
behave similarly to gain of Tor expression, suggesting that the
over-expression of MAP4K3 disrupt protein complexes involving
Tor.
Results
Increased expression of hppy reduces the size of thewing
Combinations between the P-GS insertion EP-704 and a variety
of Gal4 drivers expressed in the wing disc result in a very
consistent reduction of wing size (Fig. 1A–B and Fig. S1). In
general, the patterns of veins and sensory organs remain normal in
these wings. Phenotypes in which the wing has a normal pattern
but is smaller in size are typical of reduced Insulin/Tor signalling
[7–11], and therefore the gene affected by the EP-704 insertion is
a good candidate to interfere with this signalling pathway. EP-704
maps within the 59UTR of hppy transcripts (Fig. 1H and Fig. S1),
and combinations between EP-704 and Gal4 lines show increased
levels of hppy mRNA (Fig. 1J and data not shown). To confirm that
hppy is responsible for the wing size reductions displayed by EP-
704/Gal4 flies, we over-expressed hppy in different UAS-hppy/Gal4
combinations. These flies show identical phenotypes compared
with the corresponding EP-704/Gal4 combinations (Fig. 1D and
Fig. S1). Furthermore, the phenotype of EP-704/Gal4 flies is
suppressed when interference RNA directed against hppy is
expressed in this background (nub-Gal4 EP-704/UAS-ihppy;
Fig. 1G), confirming that the increased expression of this gene in
EP-704/Gal4 flies is causing the reduction in wing size. MAP4K3
has a Ser/Thr Kinase catalytic domain and a Citron-Homology
domain (CNH) [38]. The over-expression of a synthetic protein
containing only the kinase domain (Hppy-DCN) also results in a
strong reduction of wing size (Fig. 1F). In contrast, the over-
expression of only the CNH domain (Hppy-DK) has no
phenotypic consequences (Fig. 1E).
The expression of hppy is detected ubiquitously in wild type discs
by in situ hybridization (Fig. 1I). To determine the subcellular
localization of MAP4K3, we generated an antibody against the
protein, and found that it is present in the cytoplasm of all wing
cells (Fig. 1K). The expression of the protein is strongly reduced in
genetic combinations involving the interference RNA directed
against hppy (en-Gal4/UAS-ihppy; Fig. 1L–M), and is detected at
higher than normal levels in UAS-hppy/Gal4 discs (Fig. 1N).
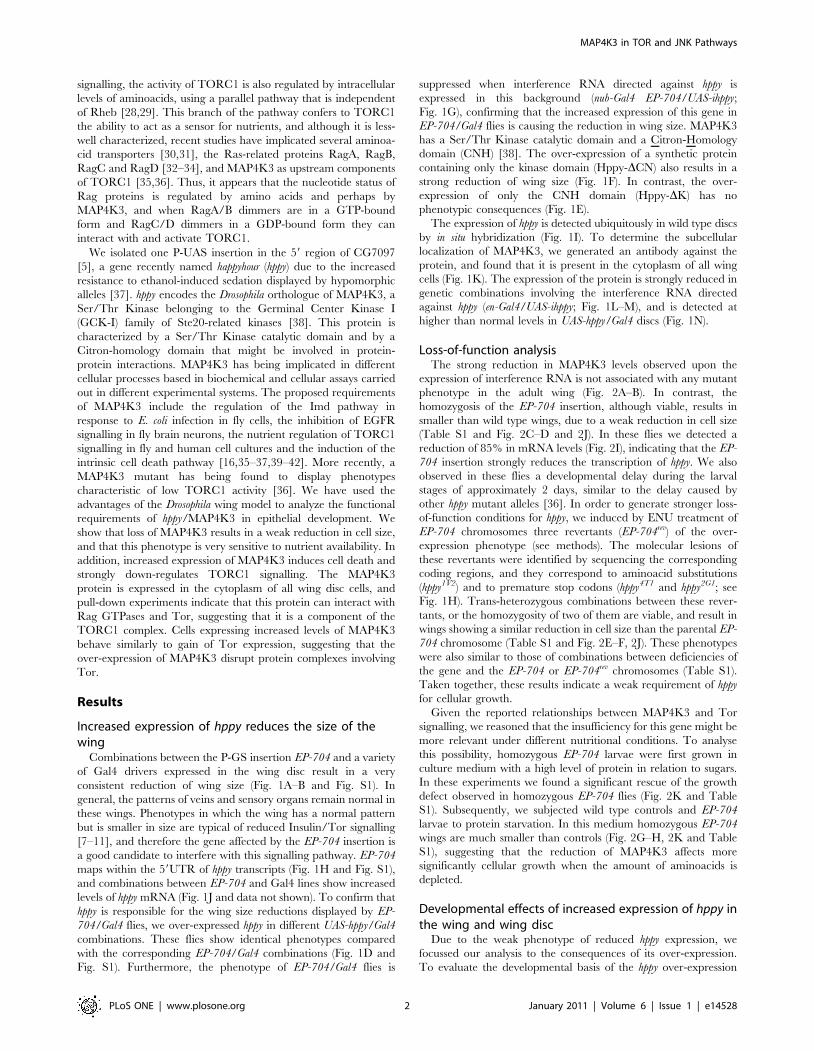
Loss-of-function analysisThe strong reduction in MAP4K3 levels observed upon the
expression of interference RNA is not associated with any mutant
phenotype in the adult wing (Fig. 2A–B). In contrast, the
homozygosis of the EP-704 insertion, although viable, results in
smaller than wild type wings, due to a weak reduction in cell size
(Table S1 and Fig. 2C–D and 2J). In these flies we detected a
reduction of 85% in mRNA levels (Fig. 2I), indicating that the EP-
704 insertion strongly reduces the transcription of hppy. We also
observed in these flies a developmental delay during the larval
stages of approximately 2 days, similar to the delay caused by
other hppy mutant alleles [36]. In order to generate stronger loss-
of-function conditions for hppy, we induced by ENU treatment of
EP-704 chromosomes three revertants (EP-704rev) of the over-
expression phenotype (see methods). The molecular lesions of
these revertants were identified by sequencing the corresponding
coding regions, and they correspond to aminoacid substitutions
(hppy1V2) and to premature stop codons (hppy4T1 and hppy2G1; see
Fig. 1H). Trans-heterozygous combinations between these rever-
tants, or the homozygosity of two of them are viable, and result in
wings showing a similar reduction in cell size than the parental EP-
704 chromosome (Table S1 and Fig. 2E–F, 2J). These phenotypes
were also similar to those of combinations between deficiencies of
the gene and the EP-704 or EP-704rev chromosomes (Table S1).
Taken together, these results indicate a weak requirement of hppy
for cellular growth.
Given the reported relationships between MAP4K3 and Tor
signalling, we reasoned that the insufficiency for this gene might be
more relevant under different nutritional conditions. To analyse
this possibility, homozygous EP-704 larvae were first grown in
culture medium with a high level of protein in relation to sugars.
In these experiments we found a significant rescue of the growth
defect observed in homozygous EP-704 flies (Fig. 2K and Table
S1). Subsequently, we subjected wild type controls and EP-704
larvae to protein starvation. In this medium homozygous EP-704
wings are much smaller than controls (Fig. 2G–H, 2K and Table
S1), suggesting that the reduction of MAP4K3 affects more
significantly cellular growth when the amount of aminoacids is
depleted.
Developmental effects of increased expression of hppy inthe wing and wing disc
Due to the weak phenotype of reduced hppy expression, we
focussed our analysis to the consequences of its over-expression.
To evaluate the developmental basis of the hppy over-expression
MAP4K3 in TOR and JNK Pathways
PLoS ONE | www.plosone.org 2 January 2011 | Volume 6 | Issue 1 | e14528

phenotype, we measured wing size and cell density in wings
expressing different levels of the gene. Wing size was measure in
pixels in the area shown in Fig. 3A, and cell size/density was
calculated as the number of trichomes (each wing cell
differentiates one trichome) in a standard region located in the
posterior compartment (red square in Fig. 3B). Increasing the
level of MAP4K3 results in progressively smaller wings and
reduced cell sizes, with minor vein pattern defects consisting in
the formation of extra-vein material (Fig. 3C–D and Table S1).
The reduction in the number of cells in wings over-expressing
hppy varies from 15% to 28% in nub-Gal4 UAS-hppy /+ heterozy-
gous compared to nub-Gal4 UAS-CG7097 homozygous wings
(Fig. 3H and Table S1). In this manner, the smaller size of the
wing is caused by both a lower than normal number of cells and
by a reduction in cell size. The reduction in the number of cells
could be due to lower cell proliferation or to increased cell death.
To analyse the relative contribution of these processes to the hppy
over-expression phenotype, we first visualized in en-Gal4/UAS-
hppy discs the number of cells in mitosis (Phospho-Histone 3,
PH3). In these experiments, we over-expressed MAP4K3 only in
the posterior compartment, and calculated the mitotic index as
the media of the ratios between PH3 positive cells in each
compartment and compartment size in 14 wing discs. We found a
significant increase in the fraction of mitotic cells in the posterior
compartment of en-Gal4/UAS-hppy wing discs (Fig. 3I–J). Thus the
ratio of the posterior and anterior mitotic indexes in en-Gal4/
Figure 1. The phenotype of EP-704/Gal4 combinations is caused by increased expression of MAP4K3/happyhour. (A) Wild type wing. (B)nub-Gal4 EP-704/+ wing. nub-Gal4 is expressed in the wing blade and hinge during the second and third larval instars. (C) EP-704 homozygous wing.This wing is reduced in size compared to wild type by a 12%. (D) nub-Gal4 UAS-hppy/+ wing, showing the same phenotype of smaller than normalwing size than nub-Gal4 EP-704/+. (E) nub-Gal4/UAS-hppy-DK wing showing a wild type phenotype. (F) nub-Gal4/UAS-hppy-DCN wing showing astrong reduction in the size of the wing hinge and blade. (G) EP-704 nub-Gal4/UAS-ihppy wing, showing a rescue of the nub-Gal4 EP-704/+ phenotype.(H) Gene structure of hppy, showing the two transcripts produced by alternative splicing (CG7097-RA and CG7097-RB), the position of the EP-704insertion in the first non-coding exon and the positions of the mutations found in the revertants hppy4T1 (Q30Stop), hppy1V2 (F181Y) and hppy2G1
(Q758Stop). The Hppy protein (MAP4K3, shown below) contains a Ser/Thr kinase domain (red) and a Citron Homology domain (blue). The genomiccoordinates are indicated below in Kb. (I–J) In situ hybridization using a hppy probe in third instar discs of wild type (I) and salEPv-Gal4/EP-704 (J) andgenotypes. The gene is over-expressed in the salEPv domain in salEPv-Gal4/EP-704 discs, and in all wing disc cells in normal third instar discs. (K–N)Expression and subcellular localization of MAP4K3 in different genetic backgrounds. The protein is localized in the cytoplasm of all wing cells (redsignal in K) in wild type discs, it is strongly reduced in discs expressing interference RNA directed against hppy (en-Gal4 UAS-GFP/UAS-ihppy, L–M), andit is present at higher than normal levels in nub-Gal4 EP-704/+ wing discs (N). M is the red channel of L, showing the expression of MAP4K3. The basalmembrane is labelled in green in K by vkg-GFP protein trap (green). N is at double magnification than K-M, and shows the boundary between cellsexpressing and non-expressing nub-Gal4.doi:10.1371/journal.pone.0014528.g001
MAP4K3 in TOR and JNK Pathways
PLoS ONE | www.plosone.org 3 January 2011 | Volume 6 | Issue 1 | e14528
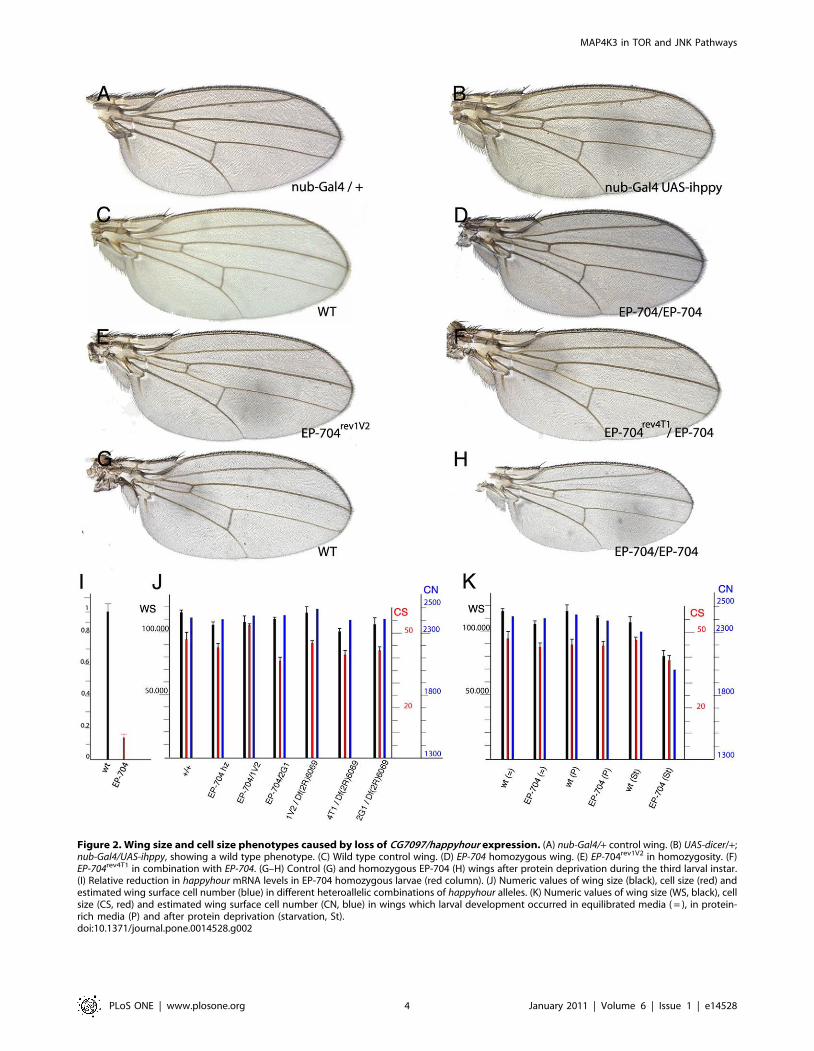
Figure 2. Wing size and cell size phenotypes caused by loss of CG7097/happyhour expression. (A) nub-Gal4/+ control wing. (B) UAS-dicer/+;nub-Gal4/UAS-ihppy, showing a wild type phenotype. (C) Wild type control wing. (D) EP-704 homozygous wing. (E) EP-704rev1V2 in homozygosity. (F)EP-704rev4T1 in combination with EP-704. (G–H) Control (G) and homozygous EP-704 (H) wings after protein deprivation during the third larval instar.(I) Relative reduction in happyhour mRNA levels in EP-704 homozygous larvae (red column). (J) Numeric values of wing size (black), cell size (red) andestimated wing surface cell number (blue) in different heteroallelic combinations of happyhour alleles. (K) Numeric values of wing size (WS, black), cellsize (CS, red) and estimated wing surface cell number (CN, blue) in wings which larval development occurred in equilibrated media ( = ), in protein-rich media (P) and after protein deprivation (starvation, St).doi:10.1371/journal.pone.0014528.g002
MAP4K3 in TOR and JNK Pathways
PLoS ONE | www.plosone.org 4 January 2011 | Volume 6 | Issue 1 | e14528

UAS-hppy; UAS-GFP/+ discs was 1.8 (sd. 0.26), whereas in en-Gal4
UAS-GFP/+ controls this value was 1.4 (sd. 0.07). A similar
change was also observed in wing discs over-expressing either
wild type Tor (Fig. 3K) or the Tor dominant negative form
TorTED (Fig. 3L; P/A ratio is 2.07 and sd. 0.4). The augmented
number of mitosis was accompanied by a robust cell-autonomous
apoptotic response in discs over-expressing MAP4K3, visualised
as an accumulation of cells located close to the basal membrane
and expressing activated Caspase3 (Fig. 4A–B). These cells also
express puckered, a reporter of JNK activity, in nub-Gal4 UAS-hppy
/puc-lacZ discs (Fig. 4E–F). We suggest that increased levels of
MAP4K3 induce apoptosis, likely through JNK activation, and
that the surviving cells proliferate more than normal due to
compensative proliferation [43]. In fact, when apoptosis is
suppressed (Fig. 4C–D), the excess of PH3 positive cells is
corrected to near normal values (1.27 P/A index and sd. 0.23).
Interestingly, a reduction of hppy levels reduces JNK signalling
cell autonomously in response to irradiation (Fig. 4G–H),
suggesting that MAP4K3 does play a physiological role in the
activation of this pathway. This function of MAP4K3 appears to
be independent of Tor signalling, because higher than normal
levels of Tor and expression of TorTED only induce very low
Figure 3. Wing size and cell size phenotypes caused by hppy and Tor over-expression and their relationships with mitosis. (A–B) Wildtype control wings at 56and 206magnifications, showing the regions used to measure wing area (A, red line) and cell density (light red square in B).(C–D) Wing phenotypes caused by different levels of hppy over-expression in nub-Gal4 UAS-hppy /+ (C) and nub-Gal4 UAS-hppy /nub-Gal4 UAS-hppy(D) wings. (E–G) Wing phenotypes of genetic combinations in which cell death is suppressed or reduced in the background of hppy over-expression.(E) nub-Gal4 UAS-hppy /UAS-DIAP; (F) nub-Gal4 UAS-hppy /+; Df(3L)H99/+; (G) nub-Gal4 UAS-hppy /+; UAS-puc/+. (H) Wing measures of the genotypesshowed in A–G. Wing size is shown in the black columns (WS), cell number in the red ones (CS) and estimated cell number in the blue ones (CN).Numbers 1–6 correspond to the following genotypes: nub-Gal4/+ (1), nub-Gal4 UAS-hppy /+ (2); nub-Gal4 UAS-hppy/nub-Gal4 UAS-hppy (3); nub-Gal4UAS-hppy/UAS-DIAP (4); nub-Gal4 UAS-hppy/+; DfH99/+ (5) and nub-Gal4 UAS-hppy /+ UAS-puc/+ (6). (I–L) Expression of PH3 (red) in wild type wingdiscs (I–I’), en-Gal4 UAS-GFP/UAS-hppy (J–J’), en-Gal4 UAS-GFP/UAS-Tor (K–K’) and en-Gal4 UAS-GFP/UAS-TorTED (L–L’). The expression of GFP is in green.The corresponding red and blue (showing Wingless expression) channels are shown below (I’–L’).doi:10.1371/journal.pone.0014528.g003
MAP4K3 in TOR and JNK Pathways
PLoS ONE | www.plosone.org 5 January 2011 | Volume 6 | Issue 1 | e14528

levels of apoptosis when the miss-expression occurs in one wing
compartment (Fig. 4I–J and data not shown).
We also study the contribution of cell death to the phenotype of
increased hppy expression by suppressing cell death in the nub-Gal4
UAS-hppy/+ background. We used the heterozygosis of the H99
deficiency, which removes the pro-apoptotic genes reaper, hid and
grim, as well as the over-expression of dIAP, P35 and Puckered
(puc), which are known to suppress cell death acting at different
levels of the apoptotic pathway [43–46]. In the case of
combinations involving H99/+ and dIAP we find that the
reduction of cell death does not significantly rescue the wing size
phenotype of MAP4K3 over-expression (Fig. 3E–F and H). When
cell death is prevented using the ectopic expression of puc, wing
size reduction is slightly stronger, and many cells differentiate
between the dorsal and ventral wing layers (Fig. 3G–H). Cell size is
not affected by the suppression of cell death, and remains similar
to that caused by increased expression of MAP4K3 (Fig. 3H). We
confirmed that DfH99, DIAP and Puc over-expression efficiently
suppressed the expression of activated Cas3 in nub-Gal4 UAS-
CG7097/+ wing discs (Fig. 4C–D and data not shown).
The effects of MAP4K3 over-expression are similar tothose caused by modifications in the TOR and InRsignalling pathways
The reduction in cell size observed when MAP4K3 is over-
expressed is similar to the effect caused by loss of InR/Tor activity
[7–11]. To evaluate directly the consequences of loss of InR/Tor
Figure 4. Cell death phenotypes and JNK activation caused by hppy and Tor. (A–B) Expression of activated Cas3 (green) and FasIII (red) innub-Gal4 UAS-hppy/+ (A) and ap-Gal4 UAS-hppy/+ (B) third instar wing discs. (C–D) The presence of apoptotic cells is suppressed when DIAP (C) or Puc(D) are over-expressed with hppy. Below A and C are the corresponding Z sections of the discs. In C the nuclei are labelled by Topro (red). (E)Expression of bGal (red) and GFP (green) in nub-Gal4 UAS-GFP/UAS-hppy; puc-lacZ/+. (F) Expression of bGal (red) and GFP (green) in en-Gal4 UAS-GFP/UAS-hppy; puc-lacZ/+. In both cases there is a strong induction of puc expression in the domain of hppy over-expression (red channels in E’ and F’).(G–G’) Expression of puc-lacZ (red) in en-gal4 UAS-GFP/UAS-ihppy; puc-lacZ/+ third instar disc dissected 8 hours after irradiation. The image is aprojection of 12 focal planes through the wing disc epithelium. G’ shows the corresponding red channel. (H) Ratio between the intensity of the redsignal (puc-lacZ expression) between the anterior and posterior compartments of en-Gal4 UAS-GFP/puc-lacZ (control, black column) and en-Gal4 UAS-GFP/puc-lacZ; UAS-ihppy/+ (i-happy, red column). The value of the t-student test is also indicated (t: 0.002). (I–J) Induction of cell death in en-Gal4 UAS-GFP/UAS-Tor (I) and en-Gal4 UAS-GFP/ UAS-TorTED (J) wing discs. The expression of activated Cas3 is in red and GFP in green. The arrowhead points tothe places where activated Cas3 is detected.doi:10.1371/journal.pone.0014528.g004
MAP4K3 in TOR and JNK Pathways
PLoS ONE | www.plosone.org 6 January 2011 | Volume 6 | Issue 1 | e14528
signalling in the wing disc, we expressed several interference RNAs
or modified versions of different components of the InR/Tor
pathway in this tissue (Fig. 5, 6 and Table S1). We found changes
in wing size and cell size consistent with the known requirements
of this pathway during imaginal development [7–11]. Thus, loss of
Akt (Fig. 5D) and Tor (Fig. 5G) results in a 27–30% increase in cell
density, and expression of dominant negative versions of Dp110
(Fig. 5C), RagA (Fig. 6G) and dS6K (Fig. 6C) caused similar but
weaker effects on cell size (7–14% increase in cell density; Fig. 6L
and Table S1). The corresponding wings are smaller than normal
in size, and these reductions are in part due to a lower than normal
number of cells (Fig. 5J, Fig. 6L and Table S1). When the activity
of the pathway is increased by expressing activated forms of Akt
(Table S1), RagA (Fig. 6F) and dS6K (Fig. 6D), or by a reduction
in the negative modulators Pten (Fig. 5B) and TSC2 (Fig. 5F), cell
size is only moderately affected and wing size is generally larger
than normal (ranging from 5% in the case of activated dS6K to
32% in the case of loss of Pten; Fig. 5J, Fig. 6L and Table S1). The
estimated number of cells in these combinations is also higher than
normal, particularly in the cases of activated RagA and loss of Pten
(20% more cells than normal; Fig. 5J, Fig. 6L and Table S1). In
this manner, the effects caused by over-expression of MAP4K3 are
similar to those observed when InR/Tor activity is reduced, with
the important difference that a reduction in InR/Tor signalling
does not lead to significant cell death in most of the combinations
analysed (Fig. 4 and data not shown).
Figure 5. Wing phenotypes of genetic combinations between hppy and modifications in InR/Tor activity. (A–I’) Representative wings ofgenetic combinations involving nub-Gal4 and different UAS constructs affecting InR/TORC1 components alone (B–I) or in combination with UAS-hppy(B’–I’). (A) nub-Gal4/+ control wing. (B–B’) nub-Gal4/UAS-iPten (B) and nub-Gal4/UAS-iPten/UAS-hppy (B’). (C–C’) nub-Gal4/UAS-Dp110D954A (C) and nub-Gal4/UAS-Dp110D954AUAS-hppy (C’). (D–D’) nub-Gal4/UAS-iAkt (D) and nub-Gal4/UAS-iAkt/&UAS-hppy (D’). (E) nub-Gal4/UAS-hppy control wing. (F–F’)nub-Gal4/UAS-iTsc2 (F) and nub-Gal4/UAS-iTsc2/UAS-hppy (F’). (G–G’) nub-Gal4/UAS-iTor (G) and nub-Gal4/UAS-iTor/UAS-hppy (G’). (H–H’) nub-Gal4/UAS-TorTED (H) and nub-Gal4/UAS-TorTED/UAS-hppy (H’). (I–I’) nub-Gal4/UAS-iRaptor (I) and nub-Gal4/UAS-iRaptor/UAS-hppy (I’). (J) Quantification of wingphenotypes showing the mean values and standard deviation of wing size (WS, black), cell size (CS, red) and estimated cell number (CN, blue) foreach combination analysed. The ‘‘+’’ and ‘‘2‘‘ signs below each group of three values indicated the data for combinations of nub-Gal4 with thementioned UAS line (2) and the same combination including UAS-hppy (+).doi:10.1371/journal.pone.0014528.g005
MAP4K3 in TOR and JNK Pathways
PLoS ONE | www.plosone.org 7 January 2011 | Volume 6 | Issue 1 | e14528
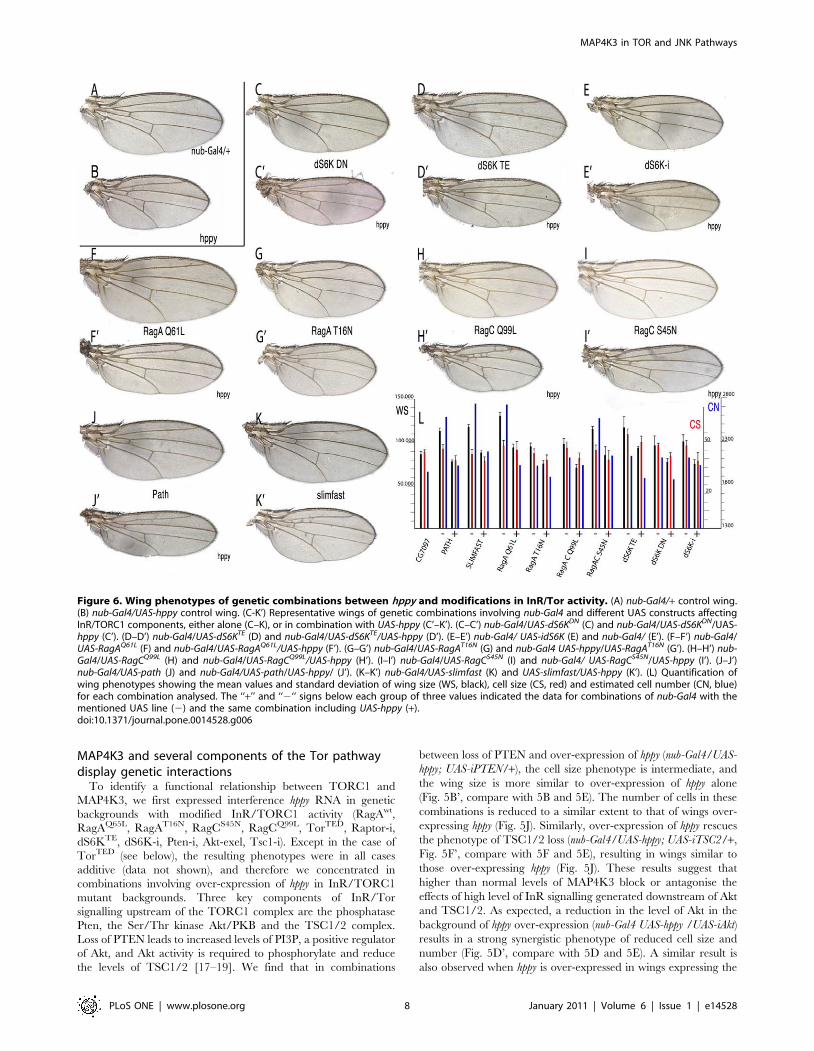
MAP4K3 and several components of the Tor pathwaydisplay genetic interactions
To identify a functional relationship between TORC1 and
MAP4K3, we first expressed interference hppy RNA in genetic
backgrounds with modified InR/TORC1 activity (RagAwt,
RagAQ65L, RagAT16N, RagCS45N, RagCQ99L, TorTED, Raptor-i,
dS6KTE, dS6K-i, Pten-i, Akt-exel, Tsc1-i). Except in the case of
TorTED (see below), the resulting phenotypes were in all cases
additive (data not shown), and therefore we concentrated in
combinations involving over-expression of hppy in InR/TORC1
mutant backgrounds. Three key components of InR/Tor
signalling upstream of the TORC1 complex are the phosphatase
Pten, the Ser/Thr kinase Akt/PKB and the TSC1/2 complex.
Loss of PTEN leads to increased levels of PI3P, a positive regulator
of Akt, and Akt activity is required to phosphorylate and reduce
the levels of TSC1/2 [17–19]. We find that in combinations
between loss of PTEN and over-expression of hppy (nub-Gal4/UAS-
hppy; UAS-iPTEN/+), the cell size phenotype is intermediate, and
the wing size is more similar to over-expression of hppy alone
(Fig. 5B’, compare with 5B and 5E). The number of cells in these
combinations is reduced to a similar extent to that of wings over-
expressing hppy (Fig. 5J). Similarly, over-expression of hppy rescues
the phenotype of TSC1/2 loss (nub-Gal4/UAS-hppy; UAS-iTSC2/+,
Fig. 5F’, compare with 5F and 5E), resulting in wings similar to
those over-expressing hppy (Fig. 5J). These results suggest that
higher than normal levels of MAP4K3 block or antagonise the
effects of high level of InR signalling generated downstream of Akt
and TSC1/2. As expected, a reduction in the level of Akt in the
background of hppy over-expression (nub-Gal4 UAS-hppy /UAS-iAkt)
results in a strong synergistic phenotype of reduced cell size and
number (Fig. 5D’, compare with 5D and 5E). A similar result is
also observed when hppy is over-expressed in wings expressing the
Figure 6. Wing phenotypes of genetic combinations between hppy and modifications in InR/Tor activity. (A) nub-Gal4/+ control wing.(B) nub-Gal4/UAS-hppy control wing. (C-K’) Representative wings of genetic combinations involving nub-Gal4 and different UAS constructs affectingInR/TORC1 components, either alone (C–K), or in combination with UAS-hppy (C’–K’). (C–C’) nub-Gal4/UAS-dS6KDN (C) and nub-Gal4/UAS-dS6KDN/UAS-hppy (C’). (D–D’) nub-Gal4/UAS-dS6KTE (D) and nub-Gal4/UAS-dS6KTE/UAS-hppy (D’). (E–E’) nub-Gal4/ UAS-idS6K (E) and nub-Gal4/ (E’). (F–F’) nub-Gal4/UAS-RagAQ61L (F) and nub-Gal4/UAS-RagAQ61L/UAS-hppy (F’). (G–G’) nub-Gal4/UAS-RagAT16N (G) and nub-Gal4 UAS-hppy/UAS-RagAT16N (G’). (H–H’) nub-Gal4/UAS-RagCQ99L (H) and nub-Gal4/UAS-RagCQ99L/UAS-hppy (H’). (I–I’) nub-Gal4/UAS-RagCS45N (I) and nub-Gal4/ UAS-RagCS45N/UAS-hppy (I’). (J–J’)nub-Gal4/UAS-path (J) and nub-Gal4/UAS-path/UAS-hppy/ (J’). (K–K’) nub-Gal4/UAS-slimfast (K) and UAS-slimfast/UAS-hppy (K’). (L) Quantification ofwing phenotypes showing the mean values and standard deviation of wing size (WS, black), cell size (CS, red) and estimated cell number (CN, blue)for each combination analysed. The ‘‘+’’ and ‘‘2‘‘ signs below each group of three values indicated the data for combinations of nub-Gal4 with thementioned UAS line (2) and the same combination including UAS-hppy (+).doi:10.1371/journal.pone.0014528.g006
MAP4K3 in TOR and JNK Pathways
PLoS ONE | www.plosone.org 8 January 2011 | Volume 6 | Issue 1 | e14528

Dp110 dominant negative form (nub-Gal4/UAS-hppy; UAS-
Dp110D945A/+, Fig. 5C’, compare with 5C and 5E).
We next tested the possible genetic interactions between
MAP4K3 and several components of the TORC1 complex,
including Raptor, RagA, RagC and Tor. In the case of Tor, we
observed strong synergistic interactions when the level of
MAP4K3 is increased in a background of cells with lower amount
of Tor (nub-Gal4 UAS-hppy /UAS-iTor; Fig. 5G’, compare with 5G
and 5E) or expressing the dominant negative form TorTED (nub-
Gal4 UAS-hppy /UAS-TorTED; Fig. 5H’, compare with 5H and 5E).
These effects are manifested in the reduction of cell and wing size,
and consequently also in the total number of cells estimated for
these wings (Fig. 5J). Similar results were observed in the case of
combinations with Raptor, a key member of the TORC1 complex
(nub-Gal4 UAS-hppy /UAS-iraptor; Fig. 5I’, compare with Fig. 5I and
5E). Combinations between activated or dominant negative forms
of RagA and over-expression of hppy were particularly informative.
Thus, the over-expression of hppy cancels the effect of activated
RagA (nub-Gal4 UAS-hppy /UAS-iRagAQ61L; Fig. 6F’, compare with
6F and 6B, and Fig. 6L), and enhances the phenotype of a
dominant negative RagA form (nub-Gal4 UAS-hppy /UAS-Ra-
gAT16N; Fig. 6G’, compare with 6G and 6B). Interactions with
RagC were, as expected opposite to those with RagA. Thus,
activated RagC, which is expected to reduce the activity of the
TORC1 complex, further aggravates the reduction in cell size
caused by excess of hppy (Fig. 6H’, compare with 6H and 6B).
These results suggest that MAP4K3 acts downstream of RagA,
and that the effects of its over-expression are extremely sensitive to
the levels of RagC, Tor and Raptor.
In addition to InR signalling mediated by Akt/TSC1-2/Rheb,
TORC1 activity is also regulated by the level of intracellular
aminoacids [30–31]. Although this pathway is less well char-
acterised, at least two amino acid transporters, encoded by pathetic
(path) [31] and slimfast [30] have being suggested to mediate this
branch of TORC1 regulation. The over-expression of either path
or slimfast affects mostly cell size without changing the final size of
the wing, and consequently these wings are formed by a larger
than normal estimated number of cells (Fig. 6J and 6K,
respectively and Table S1). When we over-expressed hppy in these
backgrounds, the resulting wings have cell sizes, cell numbers and
wing size similar to hppy over-expressing wings (Fig. 6J’ and K’,
compare with 6J and 6K and with Fig. 6B). Finally, in
combinations involving different forms of one of the downstream
components of the pathway, dS6K, and over-expression of hppy,
we found that expression of constitutively activated dS6K
diminishes the cell size reduction caused by MAP4K3 (nub-Gal4
UAS-hppy /UAS-dS6KTE; Fig. 6D’, compare with 6D and Fig. 6L),
and that dominant negative dS6K or interference RNA against its
transcript causes a moderate synergistic phenotype of reduced cell
size (nub-Gal4 UAS-hppy /UAS-dS6KDN; Fig. 6C’, compare with 6C
and nub-Gal4 UAS-hppy /UAS-idS6K; Fig. 6E’, compare with 6E
and 6B). Taken together, these results suggests that MAP4K3 acts
downstream of the aminoacid transporters, and upstream of dS6K
activity. The numerical values, standard deviations and t-test
values of the wings discussed in this and the previous section are
presented in Table S1.
MAP4K3 interacts with the TOR complexThe phenotype of hppy loss and over-expression and the results
of genetic combinations with different members of the InR/Tor
pathways suggest that MAP4K3 is functionally related to TORC1
activity. To confirm the link between MAP4K3 and TORC1, we
explored whether hppy affects other developmental processes
regulated by TORC1, and analysed the possibility of direct
interactions between MAP4K3 and several components of the
TORC1 complex in pull-down experiments. We looked at the
development of the fat body, the fly equivalent to the vertebrate
liver, where loss of TORC1 signalling causes the fusion of lipid
vesicles (47 and Fig. 7A–B), an effect also caused by aminoacid
deprivation [30,47]. The over-expression of hppy in this tissue also
causes this effect (Fig. 7C, compare with 7A), suggesting that hppy
over-expression interferes with TORC1 signalling in different
developmental contexts.
The phenotype of hppy over-expression is therefore in part
related to insufficiency of TORC1, and this could be interpreted
as the consequence of a normal requirement of hppy to regulate
negatively TORC1 activity. This conclusion, however, is in
contrast with the phenotype of hppy hypomorphs [36], which
suggested that MAP4K3 is required to activate the TORC1
complex [35]. Several lines of evidence indicate that the levels of
Tor itself are critical for the correct activity of TORC1. In this
manner, the over-expression of Tor causes a strong and variable
phenotype of wing size reduction that is reminiscent of loss of
TORC1 function (Fig. 7J and 48). Because of the strength and
variability of this phenotype, we could not analyse the effects of
changing the levels of MAP4K3 in this genetic background. Over-
expression of the dominant negative form of Tor, TorTED, also
results in a severe reduction of cell size and wing size (Fig. 7I, K
and M, compare with 7H) which strength depends on the Gal4
driver used (compare Fig. 7K with Fig. 7M). Interestingly, these
genetic backgrounds are very sensitive to the loss of hppy
expression, because the lowering hppy levels significantly rescues
the reduced wing size defect cause by TorTED over-expression
(Fig. 7L, compare with 7K and Fig. 7N, compare with 7M). As
TORC1 function is extremely sensitive to the level of its
components, a possible mechanism to explain the phenotype of
hppy over-expression consistent with these observations is through
changes in the correct balance between members of the complex.
We explored the possibility of direct interactions between
MAP4K3 and some of TORC1 components in pull-down
experiments using MAP4K3 and in vitro translated RagA, RagC,
Tor and Rheb. We found that MAP4K3 can interact directly and
efficiently with RagC (Fig. 7D), and less so with RagA and Tor
(Fig. 7F and E, respectively). Similar results concerning RagA and
RagC were found in inmunoprecipitation studies carried out in
Drosophila culture cells [36]. We could not detect direct
interactions between Rheb and MAP4K3 (Fig. 7G), suggesting
that the over-expression of MAP4K3 might disrupt the formation
of functional TORC1 complexes downstream of Rheb.
Discussion
We have characterised the consequences of changing the
amount of MAP4K3, encoded by hppy, in the development of the
wing disc, focussing on its relationships with the TORC1 signalling
pathway. Previous data suggested that MAP4K3 might be related
with a variety of signalling pathways, including EGFR [37], ImD
[40], JNK [41] and TOR [35,36]. For these reasons, we used the
advantages of the wing model to analyse hppy, as in this system
changes in the level of signalling by a variety of pathways lead to
pathway-specific phenotypes. A reduction of hppy expression in the
wing, using interference RNA or loss-of-function alleles, did not
uncover a critical requirement of the gene for embryonic or larval
viability. In hppy mutant wings we only found a weak reduction in
wing size and cell size, which is compatible with a moderate
reduction of TORC1 activity. It has been recently reported that
the developmental delay caused by protein starvation is similar in
wild type and hppy mutant larvae, suggesting that MAP4K3 is
MAP4K3 in TOR and JNK Pathways
PLoS ONE | www.plosone.org 9 January 2011 | Volume 6 | Issue 1 | e14528

required in vivo to activate TOR and promote growth mostly
when amino acid conditions are rich [36]. In contract, we found a
significant requirement for the gene when hppy mutant larvae grow
under starvation conditions. Thus, these flies still develop smaller
wings than controls, indicating a functional requirement of hppy
when the availability of proteins is reduced. This difference could
be due to the parameters measured (developmental delay vs. cell
and wing size) or to the remnants of hppy function in the alleles
used in each experiment.
We also found that, loss of hppy does not affect cell viability or
JNK signalling, but that in a hppy loss-of-function genetic
background the activation of JNK signalling in response to
irradiation is reduced. Thus, the function of hppy might become
significant mostly when the organism is challenged by stress signals
induced for example by irradiation, indicating a role for the gene
in the modulation of JNK signalling in vivo.
The increase in happyhour expression does have more dramatic
consequences that its loss, causing a severe reduction in the size of
the wing independently of environmental conditions. Wing size
reduction is associated with both apoptosis and a smaller than
normal cell size. The overall morphology and pattern of these
wings is normal, with only a weak phenotype of extra-veins in the
strongest combinations. Cell death induction and reduced cell size
are the diagnostic phenotypes of increased JNK and reduced InR/
Tor signalling, respectively. The same processes are affected by
loss of MAP4K3 expression in the wing, and therefore, from this
analysis we conclude that MAP4K3 has the potential to activate
cell death through the JNK signalling pathway, and also that it can
interfere with some component/s of the InR/Tor cascade. The
effects of loss- and gain of MAP4K3 on JNK activity are opposite,
which is expected from a protein with kinase activity. In contrast
both loss and gain of MAP4K3 seem to reduce the function of
TORC1. It is likely that in this case MAP4K3 acts as part of a
protein complex that can be made non-functional by changes in
the stechiometry of its components. What seems clear is that the
effects of MAP4K3 on JNK and TORC1 are exerted through
independent mechanisms, because the contribution of cell death to
the wing phenotype of MAP4K3 over-expression is very modest,
and Tor reductions only lead to cell death when cells with different
levels of Tor activity are confronted.
The phenotype of MAP4K3 over-expression is very sensitive to
changes in the levels or activity of several members of the InR/Tor
pathway. Thus, strong synergistic interactions were observed when
Akt, raptor and Tor are reduced in the background of MAP4K3
over-expression, and the presence of the dominant-negative form
TorTED in this background entirely eliminates the wing.
Conversely, loss of hppy expression rescues the effects of TorTED
expression. These results suggest that MAP4K3 could act at the
Figure 7. Relationships between CG7097 and the TORC1 complex. (A–C) Fat body phenotypes in control larvae (ppl-Gal4/+; A), and after lossof Tor expression (ppl-Gal4/+; UAS-iTor/+; B) or MAP4K3 over-expression (ppl-Gal4/UAS-hppy; C). (H–J) Control wing (H), and wings corresponding toover-expression of TorTED in the posterior compartment (en-Gal4/UAS-TorTED; I) and Tor in the entire wing blade and hinge (nub-Gal4/UAS-Tor; J). Notethe variable reduction in wing size. (D–G) Pull-down analysis of GST-MAP4K3 fusion protein and in vitro translated RagC (D), Tor (E), RagA (F) andRheb (G). In each autoradiography the left lane corresponds to the in vitro translation reaction, the central lane to the inmunoprecipitation with GST-MAP4K3, and the right late to inmunoprecipiation with GST. Note that RagC and GST-MAP4K3 interact very efficiently. Tor and GST-MAP4K3 alsointeract but to a lesser extent, and in this last case we also detected some interaction between Tor and GST. The interaction between RagA and GST-MAP4K3 is very weak, and we could not detect any interaction between Rheb and GST-MAP4K3. (K–N) Reduction of the TorTED phenotype by the lossof hppy expression. (K–L) nub-Gal4/ UAS-TorTED (K) and nub-Gal4/ UAS-TorTED /UAS-ihppy (L). (M–N) 638-Gal4/+; UAS-TorTED (M) and 638-Gal4/+; UAS-TorTED/UAS-ihppy (N).doi:10.1371/journal.pone.0014528.g007
MAP4K3 in TOR and JNK Pathways
PLoS ONE | www.plosone.org 10 January 2011 | Volume 6 | Issue 1 | e14528

level of TORC1. This possibility is compatible with the
suppression by MAP4K3 over-expression of phenotypes caused
by increased levels of InR/Tor signalling generated by lower than
normal levels of PTEN and TSC1/2. In addition to our genetic
data in the wing, experiments in cell culture with both the fly and
human MAP4K3 homologue proteins indicated that MAP4K3 is
required to generate maximal activity of TORC1 in response to
aminoacids [35]. Therefore, we suggest that although MAP4K3 is
normally required to promote TORC1 signalling, when the
protein is over-expressed modifies the balance between TORC1
components required for its normal function in vivo. This effect
appears to depend exclusively on the kinase domain of MAP4K3,
because the over-expression of this domain causes a strong
reduction in wing and cell size. We have shown that MAP4K3 can
interact with RagA, RagC and Tor in pull-down experiments in
vitro, and therefore we speculate that the excess of MAP4K3 alters
the phosphorylation levels of TORC1 components and this leads
to the assembly of inactive complexes. A similar mechanism might
explain the dominant-negative effect of Tor, as it was suggested
that Tor over-expression leads to the sequestering of TORC1
components in non-functional complexes [48]. In summary, we
suggest that MAP4K3 normally potentiate TORC1 and JNK
functions in response to environmental challenges, without being
strictly required to generate some levels of TORC1 or JNK
activity, and that MAP4K3 hyper-activity leads to high levels of
JNK signalling and to reduced TORC1 function, in this case due
to the formation of inactive TORC1 complexes.
Methods
Genetic strainsWe used the EP line EP-704 [5], the Gal4 lines act-Gal4, ap-
Gal4, 638-Gal4, nub-Gal4, ap-gal4, dpp-Gal4, omb-gal4, hh-Gal4, en-
Gal4, salEPv-Gal4 [6] and ppl-Gal4 [49], the UAS-lines UAS-GFP
[50], UAS-diap, UAS-puc [51], UAS-TorWT and UAS-TorTED [48],
UAS-Dp110D954A [52], UAS-RagAQ61L, UAS-RagAT16N, UAS-RagA
and UAS-RagC [32], UAS-dS6KTE [53], UAS-dS6KDN, UAS-pth [31],
UAS-AKTexel and UAS-slif [30]. We also used Df(2R)Exel6069 as a
deletion of hppy. The expression of 638-Gal4 and nub-Gal4 is
restricted to the wing pouch and wing blade plus hinge,
respectively, since the second larval instar. The expression of hh-
Gal4 and en-Gal4 is restricted to the posterior compartment of all
imaginal discs, the expression of act-Gal4 occurs in all imaginal
cells and the expression of ppl-Gal4 occurs in the fat body. We also
used the following UAS lines to express interference RNA: UAS-
iTor (ID 5092-R2 DGRC), UAS-iraptor (ID 4320R-2 DGRC),
UAS-idS6K (ID 10539-R3 DGRC), UAS-iAkt (ID2902 VDRC),
UAS-iPTEN (ID 35731 VDRC), UAS-iTSC2 (ID 6313 VDRC) and
UAS-iCG7097 (ID 35166 VDRC). Unless otherwise stated, crosses
were done at 25uC. Lines not described in the text can be found in
FlyBase [54].
Generation of happyhour loss-of-function allelesIsogenic EP-704 males were treated with 0,4 mM Ethyl Nitrous
Urea (ENU) overnight is a Sucrose solution. Treated males were
crossed with CyO/act-Gal4 females. Viable individual males of EP-
704*/ act-Gal4 genotype were selected to establish stocks carrying
mutations in hppy that suppress the over-expression phenotype of
EP-704/Gal4 combinations. EP-704/CyO act-Gal4 flies are pupal
lethal.
Mapping of happyhour loss-of-function allelesThe three revertants we isolated were crossed with Df(2R)t
Exel6069/CyO (a deficiency including the CG7097 genomic region).
We extracted genomic DNA from EP704*/Df(2R)Exel6069 and used
it as a template to amplify the coding genomic fragments of CG7097
by PCR. We used the following primer pairs:
Exon 1: TGCATCTCGATCCACAAAAG and AGTTTTTG
CCTTTCCCTTCC
Exon 2: AAAGCCACCACATAATCTCCA and CCCCGCC
TTTAAATCTGACT
Exons 3–4: TTAGCTGAGGCAGCAAAACC and TAAAGG-
CAAAAGGTGCCAAG for Exons 5–6: GTGAAGGTCCATTC
CTCGAA and AACCCGTTTCGCAAGTAAGA
Exon 7: CGTTTAATTTGGGCGTTAGGA and TTGCGT
GAAAATATGGTGGA
Exon 8: GCTCAACATCTCGGCTCTCT and CATTATTC
ATGGCCACATCG
Exon 8: ATGCCGACGACGATGAACT and TACCTGAAC
CCCATTTGATG
Exons 9 and 10: TGATTACCGGCATGAGAACA and CT
CCGGGATCTTGTTCATGT
Exon 11: TGGGTACACGATTCTTGCAT and ATGGCG
TCATATTCCAGGTC
Exons 12–14: GCTGGAGCTGATCAACATGAA and TGTG
TGGTGAACCGGATTAT
The PCR products were cloned in PGem-T-Easy (Promega)
and sequenced with T7 and SP6 primers. Two independent PCR
reactions were set for each primers pair, and 2 independent clones
were sequenced from each PCR. We found a T by A substitution
in exon 2 codon TT*C of EP7041V2 (resulting in a F to Y
aminoacid change), a C by T substitution in exon 1 codon C*AA
of EP7044T1 (resulting in a Q to stop codon change) and a C by T
substitution in exon 11 codon C*AG of EP7042G1 (resulting in a Q
to stop codon change).
Starvation conditionsControl and homozygous EP-704 early third instar larvae were
removed from the food, washed in PBS and placed in vials
containing paper saturated with H2O and sucrose. The imago
ecloses after 5–6 days under these conditions.
Quantitative RT-PCRTotal RNA was prepared from a pool of 20 wild type and 20
EP-704/EP-704 3rd instar larvae using the TRIzol reagent RNA
protocol following GibcoBRL instructions. Total RNA was used
for a first round of reverse transcription using the Gene Amp RNA
PCR kit (Applied Biosystems, Foster City, CA). Quantitative Real-
time RT-PCR was performed using SYBRH green PCR master
mix and the ABI PRISMH 7700 sequence detection system
(Applied Biosystems). Primers for real-time RT-PCR were for
CG7097 -forward TCC CAA GCA GCA CAA GAA GA- and -
reverse CTC TCC AAG GCC ACA ACC TT-, and for RP49
controls –forward CGG ATC GAT ATG CTA AGC TGT– and
–reverse CGA CGC ACT CTG TTG TCG-. Quantifications
were always normalised using endogenous control RP49 (ribo-
somal protein 49).
Generation of UAS-hppy, UAS-hppy-DCN and UAS-hppy-DKUAS-hppy was constructed cloning the complete RH10407
cDNA (from Berkeley Drosophila Genome Project) into the
pUASt vector [54]. The EST RH10407 was used as template for
amplification using the forward primer 59 TATGTCGAC-
GATTTGTGGGCTGCG-39 and the reverse primer59-GAA
GCGGCCGCTGCACTAAGCTAGAG-3. This fragment was
purified (Promega) and cloned into the pUASt vector digested
with SalI and NotI restriction enzymes (underlined in the primers).
UAS-hppy-DCN and UAS-hppy-DK were constructed cloning the
MAP4K3 in TOR and JNK Pathways
PLoS ONE | www.plosone.org 11 January 2011 | Volume 6 | Issue 1 | e14528
cDNA RH10407 fragments between 16 bp to 1988 bp and
between 1260 bp to 3911 bp, respectively, into the pUAST
Drosophila GatewayTM Vector using Invitrogen pENTRTM
Directional TOPOH Cloning Kits. The primers used for this
purpose were for UAS-hppy-DCN 59 forward 59-CACCCGTT-
GACGAAGTGCATGTG-39 and reverse 59-TTAGGTGTTG
TTCAGCAGATCC-39; and for UAS-hppy-DK forward 59-CAC
CATGCCCAACCCGCAGTTCTACTA-39, reverse 59-CCCA
ACAAACCGTATCATCC-39. Several UAS lines for each
construct were established after germ-line transformation follow-
ing standard procedures.
Wing and cell size measurementsWe analysed at least 10 wings from females of each genotype.
Cell size was estimated by counting the number of wing hairs in a
dorsal region posterior to the posterior crossvein. Wing size was
measured in pixels using the Analyse tool in Adobe Photoshop.
The number of cells was calculated using cell density and wing size
values.
Mitotic indexWe quantified the number of cells in mitosis, detected by the
expression of Phospho-Histone3, in the anterior and posterior wing
disc compartments, and the size of the corresponding compart-
ments. The average value of the ratios between the number of
mitotic cells and the size of the compartment was used as a
compartment mitotic index. The images used to make the
quantifications were projections of at least 10 confocal planes
including the entire apico-basal height of the wing blade epithelium.
We did these measures in at least 10 third instar wing discs of the
following genotypes: en-Gal4 UAS-GFP/UAS-CG7097, en-Gal4 UAS-
GFP /UAS-Tor, en-Gal4 UAS-GFP/UAS-TorTED, en-Gal4 UAS-GFP/
UAS-CG7097; UAS-diap/+ and en-Gal4 UAS-GFP /+. The expres-
sion of GFP was used to label the posterior compartment.
Generation of anti-MAP4K3 antibodyThe anti-MAP4K3 antibody was prepared by immunizing rats
with a Poly-Histidine fusion peptide of aminoacids 379-696 of
Drosophila Hppy (isoform B) after PCR cloning from hppy cDNA
(RH10407) into pQE31 (Qiagen).
Visualization of JNK activity after irradiationThird-instar larvae of en-Gal4 UAS-GFP/UAS-ihppy; puc-lacZ and
en-Gal4 UAS-GFP/+; puc-lacZ genotypes were irradiated in a
Philips X-Ray machine to a final dose of 1500R. The imaginal
discs were dissected and stained 8 hours after the irradiation. We
took Z-projections made from 50 tangential sections and the
intensities of the red channel (puc-lacZ expression) in the anterior
and posterior compartments were measured using ImageJ1.38
software (NIH).
Immunocytochemistry and in situ hybridizationWe used rabbit anti-activated Cas3 (Cell Signalling Technol-
ogy), anti-Phosphorylated Histone (PH3; Cell Signalling Technol-
ogy), mouse anti-bGalactosidase (Promega) and TOPRO (Invitro-
gen). From the Hybridoma bank at Iowa University we used
monoclonals anti-Wg and anti-FasIII. Secondary antibodies were
from Jackson Immunological Laboratories (used at 1/200
dilution). Imaginal wing discs were dissected, fixed and stained
as described in [56]. Confocal images were captured using a
LSM510 confocal microscope. In situ hybridization with hppy
RNA probes was carried out as described in [55]. We used the
cDNA RH10407 as a template to synthesise the hppy RNA probe.
Pull-down assaysWe made a GST (Gluthatione S-Tranferase) fusion protein of
the complete Drosophila CG7097 isoform B. The EST RH10407
was used as template for amplification using the forward primer
59-GGGGGTCGACGGTTGACGAAGTGCATGTGAAA-39
and the reverse primer 59-GGGGGCGGCCGCTCGTGTGGA-
TAATTGCGTGT-3. This fragment was purified (Promega) and
cloned into the PGEX-4T-1 vector digested with SalI and NotI
restriction enzymes (underlined in the primers). Subsequently, the
fusion protein was purified in a Gluthatione-agarose column for 2 h
at 4uC. Rheb (GH10361), RagA (GH04846), RagC (GH16429) and
dTOR (RE49094) proteins where generated from their cDNA
vectors (Berkeley Drosophila Genome Project) with the in-vitro
translation kit TNT T7 coupled Reticulocyte Lysate Systems
(Promega) and radiolabeled with S35-Met. The pull-down assay was
performed over-night at 4uC using 10 ml in-vitro translation, 50 ml
CG7097-GST or GST and 200 ml of pull-down buffer (20 mM
Tris-HCl pH 8, 150 mM NaCl, 1 mM EDTA and 0,5%NP40).
After centrifugation and washes the proteins were separated in a
10% SDS/PAGE gel and the existence of pull-down proteins was
analysed by autoradiography. The levels of GST fusion proteins and
GST protein were quantified on 10% SDS-PGE gels with known
levels of BSA as reference. After that, the pull-downs were carried
out with the same amount of GST fusion proteins.
Western BlotControl S2 cells or S2 over-expressing hppy were collected by
centrifugation, washed with PBS, re-suspended in 100–200 ml of
ice-cold lysis buffer (50 mM Tris-HCl, 150 mM NaCl, 0,5%
NP40, 2 mM EGTA, 2 mM EDTA, 10 mM NaF, 0.1 mM
orthovanadate, 100 mM PMSF, 1 mM Benzamidine, 16 mU/ml
Aprotinin, 5 mM DTT) and incubated for 1–2 h at 4uC. Lysates
were clarified by centrifugation.
Whole S2 lysate complexes were resolved by 10% SDS-PGE
and proteins transferred to nitrocellulose membranes using a wet-
blotting apparatus (BioRad). Hppy protein was detected with anti-
Hppy rat serum (1/200). Blots were also revealed with anti-
gammaTubulin monoclonal antibody (Sigma) as a loading control.
Immunoblots were developed and quantified using IR680 and 800
labelled antibodies (Licor) with the Odyssey Infrared Imaging
System (Li-Cor).
Statistical analysisData are expressed as means +/2 standard error of the mean
(SEM). All data were collected in a Microsoft Excel database
(Microsoft Inc.), and figures were created using Adobe Illustrator
CS3 (Adobe Systems Inc.) software.
Supporting Information
Figure S1. Phenotype EP-704 and UAS-hppy combinations
with different Gal4 at 25uC. (A) Wild type wing. (B) EP-704/hh-
Gal4. hh-Gal4 is expressed in the posterior compartment of the
wing disc, and the wing shows a 15% reduction of wing size. (C)
UAS-hppy/hh-Gal4 wing, showing the same reduction of wing
size than EP-704/hh-Gal4 wings (B). (D) EP-704/ap-Gal4. ap-
Gal4 is expressed in the dorsal compartment of the wing disc,
resulting in a 34% of reduction of wing size. (E) EP-704/638-Gal4.
638-Gal4 is expressed in the entire wing blade, and the wing size is
reduced 28% compared to wild type wings. (F) EP-704/omb-Gal4,
omb-Gal4 is expressed in the most of the wing blade, resulting in
wings 25% smaller than controls. (G) EP-704/179-Gal4, 179-Gal4
is expressed in the entire wing blade; being excluded from the D/
V boundary, and the wings are 36% reduced in size. (H) EP-704/
MAP4K3 in TOR and JNK Pathways
PLoS ONE | www.plosone.org 12 January 2011 | Volume 6 | Issue 1 | e14528
dpp-Gal4, dpp-Gal4 is expressed in a stripe of anterior cells
abutting the A/P boundary, and the wings are reduced 13% in
size. (I) EP-704/ salEPv-Gal4, salEPv-Gal4 is expressed in the
central region of the wing blade (LII-L5 veins), and the wings are
19% reduced in size. (J) Insertion site of the EP-704 element shown
in the genomic region (left) and in the graphical map of the gene
(right). (K) Western blot showing the CG7097 protein extracted
from wild type cells (left lane, control), and from cells over-
expressing Hppy (right lane, over-expression). c-Tubulin is also
shown as a loading control at the bottom.
Found at: doi:10.1371/journal.pone.0014528.s001 (2.22 MB TIF)
Table S1. Numerical values of average wing size, average
number of cells in the square shown in Fig. 2B, average cell size
and estimated number of cells in most of the combinations analysed
in this work. Standard deviations are shown in brackets. The values
of the t-Student test for each pair of values (T) is also shown.
Found at: doi:10.1371/journal.pone.0014528.s002 (0.05 MB
XLS)
Acknowledgments
We are very grateful to A. Lopez-Varea and R. Hernandez for their skilful
technical help, to Evgeny Shlevkov for advice in the X-ray induced JNK
activity, to Antonio Sobrado for suggestions on food experiments, Ana
Ruiz Gomez for technical help on western-blot experiment and Daniel
Ruiz-Abanades for technical help during antibody generation. We thank
the Hybridome bank at Iowa University, NIG in Japan, Bloomington
Stock Center, and several colleagues for providing the tools necessary for
this work. A. Baonza and C. Molnar are also acknowledged for criticism
that greatly improved the manuscript.
Author Contributions
Conceived and designed the experiments: MRD JFdC. Performed the
experiments: MRD. Analyzed the data: MRD JFdC. Wrote the paper:
MRD JFdC.
References
1. Cohen SM (1993) Imaginal disc development. Cold Spring Harbor: Cold Spring
Harbor Laboratory Press.
2. de Celis JF (2003) Pattern formation in the Drosophila wing: the development ofthe veins. Bioessays 25: 443–451.
3. Affolter M, Basler K (2007) The Decapentaplegic morphogen gradient: from
pattern formation to growth regulation. Nat Rev Genet 8: 663–674.
4. Johnston LA, Gallant P (2002) Control of growth and organ size in Drosophila.
Bioessays 24: 54–64.
5. Molnar C, Lopez-Varea A, Hernandez R, de Celis JF (2006) A gain-of-function
screen identifying genes required for vein formation in the Drosophila
melanogaster wing. Genetics 174: 1635–1659.
6. Cruz C, Glavic A, Casado M, de Celis JF (2009) A gain-of-function screen
identifying genes required for growth and pattern formation of the Drosophilamelanogaster wing. Genetics 183: 1005–1026.
7. Edgar BA (2006) How flies get their size: genetics meets physiology. Nat Rev
Genet 7: 907–916.
8. Goberdhan DC, Wilson C (2003) The functions of insulin signaling: size isn’t
everything, even in Drosophila. Differentiation 71: 375–397.
9. Hietakangas V, Cohen SM (2009) Regulation of tissue growth through nutrientsensing. Annu Rev Genet 43: 389–410.
10. Mirth CK, Riddiford LM (2007) Size assessment and growth control: how adultsize is determined in insects. Bioessays 29: 344–355.
11. Oldham S, Hafen E (2003) Insulin/IGF and target of rapamycin signaling: a
TOR de force in growth control. Trends Cell Biol 13: 79–85.
12. Loewith R, Jacinto E, Wullschleger S, Lorberg A, Crespo JL, et al. (2002) Two
TOR complexes, only one of which is rapamycin sensitive, have distinct roles in
cell growth control. Mol Cell 10: 457–468.
13. Bhaskar PT, Hay N (2007) The two TORCs and Akt. Dev Cell 12: 487–502.
14. Dann SG, Thomas G (2006) The amino acid sensitive TOR pathway from yeastto mammals. FEBS Lett 580: 2821–2829.
15. Hay N, Sonenberg, N (2004) Upstream and downstream of mTOR. Genes Dev
18: 1926–1945.
16. Wang X, Proud CG (2009) Nutrient control of TORC1, a cell-cycle regulator.
Trends Cell Biol 19: 260–267.
17. Inoki K, Li Y, Zhu T, Wu J, Guan KL (2002) TSC2 is phosphorylated andinhibited by Akt and suppresses mTOR signalling. Nat Cell Biol 4: 648–657.
18. Manning BD, Tee AR, Logsdon MN, Blenis J, Cantley LC (2002) Identificationof the tuberous sclerosis complex-2 tumor suppressor gene product tuberin as a
target of the phosphoinositide 3-kinase/akt pathway. Mol Cell 10: 151–162.
19. Potter CJ, Pedraza LG, Xu T (2002) Akt regulates growth by directlyphosphorylating Tsc2. Nat Cell Biol 4: 658–665.
20. Garami A, Zwartkruis FJ, Nobukuni T, Joaquin M, Roccio M, et al. (2003)
Insulin activation of Rheb, a mediator of mTOR/S6K/4E-BP signaling, isinhibited by TSC1 and 2. Mol Cell 11: 1457–1466.
21. Saucedo LJ, Gao X, Chiarelli DA, Li L, Pan D, et al. (2003) Rheb promotes cellgrowth as a component of the insulin/TOR signalling network. Nat Cell Biol 5:
566–571.
22. Stocker H, Radimerski T, Schindelholz B, Wittwer F, Belawat P, et al. (2003)Rheb is an essential regulator of S6K in controlling cell growth in Drosophila.
Nat Cell Biol 5: 559–565.
23. Zhang Y, Gao X, Saucedo LJ, Ru B, Edgar BA, et al. (2003) Rheb is a direct
target of the tuberous sclerosis tumour suppressor proteins. Nat Cell Biol 5:
578–581.
24. Holz MK, Ballif BA, Gygi SP, Blenis J (2005) mTOR and S6K1 mediate
assembly of the translation preinitiation complex through dynamic proteininterchange and ordered phosphorylation events. Cell 123: 569–580.
25. Montagne J, Stewart MJ, Stocker H, Hafen E, Kozma SC, et al. (1999)Drosophila S6 kinase: a regulator of cell size. Science 285: 2126–2129.
26. Stewart MJ, Berry CO, Zilberman F, Thomas G, Kozma SC (1996) TheDrosophila p70s6k homolog exhibits conserved regulatory elements and
rapamycin sensitivity. Proc Natl Acad Sci U S A 93: 10791–10796.
27. Gingras AC, Kennedy SG, O’Leary MA, Sonenberg N, Hay N (1998) 4E-BP1,
a repressor of mRNA translation, is phosphorylated and inactivated by the Akt
(PKB) signaling pathway. Genes Dev 12: 502–513.
28. Beugnet A, Tee AR, Taylor PM, Proud CG (2003) Regulation of targets of
mTOR (mammalian target of rapamycin) signalling by intracellular amino acidavailability. Biochem J 372: 555–566.
29. Christie GR, Hajduch E, Hunda HS, Proud CG, Taylor PM (2002) Intracellularsensing of amino acids in Xenopus laevis oocytes stimulates p70 S6 kinase in a
target of rapamycin-dependent manner. J Biol Chem 277: 9952–9957.
30. Colombani J, Raisin S, Pantalacci S, Radimerski T, Montagne J, et al. (2003) A
nutrient sensor mechanism controls Drosophila growth. Cell 114: 739–749.
31. Goberdhan DC, Meredith D, Boyd CA, Wilson C (2005) PAT-related amino
acid transporters regulate growth via a novel mechanism that does not requirebulk transport of amino acids. Development 132: 2365–2375.
32. Kim E, Goraksha-Hicks P, Li L, Neufeld TP, Guan KL (2008) Regulation ofTORC1 by Rag GTPases in nutrient response. Nat Cell Biol 10: 935–945.
33. Sancak Y, Peterson TR, Shaul YD, Lindquist RA, Thoreen CC, et al. (2008)The Rag GTPases bind raptor and mediate amino acid signaling to mTORC1.
Science 320: 1496–1501.
34. Sekiguchi T, Hirose E, Nakashima N, Ii M, Nishimoto T (2001) Novel G
proteins, Rag C and Rag D, interact with GTP-binding proteins, Rag A andRag B. J Biol Chem 276: 7246–7257.
35. Findlay GM, Yan L, Procter J, Mieulet V, Lamb RF (2007) A MAP4 kinaserelated to Ste20 is a nutrient-sensitive regulator of mTOR signalling. Biochem J
403: 13–20.
36. Bryk B, Hahn K, Cohen SM, Teleman AA (2010) MAP4K3 regulates body size
and metabolism in Drosophila. Dev Biol 344: 150–157.
37. Corl AB, Berger KH, Ophir-Shohat G, Gesch J, Simms JA, et al. (2009)
Happyhour, a Ste20 family kinase, implicates EGFR signaling in ethanol-
induced behaviors. Cell 137: 949–960.
38. Dan I, Watanabe NM, Kusumi A (2001) The Ste20 group kinases as regulators
of MAP kinase cascades. Trends Cell Biol 11: 220–230.
39. Cook, SJ, Morley SJ (2007) Nutrient-responsive mTOR signalling grows on
Sterile ground. Biochem J 403: e1–3.
40. Kallio J, Leinonen A, Ulvila J, Valanne S, Ezekowitz RA, et al. (2005)
Functional analysis of immune response genes in Drosophila identifies JNKpathway as a regulator of antimicrobial peptide gene expression in S2 cells.
Microbes Infect 7: 811–819.
41. Lam D, Dickens D, Reid EB, Loh SH, Moisoi N, et al. (2009) MAP4K3
modulates cell death via the post-transcriptional regulation of BH3-onlyproteins. Proc Natl Acad Sci U S A 106: 11978–11983.
42. Lam D, Martins LM (2009) MAP4K3 enhances the expression of the BH3-onlyprotein BID. Cell Cycle 8: 3248–3249.
43. Perez-Garijo A, Martin FA, Morata G (2004) Caspase inhibition duringapoptosis causes abnormal signalling and developmental aberrations in
Drosophila. Development 131: 5591–5598.
44. Goyal L (2001) Cell death inhibition: keeping caspases in check. Cell 104:
805–808.
45. McEwen DG, Peifer M (2005) Puckered, a Drosophila MAPK phosphatase,
ensures cell viability by antagonizing JNK-induced apoptosis. Development 132:3935–3946.
MAP4K3 in TOR and JNK Pathways
PLoS ONE | www.plosone.org 13 January 2011 | Volume 6 | Issue 1 | e14528

46. Varfolomeev EE, Ashkenazi A (2004) Tumor necrosis factor: an apoptosis
JuNKie? Cell 116: 491–497.
47. Zhang H, Stallock JP, Ng JC, Reinhard C, Neufeld TP (2000) Regulation of
cellular growth by the Drosophila target of rapamycin dTOR. Genes Dev 14:
2712–2724.
48. Hennig KM, Neufeld TP (2002) Inhibition of cellular growth and proliferation
by dTOR overexpression in Drosophila. Genesis 34: 107–110.
49. Zinke I, Kirchner C, Chao LC, Tetzlaff MT, Pankratz MJ (1999) Suppression of
food intake and growth by amino acids in Drosophila: the role of pumpless, a fat
body expressed gene with homology to vertebrate glycine cleavage system.
Development 126: 5275–5284.
50. Ito K, Awano W, Suzuki K, Hiromi Y, Yamamoto D (1997) The Drosophila
mushroom body is a quadruple structure of clonal units each of which contains a
virtually identical set of neurones and glial cells. Development 124: 761–771.
51. Martin-Blanco E, Gampel A, Ring J, Virdee K, Kirov N, et al. (1998) puckered
encodes a phosphatase that mediates a feedback loop regulating JNK activityduring dorsal closure in Drosophila. Genes Dev 12: 557–570.
52. Leevers SJ, Weinkove D, MacDougall LK, Hafen E, Waterfield MD (1996) The
Drosophila phosphoinositide 3-kinase Dp110 promotes cell growth. Embo J 15:6584–6594.
53. Barcelo H, Stewart MJ (2002) Altering Drosophila S6 kinase activity is consistentwith a role for S6 kinase in growth. Genesis 34: 83–85.
54. Gelbart WM, Crosby M, Matthews B, Rindone WP, Chillemi J, et al. (1997)
FlyBase: a Drosophila database. The FlyBase consortium. Nucleic Acids Res 25:63–66.
55. Brand AH, Perrimon N (1993) Targeted gene expression as a means of alteringcell fates and generating dominant phenotypes. Development. pp 401–415.
56. de Celis JF (1997) Expression and function of decapentaplegic and thick veins inthe differentiation of the veins in the Drosophila wing. Development 124:
1007–1018.
MAP4K3 in TOR and JNK Pathways
PLoS ONE | www.plosone.org 14 January 2011 | Volume 6 | Issue 1 | e14528


