San Jose State University San Jose State University
SJSU ScholarWorks SJSU ScholarWorks
Master's Projects Master's Theses and Graduate Research
Spring 2018
Mandala Generation from Brainwave with Feedforward Mandala Generation from Brainwave with Feedforward
Kumari Anamika Sharaf San Jose State University
Follow this and additional works at: https://scholarworks.sjsu.edu/etd_projects
Part of the Computer Sciences Commons
Recommended Citation Recommended Citation Sharaf, Kumari Anamika, "Mandala Generation from Brainwave with Feedforward" (2018). Master's Projects. 596. DOI: https://doi.org/10.31979/etd.wd33-6kqs https://scholarworks.sjsu.edu/etd_projects/596
This Master's Project is brought to you for free and open access by the Master's Theses and Graduate Research at SJSU ScholarWorks. It has been accepted for inclusion in Master's Projects by an authorized administrator of SJSU ScholarWorks. For more information, please contact [email protected].

Mandala Generation from Brainwave with Feedforward
A Project Report
Presented to
Department of Computer Science
San José State University
In Partial Fulfillment
Of the Requirements for
CS298
By
Kumari Anamika Sharaf
May 2018

1
© 2018
Kumari Anamika Sharaf
ALL RIGHTS RESERVED

Abstract
Most experiments conducted in the early 1900s with Electroencephalography (EEG) [10]
devices explored mental illness of the participants. Historically, EEG has had specific
applications to diagnose sleep disorder, epilepsy, coma and brain death. Today, EEG devices are
used extensively for research purposes [10], especially in the field of neuroscience. Traditionally,
most experiments included a human participant wherein an EEG device was connected to the
subject’s forehead to detect electrical impulses indicating different brainwaves. Each brainwave
implied a different emotional state of mind. Past experiments [2] [3] [4] then used the brainwave
signals as input to build audio/visual art to aid in the analysis of mental health to some degree.
However, the full potential to develop cheap real-time monitoring systems with novel hardware
has not yet been exploited. This report attempts to bridge that gap by discussing a new feed-
forward system for meditation that is built upon dynamic mandalas, controlled by brain waves. A
relatively recent brainwave intercepting device, Muse™, is used to collect α, β, and 𝛾 brainwave
signal data from human subjects in short sessions. The data is collected in both, feedforward as
well as feedback usage scenarios. Exploratory analysis of the collected data indicates that
majority of the participants had a calming and relaxing experience upon using Muse and the
dynamic Mandala generation system.
Index terms - Electroencephalogram (EEG), mandala, neuroscience, processing, meditation
3
ACKNOWLEDGMENTS
I would like to start this acknowledgment by thanking my advisor Dr. Phil Heller, for his
invaluable support, encouragement, useful suggestions and unmeasurable interest and belief in
this research work from the initial to the final stage. His valuable suggestions helped me in every
direction throughout the course of this project.
I wish to express my profound gratitude to Dr. Maya Ackerman for introducing me to
Computational Creativity in my first semester and having immense belief in my project idea
from the start. If not for her, I would have never known the beautiful way of improving life and
contribution to arts with technologies.
I would love to thank my parents, Anil Kumar and Aarti Devi for being the most inspiring people
I know. Their unconditional love, immense support, and encouragement have made me the
person I am today. I would also like to mention my two little brothers, Ankit Kumar and Anurag
Kumar for always being the kind and positive influence in my life. I conclude this
acknowledgment by crediting my whole masters to my very supporting husband, Bishal Barman.
He has stood by me through thick and thin, always reminding me what I am capable of,
whenever I doubted it the most. His incredible patience and honest feedback have always made
me work harder and do better.

4

5
Table of Contents
List of Figures 6CHAPTER ONE 7
Background
1.1. Introduction
1.2.MandalaandPsychology
1.3. DifferentModalityofMeditationandMeaning
1.4.IntroductiontoMuse(EEGDevice)
1.5.ProcessingSoftwareTool
CHAPTER TWO 16
Methods
2.1. EEG Device Setup
2.2. Analyzing OSC messages to generate Mandalas
2.3. Mandala Generation
2.3.1. Mandalas via Feedback
2.3.2. Mandalas via Feedforward
2.4. Participant’s Feedback
CHAPTER THREE 29
Results
CHAPTER FOUR 31
Discussion
CHAPTER FIVE 33
References
List of Figures Figure 1: Four monks working on their own different quarters of the mandala in Tibetan temple
8

6
Figure 2: A chart of brainwaves, its frequency, and behavior 9
Figure 3: An illustration of the installation for the feedback system 11
Figure 4: Three areas of implementation of the feedback system 12
Figure 5: Information on Muse (EEG device) 13
Figure 6: Placement of Muse on a participant’s forehead 14
Figure 7: Software components required to connect brainwaves to mandalas 15
Figure 8: Connecting EEG device to the operating systemError! Bookmark not defined.Figure
9: Connecting MuseIO to Muse device via TCP port 5002 17
Figure 10: A sample code to listen to OSC data through Processing platform 18
Figure 11: A sample input file for a Feedback system 20
Figure 12: Mandala Sample 1 - Feedback System 21
Figure 13: Mandala Sample 2 - Feedback System 22
Figure 14: A sample output file for a Feedback system 23
Figure 15: A sample input file for a Feedforward system 24
Figure 16: Mandala Sample1 - Feedforward System 25
Figure 17: Mandala Sample2 - Feedforward System 26
Figure 18: A sample output file for a Feedforward system 27
Figure 19: Feedback form for all participants to fill after their session 28
Figure 20: Data collected from all feedback forms 29
Figure 21: Mapping effectiveness to numbers Error! Bookmark not defined.
CHAPTER ONE
Background

7
1.1 Introduction
Many scientists in the past have been attracted to the idea of understanding human brains. Carl
Jung [1], an influential psychiatrist, did experiments on symbolism and psychology. During his
experiments, he documented handwritten notes and illustrations. Jung’s illustrations were very
rich, precise and had a strong resemblance to Tibetan art form, the mandala. He concluded that
as a psychological phenomenon, mandalas appear often in our dreams in cases of conflicts or
schizophrenia. Soon, there was a focus on experimenting with Jung’s theory of connection
between psychology and mandalas.
To understand the meaning of a mandala, we first need to understand the origin of mandalas.
Mandala, a circular art made up of various patterns, is a very important and significant tradition
in Buddhism. A group of monks apply precise mathematical techniques to create a mandala that
takes about a week to be completed. The whole ceremony involves a lot of chanting and rituals.
Mandalas hold religious and psychological meaning in Tibet. Both Jung’s theory and Tibetan
Buddhist philosophy [7] agree on the goal of going through a transformation only to find Self,
Buddhahood or Wholeness, and visual representation of self is the center nucleus or the heart of
a mandala.

8
1.2 Mandala and Psychology
Tibetan Buddhism has many visually rich traditional rituals [7]. Mandala is a culture in Tibet.
Colorful sand is used to create mandalas. In Tibetan temples [5], a group of monks will perform
the ceremony before the creation of the mandala, which is dismantled after its completion. This
ritual demonstrates Buddhist belief of following the path of non-attachment to earthy material.
Mandala works as support for meditation and finding the true purpose of life. Mandala is a
combination of our outer (the universe) and inner (mind) cosmos as well as the relation between
them. Fig. 1 shows monks in the process of making a mandala in a Tibetan temple [8]. Four
monks work in unison to build four precisely similar corners of one big mandala as a part of their
ritual. A mandala represents the blueprint of one’s own mental transformation.
Fig. 1. Four monks working on their own different quarters of the mandala in Tibetan
temple

9
1.3 Different Modality of Meditation and Meaning
There are a few different ranges of brain waves that an EEG device detects. We will focus
mainly on three brain waves - Theta (4-7 Hz), Alpha (7-14 Hz) and Beta (14-30Hz). Theta
brainwaves represent a calm and peaceful state of mind. Alpha brainwaves represent a relaxed
and learning state of mind. Beta brainwaves represent an agitated state of mind. Fig. 2 shows
different frequency brain waves, its behavioral understanding and their implication on different
states of mind [2].
Fig. 2. A chart of brainwaves, its frequency, and behavior

10
There are few different ways to extract and construct feedback signals from human brainwaves.
Tokunaga and Lyons [4] conducted an experiment called Enactive Mandala to explore artificial
expression and audio-visual representation of real-time psychological data. This experiment is a
real-time audiovisual feedback system of EEG signals. It maps real-time EEG signals to
modulate music and animated visual music.
Vladimir Gontar [3] approached this problem differently compared to Enactive Mandalas. He
explored Jung’s theory [1] of the healing power of the psychological phenomenon of mandala
images. He mapped real-time brain signals to a function to generate visual mandalas.
Baasanjav’s [2] approach to Jung’s theory was similar to Gontar’s, but with a different mapping
system. He directly mapped all brainwave signals to a fixed color. This constant was determined
after considerable research on colors and human visual perception.
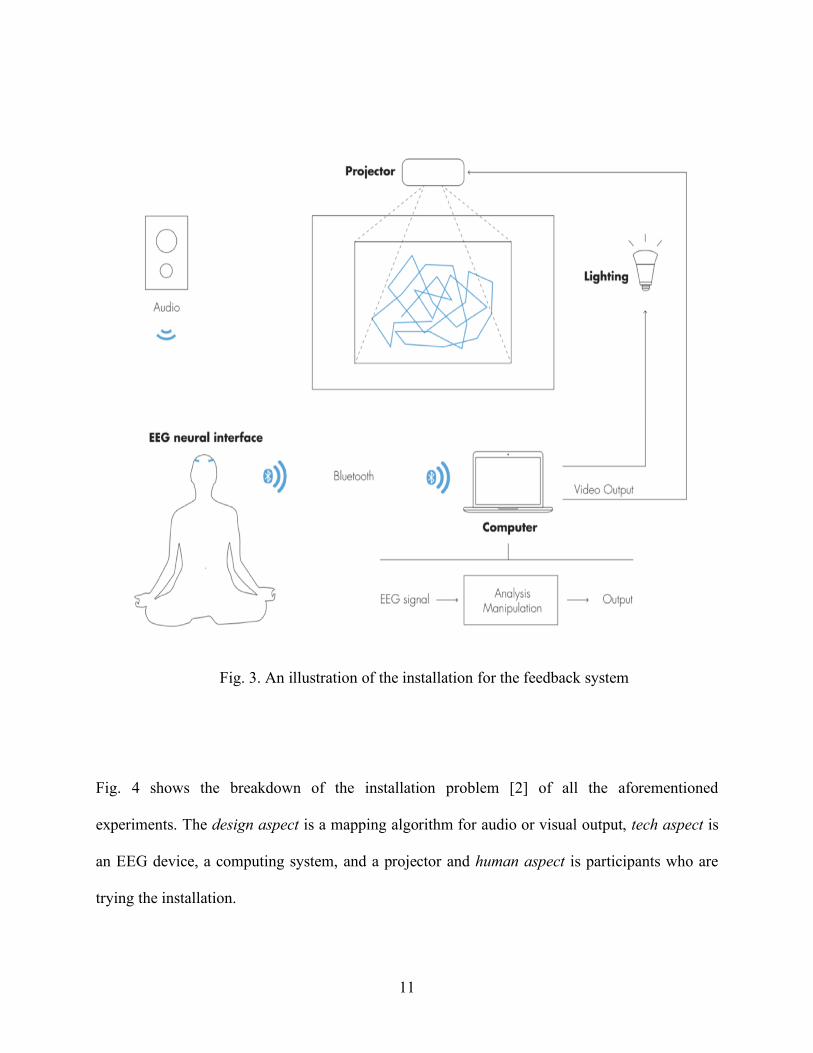
A typical installation for these feedback-system experiments consists of a feedback outlet, an
EEG device, and a participant. Fig. 3 shows one such experiment done by Baasanjav’s
installation [2] for feedback via brain waves. A participant is connected to an EEG device band.
A computer system then listens to signals from the EEG device via Bluetooth. With the help of a
look-up based mapping or a transformation algorithm, these brain waves are converted to
audio/visual form. When a participant observes the feedback from brainwaves, he/she can assess
how stressed or focused or calm he/she is feeling. This could also be looked at as a unique form
of art since every participant builds his/her own unique visual imagery.
11
Fig. 3. An illustration of the installation for the feedback system
Fig. 4 shows the breakdown of the installation problem [2] of all the aforementioned
experiments. The design aspect is a mapping algorithm for audio or visual output, tech aspect is
an EEG device, a computing system, and a projector and human aspect is participants who are
trying the installation.

12
Fig. 4. Three areas of implementation of the feedback system
Compared to other areas of neuroscience, EEG signal feedback systems still need further
exploration and enhancements. Jung’s theory [1] of the healing power of mandalas on our
psychic wholeness remains a fertile area of research, and is still a major motivation behind most
brainwave feedback experiments. However, this still leaves a vast area of feedforward systems
unexplored. For example, an enhanced system would not only work with mapping brainwaves to
colors and patterns but would also build upon the input signal to create an intelligent system.
Based on a feedforward approach, such an improved system would require minimum supervision
and would help participant self-meditate.

13
A feedforward approach is based on prediction of those elements that helps the participant in
attaining a calmer state of mind. Furthermore, these predicted elements could be used to drive
the mandala generation process for better self-meditation. Section 2.3.2 discusses feedforward
approach to a mandala generation.
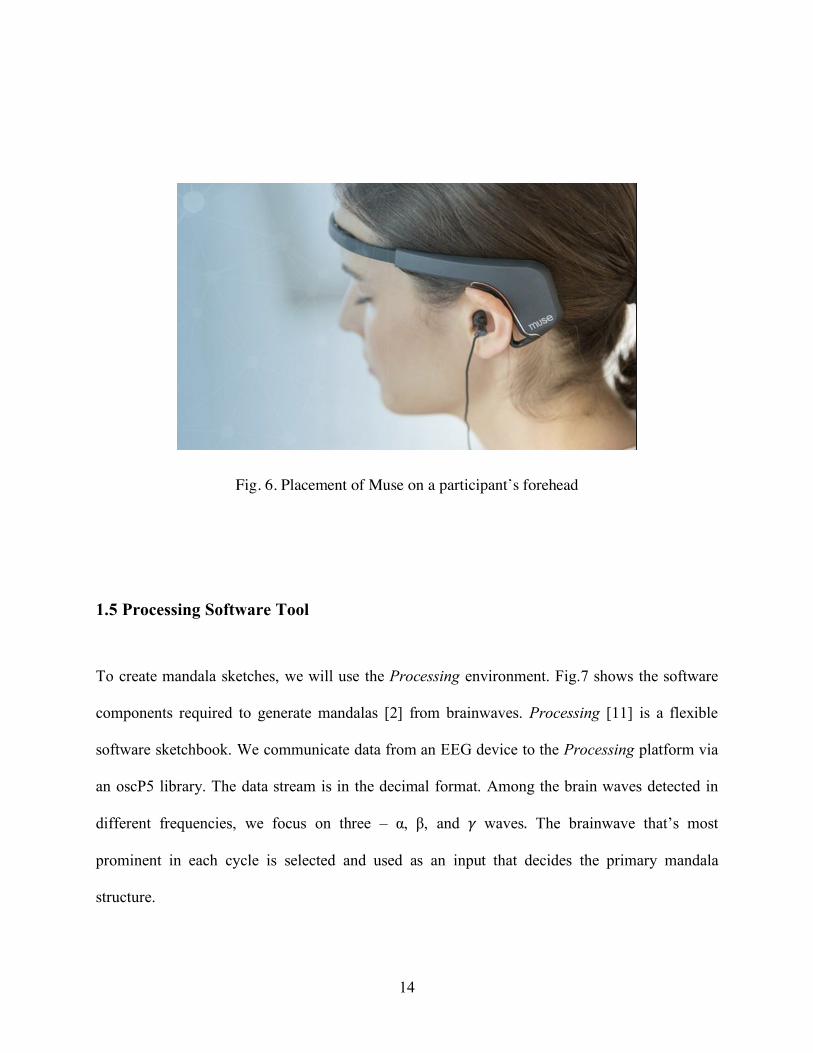
1.4 Introduction to Muse (EEG Device)
Muse is a brainwave sensing EEG device used for meditation purposes. Muse headband gives
accurate, real-time feedback on what’s happening in the brain when one meditates. Muse has a
total of four sensing plates. Two of the sensors attach to participant’s temple and the other two
are attached behind both the ears. Fig. 5 shows a Muse [6] device and explains the key elements.
Fig. 6 shows the placement of Muse [6] on a participant’s forehead.
Fig. 5. Information on Muse (EEG device)
14
Fig. 6. Placement of Muse on a participant’s forehead
1.5 Processing Software Tool
To create mandala sketches, we will use the Processing environment. Fig.7 shows the software
components required to generate mandalas [2] from brainwaves. Processing [11] is a flexible
software sketchbook. We communicate data from an EEG device to the Processing platform via
an oscP5 library. The data stream is in the decimal format. Among the brain waves detected in
different frequencies, we focus on three – α, β, and 𝛾 waves. The brainwave that’s most
prominent in each cycle is selected and used as an input that decides the primary mandala
structure.

15
Fig. 7. Software components required to connect brainwaves to mandalas
16
CHAPTER TWO
Methods
2.1 EEG Device Setup
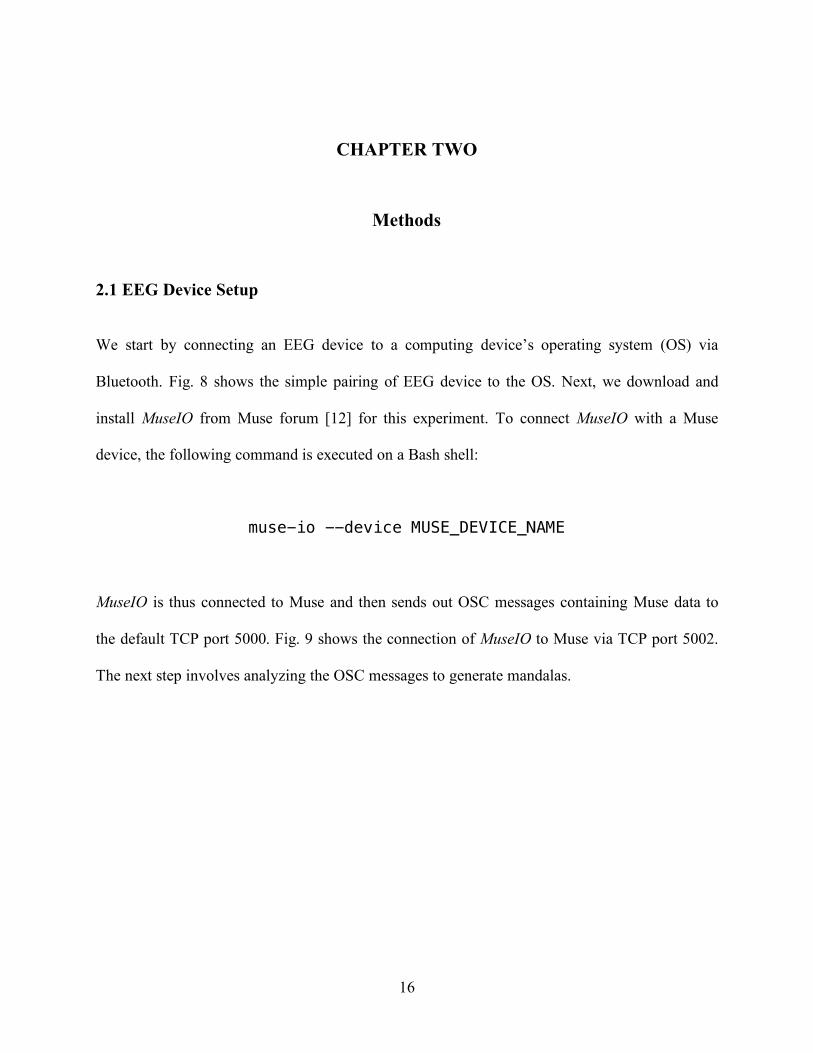
We start by connecting an EEG device to a computing device’s operating system (OS) via
Bluetooth. Fig. 8 shows the simple pairing of EEG device to the OS. Next, we download and
install MuseIO from Muse forum [12] for this experiment. To connect MuseIO with a Muse
device, the following command is executed on a Bash shell:
muse-io --device MUSE_DEVICE_NAME
MuseIO is thus connected to Muse and then sends out OSC messages containing Muse data to
the default TCP port 5000. Fig. 9 shows the connection of MuseIO to Muse via TCP port 5002.
The next step involves analyzing the OSC messages to generate mandalas.

17
Fig. 8. Connecting EEG device to the operating system
Fig. 9. Connecting MuseIO to Muse device via TCP port 5002

18
2.2 Analyzing OSC messages to generate Mandalas
We use the Processing platform to build an interactive visualization. To connect to OSC data, we
need to import oscP5 library. Fig. 10 shows a sample OSC event for listening to OSC data [6].
Fig. 10. A sample code to listen to OSC data through Processing platform
After the connection is established, we start using this data to build mandalas. As mentioned
earlier, the emphasis is on three important signals: Theta (4-7 Hz), Alpha (7-14 Hz) and Beta
(14-30 Hz) brain waves.

19
2.3 Mandala Generation
To create mandalas from OSC data we need to focus on few important points. First, which aspect
of mandalas should be altered by the incoming data? Second, how should we map the shapes of
mandalas to brainwaves? Based on ideas discussed in [9] this report makes the following
assumptions: (a) Sharper mandala shapes map to the most agitated state of mind and rounder
shapes to the most relaxed state of mind. To tackle the intermediary states, we use shapes such as
square or rectangle. (b) Although, this system will not be mapped based on colors, the selection
of colors used to create mandalas are very meaningful to mandala ritual. The basic colors are red,
green, blue and yellow. Each of these colors has a dark and a light shade. We incorporate not
only a feedback system but also build a feedforward system to further help the participant to get
maximum benefit from this experiment. The feedforward system is discussed in section 2.3.2.
2.3.1 Mandalas via Feedback
To generate mandalas via feedback system, we map the shapes of the mandalas to the intensity
of the brain waves detected. For Beta brainwave, the emphasis is on sharper shapes, such as lines
or triangles of different dimensions. For Alpha brainwave, square or rectangles with rounded
edges are considered. For Theta brainwave, circles of different radii are used. The dimension of
the shapes is picked up randomly. We experiment with the intensity of the shapes to give it a
faded effect. At the beginning of a session, we seed the input file with customized data (length of
session, feedforward or feedback mode, etc.) for each individual participant. This feature makes

20
the meditation personalized for each participant. Fig. 11 shows a sample input file for the
feedback system. Fig. 12 and Fig. 13 show few sample feedback mandalas. At the end of the
session, we collect a resultant output file that contains all the data related to the session. The data
collected during the session could be extremely useful to the participant to ponder upon what
worked while meditating. Fig. 14 shows a sample output file for a feedback meditation session.
Fig. 11. A sample input file for a Feedback system

21
Fig. 12. Mandala Sample 1 - Feedback System

22
Fig. 13. Mandala Sample 2 - Feedback System

23
Fig. 14. A sample output file for a Feedback system
2.3.2 Mandalas via Feedforward
The idea behind feedforward system is to generate mandalas not only to assess the brain waves
but to use this opportunity to help the participant attain a calmer state of mind. The feedforward
system detects the colors that worked for the participant in improving their brainwaves. Next, the
algorithm uses those detected colors to build mandalas for a desired calmer state of mind. The
choice of color is fully automated and adaptive. Helpful color in each cycle is detected and
persisted. If it’s detected that a color is no longer helpful, a different color is randomly selected
by the algorithm. The color selection is a dynamic process and continues till the participant has
attained a calmer state of mind.
24
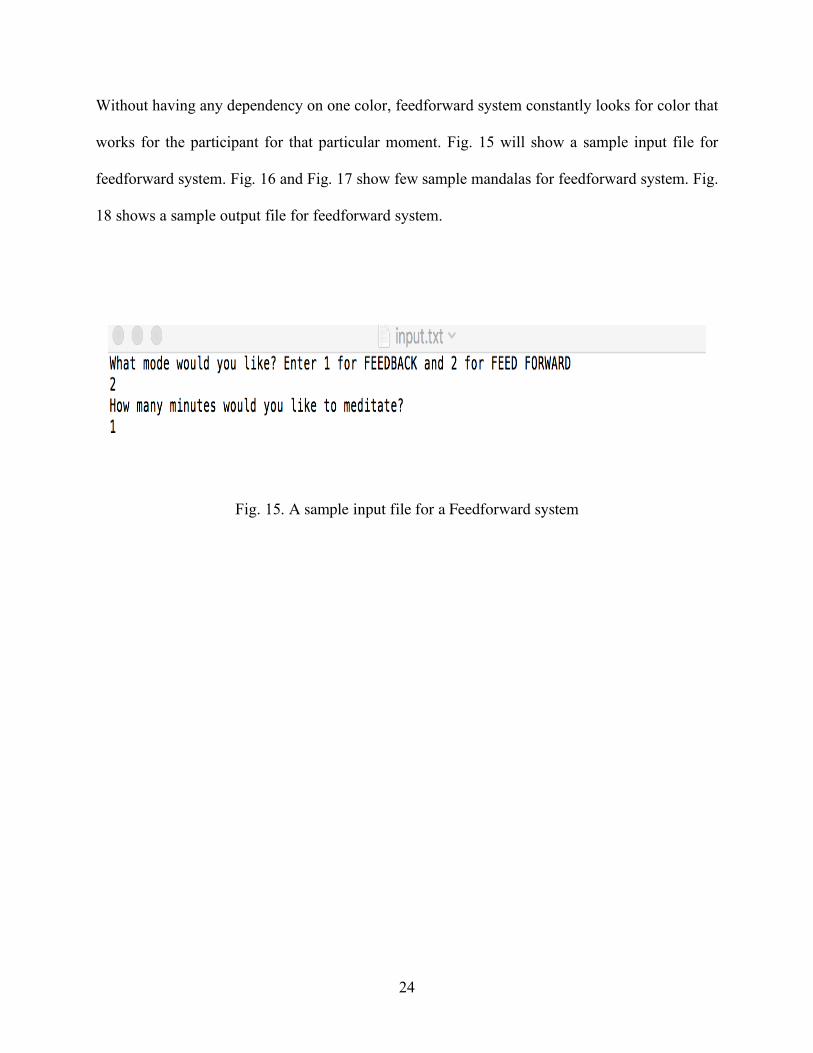
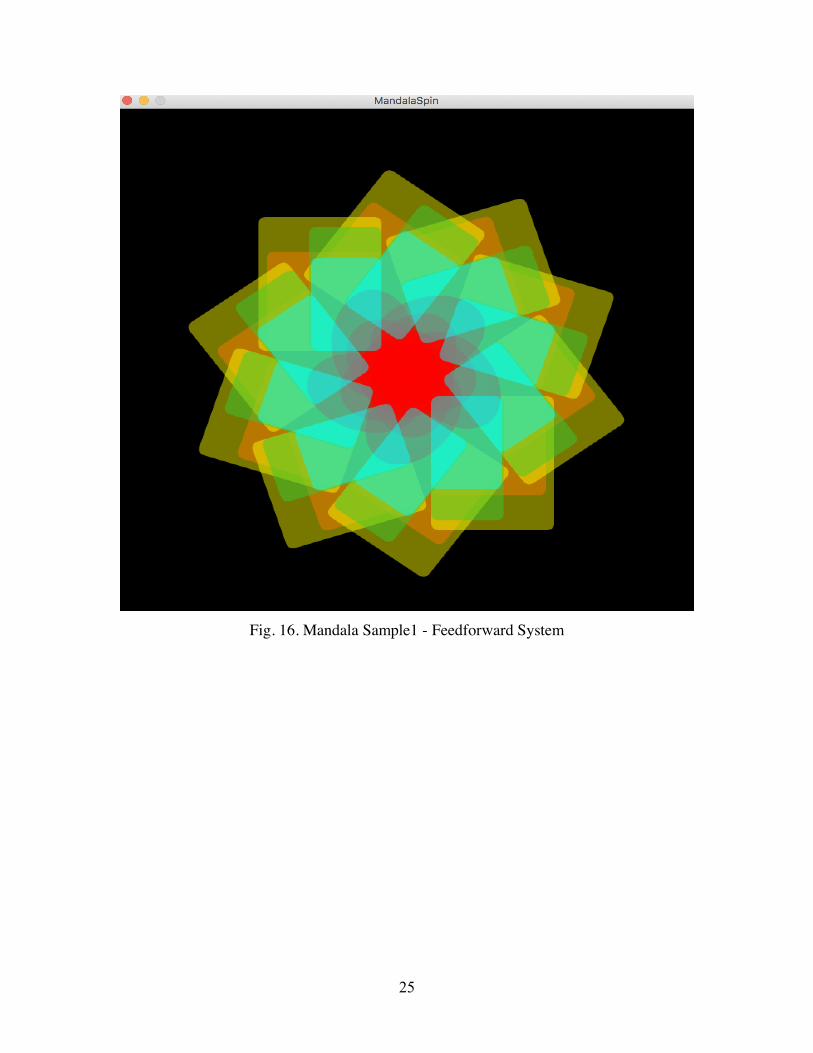
Without having any dependency on one color, feedforward system constantly looks for color that
works for the participant for that particular moment. Fig. 15 will show a sample input file for
feedforward system. Fig. 16 and Fig. 17 show few sample mandalas for feedforward system. Fig.
18 shows a sample output file for feedforward system.
Fig. 15. A sample input file for a Feedforward system
25
Fig. 16. Mandala Sample1 - Feedforward System

26
Fig. 17. Mandala Sample2 - Feedforward System

27
Fig. 18. A sample output file for a Feedforward system
2.4 Participant’s Feedback
We asked few people with different occupations and different interest in meditation to try out
these systems. Twenty volunteers sequentially tried a feedback system, followed by a
feedforward system. Each session was held for 2 mins. Participants then filled in a feedback
form (Fig. 19). Next, we generated mean and standard deviation parameters from the collected
data to evaluate which system worked better for the majority of the participants.

28
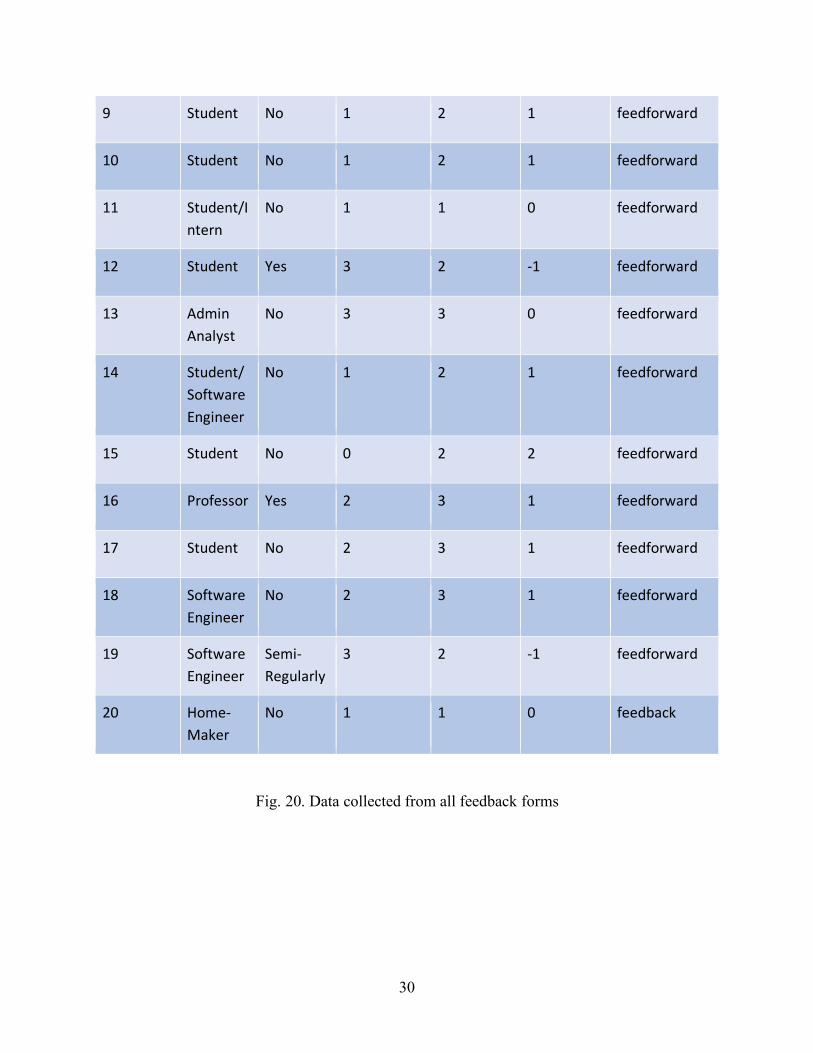
Fig. 19. Feedback form for all participants to fill after their session
29
CHAPTER THREE
Results
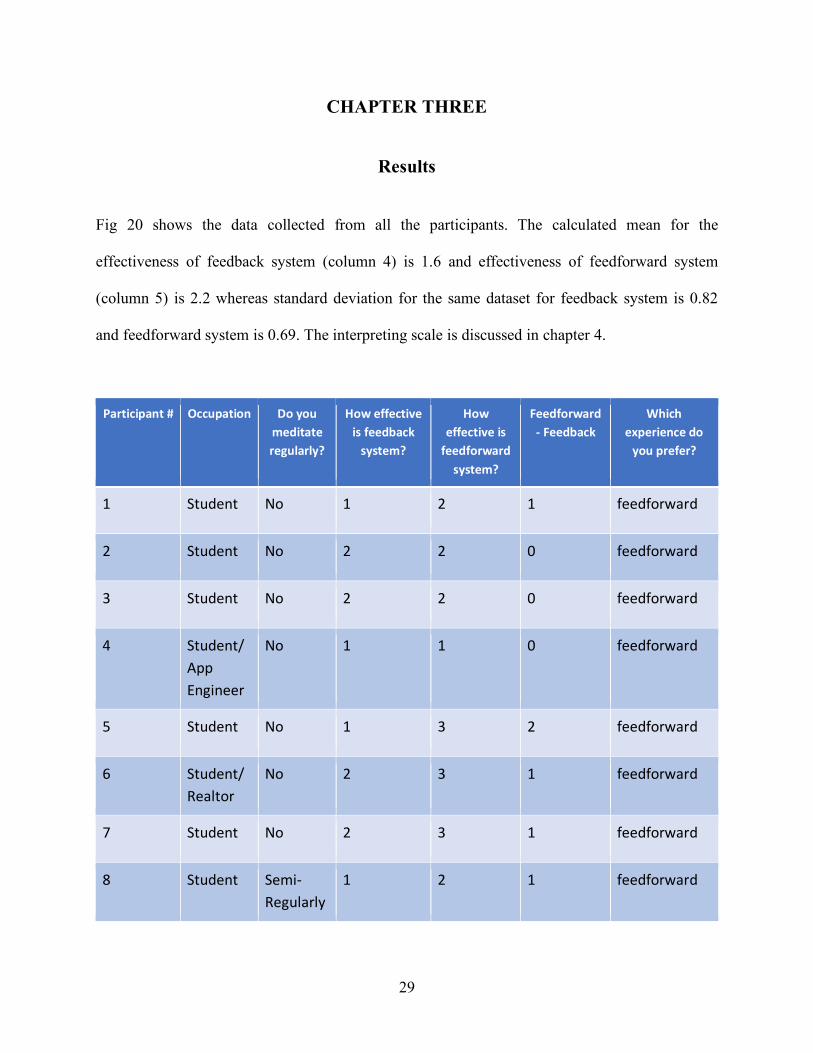
Fig 20 shows the data collected from all the participants. The calculated mean for the
effectiveness of feedback system (column 4) is 1.6 and effectiveness of feedforward system
(column 5) is 2.2 whereas standard deviation for the same dataset for feedback system is 0.82
and feedforward system is 0.69. The interpreting scale is discussed in chapter 4.
Participant # Occupation Do you meditate regularly?
How effective is feedback
system?
How effective is
feedforward system?
Feedforward - Feedback
Which experience do
you prefer?
1 Student No 1 2 1 feedforward
2 Student No 2 2 0 feedforward
3 Student No 2 2 0 feedforward
4 Student/App Engineer
No 1 1 0 feedforward
5 Student No 1 3 2 feedforward
6 Student/Realtor
No 2 3 1 feedforward
7 Student No 2 3 1 feedforward
8 Student Semi-Regularly
1 2 1 feedforward
30
9 Student No 1 2 1 feedforward
10 Student No 1 2 1 feedforward
11 Student/Intern
No 1 1 0 feedforward
12 Student Yes 3 2 -1 feedforward
13 Admin Analyst
No 3 3 0 feedforward
14 Student/Software Engineer
No 1 2 1 feedforward
15 Student No 0 2 2 feedforward
16 Professor Yes 2 3 1 feedforward
17 Student No 2 3 1 feedforward
18 Software Engineer
No 2 3 1 feedforward
19 Software Engineer
Semi-Regularly
3 2 -1 feedforward
20 Home-Maker
No 1 1 0 feedback
Fig. 20. Data collected from all feedback forms

31
CHAPTER FOUR
Discussion
From Fig. 19, it’s quite clear that nineteen out of twenty participants preferred the feedforward
experience over feedback experience (column 7). Most volunteers admitted benefiting from
feedforward system’s assistance. Analyzing the table further, we can say that even for volunteers
with no experience in meditation, using both, the feedback and the feedforward system, was a
calming and helpful experience. For participants with a considerable amount of meditation
practice, this system helped them to be better at meditation. The mapping of the effectiveness of
these systems is shown in Fig. 21.
Effectiveness Points
Not Effective 0
Slightly Effective 1
Moderately Effective 2
Extremely Effective 3
Fig. 21. Mapping effectiveness to numbers
The effectiveness scale is shown in Fig. 21 goes from 0 to 3. Zero being least effective and three
being most effective. Clearly, feedforward system is preferred over feedback system.

32
The goal of this experiment was to figure out a system that could bridge the gap we had
discovered in earlier attempts, as discussed in section 1.3. This report proves that a better
mapping system can to be developed that works well, combining the psychological meaning
behind colors and patterns with the signals generated by a human brain. In a nutshell, we
developed a system that stands out as a novel approach, compared to the rest of the meditative
methods available in this field. We not only mapped the brainwaves to generate beautiful
mandalas but also figured out a new feedforward system that uses participant's preferred calming
colors, in situ in a session, to make meditation even more effective.

33
CHAPTER FIVE
References
[1] C. G. Jung and R. F. C. Hull, Mandala Symbolism. Princeton, NJ: Princeton University Press,
2017.
[2] B. Baasanjav, “Visualization of mind: visual exploration of brain activity,” thesis, RIT
Scholar Works, 2016.
[3] O. Grechko and V. Gontar, “Visual Stimuli Generated by Biochemical Reactions Discrete
Chaotic Dynamics as a Basis for Neurofeedback,” J. of Neurotherapy, vol. 13, no. 1, pp. 30-40-
,2009.
[4] M. J. Lyons and T. Tomonaga, “Enactive mandala,” SIGGRAPH Asia 2013 Posters on - SA
13, 2013.
[5] “Mandala,” Wikipedia, 06-Nov-2017. [Online]. Available:
https://en.wikipedia.org/wiki/Mandala. [Accessed: 11-Nov-2017].
[6] "Muse: the brain sensing headband Developer Portal", Muse Developers, 2017. [Online].
Available: http://developer.choosemuse.com/. [Accessed: 04- Dec- 2017].
[7] J. Powers, Introduction to Tibetan Buddhism. Ithaca, NY: Snow Lion, 2007.
[8] “Creation of the Sand Mandala with Tibetan Monks,” baltimore.carpediem.cd.
[Online].Available:http://baltimore.carpediem.cd/events/6329146-creation-of-the-sand-mandala-
with-tibetan-monks-at-baltimore-yoga-village/.
[9] C. Wang, “The Psychological Meanings Behind Familiar Shapes (And How to Use Them),”
The Shutterstock Blog, 01-Nov-2016. [Online]. Available:
https://www.shutterstock.com/blog/psychological-meaning-shapes-use.

34
[10] "Electroencephalography", En.wikipedia.org, 2018. [Online]. Available:
https://en.wikipedia.org/wiki/Electroencephalography.
[11] "Processing.org", Processing.org, 2018. [Online]. Available: https://processing.org/.
[12] "Muse: the brain sensing headband Developer Portal", Muse Developers, 2018. [Online].
Available: http://developer.choosemuse.com/.


