
1
2014 Bank Study Project Class of 2015
Managing Bank Performance Ernie Swift
Complete and mail by February 15, 2013 to:
Complete and mail by January 15, 2015
Graduate School of Banking at LSU 4273 Highland Road
Baton Rouge, LA 70808-4541 225-766-8595
NOTES: 1. Please use 8 l/2" x 11" paper (or paper folded to that size). 2. Please attach the standard YELLOW cover sheet provided to your solution. 3. Please staple your project or use a binder clip. DO NOT use paper clips or any kind of folder or binder.

2
Introduction:
This Bank Study Project is based on material covered in the course Managing Bank Performance
that was taught during the first week of the 2014 session of the Graduate School of Banking at
LSU. Unless indicated otherwise, the answers to the BSP questions are to be based on the
financial statements included within this problem.
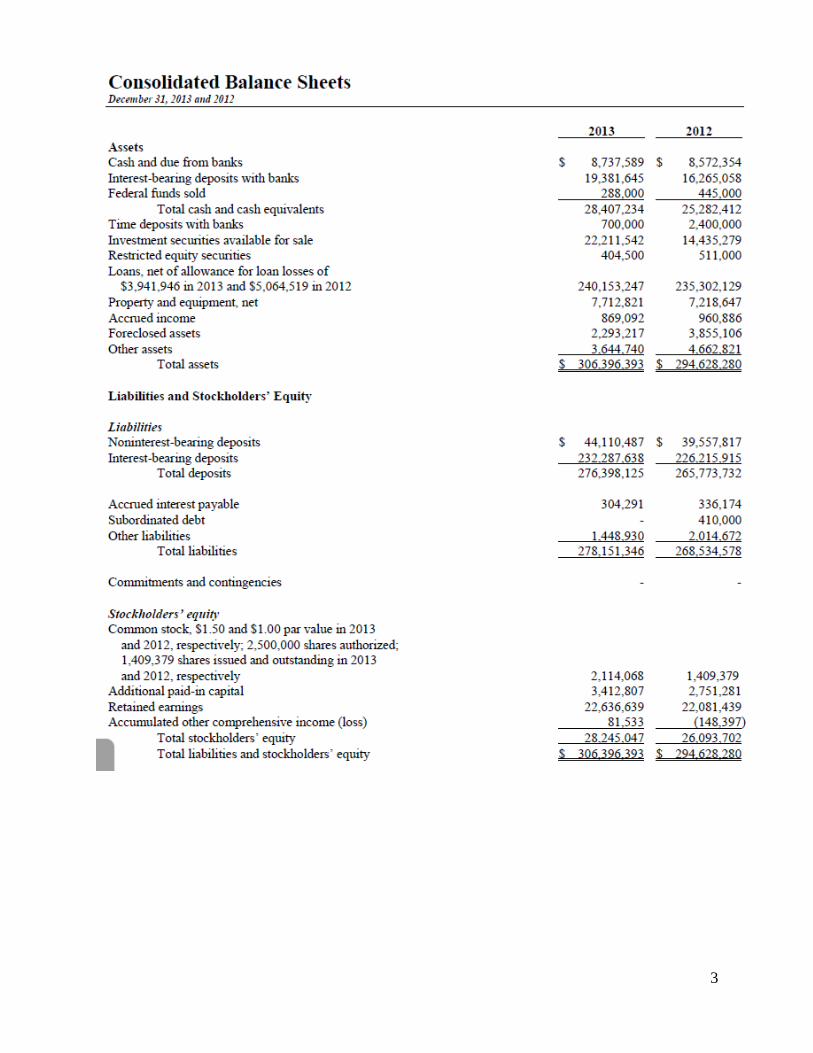
The name of the bank is KFCNTG Bank. The balance sheet and income statement for the years
2012 and 2013 are presented on pages 3 and 4. Other financial information will be presented
later in the problem. Use the data on pages 3 and 4 to answer the questions below and on page 5.
I. Calculate the following for each of the years 2012 and 2013:
2013 2012
1. The amount of Earning Assets
2. The amount of Interest Bearing Liabilities
3. The Yield on Earning Assets
4. The Cost Rate on Interest Bearing Liabilities
5. The Spread
6. The Net Interest Income
7. The Net Interest Margin
8. The Efficiency Ratio
9. The Return on Assets
10. The Return on Equity
Which of the first 8 items above has had the greatest impact on the change in ROA and ROE?
3

4
5
II. Calculate each of the following as a percent of total assets for each year using the data on
pages 3 and 4.
2013 2012
1. Interest Income
2. Interest Expense
3. Provision for Loan Losses
4. NonInterest Income
5. NonInterest Expense
6. Income Tax Expense
7. Net Income
8. Total Stockholders’ Equity
a. Divide your answers for #7 by your answers for #8. How do these values compare with
your answers to #10 on page 2?
b. If interest income to average assets increased 50 basis points in the next year, what would
be the change in ROA? Assume all of the other ratios remain the same.
c. What are the factors that could cause interest income to increase by 50 basis points?
d. What would likely be the effect on the other measures above that may cause your answer
to Q.b. above to be different?

6
e. In your judgment, is KFCNTG Bank performing well over the two years? Why?
f. Has KFCNTG’s performance improved or deteriorated? In which areas?
III. Some of you may have answered yes to the question e above, and some of you may have
answered no. Your answer may have depended upon how KFCNTG compares to your
hometown bank. A better analysis may be to compare the performance of KFCNTG against the
industry performance for banks in the same size category. Industry UBPR data is presented on
the next page for the years 2011, 2012, and 2013.
a. Transfer you answers for KFCNTG Bank to this page for ease of comparison, and then
calculate the same ratios for the industry average UBPR information on the following
page.
KFCNTG UBPR KFCNTG UBPR
2013 2013 2012 2012
9. Interest Income
10. Interest Expense
11. Provision for Loan Losses
12. NonInterest Income
13. NonInterest Expense
14. Income Tax Expense
15. Net Income
16. Total Stockholders’ Equity
b. How does KFCNTG compare with the industry peer group? Your answer should
evaluate every ratio.

7

8
c. What suggestions would you make to further improve the performance of KFCNTG as it
moves into 2014 and 2015?
IV. The interest rate risk position of the bank is best presented by a Beta Adjusted Gap
Report from the planning system used by the bank. A portion of this report is shown on below.
a. The date on this report is 90 days after the annual report date of 12/31/2013. However,
assuming that this makes little difference, what can you determine about the rate sensitivity
position of the bank?

9
b. Without knowing their exact values, what role do the beta values have in creating your
response to question (a) above? In what direction would these beta values on the liability
accounts need to change to cause the beta adjusted gap values to be more in line with the
unadjusted gap values?
c. In the management report of this analysis, a summary of the net interest margin shock
analysis is given and is replicated below. What does this analysis say about the bank’s interest
rate risk position? Does this correspond with your analysis of the Beta Adjusted Gap Report
discussed above in questions (a) and (b)? Why or why not?
d. Assume that the bank preformed a loan prepayment study and determined that loan
prepayments assumptions should be decreased for all scenarios. What effect would the slower
prepayment speeds in a rising rate environment have on the bank’s earnings at risk and why?
e. The bank assumes a 5% early withdrawal of time deposits based on a 200 and 300 basis
point rise in rates. If this doubles, what effect would it have on the bank’s earnings at risk and
why?
10
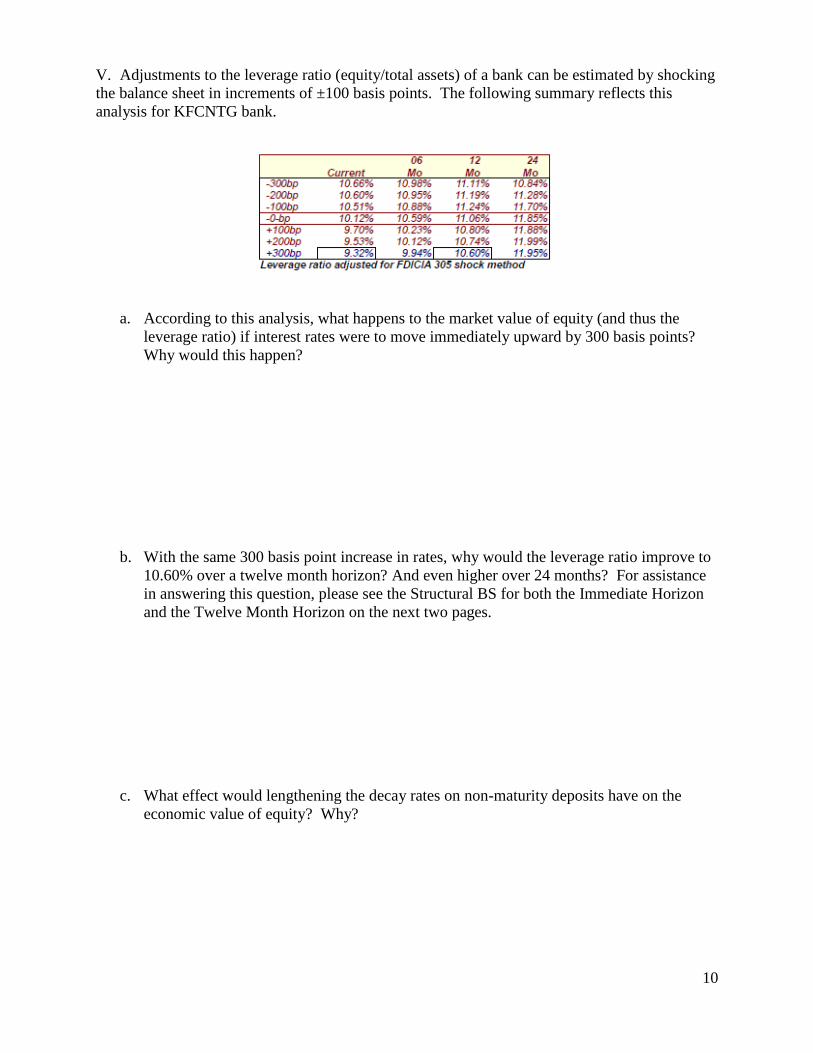
V. Adjustments to the leverage ratio (equity/total assets) of a bank can be estimated by shocking
the balance sheet in increments of ±100 basis points. The following summary reflects this
analysis for KFCNTG bank.
a. According to this analysis, what happens to the market value of equity (and thus the
leverage ratio) if interest rates were to move immediately upward by 300 basis points?
Why would this happen?
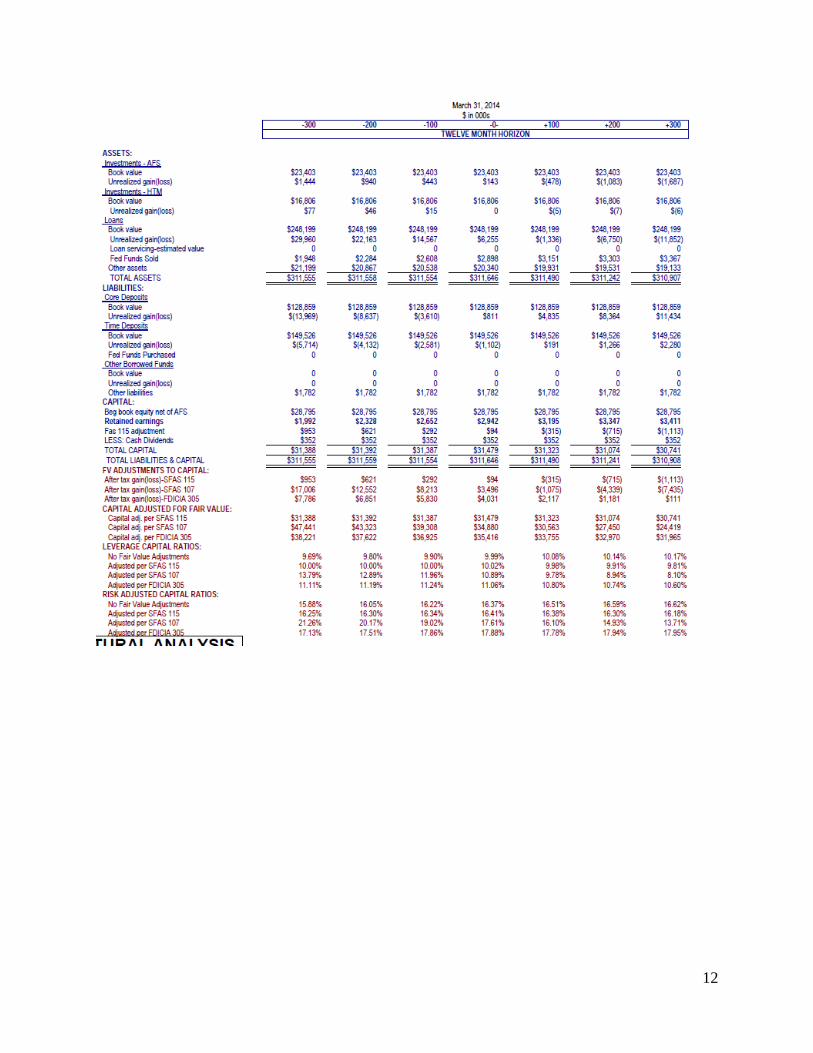
b. With the same 300 basis point increase in rates, why would the leverage ratio improve to
10.60% over a twelve month horizon? And even higher over 24 months? For assistance
in answering this question, please see the Structural BS for both the Immediate Horizon
and the Twelve Month Horizon on the next two pages.
c. What effect would lengthening the decay rates on non-maturity deposits have on the
economic value of equity? Why?

11
12


