
Maine’s Health Sector and WorkforceTrends-Projections-Challenges
June 13, 2013
Paul Leparulo, CFAPrincipal Economic Research Analyst

Objectives• Sector overview & trends• Factors affecting workforce supply and demand• Workforce development challenges

Healthcare & Social Assistance is Maine’s largest economic sector, in terms of number of jobs and wages paid.
(Maine employment mix by sector, 2011)
Healthcare; 18%

Maine Health Sector Employment
• 62,000 health occupational workers▫85% employed in health sector▫Healthcare practitioners▫Healthcare support workers
Hospitals, 34%
Ambulatory healthcare services
25%
Nursing and residential care facilities 24%
Social Assistance 18%

Maine’s health sector has been a consistent and significant producer of jobs.
(Healthcare & Social Assistance Employment, 1990-2011)
1990
1992
1994
1996
1998
2000
2002
2004
2006
2008
2010
0
20
40
60
80
100
120
Th
ou
san
ds
of
Jobs,
Main
e
80% growth in jobs

From 2001-2011, Maine’s health sector generated more jobs than all other job producing sectors, combined.
(Change in employment by sector, 2001-2011)
Health
care
Admin
istra
tive
Acom
mod
atio
ns
Educa
tion s
vcs
Mgt o
f cos
Public
Adm
in
Prof
& T
ech S
vcs
Arts, E
nterta
inm
ent
Min
ing
Agricultu
re, F
ores
try
Other
Tran
sp.
Real E
stat
e
Utiliti
es
Whol
esal
e Tr
ade
Finan
ce
Info
rmat
ion
Const
ruct
ion
Retai
lM
fg
-25,000
-20,000
-15,000
-10,000
-5,000
0
5,000
10,000
15,000
20,000

Hospitals have been the predominant driver of sector employment growth over the last ten years.
(Contribution to health sector employment growth, 2001-2011)
0%10%20%30%40%50%60%
15%
51%
13%21%
Perc
en
t C
on
trib
uti
on

Employment in health occupations expanded during a period when overall statewide employment contracted.
(Change in employment, 2001-2011)
-20,000
-15,000
-10,000
-5,000
0
5,000
10,000
Ch
an
ge i
n j
ob
s,
20
01
-201
1

Growth in healthcare occupations was broad based, and strong.
(Change in employment, 2001-2011)
10% 20% 30% 40% 50% 60% 70% 80% 90%0
500
1,000
1,500
2,000
2,500
3,000
Series3; RNs
Series3; Phar-macists
Series3; Physical therapists
Series3; Medical assistants
Series3; Medical records and
health info. Tech
Percent Growth in Employment, 2001-2011
Ch
an
ge i
n E
mp
loym
en
t, 2
00
1-
20
11
Bubble size represents 2011 employment

Strong employment growth has helped sustain Maine’s relatively high numbers of healthcare workers per population
compared to the nation.(Healthcare practitioners and support workers per 1,000 population)
2000 2004 2008 20100
5
10
15
20
25
30
35
40
45
5046, ME
37, USA
New EnglandMaineUSA
Healt
h W
ork
ers
per
1,0
00
po
pu
-la
tio
n

As a proportion of private sector employment and wages, Maine’s health sector is the largest in the nation.
(Health sector employment as a percent of statewide employment, 2010)
5% 7% 9% 11% 13% 15% 17% 19% 21% 23%5%
7%
9%
11%
13%
15%
17%
19%
21%
23%
25%
WVRI
ME
VT
PAMA
CT
SD
MT
NH
USA
FL
WY
NV
Health Sector/Statewide Total Employment (private sector)
Healt
h S
ecto
r/S
tate
wid
e t
ota
l w
ages (
pri
vate
secto
r)
Median age of state population, rank (2010):1. ME2. VT3. WV4. NH5. FL6. PA7. CT8. MT9. RI10.MA

Going forward, healthcare is expected to remain as a key driver of statewide employment growth.
(Employment projections, 2010-2020)
▫Health sector employment growth ~16% (est.) Growth rate and number of new jobs projected to
be among the highest of all sectors. Hospital employment expected to increase 30%.
▫Health occupational employment growth ~17% (est.) ~11,000 new jobs Nearly half of the 40 occupations with the fastest
projected rate of job growth in Maine are health occupations.

2000-2010
27% Increase
+13,000 New Jobs
2010-2020 est.
17% Increase
+11,000 New Jobs
However, industry and occupational growth rates are slowing compared to prior years.

Factors Influencing Workforce Supply and Demand

Americans Cut Back on Visits to Doctor, July 29, 2010
Americans Cutting Back on Drugs and Doctor Visits, April 4, 2012
Nursing NewsNurses Continue to Delay Retirement, June 10, 2011
‘Huge Increase’ in U.S. Workers Delaying Retirement, February 2013
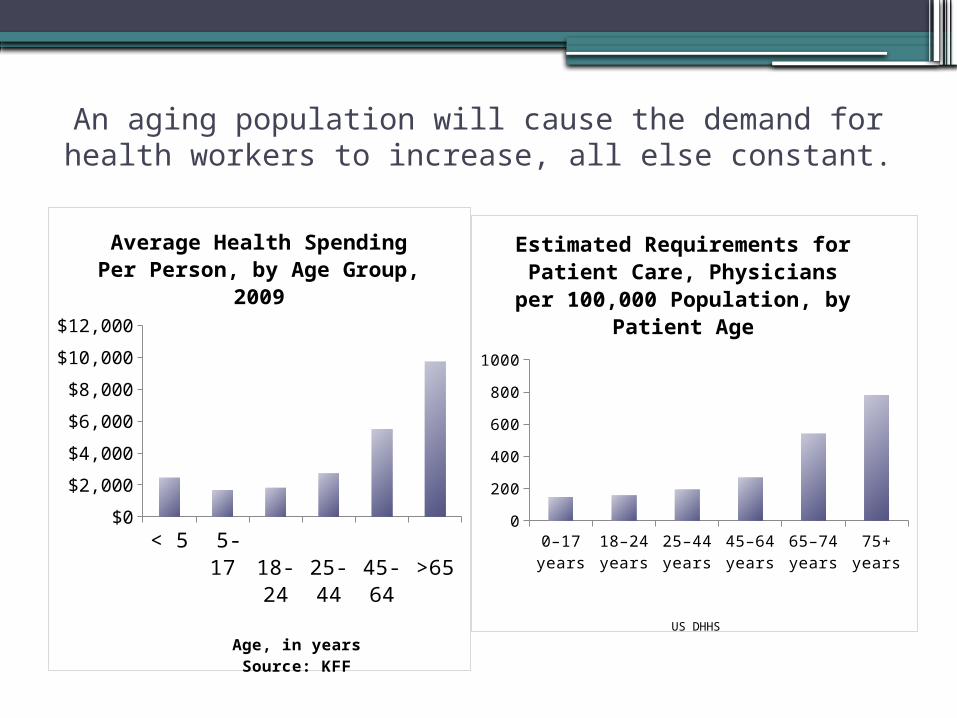
An aging population will cause the demand for health workers to increase, all else constant.
< 5 5-17
18-24
25-44
45-64
>65
$0
$2,000
$4,000
$6,000
$8,000
$10,000
$12,000
Average Health Spending Per Person, by Age Group,
2009
Age, in yearsSource: KFF
0–17 years
18–24 years
25–44 years
45–64 years
65–74 years
75+ years
0100200300400500600700800900
Estimated Requirements for Patient Care, Physicians per 100,000 Population, by Pa-
tient Age
US DHHS

Segments of the population that consume the greatest amount of healthcare (per person) are expected to grow rapidly, while other
age cohorts are expected to decline.(Maine Age Group Projections, 2010-2030)
0-19 20-44 45-64 65-84 85+0
50,000
100,000
150,000
200,000
250,000
300,000
350,000
400,000
450,000
20102030
Age Group
Popu
lati
on

The percent of the population above 65 years is expected to grow more rapidly in Maine than the
nation. (Percent of Population Above 65 Years, 2010 and Projected 2030)
2010 2015 2020 2025 2030
0.0%
5.0%
10.0%
15.0%
20.0%
25.0%
30.0%
MaineUSA
% p
op
ula
tion
> 6
5

Population growth—another fundamental driver of demand for health services—is projected to be much
lower in Maine than for the nation.(2010-2030 Population growth projections)
Maine USA-2%
0%
2%
4%
6%
8%
10%
12%
14%
16%
18%
0%
16%
Popu
lati
on
Gro
wth
(est.
), 2
010-
2030
Source: US Census, Governor’s Office of Policy and Management, CWRI

In addition to population demographics and growth, a range of other factors will contribute to new job opportunities for health workers.
New Job Opportunities
Changes in technology
, insurance,
etc.
Health of
population
Economic
growth

New Growth +11,000
Replacement
needs
Total Job
Openings
Job openings are a function of new growth and replacement demand
Population demographics
Economic &
Income
Growth
Changes in
technology
Health of
population
Workforce demographics
Worker
preference
s
Changes in insurance coverage

A meaningful portion of Maine’s health workforce is nearing the age of retirement, creating a sizable need for replacement workers in coming
years. (Percent of workforce over the age 55)
2006-2010 ACS
RNs
Phar
mac
ists
Phys
icia
ns &
Sur
geon
sLP
N
Nur
se P
ract
ition
ers
Dentis
ts0%
10%20%30%40%50%60%
27% 29% 30% 34% 35%
54%
MaineUSA

New Grow
th: +11,0
00
Replacement Needs
: +11,5
00
Total Projected
Job Openings ~22,500
Over half of the job openings in health occupations over the next decade will result from the need to replace workers that are retiring or permanently
leaving the occupation.(Projected Healthcare Job Openings, 2010-2020)

Health Workforce Development Challenges

“Due to the data currently available, it is difficult to offer both a complete forecast of the nation’s health care workforce supply and assess its adequacy for
meeting the demand for services in coming years.”
The Complexities of National Healthcare Workforce Planning, Bipartisan Policy Center
Deloitte Center for Health Solutions

Licensure/survey information
Quantifying skills gaps
Silos of data
Forecasting challenges
Data Issu
es:
Data suppression/workforce distribution

The complexities of forecasting workforce supply and demand
Source: Center for Health Workforce Studies
Conceptual Model of Factors Affecting State RN Supply in One Year


