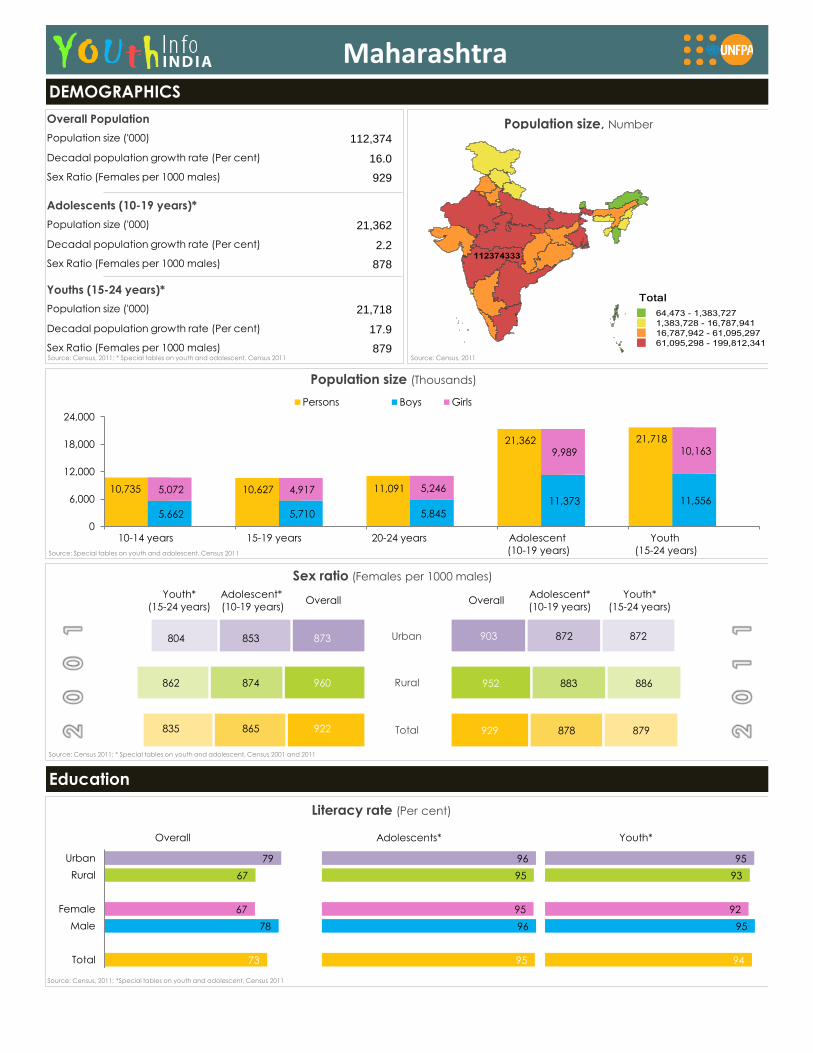
DEMOGRAPHICS
Education
10,735 10,627 11,091
21,362 21,718
5,662 5,710 5,845
11,373 11,556 5,072 4,917 5,246
9,989 10,163
0
6,000
12,000
18,000
24,000
Population size (Thousands)
Persons Boys Girls
Population size, Number
Source: Census, 2011
Population size ('000)
Overall Population
Decadal population growth rate (Per cent)
Sex Ratio (Females per 1000 males)
Population size ('000)
Adolescents (10-19 years)*
Decadal population growth rate (Per cent)
Sex Ratio (Females per 1000 males)
Population size ('000)
Youths (15-24 years)*
Decadal population growth rate (Per cent)
Sex Ratio (Females per 1000 males)
112,374
16.0
929
21,362
2.2
878
21,718
17.9
879
929
952
903
878
883
872
879
886
872
Sex ratio (Females per 1000 males)
Urban
Rural
Total
Overall Overall
804 853 873
862 874 960
835 865 922
Literacy rate (Per cent)
73
78
67
67
79
Total
Male
Female
Rural
Urban
Overall
95
96
95
95
96
Adolescents*
94
95
92
93
95
Youth*
Maharashtra
10-14 years 15-19 years 20-24 years Adolescent
(10-19 years)
Youth
(15-24 years)
Youth*
(15-24 years)
Youth*
(15-24 years)
Adolescent*
(10-19 years)
Adolescent*
(10-19 years)
Source: Special tables on youth and adolescent, Census 2011
Source: Census, 2011; * Special tables on youth and adolescent, Census 2011
Source: Census 2011; * Special tables on youth and adolescent, Census 2001 and 2011
Source: Census, 2011; *Special tables on youth and adolescent, Census 2011

Reproductive Health
52 35
15
2
Any anaemia Mild Moderate Severe
10
36
27
22
0
10
20
30
40
15-19 yr 20-24 yr
CPR Unmet need
Contraceptive Prevalence vs Unmet Need (Per cent)
84 105
64
198
232
165
Total Rural Urban
0
50
100
150
200
250
15-19 yr 20-24 yr
Age-specific Fertility Rate (Per 1,000 women)
42
55
Female Male
0
15
30
45
60
37 35
22
0
20
40
60
80
100
1992-1993 1998-1999 2005-2006
Women 15-19 years ever married (Per cent)
66 64
45
61 69
46
70 58
45
0
20
40
60
80
100
11-13 yr Middle 14-15 yr Secondary 16-17 yr Higher
secondary
Total Boys Girls
Net attendance ratio (Per cent)
Source: NSS, 2009-2010
Comprehensive knowledge of
HIV among youth (Per cent)
Anaemia Among Adolescent Girls (Per cent)
20
52
25
3
Normal
Thin
Moderately/severely thin
Overweight or Obese
BMI Among Adolescent Girls (Per cent)
Source: NFHS
Source: NFHS, 2005-2006 Source: BSS, 2006
Source: NFHS, 2005-2006 Source: NFHS, 2005-2006
Source: NFHS, 2005-2006
68 72
63
22 25 18
0
20
40
60
80
Total Boys Girls
15-19 yr 20-24 yr
Source: NSS, 2009-2010
Persons currently attending any
educational institutions (Per cent)
Maharashtra


