
1
Magnetic Nanoparticles for Power Absorption: optimizing size, shape and magnetic properties.
M A Gonzalez-Fernandez1, T Torres
2, M. Andrés-Vergés
3, R Costo
1, P de la Presa
4,
C J Serna1, M P Morales
1, C Marquina
5, M R Ibarra
2,5, G F Goya
2,†.
1Instituto de Ciencia de Materiales de Madrid, CSIC, Madrid, Spain
2Instituto de Nanociencia de Aragón, Universidad de Zaragoza, Zaragoza, Spain.
3Departamento de Química Orgánica e Inorgánica, Universidad de Extremadura, Badajoz, Spain
4Instituto de Magnetismo Aplicado, UCM-ADIF-CSIC, P.O. Box 155, 28230 Las Rozas, Madrid, Spain
5Instituto de Ciencia de Materiales de Aragón, CSIC, Zaragoza, Spain
Abstract
We present a study on the magnetic properties of naked and silica-coated Fe3O4
nanoparticles with sizes between 5 and 110 nm. Their efficiency as heating agents was
assessed through specific power absorption (SPA) measurements as a function of
particle size and shape. The results show a strong dependence of the SPA with the
particle size, with a maximum around 30 nm, as expected for a Néel relaxation
mechanism in single-domain particles. The SiO2 shell thickness was found to play an
important role in the SPA mechanism by hindering the heat outflow, thus decreasing the
heating efficiency. It is concluded that a compromise between good heating efficiency
and surface functionality for biomedical purposes can be attained by making the SiO2
functional coating as thin as possible.
PACS: 81.16.Be, 81.07.-b, 75.50.+a
Key words: core/shell magnetic nanoparticles, magnetic hyperthermia, specific power
absorption;
† Corresponding autor: [email protected]
2
I. Introduction
The interest in using core/shell magnetic nanoparticles (NPs) for biomedical and
bioengineering applications has been increasing over the last few years. These magnetic
NPs can be widely used for in-vitro as well as in-vivo applications [1, 2] such as
magnetic biosensing [3], cell separation [4], and contrast enhancement in magnetic
resonance imaging [5]. Further applications are being developed such as tissue repair,
magnetic hyperthermia treatments [6], targeted drug delivery [7, 8] and labeling of cells
[9]. The size, shape and biochemical coating of these nanoparticles are key attributes
that must be controlled accurately [10]. For specific applications such as magnetic
inductive hyperthermia (MIH), the rheological properties of the colloids and the
efficiency for absorbing radiofrequency (RF) power on NPs also require optimization
[11]. It is therefore important to characterize the magnetic properties so that the
performance of the final pharmaceutical product can be evaluated.
Hyperthermia is a well known clinical protocol seeking to raise the temperature
of a targeted body tissue above the physiologic level (c.a. 45°C or higher), usually for
oncology applications. Based on the same rationale, the magnetic hyperthermia is a new
technique developed to kill targeted cells by increasing the temperature of the
intracellular medium using magnetic nanoparticles [12]. The amounts of NPs
incorporated by a single living cell is of the order of few picograms, meaning that a
relatively small number of NPs (~103 to 10
4) have to be capable to rise the intracellular
temperature by several degrees Celsius. The capability of a given material to generate
heat from the magnetic coupling to an external alternate magnetic field is given by the
SPA (Specific Power Absorption, also known as specific power losses SPL), which is
the power absorbed per unit mass of magnetic nanoparticles. A great amount of effort
has been delivered to the understanding of the major mechanisms that govern heat
generated by power absorption and, as the main magnetic parameters are being better
controlled, larger values of SPA are continuously being reported along the last years.
[13]
In this paper we study the magnetic behavior of magnetite NPs in connection with
their optimization as agents for hyperthermia treatments. For this purpose, magnetite
NPs of different sizes and shapes were prepared; some of them were stable in water at
pH = 7. To further increase the pH-range of stability, several samples were further
3
coated with silica to obtain a core/shell structure. Silica has several advantages over
organic coatings such as its high resistance against biodegradation [14]. Additionally,
silica coating makes relatively easy to control the interactions among dispersed colloidal
particles [15], so that the resulting system displays high stability under aqueous
conditions in a very wide range of pH. The above properties make silica-coated
nanoparticles excellent potential candidates for biomedical applications based on
intravenous administration, since biodegradability, size and surface properties are
known to be the key parameters determining the final distribution of NPs in living
organisms.[16]
Sample
TEM NP
size
(nm)
Stabilizing
agent
SiO2
thickness
(nm)
Isoelectric
Point
Hydrodynamic
size at pH 7
(nm)
A 24±5
SO4=
- 5 71
B 30±8 - 5 115
C 45±8 - 5.3 156
D 42±6 Citric acid - 2 124
E 5±1 None - 7 polydisperse
F 110±9 None - 6.7 Not stable
BSi 30±8
SiO2
1 2.5 150
CSi 45±8 4.5 2.8 300
FSi 110±9 15 1.25 423
Table I. Summary table showing isoelectric points and hydrodynamic size of uncoated
and coated samples.
II. Experimental
A. Synthesis and coating of magnetic nanoparticles
The Fe3O4 nanoparticles were prepared by a direct method described elsewhere
[17]. This method is based on the precipitation of an iron (II) salt (FeSO4) in the
presence of NaOH and a mild oxidant (KNO3) at 90º C in a mixture of solvents
water/ethanol. Particle size was controlled by changing the concentrations of the iron
salt leading to magnetite nanoparticles with sizes from 24 nm to 45 nm and narrow size
distributions (samples A, B and C, see Table I). The presence of ethanol in the medium
not only control the speed of the reaction to produce cubic nanoparticles but also is
4
responsible for the presence of sulphate ions SO4= on their surface providing stability at
pH 7. To assess the influence of particle shape, we followed the same synthesis route in
water [17], resulting in spherical nanoparticles of 42 6 nm size with narrow size
dispersion. These particles were stabilized in water at pH 7 with citric acid [18] (Sample
D).
The cubic nanoparticles having sizes of 30 nm and 45 nm were coated with
silica following the Stöber method [19, 20]. A thin silica layer was deposited on their
surface at a constant temperature of 20 ºC. The magnetite nanoparticles (30 mg) were
added to a solution of 110 ml of 2-propanol that contained distilled water (12 ml) and
ammonium hydroxide (1.5 ml). The solution was maintained in an ultrasonic bath for 1
h. Then, tetraethoxysilane (TEOS) was added to the solution and left in the ultrasonic
bath for 6 h and 12 h depending on the required thickness of the silica layer. These
samples were labeled as samples BSi and CSi, respectively. The solution was filtered,
and the nanoparticles were washed with 2-propanol and dried at 20 ºC for 1 day. Then,
they were re-dispersed in distilled water.
To perform a systematic study on the power absorption efficiency as a function of
particle size, two additional samples were synthesized at the low and high ends of the
series. First, small cubic magnetite nanoparticles (d ≈ 5 nm) were synthesized following
Massart‟s method in the presence of ethanol (Sample E).[21] For obtaining larger Fe3O4
nanoparticles, hematite particles were first synthesized and then reduced to magnetite as
described elsewhere [22], resulting in average particle size d = 110 nm (sample F).
From this sample, core/shell Fe3O4/SiO2 nanoparticles with the same magnetic core size
were obtained (sample FSi) following the Stöber method mentioned above.
B. Characterization
Particle size and shape were studied by transmission electron microscopy (TEM)
using a 200 keV JEOL-2000 FXII microscope. TEM samples were prepared by placing
one drop of a dilute suspension of magnetite nanoparticles in acetone on a carbon coated
copper grid and allowing the solvent to evaporate slowly at room temperature. Colloidal
properties of the samples were studied in a Zetasizer NanoTM
from Malvern
Instruments. The hydrodynamic size of the particles in suspensions was measured by
photon correlation spectroscopy and the zeta potential was measured as a function of pH
at 25º C, using 10-2
M KNO3 as electrolyte and HNO3 and KOH to vary the pH of the
suspensions. Samples in powder were prepared and characterized magnetically at room

5
temperature using a Vibrating Sample Magnetometer (VSM 9 MagLab 9 T, Oxford
Instruments) at room temperature. Zero-field-cooled (ZFC) and field-cooled (FC)
curves were measured using a Superconducting Quantum Interference Device (MPMS
XL, Quantum Design), between 5 K and 280 K, with cooling field HFC = 100 Oe. Data
were obtained by first cooling the sample from room temperature in zero applied field
(ZFC process) to the basal temperature (5 K). Then a field was applied and the variation
of magnetization was measured with increasing temperature up to T = 280 K. After the
last point was measured, the sample was cooled again to the basal temperature keeping
the same field (FC process); then the M vs. T data was measured for increasing
temperatures. Low-temperature hysteresis loops (5-280 K) were obtained in applied
fields up to 5 T. Specific Power Absorption (SPA) measurements were done using a
commercial ac applicator (model DM100 by nB nanoscale Biomagnetics) working at
260 kHz and field amplitudes from up to 16 mT, and equipped with an adiabatic
sample space (0.5 ml) for measurements in liquid phase. Temperature data was taken
using a fiber optic temperature probe (Reflex™, Neoptix) immune to rf environments.
III. Results and Discussion
A. Morphology and size distribution of nanoparticles
The statistics to calculate the mean particle size and distribution was performed from
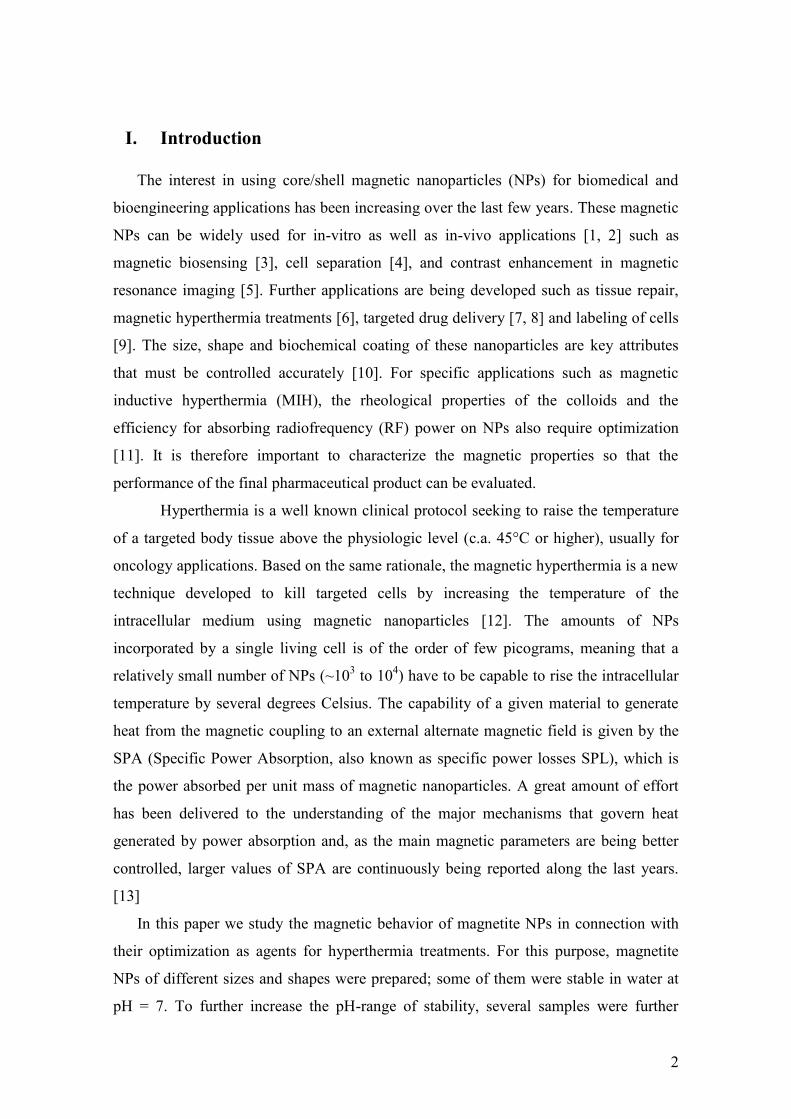
TEM image analysis, using sets of > 100 particles in each case. The general aspect and
morphology of uncoated nanoparticles is illustrated in Figure 1 for samples B, D and F
(see also Table I). It has been previously shown [17] that for this synthesis route the
particle growth rate is determined by the iron salt concentration and water/ethanol ratio.
This in turn seems to determine the final shape, since particles prepared with an excess
of [Fe2+
] are spherical (samples with average size > 100 nm no studied in the present
paper), while those prepared with an excess of [OH-] are cubic. Samples A, B, C and D
display very low size dispersion around their mean values. Colloidal suspensions of
particles A, B and C were directly obtained by simple ultrasonic treatment of the
powders leading to very stable ferrofluids at pH 7. Sulphate anions present at the
particle surface seem to be responsible for the colloidal stability that provides a
biocompatible character to the suspensions. However, sample D required further
stabilization in water at pH 7 by adding citric acid [18].
6
Figure 1: Low-resolution TEM images of samples B, D and F uncoated.
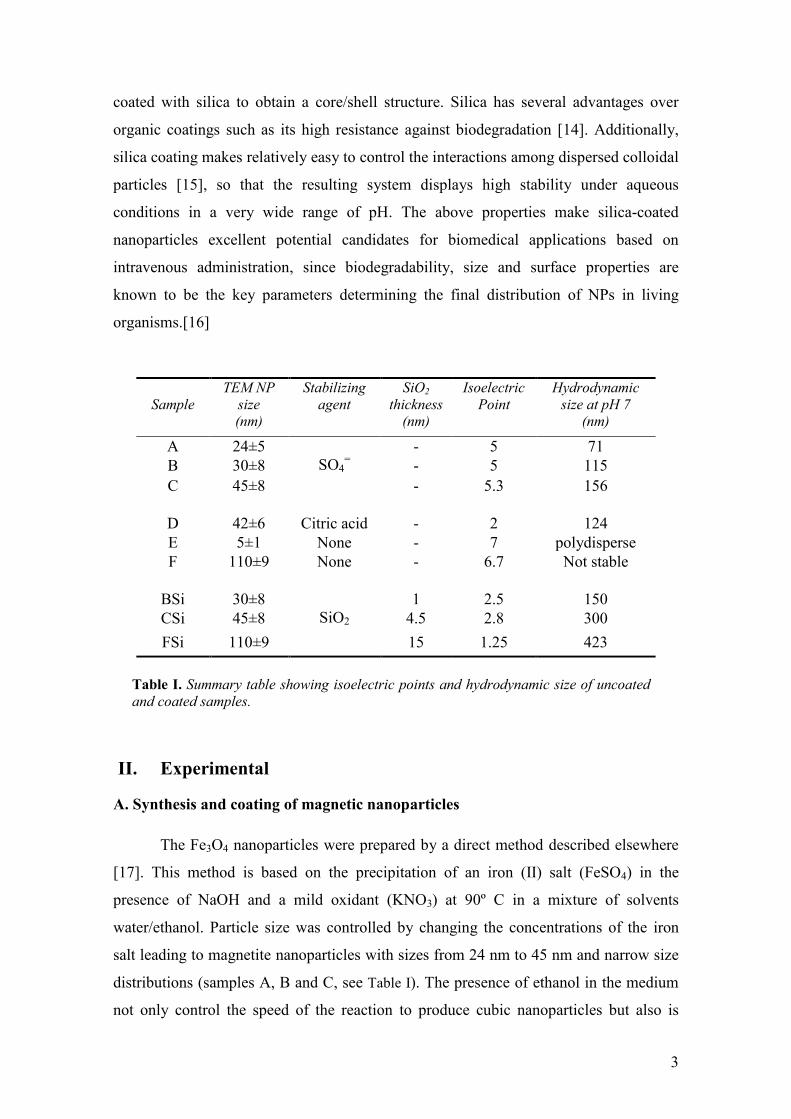
The TEM image of sample CSi (Figure 2) shows clearly that the coating of the SiO2
shell has uniform thickness and is complete around the magnetic cores. The thickness of
the silica coating was extracted directly from the TEM images. Samples BSi (30 nm)
and CSi (45 nm) were coated with a 1 nm and 5 nm silica layer, respectively. As
explained in the experimental section, the control of the silica shell thickness was
achieved through careful changes in the experimental parameters of the coating
procedure, aiming to optimize the stability of the nanoparticles in water at high
concentrations in a wide pH range.
Figure 2. TEM image of sample CSi (45.5 nm size
Fe3O4/SiO2 NPs) coated with silica.
B
100 nm
200 nm
200 nm
D F
7
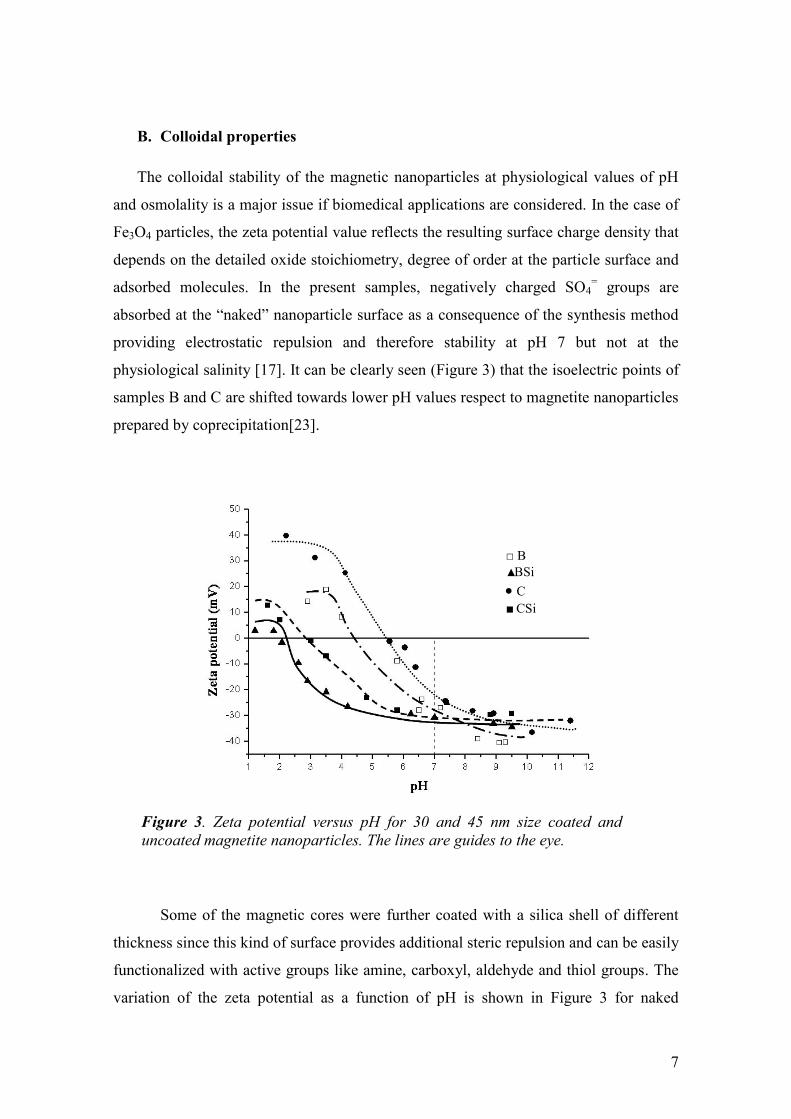
B. Colloidal properties
The colloidal stability of the magnetic nanoparticles at physiological values of pH
and osmolality is a major issue if biomedical applications are considered. In the case of
Fe3O4 particles, the zeta potential value reflects the resulting surface charge density that
depends on the detailed oxide stoichiometry, degree of order at the particle surface and
adsorbed molecules. In the present samples, negatively charged SO4= groups are
absorbed at the “naked” nanoparticle surface as a consequence of the synthesis method
providing electrostatic repulsion and therefore stability at pH 7 but not at the
physiological salinity [17]. It can be clearly seen (Figure 3) that the isoelectric points of
samples B and C are shifted towards lower pH values respect to magnetite nanoparticles
prepared by coprecipitation[23].
Figure 3. Zeta potential versus pH for 30 and 45 nm size coated and
uncoated magnetite nanoparticles. The lines are guides to the eye.
Some of the magnetic cores were further coated with a silica shell of different
thickness since this kind of surface provides additional steric repulsion and can be easily
functionalized with active groups like amine, carboxyl, aldehyde and thiol groups. The
variation of the zeta potential as a function of pH is shown in Figure 3 for naked
□ B
▲ BSi
C
■ CSi

8
nanoparticles (samples B and C) as compared to silica coated ones (BSi and CSi
respectively). Table I shows isoelectric point and the hydrodynamic size of coated and
uncoated magnetite NPs studied in this work. The presence of silica on the surface of
the nanoparticles in samples BSi and CSi results in a shift of the isoelectric point of
these samples towards values near pH = 2. From the values of Z potential of the coated
nanoparticles (see Figure 3), it is clear that the silica shell contributes to colloidal
stability since they are stable in a wider pH range than the uncoated nanoparticles, as
reflected in the lower isoelectric points of samples BSi and CSi [24]. These colloidal
suspensions are stable in water at concentrations up to 5 mg/ml.
-40 -20 0 20 40
-80
-40
0
40
80
0 10 20 30 40 5040
60
80
M(e
mu/g
Fe
3O
4)
H(kOe)
E
A
B
C
T = 250 K
Ms (
em
u/g
Fe3O
4)
d (nm)
250 K
5 K
-40 -20 0 20 40
-80
-40
0
40
80
-1,0 -0,5 0,0 0,5 1,0
-40
-20
0
20
40
H (kOe)
BSi
CSi
FSi
M
(em
u/g
)
H (kOe)
Figure 4. Hysteresis M(H) curves for uncoated (left) and coated (right) magnetite
nanoparticles taken at 250 K. Left inset: saturation magnetization as a function of average
particle sizes taken at 5 and 250 K. Right inset: enlargement of the low-field region
showing the different coercive fields for single- (BSi and CSi) and multi-domain (FSi)
particles
C. Magnetic properties
In order to evaluate the correlation between basic magnetic parameters of the
NPs and the efficiency for power absorption, we performed magnetization
measurements as a function of temperature (ZFC-FC) and hysteresis loops at T = 5 K
and 250 K. The coercivity values extracted from M(H) curves at T = 250 K (listed in
Table II) were found to decrease somewhat with size, reflecting the effect of thermal
energy on these (single domain) particles with d < 50 nm in the blocked state, which is
to decrease the HC values for decreasing particle volume [25]. The saturation
magnetization MS of these particles (Figure 4) showed essentially the same values
within experimental accuracy (83-85 emu/g), in agreement with the fact that eventual
contributions from surface disorder are expected to be similar. On the other hand,

9
samples outside this narrow size window (i.e., samples E and F) have a distinct
behavior. In the case of sample E having 5 nm, the value of MS = 47.7 emu/g was nearly
half of the corresponding for the larger particles (see the inset of Figure 4). This
reduction is a known effect from surface disorder, which increases in smaller particles
(i.e., d < 10 nm) due to the increased surface/volume ratio[26]. On the other end of the
series, the effect of the multi-domain structure in sample F (d = 110 nm) is reflected in
the larger values of coercive field due to the domain wall displacement.
Sample
d
(nm)
t
(nm)
Ms Mr/Ms Hc Ms Mr/Ms Hc SPA
(emu/gFe3O4) (Oe) (emu/gFe3O4) (Oe) (W/g)
T = 250 K T = 5 K
A 24 - 83 0.08 44 85 0.3 311 137.4
B 30 - 83 0.12 64 85 0.3 309 83.6
C 45 - 85 0.14 75 87 0.41 242 62.7
D 42 - 82 0.15 79 88 0.32 169 11.7
E 5 - 48 0.004 4 50 0.27 334 3.17
F 110 - 77 0.3 170 88 0.33 250 1
BSi 30 1 85 0.17 86 89 0.04 165 81
CSi 45 4 86 0.19 93 87 0.15 100 45
FSi 110 15 80 0.5 890 86 0.6 2014 1.74
Table II: Magnetic parameters of Fe3O4 nanoparticles of different sizes and SiO2 thickness.
Magnetization curves as a function of temperature taken in zero-field and field
cooling modes for samples A and B (Figure 5) show that the NPs remain blocked up to
room temperature, since no maximum in the ZFC is observed. For temperatures below
50 K both ZFC curves show a sudden decrease, usually observed for magnetite
nanoparticles having sizes between 20 and 50 nm [17] and associated to a decreased
Verwey transition of Fe3O4, located at TV = 125 K in the bulk material [27]. It has been
previously reported that for particles having d < 50 nm the Verwey transition shifts to
lower temperatures with decreasing particle size, and is no longer observable for d ≤ 10
nm.[26] In agreement with the smaller size of sample E, the corresponding ZFC-FC
data shows the maximum in the ZFC curve at TB = 104.4 K (see inset of Figure 5)

10
0 50 100 150 200 2500
1
2
3
4
5
6
0 50 100 150 200 250
0,5
1,0
1,5
2,0
2,5
3,0
3,5
M(e
mu
/gF
e3
O4)
T(K)
ZFC-E
FC-E
M(e
mu/g
Fe3
O4)
T(K)
ZFC-A
FC-A
ZFC-B
FC-B
Figure 5: ZFC-FC curves for samples A and B uncoated magnetite
nanoparticles taken from 5 to 250 K. Inset: ZFC-FC curves for sample E show
the TB104.4 K.
D. Effect of size on SPA
In order to assess the influence of physical parameters on heat generation, we
measured the SPA as a function of particle size spanning the 20 to 45 nm size range.
For completeness, two additional samples having average size values of 5 nm and 110
nm were also studied. The heating efficiency of the colloids was measured from the
temperature increaseT) of a given mass of the constituent nanoparticles (mNP) diluted
in a mass of liquid carrier (mLIQ) during the time interval (t) of the experiment. The
expression for power absorption P per unit mass of the magnetic material is given by:
t
T
m
cmcm
m
P
NP
NPNPLIQLIQ
NP (1)
where cLIQ and cNP are the specific heat capacities of the liquid carrier and the
nanoparticles, respectively. Since the concentrations of MNPs are usually in the range
of 1% wt. or less, we can approximate (1) by
t
Tc LIQLIQ
(2)
where LIQ and are the density of the liquid and the weight concentration of the MNPs
in the colloid, respectively.

11
0 10 20 30 40 50 60 70 80 90 100 110 1200
20
40
60
80
100
120
140
F
B
C
A
SP
A(W
/gF
e3O
4 )
d (nm)
E
Figure 6: Specific Power Absorption of uncoated magnetite samples with
different nanoparticle size.
The SPA values measured according to the experimental section are listed in Table II in
W/g of magnetite and plotted as a function of particle size in Figure 6. It can be observed
that SPA values are maximum for sample A with d = 24 nm and, for values below and
above this maximum, the values decrease abruptly. This is in agreement with the
expected behavior for Néel relaxation-based mechanism as first proposed by
Rosensweig [28] and experimentally found in many colloidal systems [11, 17, 29].
B C F0
20
40
60
80
100
SP
A (
W/g
)
Sample
Uncoated
Coated
Figure 7:SPA of single domain (B and C) and multidomain (F) nanoparticles.
The shaded bars correspond to uncoated (B, C and F) samples, and filled bars
represent the silica-coated (BSi, CSi and FSi) samples.

12
The Néel relaxation mechanism is strongly dependent on particle volume through the
term ~ exp{KV/kBT}, so that the optimum size of nanoparticles for hyperthermia
should be located within a narrow size window (lower than the single-domain critical
size for a given material). In addition to the drop of SPA values with increasing size
within the single-domain region, it is worth to notice that SPA becomes essentially null
for multi-domain particles (i.e., sample F). This small value for F sample suggests that
domain wall displacements contribution to power absorption is much smaller than the
Néel relaxation process in single domain particles at these frequencies. This observation
is supported by previous measurements (not shown) performed on well-crystallized,
multi-domain particles of Fe3O4 with 1 m size and bulk material, which showed small
SPA values of 0.2 and 0.3 W/g, respectively. Indeed, the maximum SPA value
measured for bulk magnetite at f =260 kHz and B = 100 Oe, which is mainly due to
losses from domain wall displacements, was about 0.5 W/g.
E. Effect of silica coating on SPA
To evaluate the effect of SiO2 shell on the heat release process, we have
determined the SPA of the silica-coated magnetite nanoparticles of sizes 30, 45 and 110
nm, labeled BSi, CSi and FSi respectively, and compared to the corresponding „naked‟
particles (samples B, C and F). We recall the fact that all of these SiO2-coated samples
are composed of the same magnetic cores than the corresponding uncoated
nanoparticles. Therefore the magnetic coupling and power absorption efficiency should
be the same for the corresponding coated and uncoated samples with the same particle
size. The comparative results of SPA measurements between naked and coated NPs are
shown in Figure 7. In addition to the observed decrease of SPA with increasing particle
size, already discussed, the coated NPs display smaller SPA values than the
corresponding uncoated ones with similar sizes. Moreover, the largest reduction is
observed for CSi sample, which has a thicker SiO2 shell. One possible explanation for
this difference could be related to the insulating nature of the silica coating, which could
be shielding the heat from the magnetic nanoparticle. This indicates that the silica
coating of the nanoparticles should be designed to be the minimum necessary to keep
the nanoparticles stable in water. In the case of samples F and FSi, composed of the
same magnetic cores with average size 110 nm, the SPA corresponds to domain wall

13
losses since for this size range the NPs have a multi-domain structure [30] and the
power losses are due to domain wall displacements.
F. Effect of particle shape on SPA
Samples of 45 nm were obtained with cubic and spherical shapes (samples C and
D, respectively) to explore the effects of anisotropy on the SPA. These samples have
been characterized magnetically at different temperatures in powder form. The
hysteresis loops of both samples measured at room temperature show similar HC values
of 70-75 Oe. These values are consistent with single-domain particles near the blocking
temperatures (which is above 250 K). However, at low temperatures where particles are
fully blocked (T = 5 K) sample C displays a larger HC value, indicating a source of
larger magnetic anisotropy (see Table II). We believe that this difference is likely to be
originated in stronger shape anisotropy due to its cubic form, as observed from TEM
images (Figure 1). Since both samples are of the same Fe3O4 crystals,
magnetocrystalline anisotropy does not appear to be the source of this anisotropy
difference. Accordingly, Error! Reference source not found. the power absorption
values in the anisotropic nanoparticles (sample C), considerably larger than the
corresponding for the spherical particles (sample D) with the same average size,
indicate that shape anisotropy differences originated from particle morphology have to
be considered in order to optimize specific power absorption values for hyperthermia
applications.
IV. Conclusions
We have succeeded in producing highly stable magnetic NPs with excellent
control of particle size between ~20-50 nm. This control of final size allowed us to
match the narrow size window to reach maximum power absorption efficiency for
hyperthermia application. The maximum SPA values correspond to sizes around 30 nm,
and falls down rapidly for values that differ in few nanometers. We have also observed
that, in addition to size value, the magnetic anisotropy of the nanoparticles is relevant to
obtain higher values of SPA. Coating the particles with an insulating SiO2 shell resulted
in lower SPA values due to changes in heat propagation out of the particles. This result
14
indicates that the surface functionalization of the particles designed for heating therapies
in biomedicine should be kept to a minimum.
V. Acknowledgments
The authors acknowledge the financial support from Diputación General de
Aragón, Comunidad de Madrid (S-0505/MAT/0194), and Ministerio de Ciencia e
Innovación (MAT2005-03179 and MAT2008-01489). GFG and PP acknowledge
support from the Spanish MEC through the Ramon y Cajal program.
References
[1] Tartaj P., 2006 Curr. Nanosci. 2, 43.
[2] Goya G F, Grazú V and IbarraM R 2008 Curr. Nanosci. 4 1
[3] Jaffrezic-Renault N., Martelet C., Chevolot Y., Cloarec J-P, 2007 Sensors, 7, 589.
[4] Gu H., Xu K., Xu C., Xu B., 2006 Chem Comm, 941.
[5] Müller K., Skepper J.N., Posfai N., Trivedi R., Howarth S., Corot C., Lancelot E.,
Thompson P.W., Brown A., Gillard J.H., 2007 Biomaterials, 28, 1629.
[6] Hilger I., Hergt R., Kaiser W.A, 2005 J. Magn. Magn Mater., 293, 314.
[7] Jurgons R., Seliger C., Hilpert A., Trahms L., Odenbach S. and Alexiou C., 2006 J.
Phys.: Cond. Mat. 18, S2893.
[8] Jain T.K., Morales M.A., Sahoo S.K., Leslie-Pelecky D.L. and Labhasetwar V.,
2005 Molecular Pharmaceutics, 2, 194.
[9] Parak W.J., Gerion D., Pellegrino T., Zanchet D., Micheel C., Williams S.,
Boudreau R., Le Gros M.A, Larabell C.A. and Alivisatos P., 2003 Nanotechnology, 14,
R15.
[10] Corot C., Robert P., Idée J-M, Port M., 2006 Advanced Drug Delivery Reviews 58,
1471.
[11] Goya G.F., Fernandez-Pacheco R., Arruebo M., Cassinelli N., Ibarra M.R., 2007 J.
Magn. Magn. Mater., 316,132.
[12] Van der Zee J., 2002 Annals of Oncology 13 1173.
[13] C. Gruttner, K. Muller, J. Teller, F. Westphal, A. Foreman, R. Ivkov, 2007 J.
Magn. Magn. Mater. 311 181.
[14] A. Lu, E.L. Salabas, F. Schüth, 2007 Angew. Chem. Int. Ed. 46, 1222.
[15] Tartaj, P.; Serna, C. J., 2003 J. Am. Chem. Soc. 125, 15754.
[16] Corot, C.; Robert, P.; Idee, J. M.; Port, M., 2006 Adv. Drug Delivery Rev. 58, 1471.
[17] Verges M.A., Costo R., Roca A.G., Marco J.F., Goya G.F., Serna C.J. and Morales
M.P. 2008 J. Phys. D: Appl. Phys. 41 134003.
[19] Stöber W., Fink A., Bohn E., 1968 J. Colloid Interface Sci., 26, 62.
[20] Philipse A.P., van Bruggen M.P.B., Pathmamanoharan C., 1994 Langmuir, 10, 92.
[18] Martina, M.S.; Fortin, J.P.; Menager, C.; Clement, O.; Barratt, G.; Grabielle-
Madelmont, C.; Gazeau, F.; Cabuil, V.; Lesieur, S., 2005 J. Amer. Chem. Soc., 127,
10676.
[21] Ye, X.; Lin, D.; Jiao, Z.; Zhang, L.,.1998 J. Phys. D: Appl. Phys. 31, 2739.
15
[22] M.P. Morales, M.J. Muñoz-Aguado, J.L. Garcia-Palacios, F.J. Lazaro, C.J. Serna,
1998 J. Magn. Mag. Mater., 183, 232.
[23] L. Garcell, M.P. Morales, M. Andrés-Vergés, P. Tartaj and C.J. Serna, 1998 J.
Colloid Interface Sci, 205, 470.
[24] Hunter J.R., “Introduction to Modern Colloid Science”, Oxford Science
Publications (1992)
[26] Goya G. F., Berquó T. S., Fonseca F. C., and Morales M. P., 2003 J. Appl. Phys. 94
3520.
[25] R.E. Dunin-Borkowski, M.R. McCartney, R.B. Frankel, D.A. Bazylinski, M.
Posfai, and P.R. Buseck, 1998 Science 282, 1868.
[27] Cornell, RM; Schwertmann, U (2003). “The iron oxides: structure, properties,
reactions, occurrences and uses”. Wiley VCH. ISBN 3-527-30274-3.
[28] R. E. Rosensweig, 2002 J. Magn.Magn. Mater., 252 370.
[29] M. Lévy, C. Wilhelm, J-M Siaugue, O. Horner, J-C Bacri and F. Gazeau, 2008 J.
Phys.: Cond. Mat. 20 204133.
[30] M.P. Morales, M. El-Hilo, K. O‟Grady, 1995 J. Magn. Magn. Mater., 140-144,
2211.


