
Macrophage polarization to a unique phenotype drivenby B cells
Siew-Cheng Wong�1, Anne-Laure Puaux�1, Manesh Chittezhath1,
Irina Shalova1, Tasneem S. Kajiji1, Xiaojie Wang1, Jean-Pierre Abastado1,
Kong-Peng Lam2 and Subhra K. Biswas1
1 Singapore Immunology Network (SIgN), Agency for Science, Technology and Research
(A*STAR), Singapore2 Immunology Group, Bioprocessing Technology Institute (A*STAR), Singapore
Regulation of adaptive immunity by innate immune cells is widely accepted. Conversely,
adaptive immune cells can also regulate cells of the innate immune system. Here, we report
for the first time the essential role of B cells in regulating macrophage (M/) phenotype. In vitro
B cell/M/ co-culture experiments together with experiments in transgenic mice models for
B-cell deficiency or overexpression showed B1 cells to polarize M/ to a distinct phenotype.
This was characterized by downregulated TNF-a, IL-1b and CCL3, but upregulated IL-10 upon
LPS stimulation; constitutive expression of M2 M/ markers (e.g. Ym1, Fizz1) and over-
expression of TRIF-dependent cytokines (IFN-b, CCL5). Mechanistically, this phenotype was
linked to a defective NF-jB activation, but a functional TRIF/STAT1 pathway. B1-cell-derived
IL-10 was found to be instrumental in the polarization of these M/. Finally, in vivo relevance
of B1-cell-induced M/ polarization was confirmed using the B16 melanoma tumor model
where adoptive transfer of B1 cells induced an M2 polarization of tumor-associated M/.
Collectively, our results define a new mechanism of M/ polarization wherein B1 cells play a
key role in driving M/ to a unique, but M2-biased phenotype. Future studies along these lines
may lead to targeting of B1 cells to regulate M/ response in inflammation and cancer.
Key words: B1 cells . Inflammation . M/ . M2 polarization . Tumor
See accompanying Commentary by Sica et al.
Supporting Information available online
Introduction
Macrophages (Mf) are a heterogeneous cell population involved in
diverse physiological processes including anti-microbial defence,
wound resolution, inflammation, tissue remodeling, plaque forma-
tion in atherosclerosis and promotion of tumor growth [1–7].
Despite their heterogeneity, Mf can be broadly divided into M1
(classically activated) or M2 (alternatively activated) phenotypes
[1, 8–12]. The M1 phenotype is induced in response to microbial
products such as LPS or proinflammatory cytokines including
IFN-g, IL-1b or TNF-a. M1 Mf produce further proinflammatory
cytokines (TNF-a, IL-12 and CCL3) with reactive oxygen and
nitrogen intermediates, which combine to give M1 Mf potent anti-
microbial, tumoricidal and inflammatory properties [12]. In
contrast, the M2 phenotype results from exposure to anti-
inflammatory molecules such as glucocorticoid hormones, IL-4,
�These authors contributed equally to this work.Correspondence: Dr. Subhra K. Biswase-mail: [email protected]
& 2010 WILEY-VCH Verlag GmbH & Co. KGaA, Weinheim www.eji-journal.eu
DOI 10.1002/eji.200940288 Eur. J. Immunol. 2010. 40: 2296–2307Siew-Cheng Wong et al.2296
IL-13, IL-10 or immune complexes [10–12]. M2 Mf are anti-
inflammatory and immunosuppressive in nature. They are highly
phagocytic, preferentially activate the arginase pathway, promote
angiogenesis, tissue remodeling and have pro-tumoral activity [8,
12]. However, in vivo, the division between M1 and M2 cells may
be blurred, with the above phenotypes likely representing two
extremes in a continuum of Mf functional states [9, 13–15].
Transcriptome data demonstrate the existence of distinct
polarization phenotypes for Mf associated with specific patho-
logical conditions [4, 7, 16–18]. Based on this, it is believed that
the phenotype of an Mf is a reflection of its immediate micro-
environment. Indeed, several studies have shown that the tumor
microenvironment influences the infiltrating Mf to promote
tumor progression [4, 13]. This necessitates a detailed under-
standing of these cells, their microenvironmental stimuli and the
signaling pathways which shape their pro-tumoral phenotype.
Interestingly, de Visser et al. [19] demonstrated for the first time,
the requirement of B cells in mediating the recruitment of
inflammatory cells into pre-malignant skin and in neoplastic
progression, using a HPV16-induced mouse skin carcinoma
model. The study marks a seminal observation suggesting an
interaction between B cells and inflammatory immune cells
in vivo. This posed certain questions such as whether B cells
interact with Mf, do they influence Mf polarization and if so,
what is the molecular basis for such an interaction [20].
B cells also exist in two subsets with different tissue distributions,
phenotypes and functional properties [21]. B1 cells inhabit the gut
lamina propria, peritoneal and pleural cavities, whereas the
‘‘conventional’’ B2-cell subset mainly occurs in the spleen and lymph
nodes [22]. Phenotypically, B1 cells are characterized by a
B220loIgMhiCD11b1 staining pattern, whereas B2 cells are char-
acterized by a B220hiIgMloCD11b� surface expression profile. B1 cells
in fact appear to constitute a class of ‘‘tolerant’’ B cells. In contrast to
B2 cells, they fail to proliferate following engagement of their B-cell
antigen receptor [23, 24], exhibiting atypical downstream signaling
characterized by defective PLCg2, Akt, p38 MAPK and NF-kB acti-
vation [25]. Functionally, B1 cells contribute to protection against
microbes through release of natural polyvalent Ab in response
infection as well as those directed toward self-antigens [26].
In this study, we asked whether interactions between B cells and
Mf could contribute to Mf polarization. We employed in vitro B cell/
Mf co-cultures as well as transgenic mouse models that either lacked
B cells or overexpressed B1 cells. We uncovered a crucial role for B1
cells in polarizing Mf to a unique, M2-like phenotype, both in vitro
and in vivo. We also revealed the signaling mechanisms behind this
polarization and its relevance in a pathological setting.
Results
Absence of B cells induces an inflammatory phenotypein M/
To determine the role of B cells in Mf polarization, we compared
peritoneal Mf from B-cell-deficient mMT mice (mMT-Mf) [27]
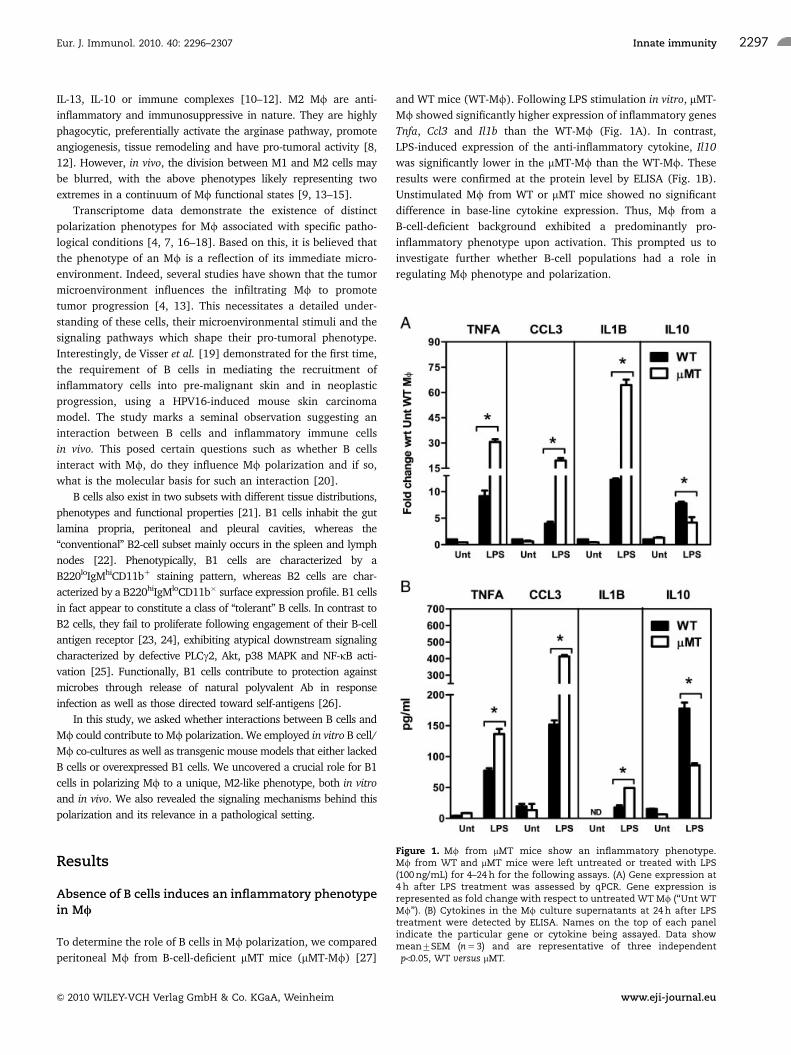
and WT mice (WT-Mf). Following LPS stimulation in vitro, mMT-
Mf showed significantly higher expression of inflammatory genes
Tnfa, Ccl3 and Il1b than the WT-Mf (Fig. 1A). In contrast,
LPS-induced expression of the anti-inflammatory cytokine, Il10
was significantly lower in the mMT-Mf than the WT-Mf. These
results were confirmed at the protein level by ELISA (Fig. 1B).
Unstimulated Mf from WT or mMT mice showed no significant
difference in base-line cytokine expression. Thus, Mf from a
B-cell-deficient background exhibited a predominantly pro-
inflammatory phenotype upon activation. This prompted us to
investigate further whether B-cell populations had a role in
regulating Mf phenotype and polarization.
Figure 1. Mf from mMT mice show an inflammatory phenotype.Mf from WT and mMT mice were left untreated or treated with LPS(100 ng/mL) for 4–24 h for the following assays. (A) Gene expression at4 h after LPS treatment was assessed by qPCR. Gene expression isrepresented as fold change with respect to untreated WT Mf (‘‘Unt WTMf’’). (B) Cytokines in the Mf culture supernatants at 24 h after LPStreatment were detected by ELISA. Names on the top of each panelindicate the particular gene or cytokine being assayed. Data showmean7SEM (n 5 3) and are representative of three independent�po0.05, WT versus mMT.
Eur. J. Immunol. 2010. 40: 2296–2307 Innate immunity 2297
& 2010 WILEY-VCH Verlag GmbH & Co. KGaA, Weinheim www.eji-journal.eu

B1 cells are responsible for M/ polarization in vitro
Next, we determined whether specific subsets of B cells, i.e. B1 or
B2 cells could influence the activation and polarization of Mfin vitro. WT-Mf were either cultured alone or in the presence of
B1 or B2 cells for 36 h. The B cells were then washed off and Mfwere cultured for an additional 4 h in the presence or absence of
LPS. Quantitative PCR (qPCR) analysis revealed that LPS-treated
Mf co-cultured with B1 cells expressed lower levels of
proinflammatory cytokine genes including Tnfa, Il1b and Ccl3,
but higher levels of the anti-inflammatory cytokine gene, Il10,
when compared with the LPS-treated Mf cultured alone
(Fig. 2A). In contrast, Mf co-cultured with B2 cells upon LPS
treatment did not show any appreciable difference in the
induction of the above cytokine/chemokine genes as compared
with LPS-treated Mf that were cultured alone. Mf co-cultured
with either B1 or B2 cells in the absence of LPS stimulation did
not exhibit any significant modulation in the basal expression of
cytokine/chemokine genes.
In all the above experiments, B1 cells were derived from VH12f
(VH12) transgenic mice which preferentially develop B1 cells ([28]
and Supporting Information Fig. 1). LPS response of Mf co-cultured
with B1 cells isolated from WT mice (Fig. 2B and C) showed a similar
cytokine profile to those co-cultured with B1 cells from the VH12
mice (Fig. 2A). These results reiterate that the distinct cytokine
expression profile of Mf co-cultured with B1 cells remained the same,
irrespective of whether B1 cells were derived from the WT or VH12
mice. Based on our data, it is clear that B1 cells can induce a distinct
polarization of Mf with respect to its cytokine/chemokine profile.
B1 cells in VH12 mice influence M/ phenotype in vivo
To investigate whether B1 cells could also induce polarization of Mfin vivo, we studied resident peritoneal Mf isolated from the VH12
transgenic mice which overexpress B1 cells. Peritoneal VH12-Mf and
WT-Mf were stimulated with LPS and assessed for the expression of
cytokines and chemokines. Supporting our in vitro findings, LPS-
stimulated VH12-Mf showed significantly lower expression of Tnfa,
Il1b and Ccl3 but significantly higher Il10, compared with WT-Mf(Fig. 3A, left panel). This trend was also confirmed at the protein
level by ELISA for IL-1b, CCL3 and IL-10 (Fig. 3A, right panel).
Furthermore, we observed that expression of Ifnb and the type I IFN-
inducible chemokines Ccl5 and Cxcl10 was significantly upregulated
in LPS-treated VH12-Mf compared with WT-Mf (Fig. 3B, left
panel), also confirmed by ELISA (Fig. 3B right panel).
LPS-induced transcription of genes such as Ifnb, Ccl5 and
Cxcl10 is mediated via the TLR4/TRIF-dependent pathway [29].
Based on the above data, we hypothesized that VH12-Mf might
be predisposed to more efficiently activate this pathway. Indeed,
stimulating these VH12-Mf with the TRIF pathway-specific acti-
vator, polyI:C did result in significantly higher Ccl5 and Cxcl10
expression compared with WT-Mf (Fig. 3C). In contrast,
expression of the MyD88-dependent gene, Tnfa was almost
twofolds lower in poly I:C-treated VH-Mf than WT cells.
Stimulation of Mf with the TLR2 ligand, Pam3Cys4 which
signals through MyD88 but not the TRIF pathway, showed no Ccl5
and Cxc10 expression in WT- or VH12-Mf. However, Pam3Cys4-
Figure 2. B1 cells induce Mf polarization in vitro. (A) Mf were culturedalone or with B1 or B2 cells (Mf:B cells at 1:2 ratio) for 36 h. B cells werethen washed off and Mf cultured for an additional 4 h either in thepresence or absence of LPS (100 ng/mL). RNA was extracted and geneexpression detected by qPCR. Mf cultured alone for 4 h in the presenceof LPS (100 ng/mL) was taken as the positive control for geneexpression. B1 cells were derived from VH12 mice whereas B2 cellsfrom WT mice. (B) Mf and B-cell co-culture experiment was performedas described above, but with B1 cells derived from WT mice. RNA wasextracted and gene expression was detected by qPCR. For (A) and (B),gene expression is represented as fold change with respect tountreated Mf (‘‘Unt Mf’’). (C) Cytokine levels in the supernatants ofMf and WT B1-cell co-cultures after 24 h LPS stimulation, determinedby ELISA. In all panels, names on the X-axis indicate the gene orcytokine being studied. Data show mean7SEM (n 5 3) and arerepresentative of three independent experiments. �po0.05, Mf1B11
LPS versus Mf1LPS.
Eur. J. Immunol. 2010. 40: 2296–2307Siew-Cheng Wong et al.2298
& 2010 WILEY-VCH Verlag GmbH & Co. KGaA, Weinheim www.eji-journal.eu
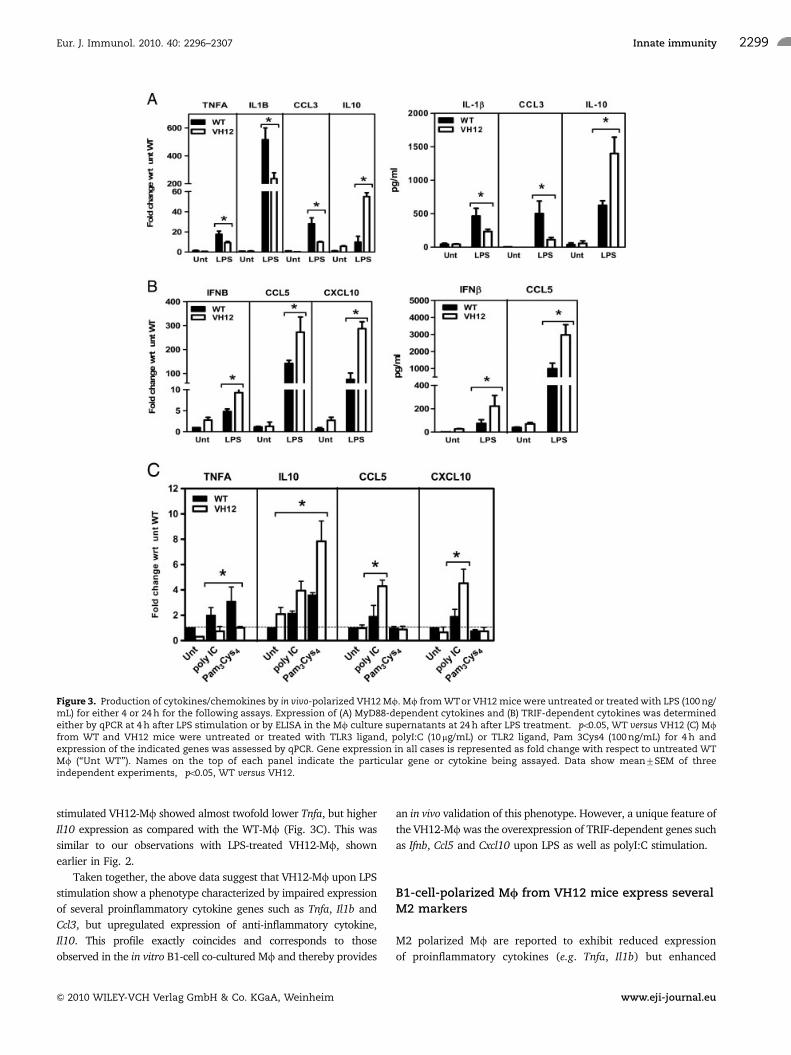
stimulated VH12-Mf showed almost twofold lower Tnfa, but higher
Il10 expression as compared with the WT-Mf (Fig. 3C). This was
similar to our observations with LPS-treated VH12-Mf, shown
earlier in Fig. 2.
Taken together, the above data suggest that VH12-Mf upon LPS
stimulation show a phenotype characterized by impaired expression
of several proinflammatory cytokine genes such as Tnfa, Il1b and
Ccl3, but upregulated expression of anti-inflammatory cytokine,
Il10. This profile exactly coincides and corresponds to those
observed in the in vitro B1-cell co-cultured Mf and thereby provides
an in vivo validation of this phenotype. However, a unique feature of
the VH12-Mf was the overexpression of TRIF-dependent genes such
as Ifnb, Ccl5 and Cxcl10 upon LPS as well as polyI:C stimulation.
B1-cell-polarized M/ from VH12 mice express severalM2 markers
M2 polarized Mf are reported to exhibit reduced expression
of proinflammatory cytokines (e.g. Tnfa, Il1b) but enhanced
Figure 3. Production of cytokines/chemokines by in vivo-polarized VH12 Mf. Mf from WTor VH12 mice were untreated or treated with LPS (100 ng/mL) for either 4 or 24 h for the following assays. Expression of (A) MyD88-dependent cytokines and (B) TRIF-dependent cytokines was determinedeither by qPCR at 4 h after LPS stimulation or by ELISA in the Mf culture supernatants at 24 h after LPS treatment. �po0.05, WT versus VH12 (C) Mffrom WT and VH12 mice were untreated or treated with TLR3 ligand, polyI:C (10 mg/mL) or TLR2 ligand, Pam 3Cys4 (100 ng/mL) for 4 h andexpression of the indicated genes was assessed by qPCR. Gene expression in all cases is represented as fold change with respect to untreated WTMf (‘‘Unt WT’’). Names on the top of each panel indicate the particular gene or cytokine being assayed. Data show mean7SEM of threeindependent experiments, �po0.05, WT versus VH12.
Eur. J. Immunol. 2010. 40: 2296–2307 Innate immunity 2299
& 2010 WILEY-VCH Verlag GmbH & Co. KGaA, Weinheim www.eji-journal.eu

expression of anti-inflammatory cytokines (e.g. Il10) [8, 12]. In
this respect, VH12-Mf (Fig. 3A) and WT-Mf co-cultured with B1
cells (Fig. 2) display an M2-like phenotype.
To understand the extent of M2 polarization in VH12-Mf, we
studied the expression of several well-known M2 markers. VH12-
Mf constitutively expressed elevated levels of some M2 genes
including Fizz1, Ym1, Msr2 (or Cd36) and Il1ra, in contrast to
WT-Mf (Fig. 4A). However, other M2 genes such as ArgII and
Ccl22 were not detected in either Mf population under basal
conditions. Immunofluorescence images confirmed the presence
of YM1 and FIZZ1 protein in VH12-Mf (Fig. 4B). Therefore,
alongside our cytokine expression results, these data confirm the
polarization of VH12-Mf toward a distinct M2-like phenotype.
B1-cell-polarized M/ exhibit defective NF-jB butfunctional STAT1 signaling
To determine the molecular basis of the altered phenotype of VH12-
Mf, we studied the kinetics of some key TLR4 signaling events,
namely MyD88-dependent activation of NF-kB and TRIF-dependent
activation of STAT1 [29, 30]. We measured the degradation of IkBaas an indicator of NF-kB activation and the expression of phospho-
STAT1 (Tyr 701) as a readout for TRIF pathway activation. Figure
5A shows significant IkBa degradation in WT-Mf following
30–60 min of LPS stimulation, but not in the LPS-treated VH12-
Mf. In contrast, VH12-Mf showed higher phospho-STAT1 (Tyr
701) expression following 15–30 min of LPS treatment, compared
with their WT counterparts (Fig. 5A). These observations indicate
defective NF-kB activation, but a functional STAT1 pathway in the
VH12-Mf, which correlates with our earlier gene expression data.
To exclude the possibility that the differential signaling pattern was
due to differences in the surface expression of TLR4, we also
measured TLR4 expression by flow cytometry. WT and VH12-Mfshowed comparable TLR4 surface expression (Fig. 5B).
IL-10 is responsible for B-cell-induced polarization ofM/
IL-10 polarizes Mf to an M2 phenotype [8]. Since B1 cells can
constitutively release this cytokine [31], we asked whether IL-10
was involved in our observed B1-cell-induced Mf polarization.
WT-Mf co-cultured with B1 cells in vitro expressed higher levels
of the IL-10-inducible Bcl3 and Socs3 under both basal- and LPS-
treated conditions (Fig. 5C, left panel). VH12-Mf also displayed
higher Bcl3 and Socs3 expression compared with WT-Mf under
LPS stimulated and unstimulated conditions (Fig. 5C, right
panel). Thus the interaction of Mf with B1 cells induced
upregulation of IL-10 inducible genes in the Mf.
IL-10-induced gene expression is primarily mediated by the
transcription factor STAT3 [32]. Therefore, we compared STAT3
activation in LPS-treated WT- and VH12-Mf. VH12-Mf showed
early expression of phospho-STAT3 (Ser 727) 15–60 min after
LPS treatment, whereas WT-Mf showed the same level of phos-
phorylation only 60 min after LPS stimulation (Fig. 5D), thus
suggesting a faster and preferential activation of STAT3 in
VH12-Mf.
To directly assess the role of IL-10, WT-Mf were co-cultured
with B1 cells in the presence or absence of IL-10 neutralizing Ab
for 36 h, followed by washing and stimulation with LPS for 4 h.
The addition of IL-10 neutralizing Ab to the B1 cell/Mf co-
culture induced an almost twofold increase in the suppressed
Tnfa expression observed in B1-cell-polarized Mf (Fig. 5E).
ELISA data for TNF-a production also confirmed this trend
(Fig. 5E, inset). Neutralizing IL-10 also substantially reduced
expression of the TRIF-dependent genes Ccl5 and Cxcl10 and the
M2-marker, Il1ra in Mf co-cultured with B1 cells (Fig. 5E).
Incubation with isotype-matched control Ab had no significant
effect (data not shown).
To further testify the role of B1-cell-derived IL-10 in
polarization of Mf, we performed experiments involving the
Figure 4. In vivo-polarized Mf from VH12 mice show a M2 phenotype. (A) Mf from WT or VH12 mice were analyzed for the expression of typicalM2 marker genes by qPCR. Black columns represent gene expression in VH12 Mf shown as fold change with respect to untreated WT Mf (‘‘Unt WTMf). Data show mean7SEM from three independent experiments, �po0.02, WT versus VH12. (B) Mf from WT or VH12 mice were grown on coverslips and labeled with fluorescent-tagged Ab recognizing the indicated M2-associated molecules. Fluorescence panel shows immunofluorescencefor the indicated molecules (blue), while the phase-contrast panel shows phase-contrast image of these cells overlayed with the respectivefluorescent stainings. All images were acquired on a Zeiss LSM 510 META confocal microscope. Results are representative of three independentexperiments.
Eur. J. Immunol. 2010. 40: 2296–2307Siew-Cheng Wong et al.2300
& 2010 WILEY-VCH Verlag GmbH & Co. KGaA, Weinheim www.eji-journal.eu

co-culture of WT-Mf with IL-10�/� B1 cells. WT-Mf co-cultured
with IL-10�/� B1 cells showed a marked reduction in
Il10 expression as compared with those co-cultured with WT B1
cells, upon LPA simulation (Fig. 5F, upper panel). Similarly,
expression of the TRIF-induced gene, Ccl5 as well as the M2 gene,
Il1ra was abrogated in Mf co-cultured with IL-10�/� B1 cells
instead of WT B1 cells (Fig. 5F middle and lower panel). This
observation provided genetic evidence for the requirement
of B1-cell-derived IL-10 in driving Il10 expression and polariza-
tion of Mf.
We also performed a reverse experiment where WT B1
cells were co-cultured with IL-10�/� Mf in order to assess the
relative contribution of Mf-derived IL-10 in their polarization.
Figure 5F (upper panel) confirms lack of Il10 transcript in the
IL-10�/� Mf, as expected. Figure 5F (middle and lower panels)
shows comparable Ccl5 and Il1ra expression between LPS-treated
WT-Mf and IL-10�/� Mf, following co-cultured with WT B1
cells. Similarly, no significant difference in the modulation of
other genes such as Tnfa or Ccl3 was noted between the
WT-Mf and the IL-10�/� Mf, when co-cultured with the WT B1
cells (data not shown). These observations undermine the
contribution of Mf-derived IL-10 in driving Mf polarization in
these co-culture experiments. On the contrary, the results from
the IL-10�/� B1-cell co-culture experiments clearly suggested
a crucial role for B1-cell-derived IL-10 in driving the polarization
of Mf.
B1-cell-derived IgM does not contribute to thepolarization of M/
B1 cells are efficient producers of IgM and Mf express Fcmreceptor, which serves as a receptor for this immunoglobulin. We
wanted to evaluate whether IgM released by B1 cells influenced
the M2 polarization of these Mf when co-cultured with B1 cells.
For this purpose, we treated WT-Mf in vitro with purified IgM
and subjected them to LPS or IL-4 treatment to induced M1 and
M2 polarization, respectively. Treatment of WT-Mf with IgM
alone induced a modest expression of the proinflammatory genes
such as Tnfa, Ccl3 and Il1b (Fig. 6A). However, on stimulation
with LPS, WT-Mf treated with or without IgM showed
similar expression of Tnfa, Ccl3 and Il1b suggesting that IgM
did not have any appreciable influence on the expression of M1
polarizing genes (Fig. 6A). Expression of Il10 was similar for IgM-
treated or untreated Mf under basal and LPS-stimulated
conditions. In contrast, when WT-Mf were treated with or
without IgM and subjected to IL-4-induced M2 polarization, the
expression of M2-genes YM1, FIZZ1 and MGL2 was significantly
inhibited in the IgM-treated Mf as compared with the Mf, which
did not receive IgM treatment (Fig. 6B). Il1ra expression
remained unaffected by the IgM treatment. Furthermore, Mftreated with IgM alone did not induce any significant modulation
in the expression of Ym1, Fizz1, Mgl2 and Il1ra (Fig. 6B).
Collectively, these results do not support a likely role for IgM in
driving M2 polarization in Mf.
B1 cells can polarize M/ in tumors
Several reports have shown tumor-associated Mf (TAM) to be
an M2-polarized population and to play a pro-tumoral role
[7, 9, 13]. Our results suggest B1 cells to polarize Mf into a M2-
like phenotype similar to that of fibrosarcoma-derived TAM [7].
We wanted to investigate whether B1 cells could also drive an
M2-like polarization of Mf in vivo in a tumor setting.
B16 cells were injected s.c. together with purified B1 cells or
control cells (consisting of splenic B2 cells, mainly). After 11
days, when the tumors became palpable, the experimental group
received intratumoral injection of B1 cells, whereas the control
group received control splenic B2 cells. On day 14, mice were
sacrificed, TAM were enumerated by flow cytometry and purified
to measure their polarization status following ex vivo stimulation
with the M1-stimulus, LPS or the M2 stimulus, IL-4.
We did not observe any significant difference in the absolute
numbers of TAM in the two groups of mice (Supporting Infor-
mation Fig. 2). However, LPS inducibility of the pro-inflamma-
tory genes Tnfa, Ccl3 and Il1b was significantly reduced in TAM
from B1-cell-treated tumors compared with TAM from the control
group (Fig. 7A). Cxcl10 and Ccl5 levels were comparable between
the groups (Fig. 7A). Notably, a dramatic upregulation of the M2
marker genes Ym1, Fizz1, Il1ra, Mgl1 and Mgl2 (basally and after
ex vivo treatment with IL-4) was observed in TAM from B1-cell-
treated tumors compared with TAM from the control group,
demonstrating their preferential M2-like phenotype (Fig. 7B).
Thus, our results show that B1-cell transfer could indeed induce
an M2-like polarization of Mf in vivo in a tumor setting.
We also performed an additional experiment where B16
tumors were grown either in WT mice or in B-cell-deficient mMT
mice. As compared with TAM from WT mice, those from the mMT
mice showed higher expression of the proinflammatory genes
Tnfa, Il1b and Ccl3 but downregulated expression of Il10,
upon LPS stimulation, which suggested their predominantly
M1 phenotype, in the absence of B cells (Supporting Information
Fig. 3).
Discussion
The concept of Mf polarization [8–12] and the use of gene
expression profiling to characterize in vitro-polarized Mf have
been reported in several studies [8, 33, 34]. However, relatively
little is known about Mf polarization in vivo and in particular,
how interaction with other immune cell types contributes to
modulation of Mf phenotypes.
Although the role of innate immune cells in polarizing the
adaptive immune response is well established [8], the potential of
cells of adaptive immunity to polarize innate immune cells is less
known. Our current observation of B-cell-driven polarization of
Mf both in vitro and in vivo raises such a possibility. Our initial
observation that peritoneal Mf from B-cell-deficient mMT mice
showed higher inflammatory responses to LPS stimulation than
their WT counterparts triggered our interest in investigating
Eur. J. Immunol. 2010. 40: 2296–2307 Innate immunity 2301
& 2010 WILEY-VCH Verlag GmbH & Co. KGaA, Weinheim www.eji-journal.eu

Figure 5. Molecular phenotype of B1-polarized Mf. (A) Mf from WT or VH12 mice were stimulated for indicated time periods with LPS (100 ng/mL)and assayed for the expression of signaling molecules by Western blotting. Actin and STAT1 expression serve as loading controls (B) TLR4expression gated on F4/80-positive Mf from WT and VH12 mice. (C) Expression of IL-10-inducible genes Bcl3 and Soc3 in WT Mf/B1 cell co-cultures(left panel) or in Mf from WT and VH12 mice (right panel), under unstimulated or 4 h LPS (100 ng/mL) stimulated conditions. qPCR expression ofthe indicated genes is shown. �po0.05, Mf1LPS versus Mf1B11LPS; ��po0.05, Mf versus B11Mf; �po0.05, WT1LPS versus VH121LPS; ��po0.05 WTversus VH12 (D) Immunoblot showing STAT3 activation in WT and VH12 Mf treated with 100 ng/mL LPS for indicated time points. Equal loading isshown by STAT3 expression. (E) IL-10-neutralization in WT Mf/B1 cell co-culture experiments. Mf were cultured alone or with B1 cells in thepresence or absence of anti-IL-10 neutralizing Ab (4 mg/mL, indicated by ‘‘Ab’’). Expression of selected cytokine genes following an additional 4 h LPS(100 ng/mL) stimulation of these Mf is shown. Inset shows ELISA data for TNF-a production in the above experiment. (F) LPS-induced expression ofthe indicated genes in WT-Mf co-cultured with WT or IL-10�/� B1 cells. Expression of these genes is also shown from IL-10�/�Mf co-cultured withWT B1 cells. Gene expression data shown in (C), (E) and (F) are represented as fold change with respect to untreated WT Mf (‘‘Unt Mf’’). �po0.05with respect to WT-Mf1LPS; ��po0.05 with respect to WT-Mf1WT B1 cells1LPS. Gene expression data shown in (C), (E) and (F) are represented asfold change with respect to untreated WT Mf (‘‘Unt Mf’’).
Eur. J. Immunol. 2010. 40: 2296–2307Siew-Cheng Wong et al.2302
& 2010 WILEY-VCH Verlag GmbH & Co. KGaA, Weinheim www.eji-journal.eu

whether B cells had a role in modulating Mf polarization
(Fig. 1). We demonstrated that B1 cells but not B2 cells, co-
cultured with peritoneal Mf polarized them to a phenotype
characterized by impaired expression of LPS-induced pro-
inflammatory genes (e.g. Tnfa, Ccl3 and Il1b), with upregulation
of the anti-inflammatory gene Il10 (Fig. 2). This phenotype was
also observed in peritoneal Mf from VH12 mice, which prefer-
entially develop B1 cells, suggesting an in vivo polarization of Mfby B1 cells (Fig. 3). Mf isolated from the spleen of VH12 mice,
but not those derived from the bone marrow, exhibited a similar
phenotype, indicating that this phenomenon was restricted to
those anatomical compartments where B cells and Mf co-exist
(e.g. peritoneum and spleen) (Supporting Information Fig. 5).
Detailed characterization of the in vivo-polarized VH12-Mfrevealed their M2-like phenotype. This was evident from their
defective expression of proinflammatory genes, with high
expression of the anti-inflammatory gene Il10 (Fig. 2) and M2
markers like Ym1, Fizz1, Msr2 and Il1ra (Fig. 4). However,
another unique feature of the VH12-Mf phenotype was the
upregulation of Ifnb expression and IFN-inducible genes such as
Ccl5, Cxcl10 (Fig. 3). This phenotype is similar to that of TAM
from a murine fibrosarcoma model, reported earlier [7]. In this
Figure 6. Expression of M1 and M2 polarization genes in IgM-treatedMf. Mf from WT mice were treated with purified mouse IgM (5 mg/mL)and either left alone or polarized to M1 and M2 states using LPS(100 ng/mL) and IL-4 (10 ng/mL) treatments, respectively. Cells werelysed at 4 h after the treatments and RNA used for qPCR for theexpression of typical (A) M1 and (B) M2 polarization genes. Gene namesare indicated on the top of each panel. Gene expression is representedas fold change with respect to untreated Mf (‘‘Unt Mf’’). Data showmean7SEM from three independent experiments. �po0.05, Mf1IL-4versus Mf1IgM1IL-4.
Figure 7. B1-cell-induced polarization of TAM. (A) qPCR analysis ofproinflammatory genes in ex vivo LPS (100 ng/mL)-stimulated TAMfrom control cell or B1-cell-treated B16 melanoma at day 14. Datarepresent LPS inducibility of the indicated genes expressed as foldchange. Gene names are indicated on the top of each panel. �po0.05,LPS-treated TAM from B161B1 cells treatment group versus LPS-treatedTAM from B161 control cells treatment group, Mann–Whitney U-test;(B) qPCR analysis of M2-specific genes in ex vivo IL-4 (10 ng/mL)-stimulated TAM isolated from the tumors indicated in (A). Geneexpression is presented as fold change with respect to control (i.e.untreated TAM from B161 control cell treatment group). Gene namesare indicated on the top of each panel. Unt: untreated TAM; IL-4: IL-4-treated TAM. ] po0.03, IL-4-treated TAM from B161B1 cell treatmentgroup versus IL-4-treated TAM from B161 control cell treatment group,Mann–Whitney U-test. Data show mean7SEM of three independentexperiments.
Eur. J. Immunol. 2010. 40: 2296–2307 Innate immunity 2303
& 2010 WILEY-VCH Verlag GmbH & Co. KGaA, Weinheim www.eji-journal.eu

study, the molecular basis of the M2-like TAM phenotype was
correlated to a defective NF-kB but a functional TRIF/STAT1
pathway [7]. Similarly, VH12-Mf also possessed a defective
NF-kB activation, but a functional TRIF/STAT1 pathway
(Fig. 5). This molecular phenotype explains their defective
proinflammatory gene expression and overexpression of IFN-
inducible genes (e.g. Ccl5 and Cxcl10). The co-expression of IL-10
and IFN-inducible chemokines in VH12-Mf may result from
enhanced TRIF signaling that has been recently implicated in
the regulation of IL-10 expression through IFN-b and TRAF3
[35, 36]. However, further molecular characterization would be
needed to clarify this point.
The significance of our observation on B1-cell-induced
polarization of Mf is particularly interesting in the context of the
recent findings by Coussens and colleagues [19, 37]. Using a K14-
HPV16 mouse model of epithelial carcinogenesis, these authors
show that B cells drive malignant progression by regulating the
recruitment, composition and pro-tumoral properties of circu-
lating and resident leukocytes (such as mast cells, dendritic cells
and Mf). These effects were mediated through the activation of
Fcg receptors (FcgR) on the myeloid cells by IgG [37]. Although
Mf play a key role in tumor progression, the molecular pathways
which regulate their tumor promoting properties are not well
understood [4, 5, 9, 13, 38, 39]. In this context, evidence of
B cells regulating Mf recruitment and their function in tumors
present an intriguing perspective. In our B16 melanoma mouse
model, the presence of both Mf and B1 cells was observed in the
tumors (Supporting Information Fig. 2). Interestingly, intra-
tumoral injection of B1 cells polarized the TAM to a more M2-like
phenotype. These TAM were characterized by significantly
downregulated expression of M1 genes Tnfa, Ccl3 and Il1b, but
higher levels of well-known M2 markers Ym1, Fizz1, Il1ra, Mgl1
and Mgl2, upon stimulation with M1 or M2 stimuli, respectively
(Fig. 7). Consistent with the pro-tumoral role of M2-polarized
TAM [9, 13], we also investigated whether there were any
differences in the tumor growth between the B1-cell-injected and
the control tumors. Preliminary observation show a trend toward
increased tumor growth for the B1-cell-injected tumors,
compared with the control group, although not statistically
significant when seen in a limited temporal window (Supporting
Information Fig. 4B). A role for B cells in B16 melanoma model is
further supported by the studies of Perricone et al. [40]
where they show enhanced efficacy of melanoma vaccines in the
mMT mice lacking B cells. Similarly, B cells may also play a
role in human breast cancer progression, where the presence of
infiltrating plasma cells was linked to poor prognosis [41]. Our
data from the B16 melanoma study extend the paradigm
of B1-cell-induced polarization of Mf in vivo to tumor settings.
These observations are the first to implicate a specific B-cell
subset (i.e. B1 cells) in driving the M2 polarization of TAM.
Further investigation is needed to clarify how these cells modu-
late various aspects of TAM function in experimental tumor
models.
Finally, our investigations into the mechanistic basis of B1-
cell-induced Mf polarization showed the crucial role of B1-cell-
derived IL-10. This was evident from (i) the overexpression of
IL-10-inducible genes such as Socs3 and Bcl3 in WT-Mfco-cultured with B1 cells as well as VH12-Mf, (ii) the activation
of STAT3 (required for IL-10R signaling) in VH12-Mf,
(iii) the ability of IL-10 neutralizing Ab to reverse B1-cell-induced
polarization of WT-Mf in the co-culture experiments and
(iv) the ability of B1 cells to constitutively release IL-10 [31]. In
addition, given that IL-10 is produced constitutively by
B1 cells as well as by B1-cell-polarized Mf, we determined the
relative contribution of these two sources of IL-10 in the
modulation of Mf functions. Results from our Mf co-culture
experiments with IL-10�/� B1 cells demonstrated a direct role
of B1-cell-derived IL-10 in promoting IL10 expression by
Mf and their consequent M2 polarization (Fig. 5F). The role of
IL-10 in polarizing Mf to an M2 phenotype is well documented in
diverse in vivo settings, including a number of tumors such as
chemically induced fibrosarcoma [7] and Lewis lung carcinoma
[42]. But, the role of B cells in inducing this process and the
unique M2-like phenotype described here has not been reported
previously.
Other mechanisms for B1-cell-induced Mf polarization may
exist. Mantovani [20] hypothesized that IgG immune complexes
released by B cells could possibly induce the M2-polarization of
Mf in the tumors. This concept was recently validated in a mouse
squamous carcinoma model, where B-cell-derived autoAb (e.g.
IgG) activate FcgR on TAM to mediate their pro-tumoral and M2-
like polarization [37]. Similarly, mouse Mf and human mono-
cytes activated by LPS in the presence of immune complexes
display an immunosuppressive phenotype [11, 33], similar to
that of the TAM from fibrosarcoma [7] and our B1-cell-polarized
Mf. However, it is important to note that B1 cells predominantly
release multivalent IgM which do not bind to the FcgR. Instead,
IgM bind to the Fcm receptor also expressed on Mf [43, 44].
Therefore, we investigated whether B1-cell-derived IgM could
induce M2 polarization of Mf. IgM treatment failed to show any
modulation in the M1 polarization of Mf (Fig. 6A). In fact,
IgM-treated Mf showed marked downregulation of many
M2 genes such as Ym1, Fizz1 and Mgl2 when they were polarized
to a M2 phenotype (Fig. 6B). These results do not support a
likely role for IgM in mediating the B1-cell-induced polarization
of Mf.
In conclusion, our study demonstrates for the first time the
ability of B1 cells to polarize Mf to a unique, but
M2-like phenotype both in vitro and in vivo. Furthermore, we
demonstrate that this paradigm is operative in vivo in
pathological settings like tumors, where B1 cells skewed TAM
toward a pro-tumoral M2-like phenotype. However, future
studies need to be carried out to clarify the relevance and
mechanism of B-cell-mediated regulation of Mf response in other
pathological conditions. If proven, this could lead to the targeting
of B cells as a means for therapeutic intervention in such disease
conditions. In support, Perricone et al. [40] suggest a therapeutic
regimen with depletion of B-lymphocytes that may be beneficial
to cancer vaccine therapy, in their preclinical B16 melanoma
study.
Eur. J. Immunol. 2010. 40: 2296–2307Siew-Cheng Wong et al.2304
& 2010 WILEY-VCH Verlag GmbH & Co. KGaA, Weinheim www.eji-journal.eu

Materials and methods
Reagents
All murine cells were cultured in DMEM (GIBCO Life
Technologies, NY, USA) containing 4500 mg/L D-glucose and
L-glutamine without sodium pyruvate and sodium bicarbonate.
Medium was supplemented with 10% fetal bovine serum
(HyClone, UT) and 100U/mL penicillin–streptomycin. The
following reagents were used for cell treatment: LPS from
Escherichia coli 055:B5 (Sigma, St. Louis, MO, USA), anti-IL-10
neutralizing Ab (Pierce-Endogen), purified mouse IgMk (Bethyl
Laboratories, TX, USA) and recombinant human IL-4 (Peprotech,
UK).
Mice
C57BL/6, mMT, IL-10-deficient (IL-10�/�) and CD45.1 mice
were obtained from Jackson Laboratory, NE, USA, and main-
tained in our animal facility. BALB/c and VH12f transgenic mice
[28] were maintained in our animal facility. All mice used
were between 6 and 8 wk of age and in accordance with
the institutional guidelines as well as approved protocol by
the IACUC committee, Biological Resource Center (A�STAR),
Singapore.
Purification and isolation of B cells
To obtain a pure population of B1 cells, peritoneal cavity washout
of VH12f (VH12) mice was seeded onto a tissue culture dish for
2–3 h to remove adherent Mf. Thereafter, the nonadherent cells
were retrieved and checked for purity using flow cytometry. More
than 90% of these cells were peritoneal B1 cells, characterized by
a B220loIgMhi staining pattern. In some specific experiments (as
indicated in the Results section), B1 cells were also isolated from
WT and IL-10�/�mice according to the protocol described above.
B2 cells were isolated from splenocytes of WT mice by MACS,
using negative selection with anti-CD43 microbeads (Miltenyl
Biotech, Germany). The purity of B2 cells obtained was 485% as
assessed by flow cytometry analysis. They were characterized by
a B220hiIgMlo staining.
Preparation of peritoneal M/
Peritoneal exudate cells were harvested from WT, VH12 mMT
or IL-10�/� mice and peritoneal Mf purified according
to the protocol described earlier [7]. Monolayers were 495%
Mf, assessed by labeling with Ab against CD11b and
F4/80 antigen and analyzed by flow cytometry. Unless
mentioned, all Mf experiments were performed with resident
peritoneal Mf.
B16 melanoma model and the isolation of tumor-associated M/
Mice were inoculated s.c. in the left- and right-hind flanks with a total
of 1� 105 B16 melanoma cells expressing luciferase (Xenogen, CA,
USA). Tumor take was monitored by bioluminiscence imaging using
an Ivis Spectrum device (Xenogen) as well as by caliper measure-
ments over 14 days. Cell transfer experiments were performed on
two mice groups viz. (i) control group were treated with control cells
(i.e. mainly splenic B2 cells) and (ii) experimental group were treated
with B1 cells according to the regime indicated below. Briefly,
1.5�105 control cells or B1 cells from CD45.1 transgenic mice were
co-injected s.c. with tumor cells on day 0, followed by another
injection of 0.5�105 cells intratumorally on day 11 (Supporting
Information Fig. 4A). Solid tumors were disaggregated with 0.3%
w/v collagenase (i.e. 1mg/mL collagenase A10.1mg/mL DNase I,
Roche, Switzerland) in serum-free medium for 30min at 371C, and
TAM were extracted as described earlier [7]. Purity and phenotype of
infiltrating TAM and B cells were assessed by flow cytometry using
F4/80/CD11b and CD19/B220/IgM/CD45.1 staining, respectively.
qPCR
Cells were lysed with Trizol (Life Technologies, Invitrogen) and
total RNA was prepared according to the manufacturer’s
instructions. Total RNA (1 mg) was reverse transcribed and used
for qPCR analysis on a ABI-PRISM 7500 detection System
(PerkinElmer, Norwalk, CT, USA) as described earlier [7].
ELISA
Cell-free supernatants from untreated or LPS (100ng/mL)-
treated cells were tested for the indicated cytokines/chemokines
(TNF-a, IL-1b, IL-10, CCL5 (QuantiKine Kits, R&D Systems
Minneapolis, MN, USA); IFN-b and CCL3 (RayBios Mouse ELISA
kits, RayBiotech, GA)) using ELISA Kits according to the
manufacturers’ instructions.
Immunoblotting
Mf from WT and VH12 mice were treated as indicated in the Results
section and protein extracts were prepared for immunoblotting as
described earlier [7]. The following Ab were used for immunoblots:
anti-phospho-STAT1(Tyr701) and anti-phospho-STAT3(Ser727)
from Cell Signaling Technology, MA, USA; anti-IkBa, anti-STAT1
and anti-STAT3 from Santa Cruz Biotechnologies, CA.
Flow cytometry
Cells were stained with the indicated fluorochrome-conjugated Ab
for 30min on ice. After washing in phosphate-buffered saline
Eur. J. Immunol. 2010. 40: 2296–2307 Innate immunity 2305
& 2010 WILEY-VCH Verlag GmbH & Co. KGaA, Weinheim www.eji-journal.eu

containing 3% fetal bovine serum and 0.01% NaN3, the cells were
analyzed on a FACSAria (Becton Dickinson, CA, USA) using Diva and
FlowJo Software. The following Ab used in flow cytometric analyses
were obtained from eBioscience (San Diego, CA, USA): anti-IgM
(R6-60.2), anti-B220 (RA3-6B2), anti-CD45.1, anti-CD11b, anti-
CD19 and anti-F4/80. Anti-TLR4 PE-conjugated Ab and all isotype-
matched Ab were purchased from BD Biosciences, San Diego, CA,
USA.
Immunocytochemistry
Immunocytochemistry was performed according to the protocol
described earlier [7]. Peritoneal Mf from WT and VH12 mice were
grown on coverslips and stained with rabbit anti-mouse Ym1 and
Fizz 1, followed by Alexa-405 conjugated anti-rabbit Ab. Slides were
then visualized on a Zeiss LSM 510 META confocal microscope.
Ym1 and Fizz1 Ab were kind gifts from Professor J. E. Allen, School
of Biological Sciences, University of Edinburgh, UK.
Statistical analysis
We used a two-tailed unpaired t-test for statistical comparisons
for most of the experiments. However, for those experiments
where Mann–Whitney U-test was used to compare group data,
and this is indicated in the figure legends. In all cases differences
were considered to be significant when po0.05.
Acknowledgements: This study was supported by funding from
Biomedical Research Council, Agency for Science, Technology and
Research (A�STAR), Singapore. We are grateful to Dr. Veronique
Angeli (Department of Microbiology, National University of
Singapore) for her edits and critical comments. We thank Dr. Jo
Eyles and Dr. Lucy Robinson (Singapore Immunology Network,
A*STAR) for their help in editing this manuscript.
Conflict of interest: The authors declare no financial or
commercial conflict of interest.
References
1 Goerdt, S. and Orfanos, C. E., Other functions, other genes: alternative
activation of antigen-presenting cells. Immunity 1999. 10: 137–142.
2 Li, A. C. and Glass, C. K., The macrophage foam cell as a target for
therapeutic intervention. Nat. Med. 2002. 8: 1235–1242.
3 Mantovani, A., Schioppa, T., Biswas, S. K., Marchesi, F., Allavena, P. and
Sica, A., Tumor-associated macrophages and dendritic cells as prototypic
type II polarized myeloid populations. Tumori 2003. 89: 459–468.
4 Lewis, C. E. and Pollard, J. W., Distinct role of macrophages in different
tumor microenvironments. Cancer Res. 2006. 66: 605–612.
5 Pollard, J. W., Tumour-educated macrophages promote tumour progres-
sion and metastasis. Nat. Rev. Cancer 2004. 4: 71–78.
6 Karin, M., Lawrence, T. and Nizet, V., Innate immunity gone awry: linking
microbial infections to chronic inflammation and cancer. Cell 2006. 124:
823–835.
7 Biswas, S. K., Gangi, L., Paul, S., Schioppa, T., Saccani, A., Sironi, M.,
Bottazzi, B. et al., A distinct and unique transcriptional program
expressed by tumor-associated macrophages (defective NF-kappaB and
enhanced IRF-3/STAT1 activation). Blood 2006. 107: 2112–2122.
8 Mantovani, A., Sica, A., Sozzani, S., Allavena, P., Vecchi, A. and Locati, M.,
The chemokine system in diverse forms of macrophage activation and
polarization. Trends Immunol. 2004. 25: 677–686.
9 Mantovani, A., Sozzani, S., Locati, M., Allavena, P. and Sica, A., Macrophage
polarization: tumor-associated macrophages as a paradigm for polarized M2
mononuclear phagocytes. Trends Immunol. 2002. 23: 549–555.
10 Gordon, S., Alternative activation of macrophages. Nat. Rev. Immunol.
2003. 3: 23–35.
11 Anderson, C. F. and Mosser, D. M., A novel phenotype for an activated
macrophage: the type 2 activated macrophage. J. Leukoc. Biol. 2002. 72:
101–106.
12 Mantovani, A., Sica, A. and Locati, M., Macrophage polarization comes of
age. Immunity 2005. 23: 344–346.
13 Biswas, S. K., Sica, A. and Lewis, C. E., Plasticity of macrophage function
during tumor progression: regulation by distinct molecular mechanisms.
J. Immunol. 2008. 180: 2011–2017.
14 Stout, R. D. and Suttles, J., Functional plasticity of macrophages:
reversible adaptation to changing microenvironments. J. Leukoc. Biol.
2004. 76: 509–513.
15 Van Ginderachter, J. A., Movahedi, K., Hassanzadeh Ghassabeh, G.,
Meerschaut, S., Beschin, A., Raes, G. and De Baetselier, P., Classical and
alternative activation of mononuclear phagocytes: picking the best of
both worlds for tumor promotion. Immunobiology 2006. 211: 487–501.
16 Loke, P., Nair, M. G., Parkinson, J., Guiliano, D., Blaxter, M. and Allen, J. E.,
IL-4 dependent alternatively activated macrophages have a distinctive
in vivo gene expression phenotype. Biomed. Chromatogr. Immunol.
2002. 3: 7.
17 Hassanzadeh Ghassabeh, G., De Baetselier, P., Brys, L., Noel, W., Van
Ginderachter, J. A., Meerschaut, S., Beschin, A. et al., Identification of a
common gene signature for type II cytokine-associated myeloid cells
elicited in vivo during different pathologies. Blood 2006. 108: 575–583.
18 Noel, W., Raes, G., Hassanzadeh Ghassabeh, G., De Baetselier, P. and
Beschin, A., Alternatively activated macrophages during parasite infec-
tions. Trends Parasitol. 2004. 20: 126–133.
19 de Visser, K. E., Korets, L. V. and Coussens, L. M., De novo carcinogenesis
promoted by chronic inflammation is B lymphocyte dependent. Cancer
Cell 2005. 7: 411–423.
20 Mantovani, A., Cancer: inflammation by remote control. Nature 2005. 435:
752–753.
21 Kipps, T. J., The CD5 B cell. Adv. Immunol. 1989. 47: 117–185.
22 Montecino-Rodriguez, E. and Dorshkind, K., New perspectives in B-1 B
cell development and function. Trends Immunol. 2006. 27: 428–433.
23 Rothstein, T. L. and Kolber, D. L., Peritoneal B cells respond to phorbol
esters in the absence of co-mitogen. J. Immunol. 1988. 140: 2880–2885.
24 Rothstein, T. L. and Kolber, D. L., Anti-Ig antibody inhibits the phorbol
ester-induced stimulation of peritoneal B cells. J. Immunol. 1988. 141:
4089–4093.
Eur. J. Immunol. 2010. 40: 2296–2307Siew-Cheng Wong et al.2306
& 2010 WILEY-VCH Verlag GmbH & Co. KGaA, Weinheim www.eji-journal.eu

25 Wong, S. C., Chew, W. K., Tan, J. E., Melendez, A. J., Francis, F. and Lam,
K. P., Peritoneal CD51B-1 cells have signaling properties similar to
tolerant B cells. J. Biol. Chem. 2002. 277: 30707–30715.
26 Alugupalli, K. R. and Gerstein, R. M., Divide and conquer: division of labor
by B-1 B cells. Immunity 2005. 23: 1–2.
27 Hasan, M., Polic, B., Bralic, M., Jonjic, S. and Rajewsky, K., Incomplete
block of B cell development and immunoglobulin production in mice
carrying the muMT mutation on the BALB/c background. Eur. J. Immunol.
2002. 32: 3463–3471.
28 Lam, K. P. and Rajewsky, K., B cell antigen receptor specificity and surface
density together determine B-1 versus B-2 cell development. J. Exp. Med.
1999. 190: 471–477.
29 Kawai, T., Takeuchi, O., Fujita, T., Inoue, J., Muhlradt, P. F., Sato, S.,
Hoshino, K. and Akira, S., Lipopolysaccharide stimulates the MyD88-
independent pathway and results in activation of IFN-regulatory factor 3
and the expression of a subset of lipopolysaccharide-inducible genes.
J. Immunol. 2001. 167: 5887–5894.
30 Yamamoto, M., Sato, S., Hemmi, H., Hoshino, K., Kaisho, T., Sanjo, H.,
Takeuchi, O. et al., Role of adaptor TRIF in the MyD88-independent toll-
like receptor signaling pathway. Science 2003. 301: 640–643.
31 Gary-Gouy, H., Harriague, J., Bismuth, G., Platzer, C., Schmitt, C. and
Dalloul, A. H., Human CD5 promotes B-cell survival through stimulation
of autocrine IL-10 production. Blood 2002. 100: 4537–4543.
32 Murray, P. J., Understanding and exploiting the endogenous interleukin-
10/STAT3-mediated anti-inflammatory response. Curr. Opin. Pharmacol.
2006. 6: 379–386.
33 Sironi, M., Martinez, F. O., D’Ambrosio, D., Gattorno, M., Polentarutti, N.,
Locati, M., Gregorio, A. et al., Differential regulation of chemokine
production by Fcgamma receptor engagement in human monocytes:
association of CCL1 with a distinct form of M2 monocyte activation (M2b,
Type 2). J. Leukoc. Biol. 2006. 80: 342–349.
34 Martinez, F. O., Gordon, S., Locati, M. and Mantovani, A., Transcriptional
profiling of the human monocyte-to-macrophage differentiation and
polarization: new molecules and patterns of gene expression. J. Immunol.
2006. 177: 7303–7311.
35 Hacker, H., Redecke, V., Blagoev, B., Kratchmarova, I., Hsu, L. C., Wang, G. G.,
Kamps, M. P. et al., Specificity in Toll-like receptor signalling through distinct
effector functions of TRAF3 and TRAF6. Nature 2006. 439: 204–207.
36 Chang, E. Y., Guo, B., Doyle, S. E. and Cheng, G., Cutting edge: involvement
of the type I IFN production and signaling pathway in lipopolysaccharide-
induced IL-10 production. J. Immunol. 2007. 178: 6705–6709.
37 Andreu, P., Johansson, M., Affara, N. I., Pucci, F., Tan, T., Junankar, S.,
Korets, L. et al., FcRgamma activation regulates inflammation-associated
squamous carcinogenesis. Cancer Cell 2010. 17: 121–134.
38 Mantovani, A., Allavena, P., Sica, A. and Balkwill, F., Cancer-related
inflammation. Nature 2008. 454: 436–444.
39 Sica, A. and Bronte, V., Altered macrophage differentiation and
immune dysfunction in tumor development. J. Clin. Invest. 2007. 117:
1155–1166.
40 Perricone, M. A., Smith, K. A., Claussen, K. A., Plog, M. S., Hempel, D. M.,
Roberts, B. L., St George, J. A. and Kaplan, J. M., Enhanced efficacy of
melanoma vaccines in the absence of B lymphocytes. J. Immunother. 2004.
27: 273–281.
41 Parkes, H., Collis, P., Baildam, A., Ralphs, D., Lyons, B., Howell, A. and
Craig, R., In situ hybridisation and S1 mapping show that the presence of
infiltrating plasma cells is associated with poor prognosis in breast
cancer. Br. J. Cancer 1988. 58: 715–722.
42 Watkins, S. K., Egilmez, N. K., Suttles, J. and Stout, R. D., IL-12
rapidly alters the functional profile of tumor-associated and tumor-
infiltrating macrophages in vitro and in vivo. J. Immunol. 2007. 178:
1357–1362.
43 Sakamoto, N., Shibuya, K., Shimizu, Y., Yotsumoto, K., Miyabayashi, T.,
Sakano, S., Tsuji, T. et al., A novel Fc receptor for IgA and IgM is expressed
on both hematopoietic and non-hematopoietic tissues. Eur. J. Immunol.
2001. 31: 1310–1316.
44 Shibuya, A., Sakamoto, N., Shimizu, Y., Shibuya, K., Osawa, M.,
Hiroyama, T., Eyre, H. J. et al., Fc alpha/mu receptor mediates endocytosis
of IgM-coated microbes. Nat. Immunol. 2000. 1: 441–446.
Abbreviations: lMT-M/: Mf from B-cell-deficient mMT mice � FccR: Fcgreceptors � qPCR: quantitative PCR � TAM: tumor-associated Mf
Full correspondence: Dr. Subhra K. Biswas, Singapore Immunology
Network (SIgN), Agency for Science, Technology and Research
(A*STAR), 8A Biomedical Grove, ]04 Immunos, Singapore 138648,
Singapore
Fax: 165-64642057
e-mail: [email protected]
See accompanying Commentary:
http://dx.doi.org/10.1002/eji.201040736
Received: 24/12/2009
Revised: 13/4/2010
Accepted: 4/5/2010
Accepted article online: 12/5/2010
Eur. J. Immunol. 2010. 40: 2296–2307 Innate immunity 2307
& 2010 WILEY-VCH Verlag GmbH & Co. KGaA, Weinheim www.eji-journal.eu


