Shake And Bake
BY:GPS Group
M. Demirdjian, B. Mckenzie, D. Perera, J. Reschke, D. Rodriguez, C. Sandoval, A.
Siripaisan, K. Vargas, J. Ying
“ShakeOut Scenario”


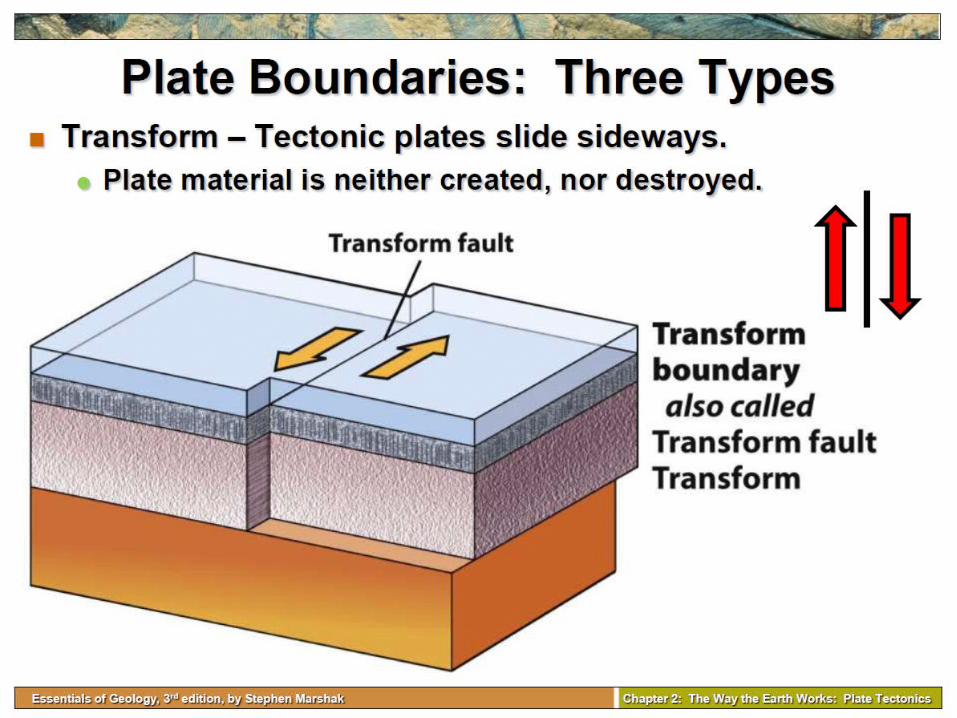
Plate Tectonics


History of San Andreas Earthquakes
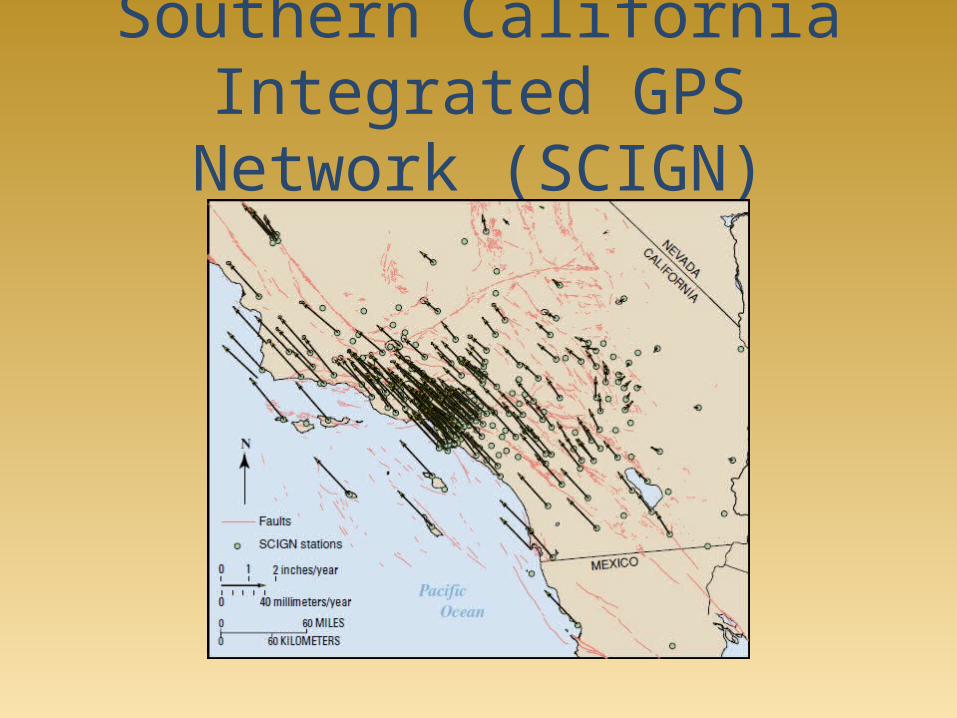
Southern California Integrated GPS Network
(SCIGN)

North GPS Data
1/6/2
004
6/15/2
004
11/23/2
004
5/3/2
005
10/11/2
005
3/21/2
006
8/29/2
006
2/6/2
007
7/17/2
007
12/25/2
007
6/3/2
008
11/11/2
008
4/21/2
009
9/29/2
009
3/9/2
010
8/17/2
010
1/25/2
011
-20
-15
-10
-5
0
5
10
15
20
f(x) = 0.0100398493050884 x − 392.704615017112R² = 0.968316734130431
Series1Linear (Series1)
Date
mm
1/6/2
004
6/15/2
004
11/23/2
004
5/3/2
005
10/11/2
005
3/21/2
006
8/29/2
006
2/6/2
007
7/17/2
007
12/25/2
007
6/3/2
008
11/11/2
008
4/21/2
009
9/29/2
009
3/9/2
010
8/17/2
010
1/25/2
011
-20
-15
-10
-5
0
5
10
15
20
25
f(x) = 0.00955981759376252 x − 373.873900244331R² = 0.927006159964529
Series1
Linear (Series1)
Date
mm
East GPS Data
Dr. John Dye(Math Department)

Crack (Fault) Model
Displacement at GPS station from the fault
Fault and Displacement Theory

QUAKESIM & JPL

Displacement
GPS station data can show us the amount of displacement of the ground
after an earthquake.

Displacement
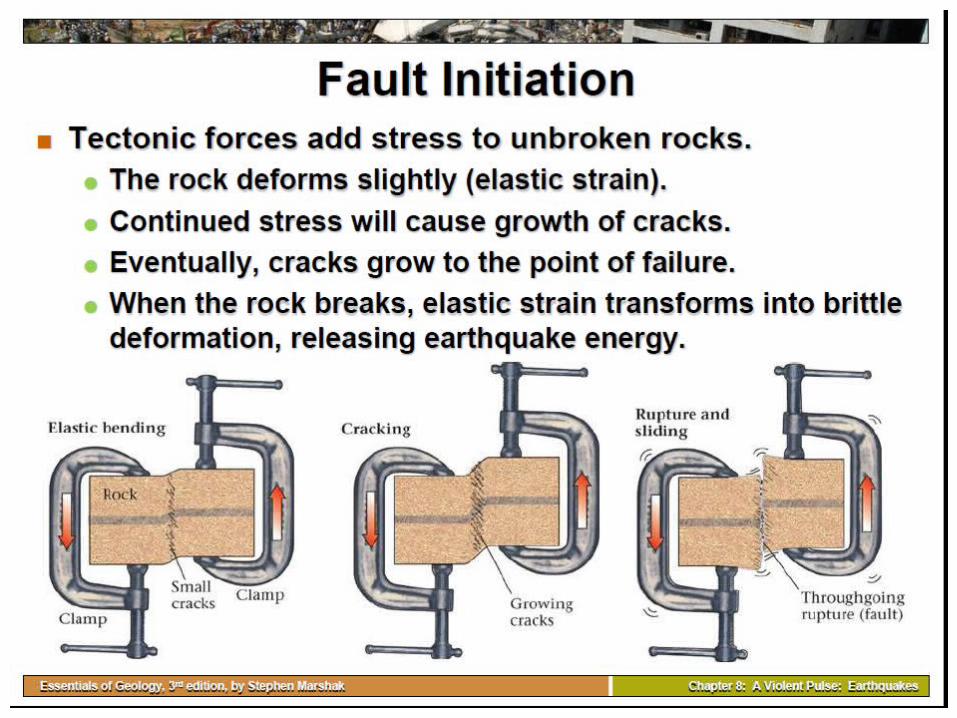
INTRODUCTION

ELASTIC REBOUND THEORY
• After the devastating 1906 San Francisco earthquake, Geology Professor Henry Reid concluded (after examining the displacement of the ground surface) that the earthquake must have involved an "elastic rebound" of previously stored elastic
stress.1
• “The gradual accumulation and release of stress and strain is referred to as the ‘elastic rebound theory’ of earthquakes. As plates on opposite sides of a fault are
subjected to force and shift, they accumulate energy and slowly deform until their internal strength is exceeded. At that time, a sudden movement occurs along the fault, releasing the accumulated energy, and the rocks snap back to their original
undeformed shape.”2
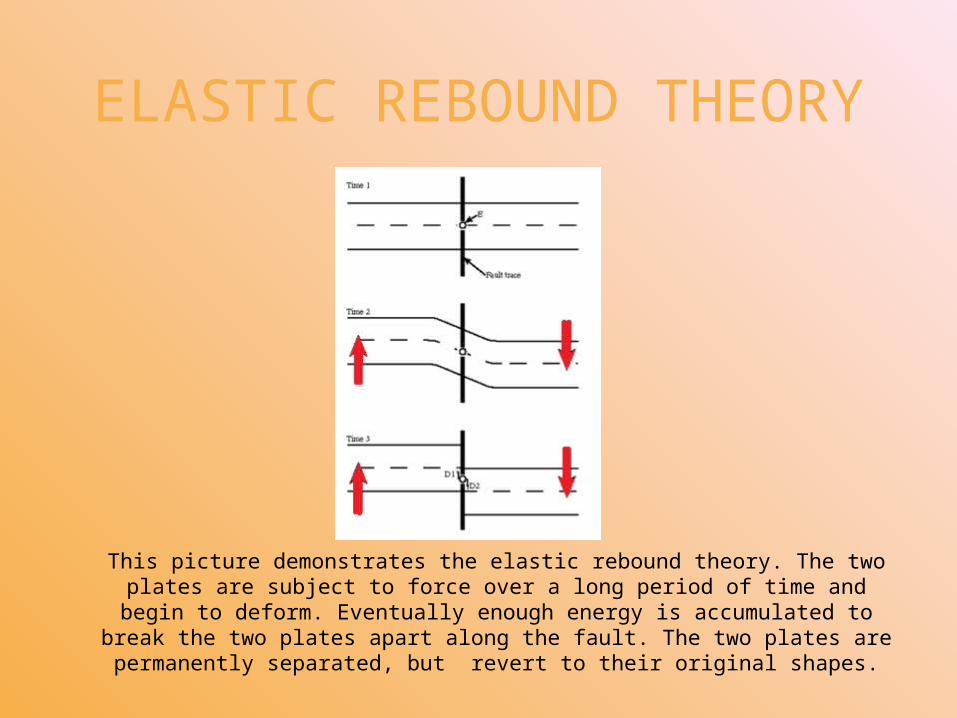
ELASTIC REBOUND THEORY
This picture demonstrates the elastic rebound theory. The two plates are subject to force over a long period of time and begin to deform. Eventually enough energy is accumulated to break the two plates apart along the fault. The two plates are permanently separated, but
revert to their original shapes.


ELASTIC REBOUND THEORY
Our stick-slip fault demonstration can be found on YouTube!
Information taken from: 1: http://earthquake.usgs.gov/regional/nca/1906/18april/reid.php2: http://en.wikipedia.org/wiki/Elastic_rebound_theory

Seismic Waves• Cause by breaking of rocks in the fault, which gives
off energy
• Recorded on the seismographs to measure the intensity.
• Traveling speed can vary based on the density and type of rock.
• Body waves and surface waves.

Oscilloscope & Transducer
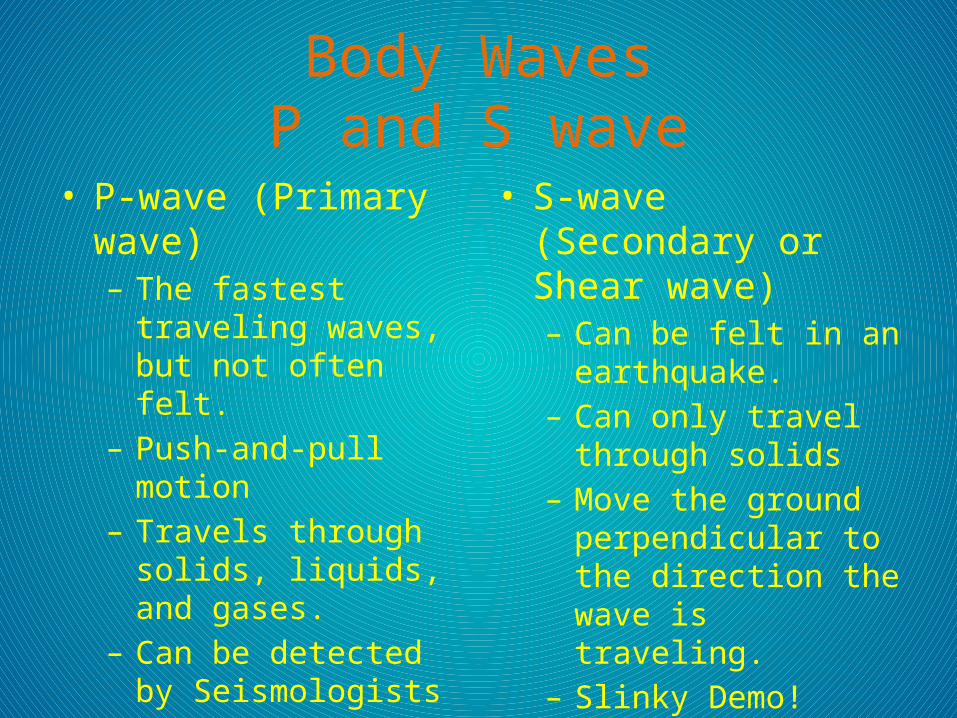
Body WavesP and S wave
• P-wave (Primary wave)– The fastest traveling
waves, but not often felt.– Push-and-pull motion– Travels through solids,
liquids, and gases.– Can be detected by
Seismologists – Used in an early warning
system
• S-wave (Secondary or Shear wave)– Can be felt in an
earthquake.– Can only travel through
solids– Move the ground
perpendicular to the direction the wave is traveling.
– Slinky Demo!

Surface Waves Love and Rayleigh Wave
• Love wave– Fastest surface wave and
move the ground side to side.
• Rayleigh wave– Rolls along the ground and
move the ground up and down and side to side.
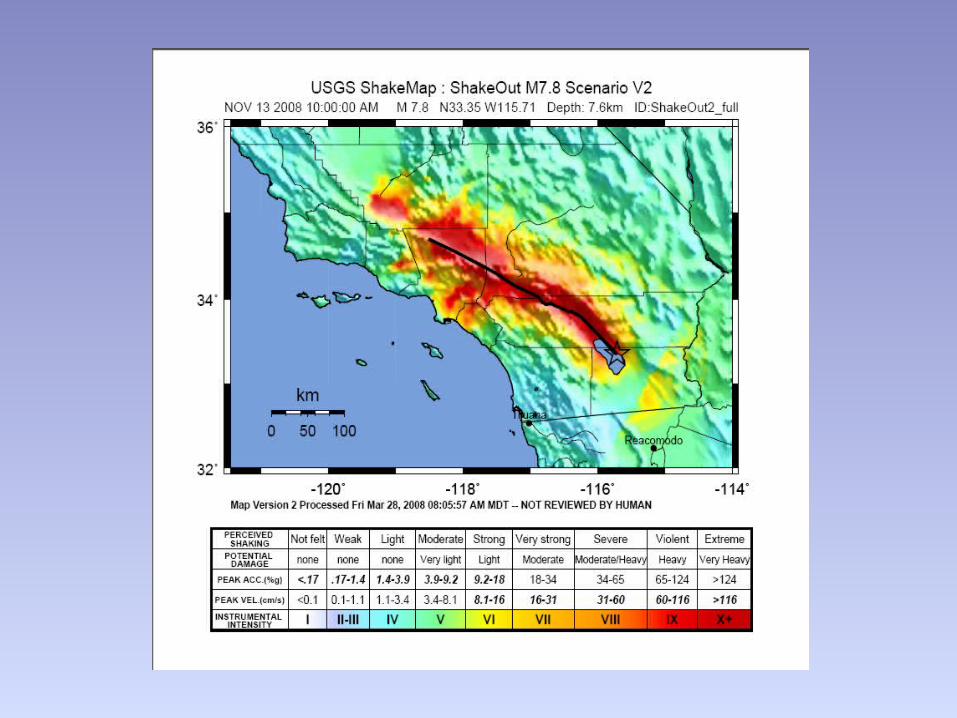


Intensity Scale

Moment Magnitude
Moment = Mo = GADG = shear modulus A = L*W = areaD = average displacement during rupture

Sediment-Filled Valleys Amplify Shaking

LiquefactionLiquefaction is a natural phenomenon that occurs when underground water is forced up, causing the surface soil to liquefy, creating an effect similar to quicksand. One of the main causes of liquefaction is earthquakes, due to the pressure generated by heavy seismic activity.
http://www.youtube.com/watch?v=ODTu3cZ2AVs

The ShakeOut ScenarioBy Lucile M. Jones, and others
(2008) USGS• Greatly affect 8 counties of So.
California
• 300 km (180 mi) rupture
• Magnitude 7.8
• 100 seconds of fault rupture
• Ground shaking for over 2minutes in many places!
• Disruption of critical lifeline infrastructure (freeway, internet, power and gas lines) along surface rupture; Slip of 3-4 meters at Cajon Pass (I-15)

Caltrans freeways (and major highways) fault
crossings

All lifelines Cross San Andreas Fault
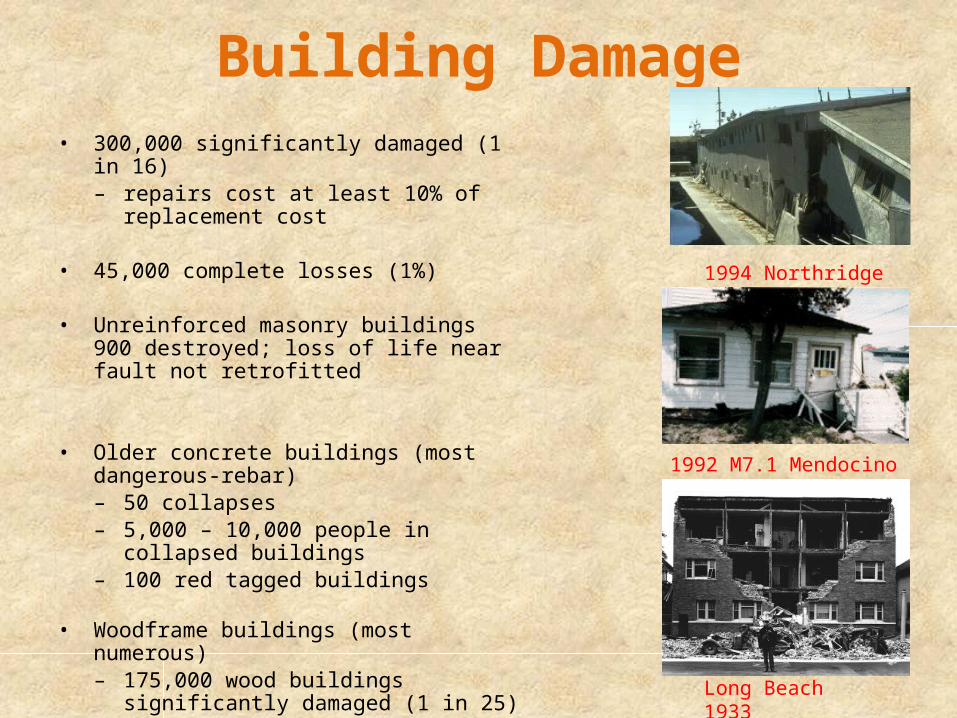
Building Damage• 300,000 significantly damaged (1 in 16)
– repairs cost at least 10% of replacement cost
• 45,000 complete losses (1%)
• Unreinforced masonry buildings900 destroyed; loss of life near fault not retrofitted
• Older concrete buildings (most dangerous-rebar)– 50 collapses – 5,000 – 10,000 people in collapsed buildings – 100 red tagged buildings
• Woodframe buildings (most numerous) – 175,000 wood buildings significantly damaged
(1 in 25)
1994 Northridge CA
1992 M7.1 Mendocino
Long Beach 1933

Fire Following Earthquake
• Earthquakes cause fire disasters– Numerous simultaneous ignitions– Degraded fire-resistive building features– Reduced pressure in water mains– Saturated communications– Traffic impacts– More fires than firefighting capabilities…
• Study findings– 1,600 ignitions requiring a fire engine– 1,200 exceed capability of 1st engine– Northern Orange County & LA Basin:
conflagrations destroy 100s of blocks– 200 million square feet burnt
~ 1.5% of total building stock– No Santa Ana winds… not worst case– 900 of the 1,800 casualties are from fire
Fire risk greatest in areas with strong shaking and densely-packed wood buildings; many such areas in LA Basin and northern OR Counties
Where’s the Water??

Emergency Response Challenges
• Widespread need for help• Distant mutual aid• Widespread disruption of:
– communication– transportation and access– water pressure– hospital functionality– staffing

Earthquake Response will not be there for us

And that does not include Aftershocks
• Damaging earthquakes may occur fordecades after a magnitude 7.8– Some may be more destructive than the mag 7.8
mainshock– Some will be larger than Northridge– Will occur over wide area
• Simulations of realistic aftershocksequences for Scenario– Four aftershocks will be used in Golden
Guardian exercises:• Mag 7.2 ruptures through Inland Empire
toward Pasadena• Mag 7.0 ruptures from Salton Sea into
Imperial County• Mag 5.7 with epicenter in Rialto• Mag 6.0 disrupts newly restored rail lines in
Cajon Pass
Distribution of aftershocks in Scenario simulations

Sources of Economic Shock
Economic Losses
Direct: property damage &
business interruption
Indirect: ancillary damage & ripple effects
Building damagefrom ground motion
Transportation route closureand delays
Watershut-off
Power outage
Gasshut-off
Building damage from fire
Adjusted for double-counting/multiple sources
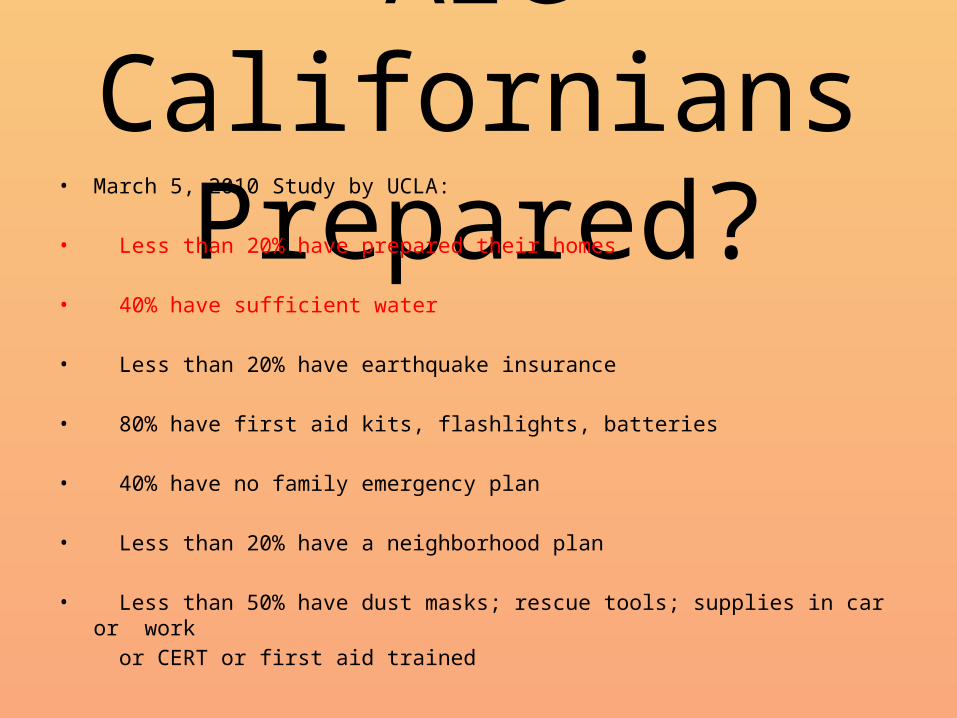
Are Californians Prepared?• March 5, 2010 Study by UCLA:
• Less than 20% have prepared their homes
• 40% have sufficient water
• Less than 20% have earthquake insurance
• 80% have first aid kits, flashlights, batteries
• 40% have no family emergency plan
• Less than 20% have a neighborhood plan
• Less than 50% have dust masks; rescue tools; supplies in car or work or CERT or first aid trained
Google Earth Tour
Special thanks to Dr. Steve Graves (Geography Department)
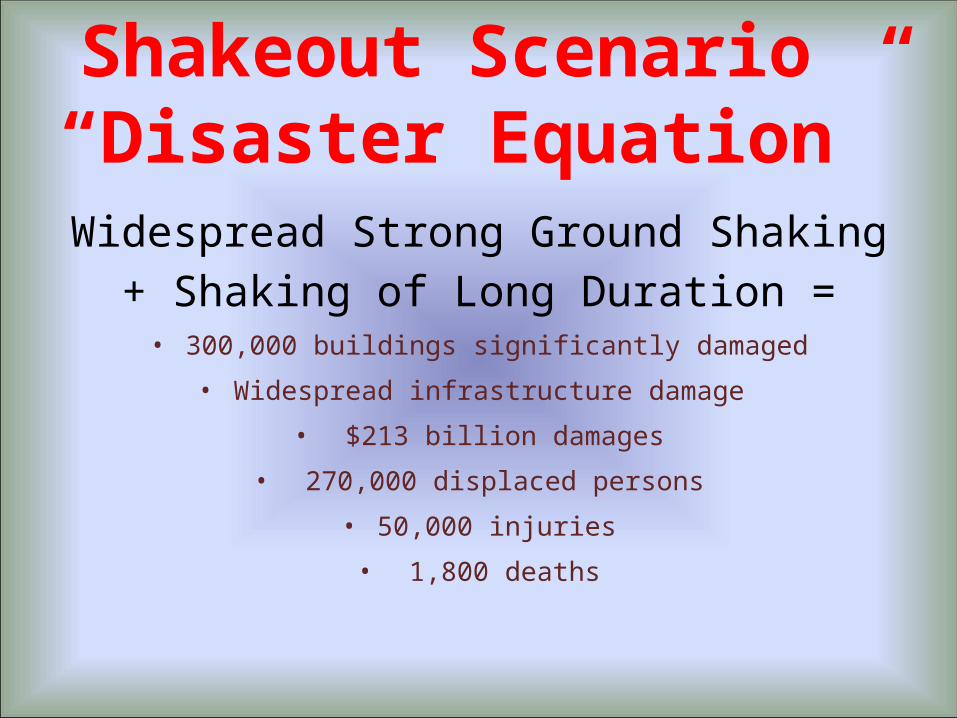
Shakeout Scenario “Disaster Equation”
Widespread Strong Ground Shaking+ Shaking of Long Duration =• 300,000 buildings significantly damaged
• Widespread infrastructure damage
• $213 billion damages
• 270,000 displaced persons
• 50,000 injuries
• 1,800 deaths

www.ShakeOut.org

The End?


