
8/8/2019 Living Water Exchange_Promoting Nutrient Reduction Best Practices in the CEE
http://slidepdf.com/reader/full/living-water-exchangepromoting-nutrient-reduction-best-practices-in-the-cee 1/36
Living Water Exchange: Promoting NutrientReduction Best Practices in the CEE
DREPR Regional Conference:Lessoned Learned and Next Steps in AgriculturePollution Reduction in Danube Black Sea basin
8/8/2019 Living Water Exchange_Promoting Nutrient Reduction Best Practices in the CEE
http://slidepdf.com/reader/full/living-water-exchangepromoting-nutrient-reduction-best-practices-in-the-cee 2/36
• Perspective/overview• Challenges
• What is a best practice?
• Demonstration outcomes• Discussion
– How to replicate & scale-up?
About Today
8/8/2019 Living Water Exchange_Promoting Nutrient Reduction Best Practices in the CEE
http://slidepdf.com/reader/full/living-water-exchangepromoting-nutrient-reduction-best-practices-in-the-cee 3/36
Lessons
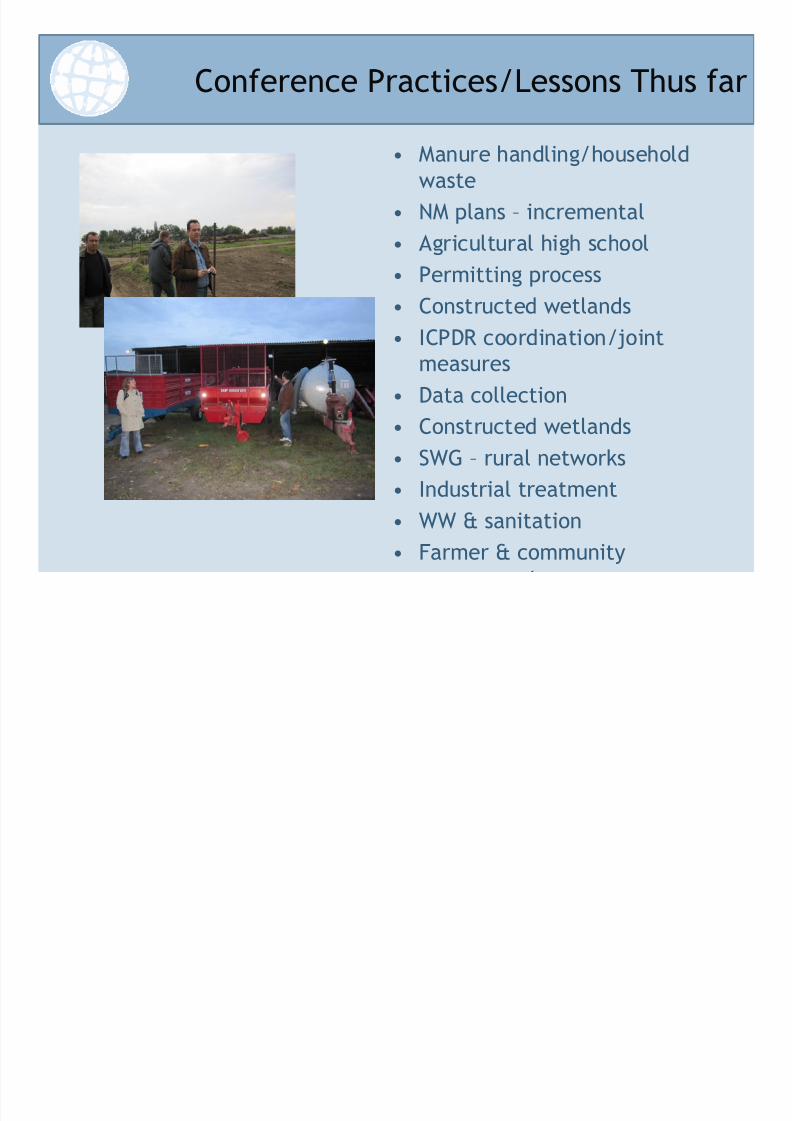
• Manure handling/householdwaste
• NM plans – incremental• Agricultural high school
• Permitting process
• Constructed wetlands
• ICPDR coordination/jointmeasures
• Data collection
• Constructed wetlands• SWG – rural networks
• Industrial treatment
• WW & sanitation
• Farmer & community
Conference Practices/Lessons Thus far
8/8/2019 Living Water Exchange_Promoting Nutrient Reduction Best Practices in the CEE
http://slidepdf.com/reader/full/living-water-exchangepromoting-nutrient-reduction-best-practices-in-the-cee 4/36
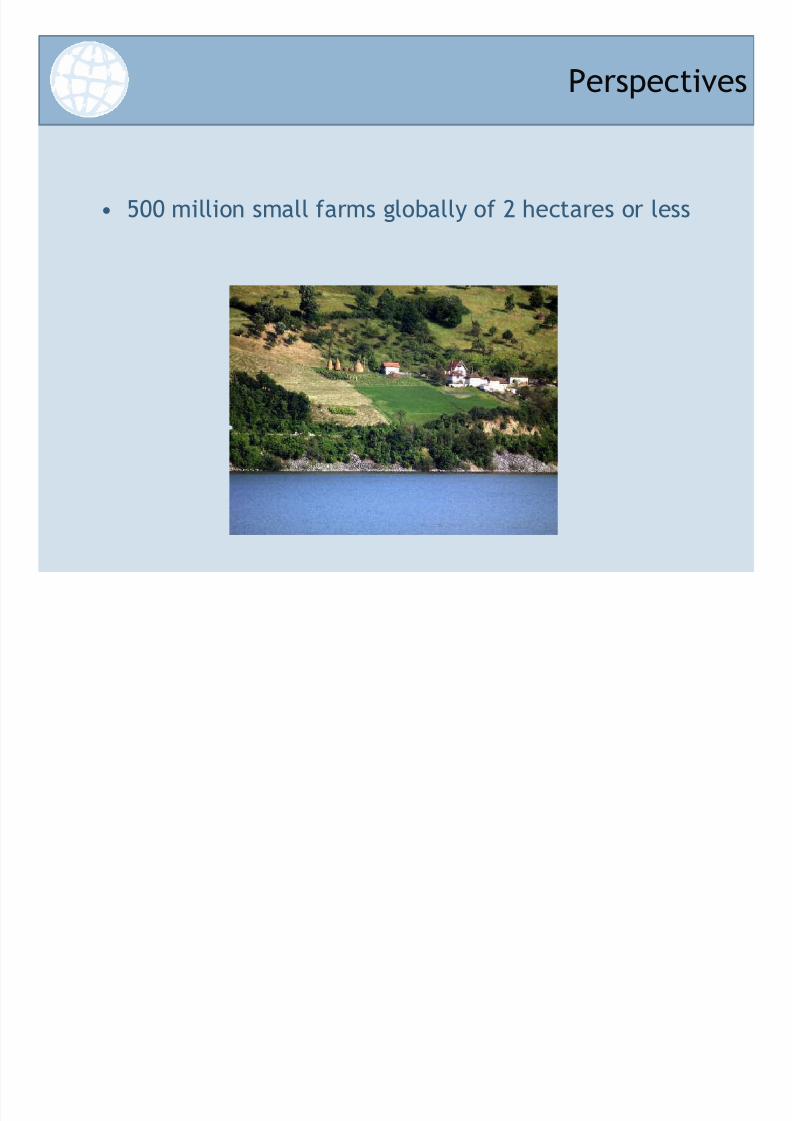
• 500 million small farms globally of 2 hectares or less
Perspectives

8/8/2019 Living Water Exchange_Promoting Nutrient Reduction Best Practices in the CEE
http://slidepdf.com/reader/full/living-water-exchangepromoting-nutrient-reduction-best-practices-in-the-cee 5/36
• 15 years of GEF, WB, other investments
• Agriculture issues (which the experience of the Danube hasshown) contribute majority share of N
• Improved best management practices (BMPs) proven to reduceN & P (by limiting application of fertilizer & better handling of
manure, etc.)
• Challenge: There is a need to collect, analyze and
replicate BMPs in a systematic way.
Why Is This Important:
The CEE/EECCA Body of Work

8/8/2019 Living Water Exchange_Promoting Nutrient Reduction Best Practices in the CEE
http://slidepdf.com/reader/full/living-water-exchangepromoting-nutrient-reduction-best-practices-in-the-cee 6/36
Geographic Scope

8/8/2019 Living Water Exchange_Promoting Nutrient Reduction Best Practices in the CEE
http://slidepdf.com/reader/full/living-water-exchangepromoting-nutrient-reduction-best-practices-in-the-cee 7/36
• Reduce nutrientloading
• Link to GEF/WBprojects in theregion
• Ensure sustainableBMPS
• Build a model forfunding andreplication in theCEE
GEF System
• StrongerInternational legalframeworks on NR
• Codes of conduct
• Linking to otherglobal NR projects &BMPs
Inventory BMPs Demonstrations ImplementEffectively
AchieveImpact
GEF & World Bank NR
Projects in the CEE
Global Perspective
• Key markets/regions
• Lessons & successes
• Leverage resources& data
Practices
• BAP
• Manure management
• Knowledge building
• Wetlands restorationPartnerships
• USG
• EU
• Other donors
• Implementingorganizations
Wetlands
Restoration &Innovative NR
Practices
CapacityBuilding
Partnerships
BAP Projects
System Oversight
• Consistentengagement inproject progress
Measurement
• Consistent Use ofMonitoring andEvaluationFramework
Sustainability
• Ensure results within10 month period
Effective
Communication• Engage interested
partners, currentprojects
20102009
A Framework for Action
8/8/2019 Living Water Exchange_Promoting Nutrient Reduction Best Practices in the CEE
http://slidepdf.com/reader/full/living-water-exchangepromoting-nutrient-reduction-best-practices-in-the-cee 8/36
8/8/2019 Living Water Exchange_Promoting Nutrient Reduction Best Practices in the CEE
http://slidepdf.com/reader/full/living-water-exchangepromoting-nutrient-reduction-best-practices-in-the-cee 9/36
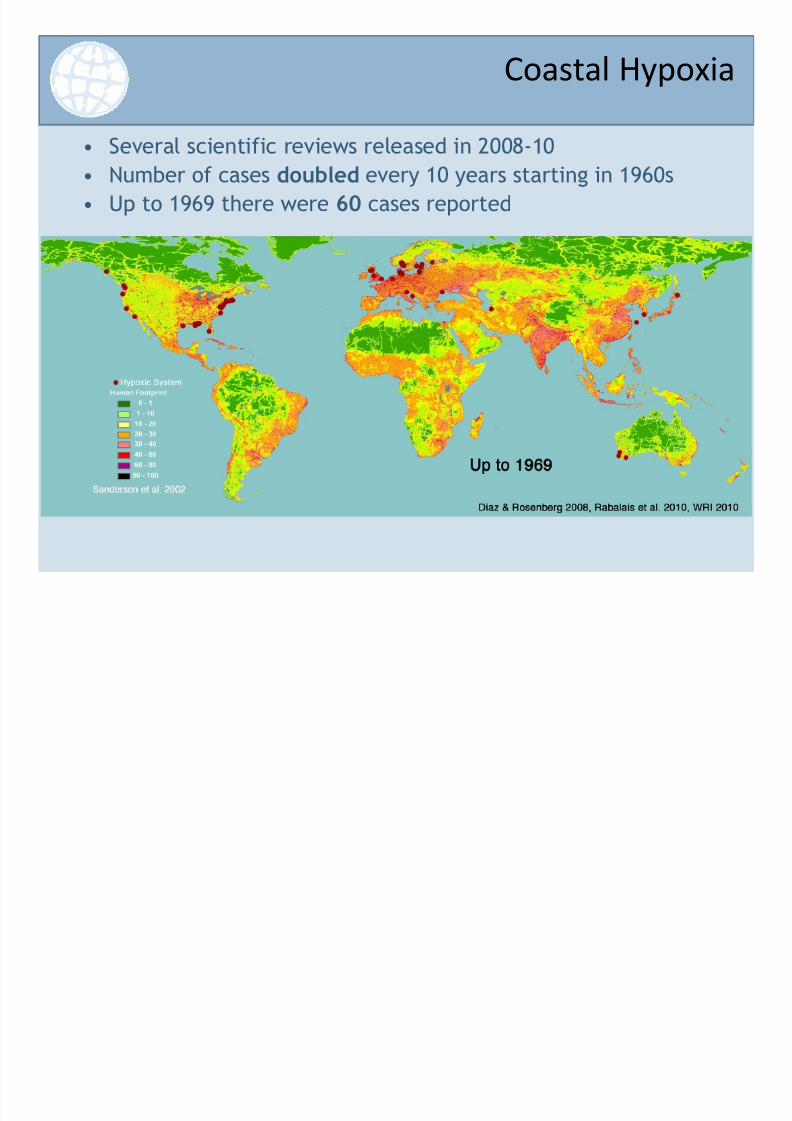
• Several scientific reviews released in 2008-10
• Number of cases doubled every 10 years starting in 1960s
• Up to 1969 there were 60 cases reported
Coastal Hypoxia

8/8/2019 Living Water Exchange_Promoting Nutrient Reduction Best Practices in the CEE
http://slidepdf.com/reader/full/living-water-exchangepromoting-nutrient-reduction-best-practices-in-the-cee 10/36
• 1980s had explosive increase in the number of hypoxicsystems.
• Number of cases was 275 by 1989.
Coastal Hypoxia
8/8/2019 Living Water Exchange_Promoting Nutrient Reduction Best Practices in the CEE
http://slidepdf.com/reader/full/living-water-exchangepromoting-nutrient-reduction-best-practices-in-the-cee 11/36
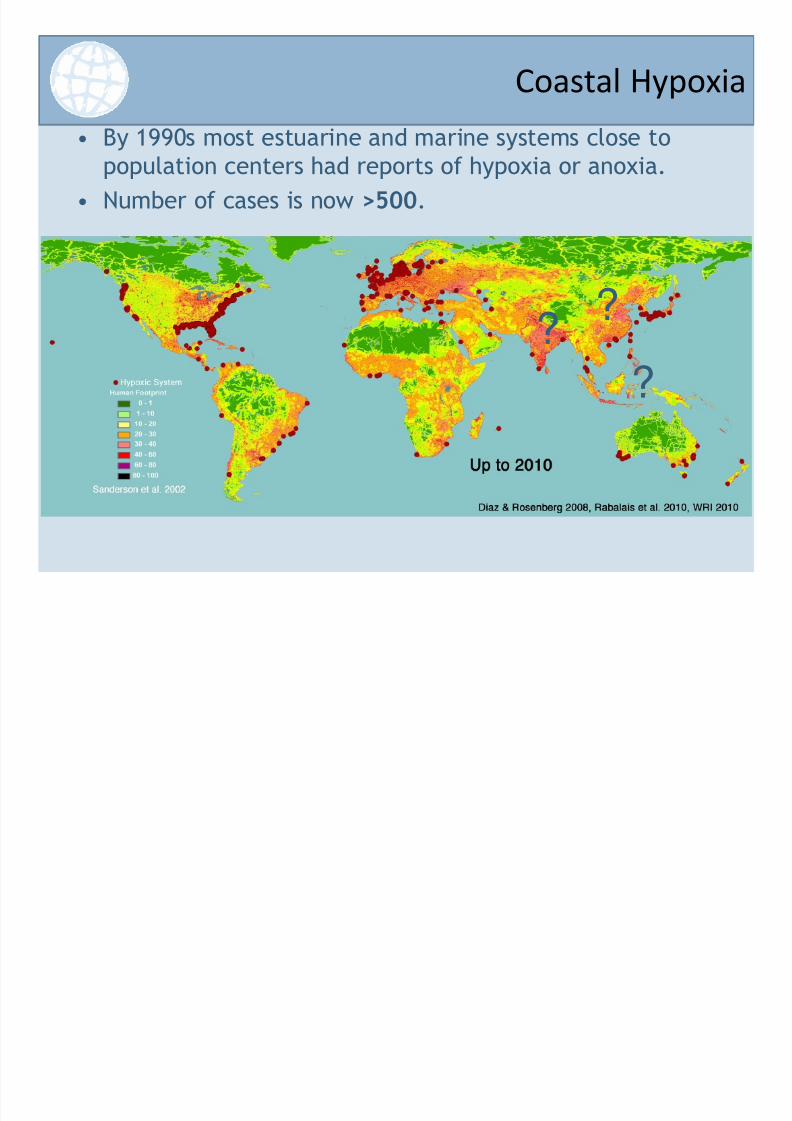
• By 1990s most estuarine and marine systems close topopulation centers had reports of hypoxia or anoxia.
• Number of cases is now >500.
? ??
Coastal Hypoxia
8/8/2019 Living Water Exchange_Promoting Nutrient Reduction Best Practices in the CEE
http://slidepdf.com/reader/full/living-water-exchangepromoting-nutrient-reduction-best-practices-in-the-cee 12/36
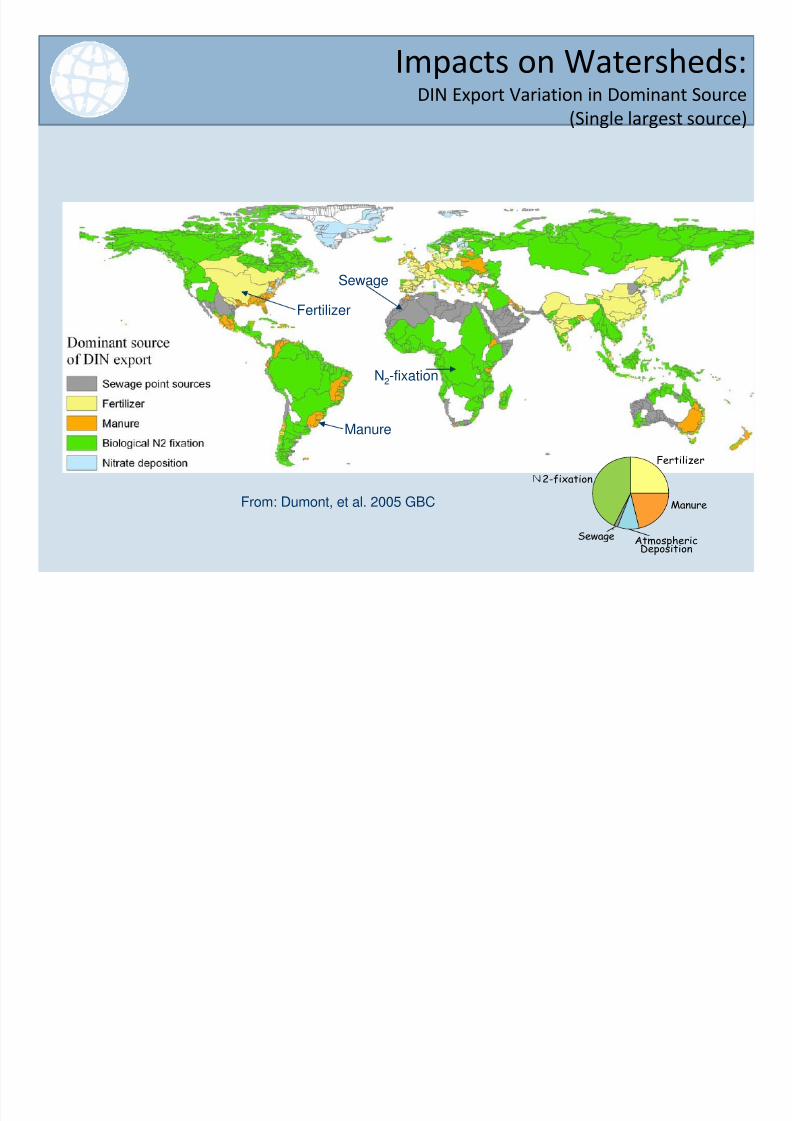
From: Dumont, et al. 2005 GBC
Fertilizer
Manure
AtmosphericDeposition
Sewage
2-fixation
Fertilizer
Manure
N2-fixation
Sewage
Impacts on Watersheds:DIN Export Variation in Dominant Source
(Single largest source)

8/8/2019 Living Water Exchange_Promoting Nutrient Reduction Best Practices in the CEE
http://slidepdf.com/reader/full/living-water-exchangepromoting-nutrient-reduction-best-practices-in-the-cee 13/36
Source: http://maps.grida.no/go/graphic/ratio-of-wastewater-treatment
Global Ratio of Wastewater Treatment
Global Ratio of Wastewater
Treatment
8/8/2019 Living Water Exchange_Promoting Nutrient Reduction Best Practices in the CEE
http://slidepdf.com/reader/full/living-water-exchangepromoting-nutrient-reduction-best-practices-in-the-cee 14/36
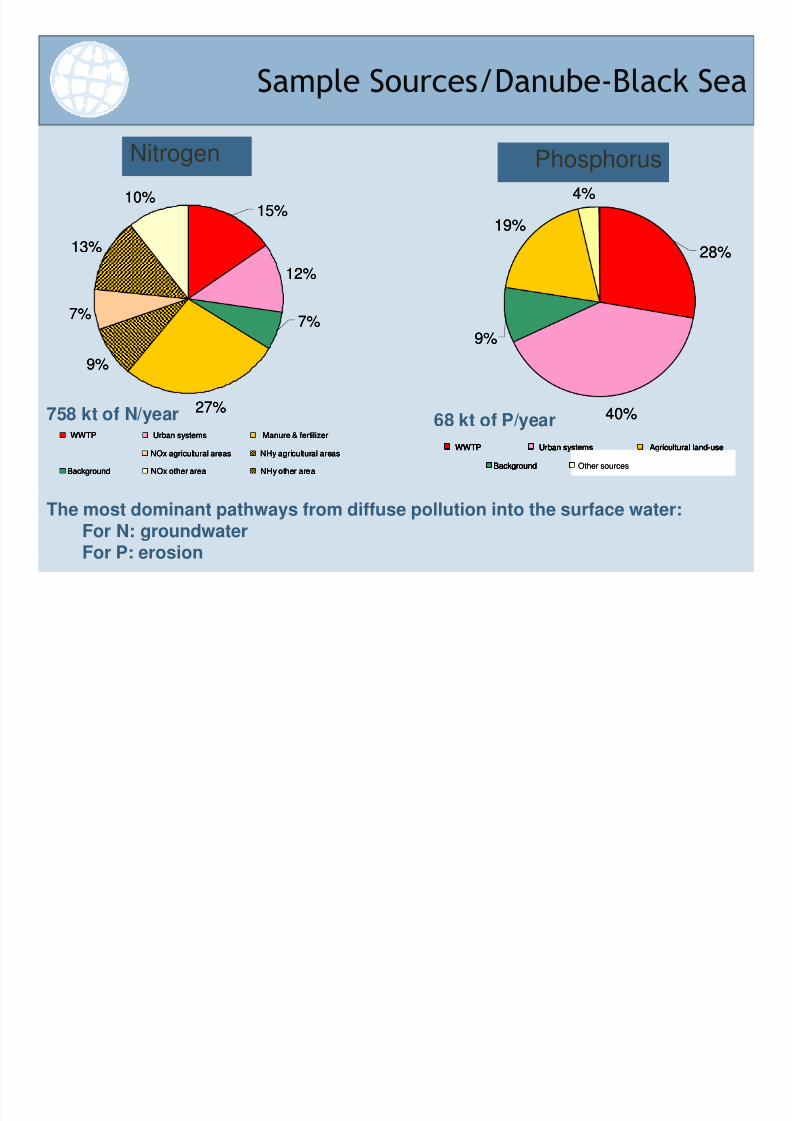
Sample Sources/Danube-Black Sea
Nitrogen Phosphorus
12%
27%
9%
7%
13%
10%
7%
15%
12%
27%
9%
7%
13%
10%
7%
15%
40%
19%
4%
9%
28%
40%
19%
4%
9%
28%
WWTP Urban systems
Background
Manure & fertilizer
NHy agricultural areasNOx agricultural areas
NHy other areaNOx other area
WWTPWWTP Urban systemsUrban systems
BackgroundBackground
Manure & fertilizerManure & fertilizer
NHy agricultural areasNHy agricultural areasNOx agricultural areasNOx agricultural areas
NHy other areaNHy other areaNOx other areaNOx other area
WWTP Urban systems
Background
Agricultural land-use
Other sources
WWTP Urban systems
Background
Agricultural land-use
Other sources
WWTPWWTP Urban systemsUrban systems
BackgroundBackground
Agricultural land-useAgricultural land-use
Other sourcesOther sources
758 kt of N/year 68 kt of P/year
The most dominant pathways from diffuse pollution into the surface water:
For N: groundwaterFor P: erosion

8/8/2019 Living Water Exchange_Promoting Nutrient Reduction Best Practices in the CEE
http://slidepdf.com/reader/full/living-water-exchangepromoting-nutrient-reduction-best-practices-in-the-cee 15/36
Long-term Discharges of N & P into
the Black Sea
0
100
200
300
400
500
600
1 9 5 5
1 9 6 0
1 9 6 5
1 9 7 0
1 9 7 5
1 9 8 0
1 9 8 5
1 9 9 0
1 9 9 5
2 0 0 0
2 0 0 5
D I N l o
a d i n k t /
0
5
10
15
20
25
30
35
40
1 9 5 5
1 9 6 0
1 9 6 5
1 9 7 0
1 9 7 5
1 9 8 0
1 9 8 5
1 9 9 0
1 9 9 5
2 0 0 0
2 0 0 5
T P l o
a d i n
k t / y
Nitrogen Phosphorus

8/8/2019 Living Water Exchange_Promoting Nutrient Reduction Best Practices in the CEE
http://slidepdf.com/reader/full/living-water-exchangepromoting-nutrient-reduction-best-practices-in-the-cee 16/36
Initial Inventory:
Nutrient Relevant Projects By Region
8/8/2019 Living Water Exchange_Promoting Nutrient Reduction Best Practices in the CEE
http://slidepdf.com/reader/full/living-water-exchangepromoting-nutrient-reduction-best-practices-in-the-cee 17/36
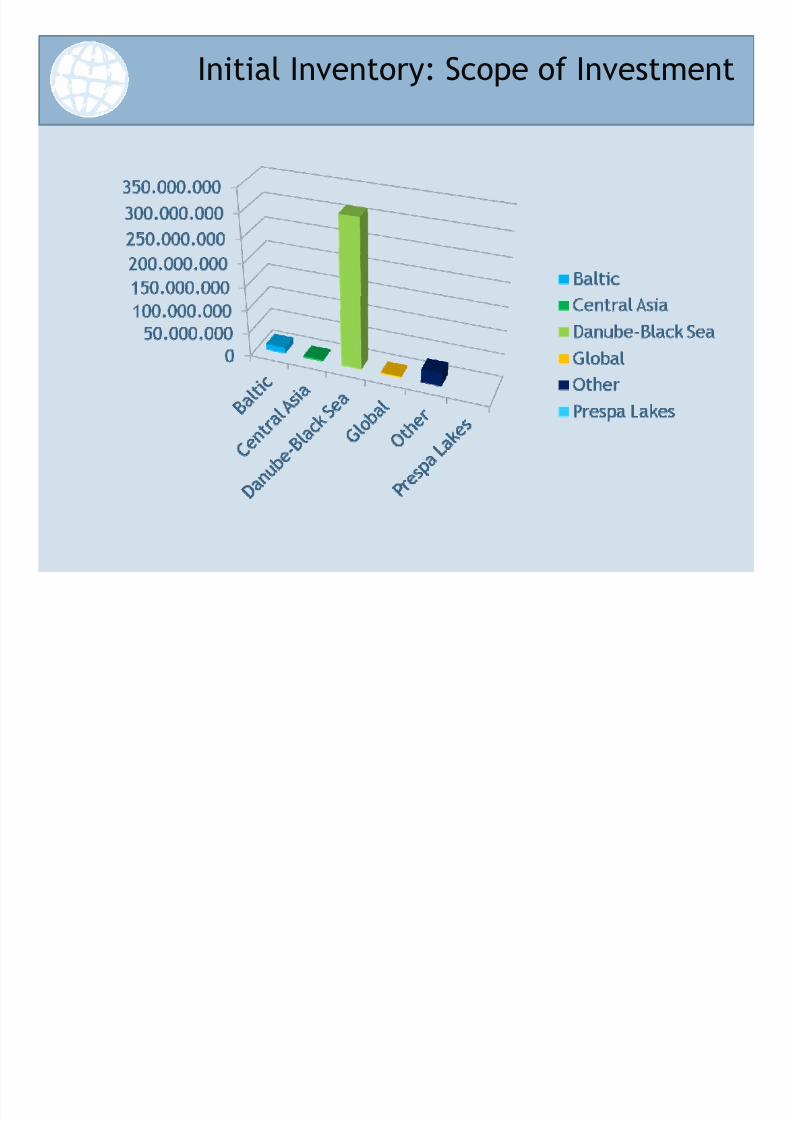
Initial Inventory: Scope of Investment
8/8/2019 Living Water Exchange_Promoting Nutrient Reduction Best Practices in the CEE
http://slidepdf.com/reader/full/living-water-exchangepromoting-nutrient-reduction-best-practices-in-the-cee 18/36
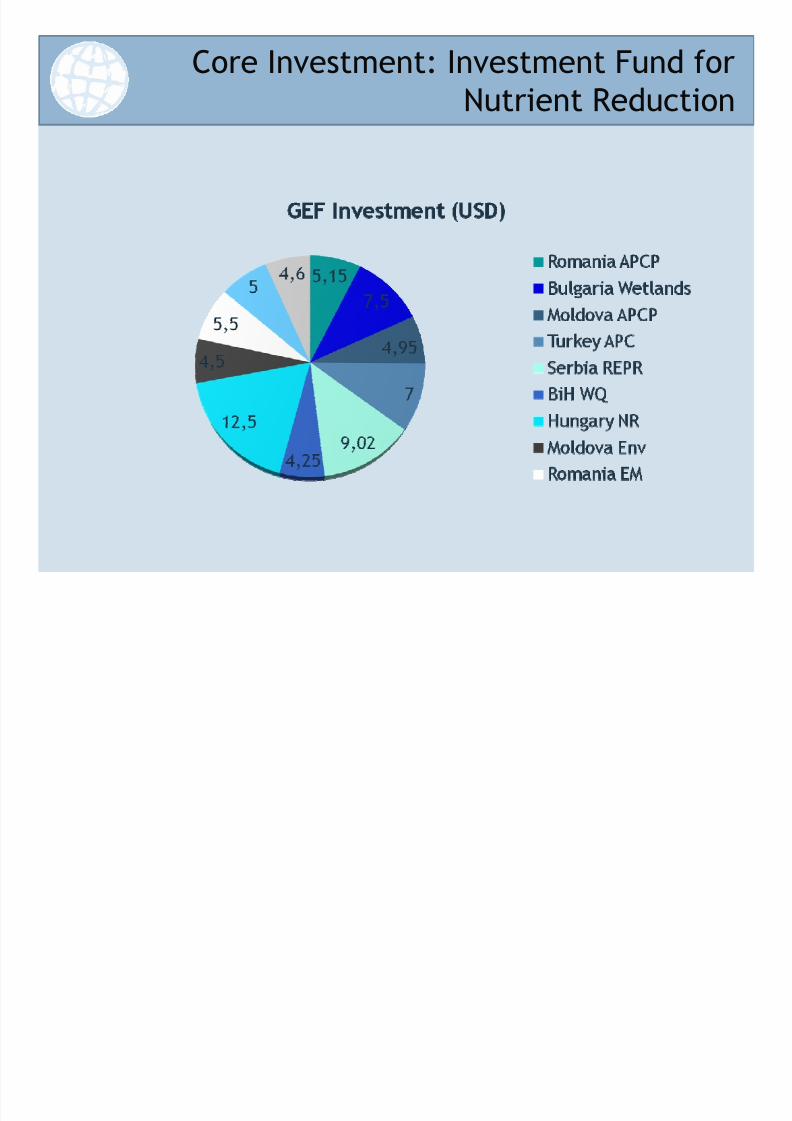
Core Investment: Investment Fund for
Nutrient Reduction
8/8/2019 Living Water Exchange_Promoting Nutrient Reduction Best Practices in the CEE
http://slidepdf.com/reader/full/living-water-exchangepromoting-nutrient-reduction-best-practices-in-the-cee 19/36
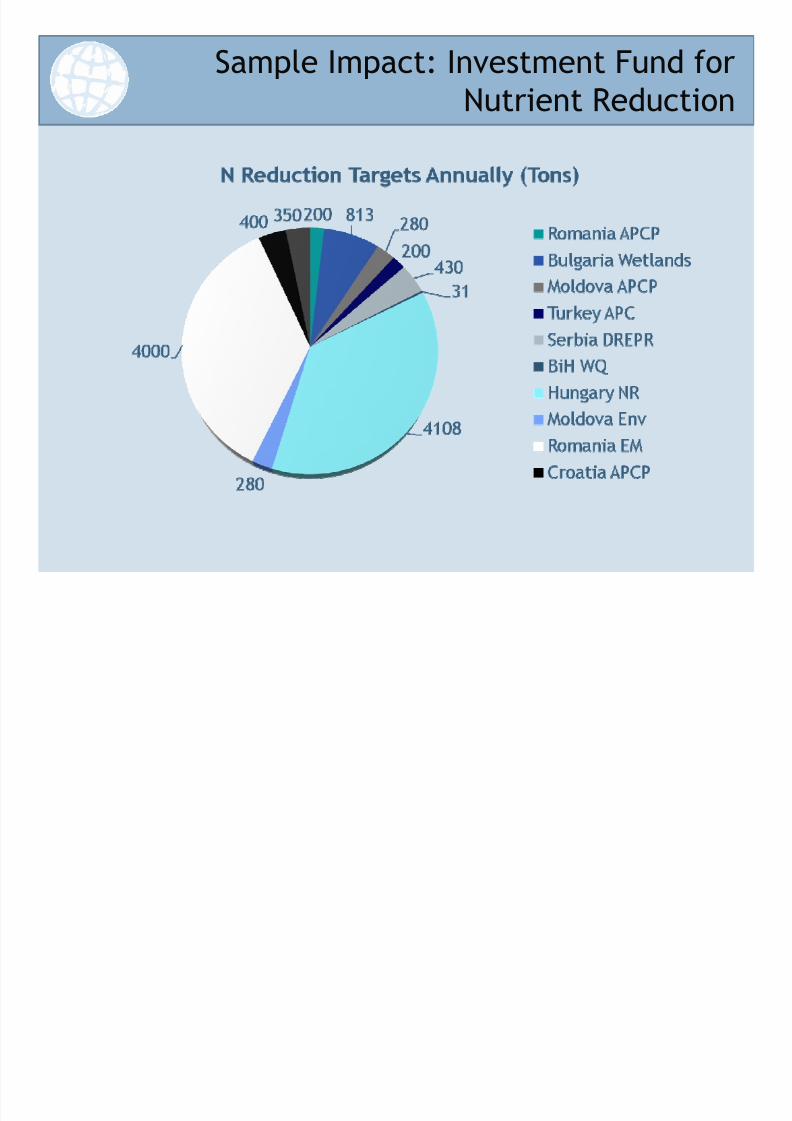
Sample Impact: Investment Fund for
Nutrient Reduction
8/8/2019 Living Water Exchange_Promoting Nutrient Reduction Best Practices in the CEE
http://slidepdf.com/reader/full/living-water-exchangepromoting-nutrient-reduction-best-practices-in-the-cee 20/36
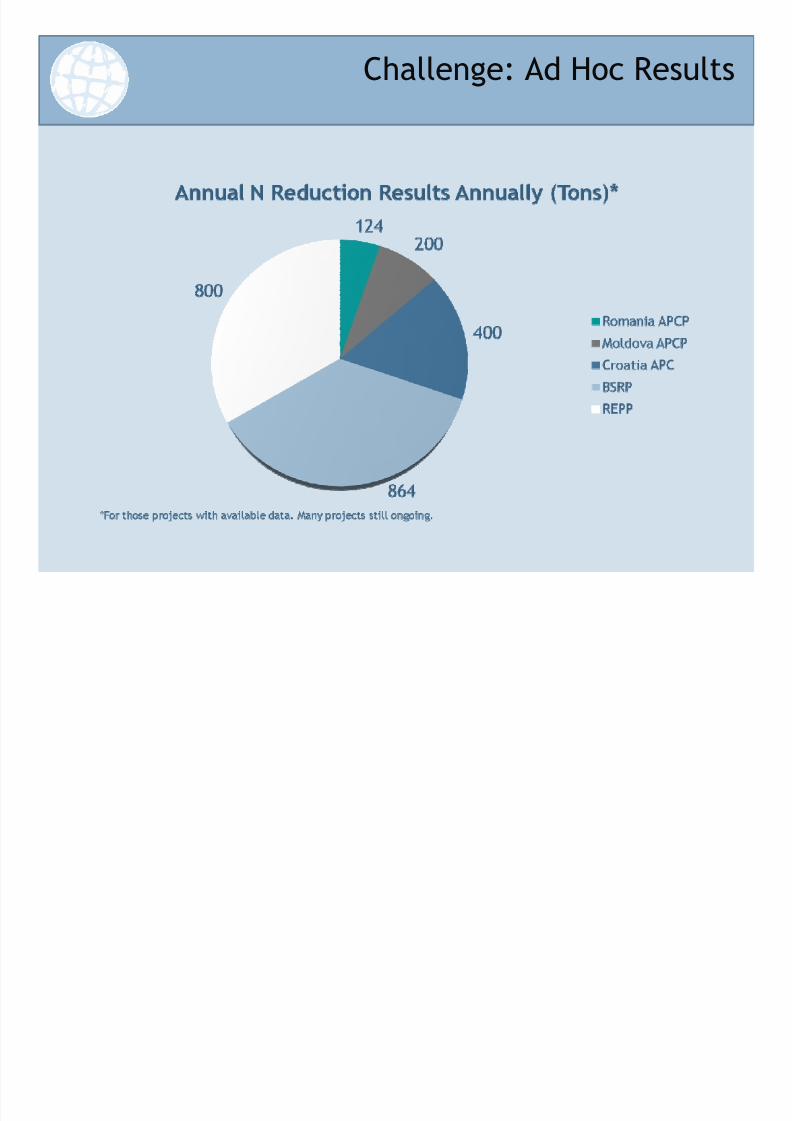
Challenge: Ad Hoc Results
8/8/2019 Living Water Exchange_Promoting Nutrient Reduction Best Practices in the CEE
http://slidepdf.com/reader/full/living-water-exchangepromoting-nutrient-reduction-best-practices-in-the-cee 21/36
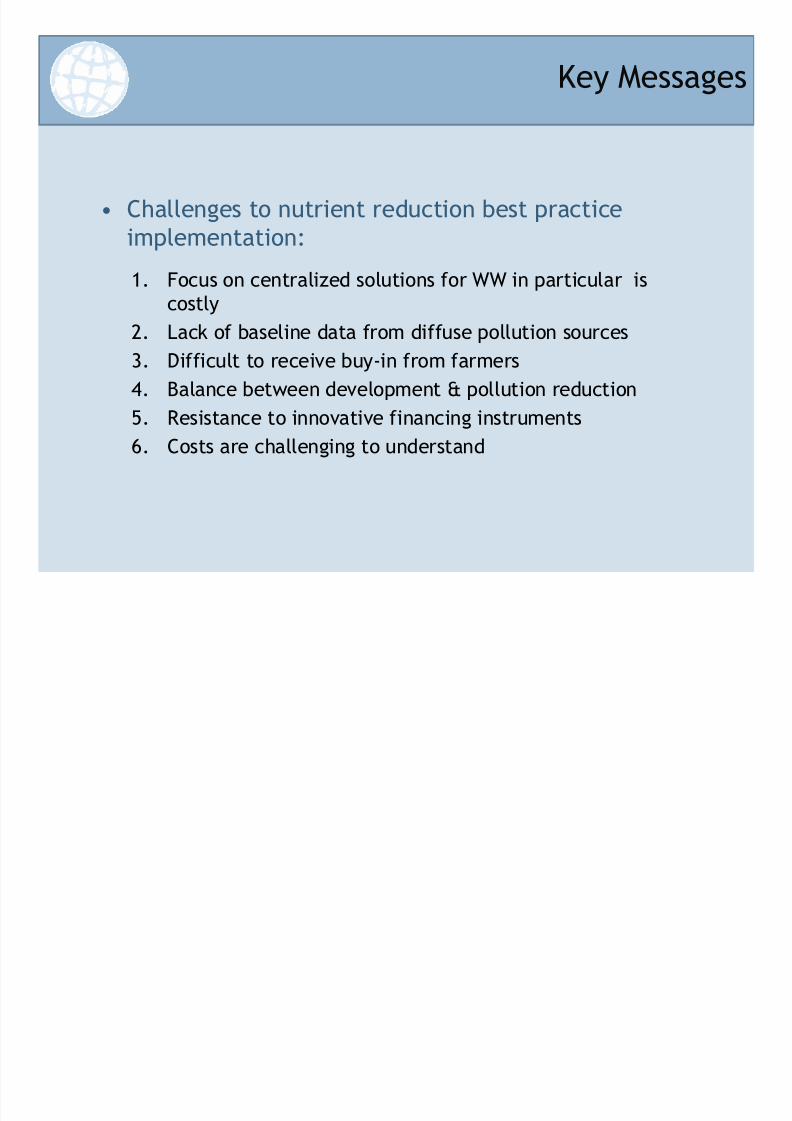
• Challenges to nutrient reduction best practiceimplementation:
1. Focus on centralized solutions for WW in particular iscostly
2. Lack of baseline data from diffuse pollution sources
3. Difficult to receive buy-in from farmers
4. Balance between development & pollution reduction
5. Resistance to innovative financing instruments
6. Costs are challenging to understand
Key Messages
8/8/2019 Living Water Exchange_Promoting Nutrient Reduction Best Practices in the CEE
http://slidepdf.com/reader/full/living-water-exchangepromoting-nutrient-reduction-best-practices-in-the-cee 22/36
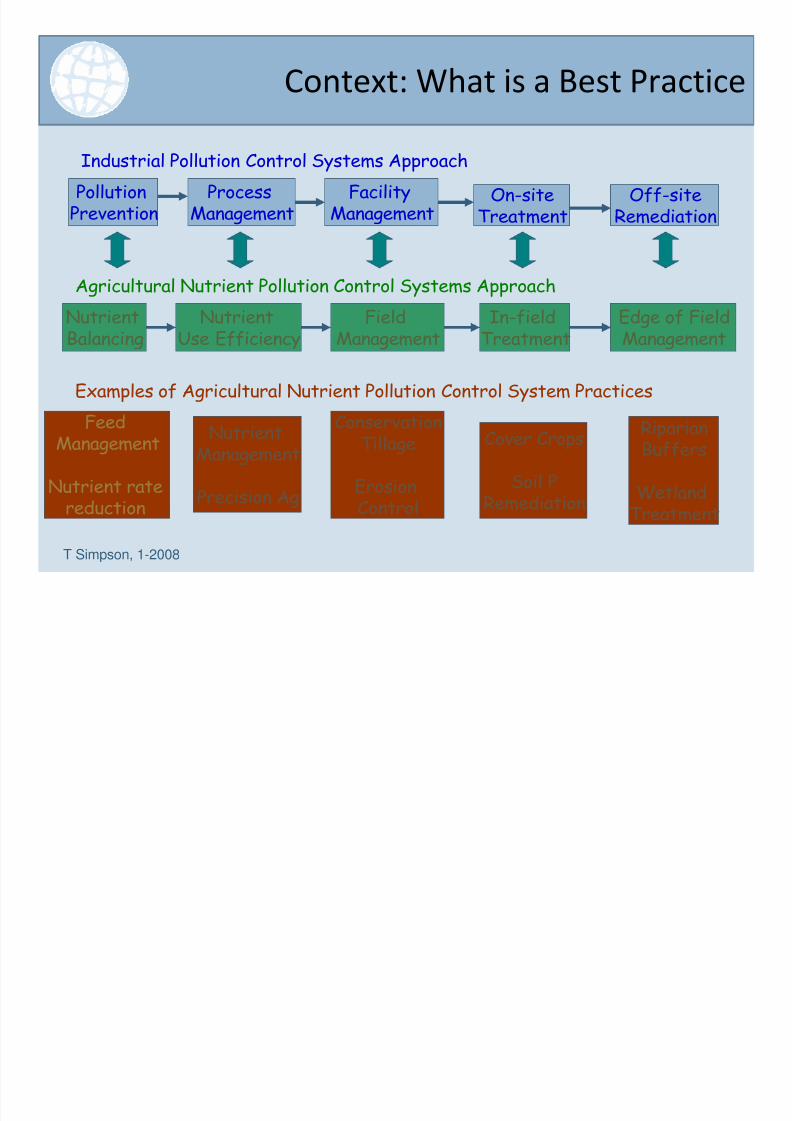
Pollution
Prevention
Process
Management
Facility
Management
On-site
Treatment
Off-site
Remediation
NutrientBalancing NutrientUse Efficiency FieldManagement In-fieldTreatment Edge of FieldManagement
FeedManagement
Nutrient ratereduction
NutrientManagement
Precision Ag
ConservationTillage
ErosionControl
Cover Crops
Soil PRemediation
RiparianBuffers
WetlandTreatment
Industrial Pollution Control Systems Approach
Agricultural Nutrient Pollution Control Systems Approach
Examples of Agricultural Nutrient Pollution Control System Practices
T Simpson, 1-2008
Context: What is a Best Practice
8/8/2019 Living Water Exchange_Promoting Nutrient Reduction Best Practices in the CEE
http://slidepdf.com/reader/full/living-water-exchangepromoting-nutrient-reduction-best-practices-in-the-cee 23/36
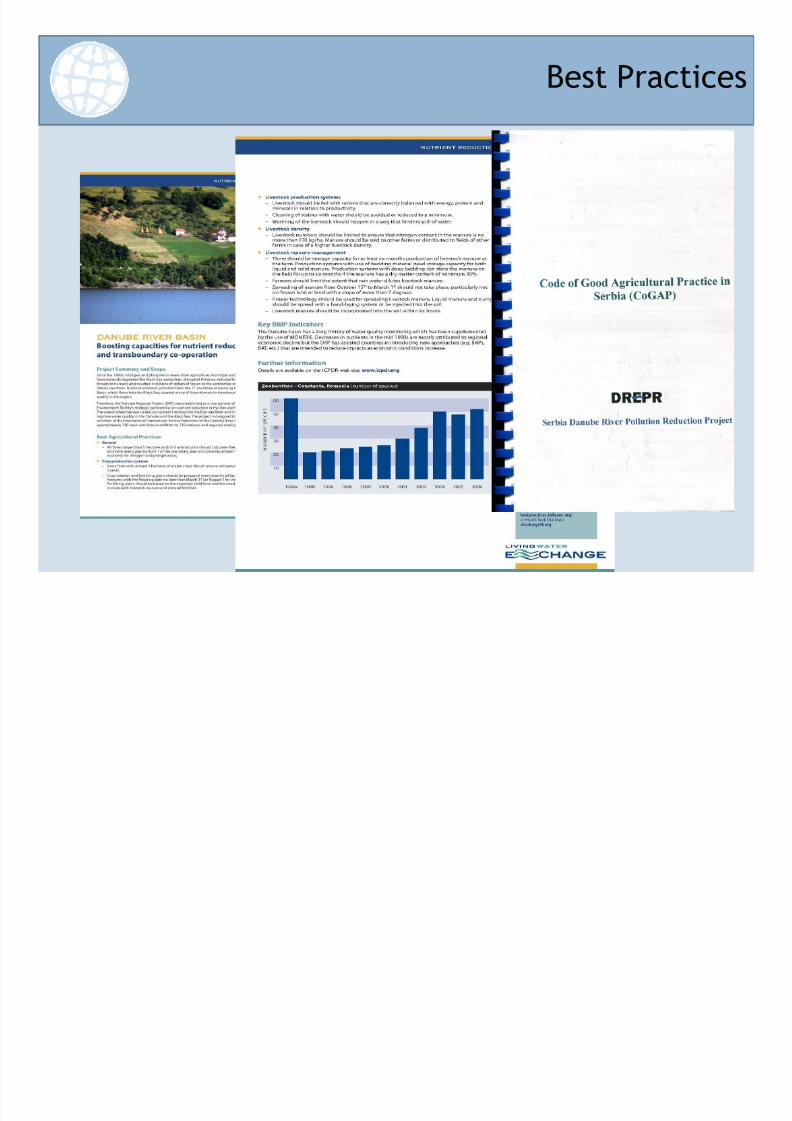
Best Practices

8/8/2019 Living Water Exchange_Promoting Nutrient Reduction Best Practices in the CEE
http://slidepdf.com/reader/full/living-water-exchangepromoting-nutrient-reduction-best-practices-in-the-cee 24/36
Slide 24
0
1000
2000
3000
4000
5000
6000
0 500 1000 1500 2000
reduction in nitrogen loss
(thousand tonnes)
c
o
s
t
e
r
u
n i t
$
/ t o
n
n
e
fertilizer reduction
wetland res toration
Comparison of Nitrogen ReductionStrategies

8/8/2019 Living Water Exchange_Promoting Nutrient Reduction Best Practices in the CEE
http://slidepdf.com/reader/full/living-water-exchangepromoting-nutrient-reduction-best-practices-in-the-cee 25/36
Size People Capacity Average
Cost
Small < 10,000 < 1 MGD $1.5 M to
$2 M
Medium >10,000,< 100,000
1 to 5 MGD $2 M to$15 M
Large >100,000 5 to 20 MGD $15 M to$100 M
Sample conventional optionsSample decentralized options
8,000 GPD Natural WWT
$3 per gal packaged system
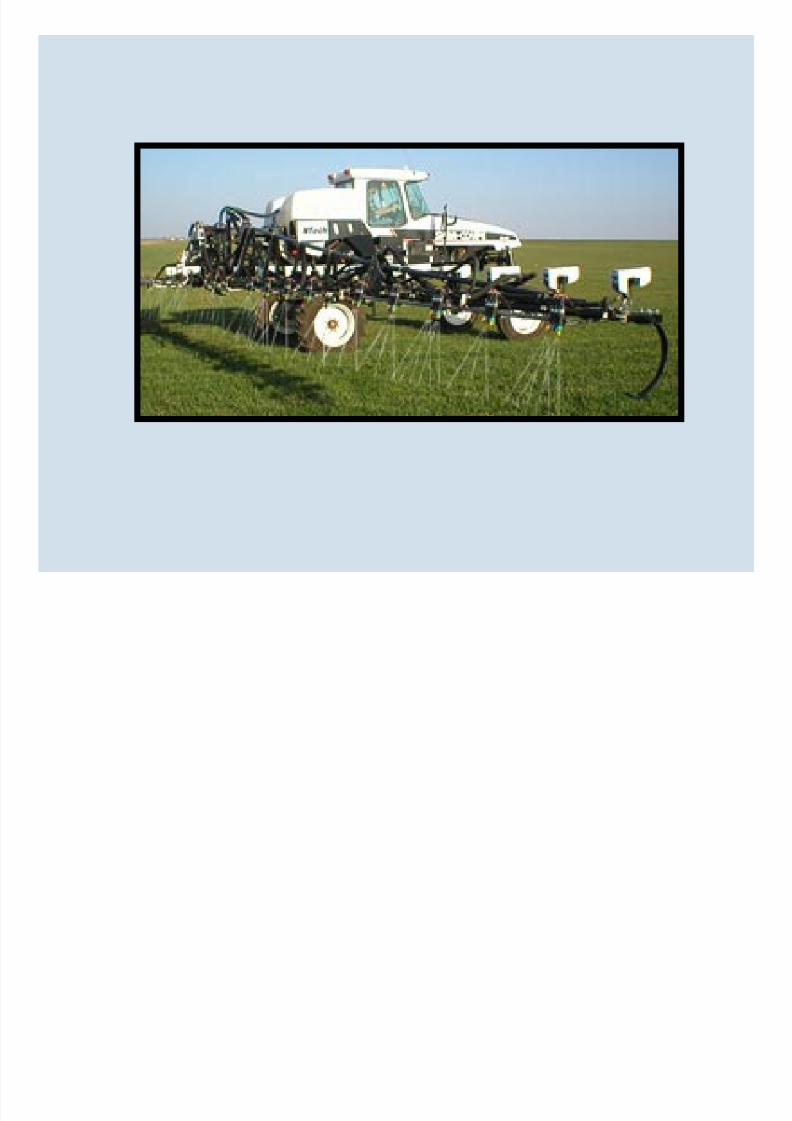
Best Practice Samples:
WW Technology Deployment
8/8/2019 Living Water Exchange_Promoting Nutrient Reduction Best Practices in the CEE
http://slidepdf.com/reader/full/living-water-exchangepromoting-nutrient-reduction-best-practices-in-the-cee 26/36

8/8/2019 Living Water Exchange_Promoting Nutrient Reduction Best Practices in the CEE
http://slidepdf.com/reader/full/living-water-exchangepromoting-nutrient-reduction-best-practices-in-the-cee 27/36
Best Practice Samples
Display of N statusIndex of growing
plants and N
Fertilizer Need for
top-dressing basedon algorithms &
computations
Capacitybuilding throughcommunities ofpractice

8/8/2019 Living Water Exchange_Promoting Nutrient Reduction Best Practices in the CEE
http://slidepdf.com/reader/full/living-water-exchangepromoting-nutrient-reduction-best-practices-in-the-cee 28/36
• Organic matterincrease– C:N ratio
• Soil structureimprovement
• Atmospheric
nitrogen fixation
Benefits of No-Till Cropping Systems
8/8/2019 Living Water Exchange_Promoting Nutrient Reduction Best Practices in the CEE
http://slidepdf.com/reader/full/living-water-exchangepromoting-nutrient-reduction-best-practices-in-the-cee 29/36
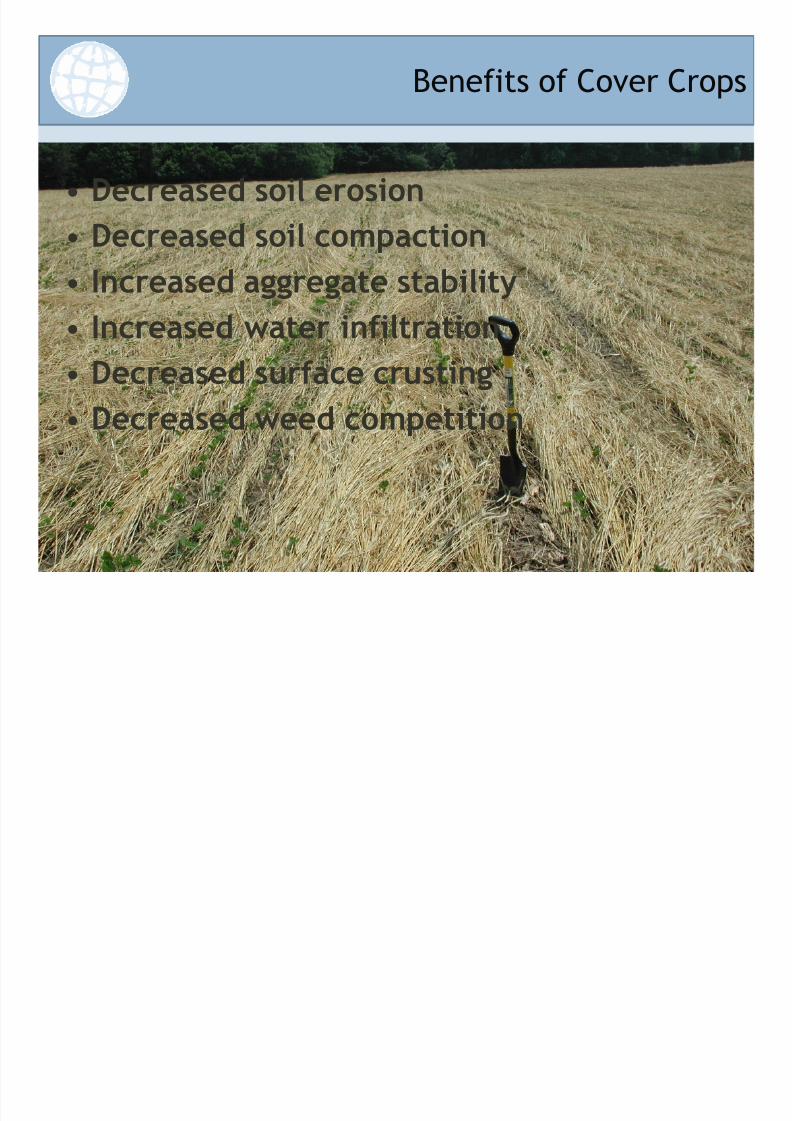
• Decreased soil erosion
• Decreased soil compaction
• Increased aggregate stability
• Increased water infiltration• Decreased surface crusting
• Decreased weed competition
Benefits of Cover Crops
8/8/2019 Living Water Exchange_Promoting Nutrient Reduction Best Practices in the CEE
http://slidepdf.com/reader/full/living-water-exchangepromoting-nutrient-reduction-best-practices-in-the-cee 30/36
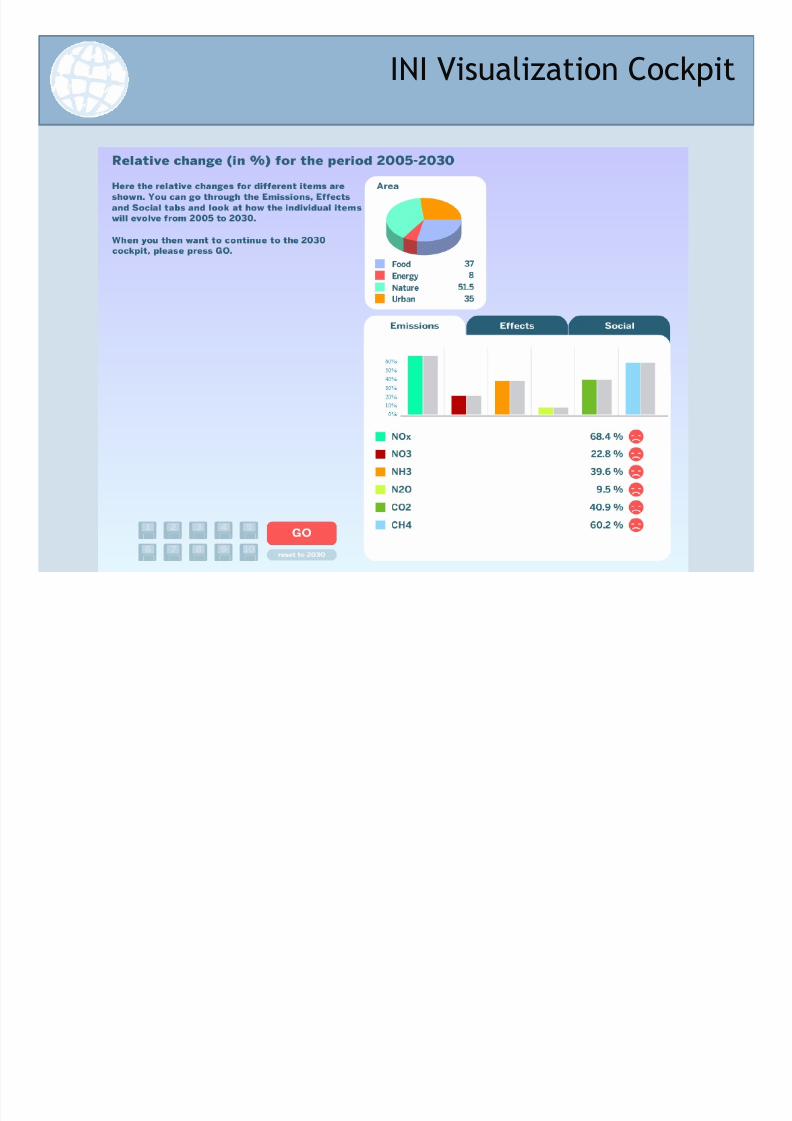
INI Visualization Cockpit
8/8/2019 Living Water Exchange_Promoting Nutrient Reduction Best Practices in the CEE
http://slidepdf.com/reader/full/living-water-exchangepromoting-nutrient-reduction-best-practices-in-the-cee 31/36
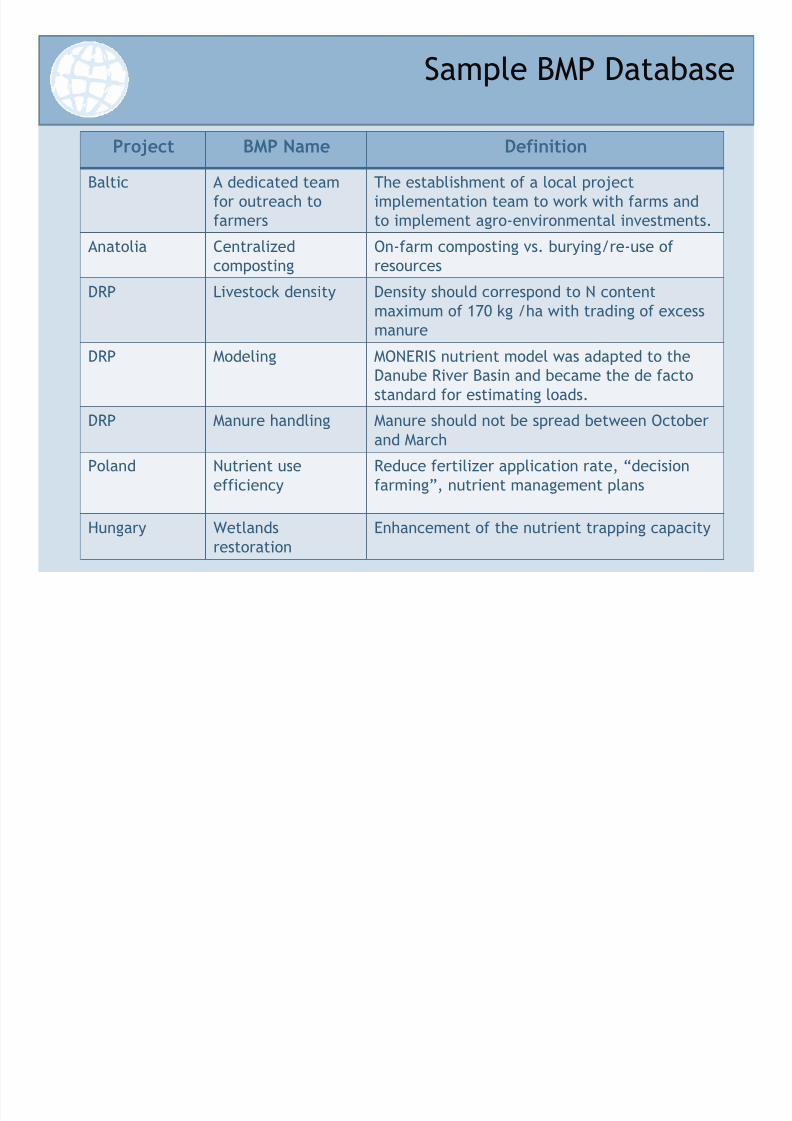
Project BMP Name Definition
Baltic A dedicated teamfor outreach to
farmers
The establishment of a local projectimplementation team to work with farms and
to implement agro-environmental investments.Anatolia Centralized
compostingOn-farm composting vs. burying/re-use ofresources
DRP Livestock density Density should correspond to N contentmaximum of 170 kg /ha with trading of excess
manure
DRP Modeling MONERIS nutrient model was adapted to theDanube River Basin and became the de factostandard for estimating loads.
DRP Manure handling Manure should not be spread between October
and March
Poland Nutrient useefficiency
Reduce fertilizer application rate, “decisionfarming”, nutrient management plans
Hungary Wetlands
restoration
Enhancement of the nutrient trapping capacity
Sample BMP Database
8/8/2019 Living Water Exchange_Promoting Nutrient Reduction Best Practices in the CEE
http://slidepdf.com/reader/full/living-water-exchangepromoting-nutrient-reduction-best-practices-in-the-cee 32/36
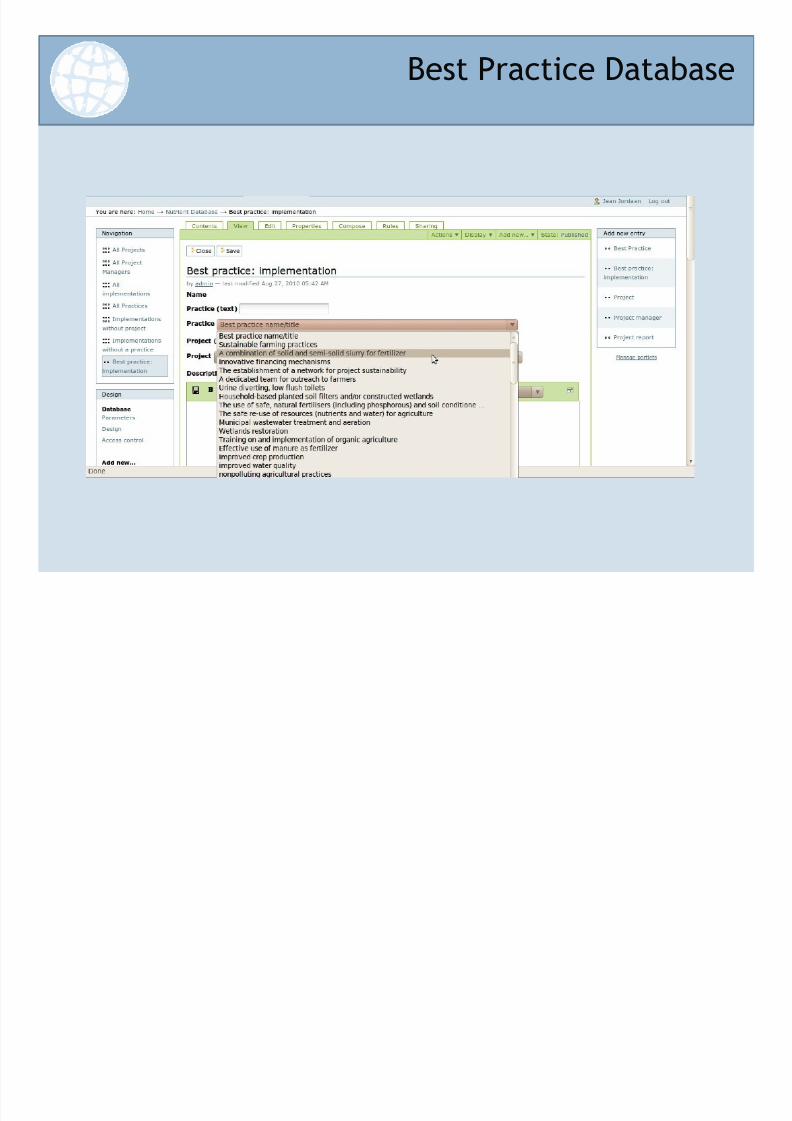
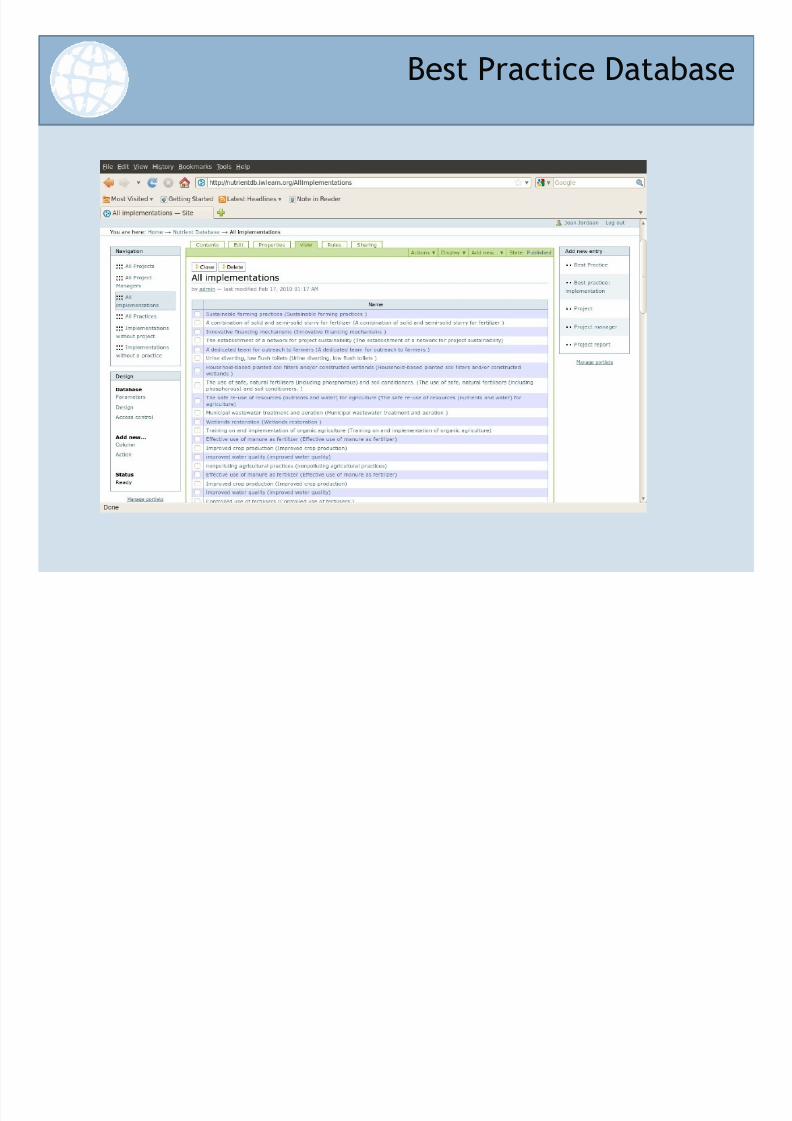
Best Practice Database
8/8/2019 Living Water Exchange_Promoting Nutrient Reduction Best Practices in the CEE
http://slidepdf.com/reader/full/living-water-exchangepromoting-nutrient-reduction-best-practices-in-the-cee 33/36
Best Practice Database
8/8/2019 Living Water Exchange_Promoting Nutrient Reduction Best Practices in the CEE
http://slidepdf.com/reader/full/living-water-exchangepromoting-nutrient-reduction-best-practices-in-the-cee 34/36
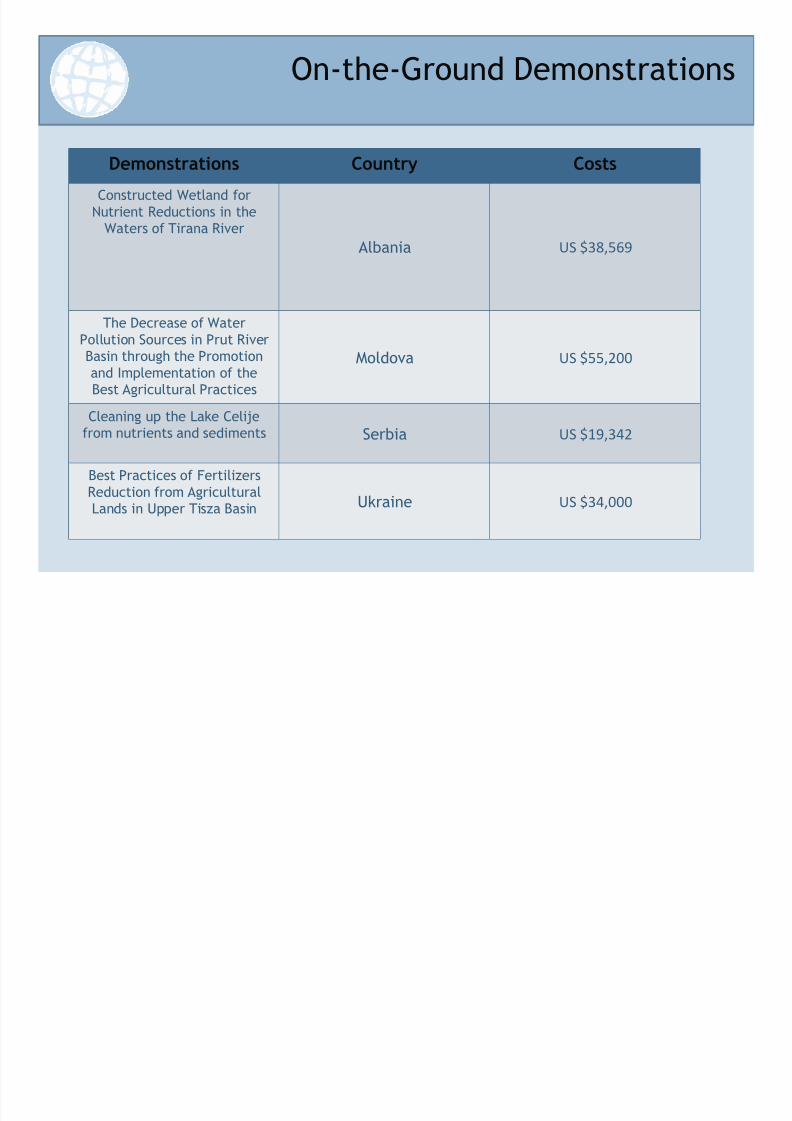
Demonstrations Country Costs
Constructed Wetland forNutrient Reductions in the
Waters of Tirana River
Albania US $38,569
The Decrease of WaterPollution Sources in Prut RiverBasin through the Promotionand Implementation of theBest Agricultural Practices
Moldova US $55,200
Cleaning up the Lake Celije
from nutrients and sediments Serbia US $19,342
Best Practices of FertilizersReduction from AgriculturalLands in Upper Tisza Basin Ukraine US $34,000
On-the-Ground Demonstrations
8/8/2019 Living Water Exchange_Promoting Nutrient Reduction Best Practices in the CEE
http://slidepdf.com/reader/full/living-water-exchangepromoting-nutrient-reduction-best-practices-in-the-cee 35/36
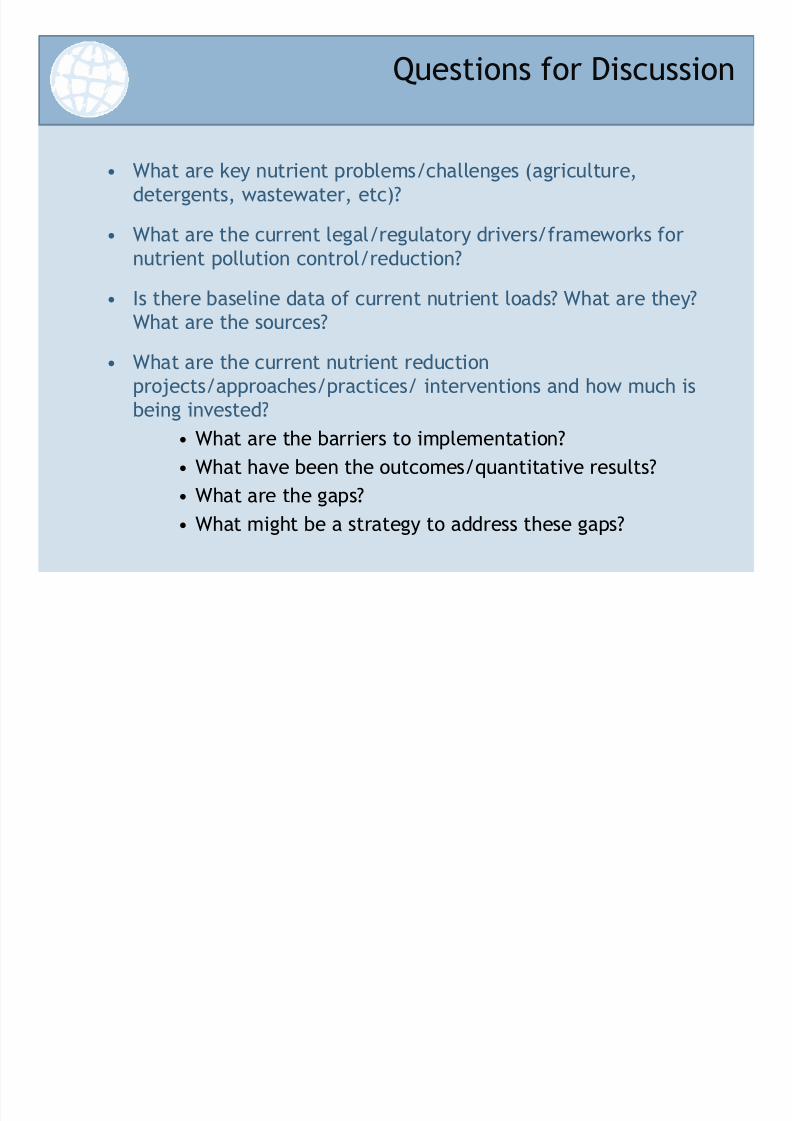
Questions for Discussion
• What are key nutrient problems/challenges (agriculture,detergents, wastewater, etc)?
• What are the current legal/regulatory drivers/frameworks fornutrient pollution control/reduction?
• Is there baseline data of current nutrient loads? What are they?
What are the sources?• What are the current nutrient reduction
projects/approaches/practices/ interventions and how much isbeing invested?
• What are the barriers to implementation?• What have been the outcomes/quantitative results?
• What are the gaps?
• What might be a strategy to address these gaps?

8/8/2019 Living Water Exchange_Promoting Nutrient Reduction Best Practices in the CEE
http://slidepdf.com/reader/full/living-water-exchangepromoting-nutrient-reduction-best-practices-in-the-cee 36/36
Chuck ChaitovitzGlobal Environment & Technology Foundation
703-379-2713
[email protected]://nutrient-bestpractices.iwlearn.org/
Contact Information


