Download - Live Webcast hosted by

“What in the World is G i O ?”Going On?”
Live Webcast hosted by:
Jeffrey Gundlach
Chief Executive Officer
June 4, 2013

Fund OfferingsTotal Return Bond Fund Core Fixed Income Fund
Retail and Institutional ClassNo Load Mutual Fund
Retail and Institutional ClassNo Load Mutual Fund
Total Return Bond Fund Core Fixed Income Fund
Retail Inst.N‐share I‐share
Ticker DLTNX DBLTX
Retail Inst.N‐share I‐share
Ticker DLFNX DBLFXMin Investment $2,000 $100,000Min IRA Investment $500 $5,000Gross Expense Ratio 0.76% 0.51%
Min Investment $2,000 $100,000Min IRA Investment $500 $5,000Gross Expense Ratio 0.80% 0.55%
The Funds’ investment objectives, risks, charges and expenses must be considered carefully before investing. The prospectus contains this and other important information about the Funds, and it may be obtained by calling 1 (877) 354‐6311/ 1 (877) DLINE11, or visiting www.doublelinefunds.com. Read it carefully before investing.Investments in debt securities typically decrease in value when interest rates rise. This risk is usually greater for longer‐term debt securities.Investments in Asset‐Backed and Mortgage‐Backed Securities include additional risks that investors should be aware of such as credit risk, prepayment risk, possible illiquidity and default, as well as increased susceptibility to adverse economic developments. Investments in lower rated and non‐rated securities present a greater risk of loss to principal and interest than higher‐rated securities. The Core Fund invests in foreign securities which involve greater volatility and political, economic and currency risks and differences in accounting methods. These risks are greater for investments in emerging markets. The Fund may use certain types of investment derivatives. Derivatives involve risks different from, and in certain cases, greater than the risks presented by more traditional investments Derivatives may involve certain costs and risk such as liquidity interest rate market credit management and the risk that a position could notinvestments. Derivatives may involve certain costs and risk such as liquidity, interest rate, market, credit, management and the risk that a position could not be closed when most advantageous. Investing in derivatives could lose more than the amount invested.The Total Return Bond Fund intends to invest more than 50% of its net assets in mortgage‐backed securities of any maturity or type.Opinions expressed are subject to change at any time, are not forecasts and should not be considered investment advice.DoubleLine Funds are distributed by Quasar Distributors, LLC.While the Funds are no‐load, management fees and other expenses still apply. Please refer to the prospectus for further details.Past Performance does not guarantee future results. Index performance is not illustrative of fund performance. An investment cannot be made in an index.
1

PerformanceDoubleLine Total Return Bond Fund – Quarter Ending March 31, 2013
March 1Q20131 Year
Annualized
Since Inception Annualized
(4‐6‐10 to 3‐31‐13)I‐share 0.30% 1.27% 7.37% 12.24%N‐share 0.19% 1.12% 7.11% 11.95%Barclays US Aggregate Index 0.08% ‐0.12% 3.77% 5.75%
As of March 31, 2013 I‐share N‐shareGross SEC 30‐Day Yield 3.97% 3.72%Net SEC 30 Day Yield 3 97% 3 72%
Morningstar Intermediate Term Bond Fund Rankings*
As of March 31, 2013 I‐share N‐shareNet SEC 30‐Day Yield 3.97% 3.72%
I‐share N‐shareGross Expense Ratio 0.51% 0.76%
,1‐Year (Absolute Rank) 231 of 1,157 267 of 1,1571‐Year (% Rank) 20% 23%For the period ending 3‐31‐13, Morningstar ranked the Total Return Bond Fund in the 20th and 23rd percentile (for the I and N‐share classes,respectively) among the 1 157 Funds in the Intermediate‐Term Bond Fund
Performance data quoted represents past performance; past performance does not guarantee future results. The investment return and principal value of an investment will fluctuate so that an investor's shares, when redeemed, may be worth more or less than the original cost. Current performance of the fund may be lower or higher than the performance quoted. Performance data current to the most recent month‐end may be
respectively) among the 1,157 Funds in the Intermediate Term Bond Fund category based on total returns.
obtained by calling 213‐633‐8200 or by visiting www.doublelinefunds.com. Barclays US Aggregate Index represents securities that are SEC‐registered, taxable, and dollar denominated. The index covers the US investment grade fixed rate bond market, with index components for government and corporate securities, mortgage pass‐through securities, and asset‐backed securities. These major sectors are subdivided into more specific indices that are calculated and reported on a regular basis. It is not possible to invest in an index.Past Performance does not guarantee future results. Index performance is not illustrative of fund performance. An investment cannot be made in an index.*Morningstar rankings (% Rank) represent a fund's total‐return percentile rank relative to all funds that have the same Morningstar category. The highest
til k i 1 d th l t i 100 M i t R ki (Ab l t ) t f d’ t t l t k l ti t ll f d th t h th M i t
2
percentile rank is 1 and the lowest is 100. Morningstar Rankings (Absolute) represent a fund’s total return rank relative to all funds that have the same Morningstar Category. The highest rank is 1 and the lowest is based on the total number of funds in the category. It is based on Morningstar total return, which includes both income and capital gains or losses and is not adjusted for sales charges or redemption fees.© 2013 Morningstar Inc. All Right Reserved. The information contained herein: (1) is proprietary to Morningstar; (2) may not be copied or distributed; and (3) is not warranted to be accurate, complete or timely. Neither Morningstar nor its content providers are responsible for any damages or losses arising from any use of this information.

PerformanceDoubleLine Core Fixed Income Fund – Quarter Ending March 31, 2013
March 1Q20131‐Year
Annualized
Since Inception Annualized
(6‐1‐10 to 3‐31‐13)
I‐share 0.23% 0.46% 6.53% 9.76%
N‐share 0.21% 0.40% 6.27% 9.49%
Barclays US Aggregate Index 0.08% ‐0.12% 3.77% 5.16%
As of March 31, 2013 I‐share N‐shareGross SEC 30‐Day Yield 3.28% 3.03%Net SEC 30‐Day Yield 3.28% 3.03%
I‐share N‐shareGross Expense Ratio 0.55% 0.80%
Morningstar Intermediate Term Bond Fund Rankings*
As of March 31, 2013 I‐share N‐share1‐Year (Absolute Rank) 363 of 1157 403 of 11571‐Year (% Rank) 32% 35%For the period ending 3‐31‐13, Morningstar ranked the Core Fixed Income
Performance data quoted represents past performance; past performance does not guarantee future results. The investment return and principal value of an investment will fluctuate so that an investor's shares, when redeemed, may be worth more or less than the original cost. Current performance of the fund may be lower or higher than the performance quoted Performance data current to the most recent month‐end may be
Bond Fund in the 32nd and 35th percentile (for the I and N‐share class, respectively) among the 1,157 Funds in the Intermediate‐Term Bond Fund category based on total returns.
performance of the fund may be lower or higher than the performance quoted. Performance data current to the most recent month‐end may be obtained by calling 213‐633‐8200 or by visiting www.doublelinefunds.com. Barclays US Aggregate Index represents securities that are SEC‐registered, taxable, and dollar denominated. The index covers the US investment grade fixed rate bond market, with index components for government and corporate securities, mortgage pass‐through securities, and asset‐backed securities. These major sectors are subdivided into more specific indices that are calculated and reported on a regular basis. It is not possible to invest in an index.Past Performance does not guarantee future results. Index performance is not illustrative of fund performance. An investment cannot be made in an index.*Morningstar rankings (% Rank) represent a fund's total‐return percentile rank relative to all funds that have the same Morningstar category. The highest
3
g g ( ) p p g g y gpercentile rank is 1 and the lowest is 100. Morningstar Rankings (Absolute) represent a fund’s total return rank relative to all funds that have the same Morningstar Category. The highest rank is 1 and the lowest is based on the total number of funds in the category. It is based on Morningstar total return, which includes both income and capital gains or losses and is not adjusted for sales charges or redemption fees.© 2013 Morningstar Inc. All Right Reserved. The information contained herein: (1) is proprietary to Morningstar; (2) may not be copied or distributed; and (3) is not warranted to be accurate, complete or timely. Neither Morningstar nor its content providers are responsible for any damages or losses arising from any use of this information.

AnnouncementsW b NWebcast News –
Bonnie Baha & Robert Cohen – June 25, 2013Floating Rate Fund Launch1:15 pm PDT/4:15 pm EDT1:15 pm PDT/4:15 pm EDT
Jeff Sherman – July 9, 2013Multi‐Asset Growth1:15 pm PDT/4:15 pm EDT
Luz Padilla – July 23, 2013Emerging Markets Fixed Income 1:15 pm PDT/4:15 pm EDT
Jeffrey Gundlach – September 10, 2013Total Return & Core Fixed Income1:15 pm PDT/4:15 pm EDT
To Receive Presentation Slides:You can emailYou can email [email protected]
The Floating Rate Fund will not be available to retail investors until 7/1/2013.
4

“What in the World is G i O ?”Going On?”
Live Webcast hosted by:
Jeffrey Gundlach
Chief Executive Officer
June 4, 2013

TAB ITAB I“Eurozone”
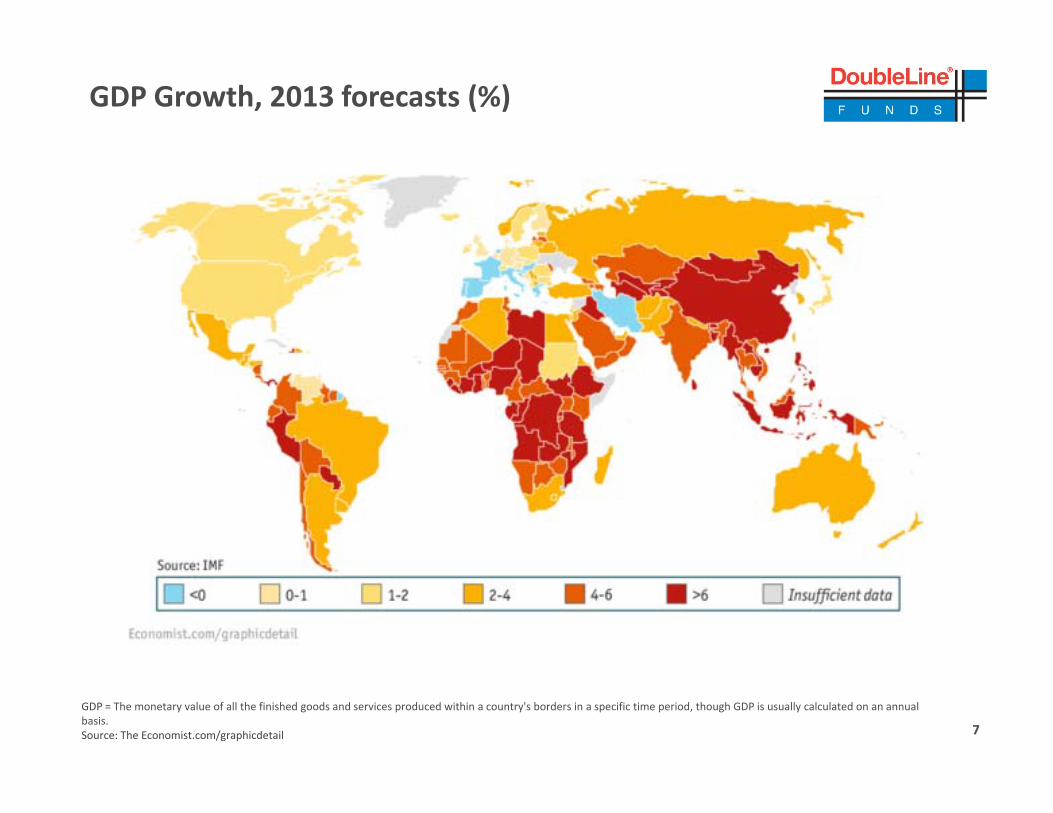
GDP Growth, 2013 forecasts (%)
GDP = The monetary value of all the finished goods and services produced within a country's borders in a specific time period, though GDP is usually calculated on an annual basis.Source: The Economist.com/graphicdetail 7

Global GDP Growth
GDP = The monetary value of all the finished goods and services produced within a country's borders in a specific time period, though GDP is usually calculated on an annual basis.Source: The Economist.com/graphicdetail 8

Global GDP Growth
GDP = The monetary value of all the finished goods and services produced within a country's borders in a specific time period, though GDP is usually calculated on an annual basis.Purchasing Power Parity (PPP) = Purchasing Power Parity is a theory of long‐term equilibrium exchange rates based on relative price levels of two countries. Source: The Economist.com/graphicdetail
9

Eurozone 5‐Year RecessionJanuary 1, 2008 through March 31, 2013
10GDP = The monetary value of all the finished goods and services produced within a country's borders in a specific time period, though GDP is usually calculated on an annual basis.Source: http://www.ritholtz.com/blog/wp‐content/uploads/2013/05/WO‐AN786_Euecon_G_20130515190023.jpg

Eurozone UnemploymentDecember 31, 1998 through April 30, 2013
25
30
Portugal Ireland
Italy Greece
20
25
ent R
ate
April 30, 2013 Spain Germany
Eurozone
15
ne Une
mployme
1, 1998 through
5
10
Eurozo
Decem
ber 3
1
0
11Source: Bloomberg, DoubleLine Capital
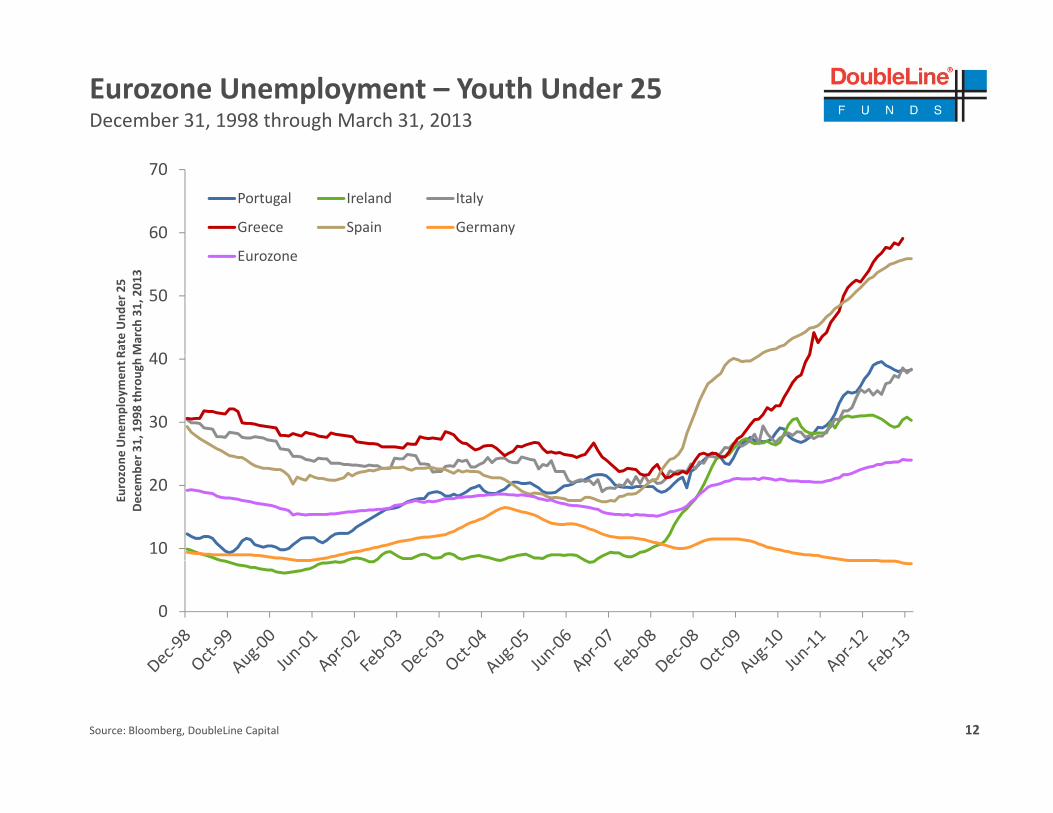
Eurozone Unemployment – Youth Under 25December 31, 1998 through March 31, 2013
60
70Portugal Ireland Italy
Greece Spain Germany
E
40
50
Rate Und
er 25
March 31, 201
3
Eurozone
30
40
ne Une
mploy
men
t Rr 3
1, 199
8 through
10
20
Eurozon
Decem
ber
0
12Source: Bloomberg, DoubleLine Capital

10 Year Sovereign Debt Yields vs. German BundsJanuary 1, 2010 through June 3, 2013
35%
40%
d
Portugal Italy Ireland
G S i
25%
30%
ead to German
Bun
une 03
, 201
3
Greece Spain
15%
20%
ign Deb
t Yield Spre
01, 201
0 through J
5%
10%
10‐Year S
overe
Janu
ary
0%
Jan‐10
Mar‐10
May‐10
Jul‐1
0
Sep‐10
Nov‐10
Jan‐11
Mar‐11
May‐11
Jul‐1
1
Sep‐11
Nov‐11
Jan‐12
Mar‐12
May‐12
Jul‐1
2
Sep‐12
Nov‐12
Jan‐13
Mar‐13
May‐13
13Source: Bloomberg, DoubleLine CapitalGDP = The monetary value of all the finished goods and services produced within a country's borders in a specific time period, though GDP is usually calculated on an annual basis.

TAB IITAB II“U.S.”

10‐Year Forward Breakeven Inflation RateAugust 31, 1998 through April 30, 2013
3
2
2.5
nflation
Rate
0, 2013)
1.5
ward Breakeven
In31, 1998 ‐April 30
0.5
1
Ten‐year Forw
(August
0
ug‐98
n‐99
un‐99
ov‐99
pr‐00
ep‐00
eb‐01
ul‐01
ec‐01
ay‐02
ct‐02
ar‐03
ug‐03
n‐04
un‐04
ov‐04
pr‐05
ep‐05
eb‐06
ul‐06
ec‐06
ay‐07
ct‐07
ar‐08
ug‐08
n‐09
un‐09
ov‐09
pr‐10
ep‐10
eb‐11
ul‐11
ec‐11
ay‐12
ct‐12
ar‐13
15Source: St. Louis Federal Reserve Bank
Au Ja Ju No Ap
Se Fe Ju De
Ma Oc
Ma
Au Ja Ju No Ap
Se Fe Ju De
Ma Oc
Ma
Au Ja Ju No Ap
Se Fe Ju De
Ma Oc
Ma

Consumer Price Index (CPI)January 31, 1958 through April 30, 2013
90%
100%
14
16
e
60%
70%
80%
10
12
gy YoY
% Change
ril 30, 2013)
40%
50%
6
8
ng Food & Energ
ry 31, 1958 ‐A
pr
10%
20%
30%
2
4
CPI excludin
(Januar
0%0
Jan‐58
Oct‐59
Jul‐61
Apr‐63
Jan‐65
Oct‐66
Jul‐68
Apr‐70
Jan‐72
Oct‐73
Jul‐75
Apr‐77
Jan‐79
Oct‐80
Jul‐82
Apr‐84
Jan‐86
Oct‐87
Jul‐89
Apr‐91
Jan‐93
Oct‐94
Jul‐96
Apr‐98
Jan‐00
Oct‐01
Jul‐03
Apr‐05
Jan‐07
Oct‐08
Jul‐10
Apr‐12
16Source: St. Louis Federal Reserve BankCPI = Consumer Price Index measures the weighted average of prices of a basket of consumer goods and services, such as transportation, medical care, etc.YoY = Year‐over‐Year

Debt Type (As a % of GDP)January 1, 1981 through December 31, 2012
250%
300%
Total US Debt Households
Business Financial
Government Total Private
200%
age of GDP
2)
Government Total Private
100%
150%
bt as a Pe
rcen
ta(1981‐2012
50%
100%
Deb
Germany 0%
GDP = The monetary value of all the finished goods and services produced within a country's borders in a specific time period, though GDP is usually calculated on an annual basis.Source: Bloomberg Financial Services, DoubleLine
17

Stock Market Follows Federal Reserve Balance Sheet
18Source: Gluskin Sheff, Business Insider, May 5th, 2013 http://www.businessinsider.com/david‐rosenberg‐bernanke‐wizard‐potemkin‐mauldin‐presentation‐2013‐5?op=1

Deficits Excluding Interest Expense Estimates (E)
$1.00
ons)
$0.50
in Trillio
($
$0.002012 2013 2014 (E) 2015 (E) 2016 (E) 2017 (E)
Deficit = The amount by which expenses exceed income or costs outstrip revenues.Interest Expense = The amount reported by a company or individual as an expense for borrowed money.Source: Bloomberg, DoubleLine
19

Average Treasury Interest Rate Estimates (E)
7%
5%
6%
3%
4%
1%
2%
3%
0%
1%
2012 2013 2014 (E) 2015 (E) 2016 (E) 2017 (E)2012 2013 2014 (E) 2015 (E) 2016 (E) 2017 (E)
Source: Bloomberg, DoubleLine20

$25 94
US Debt, Deficit & Interest Expense Estimates (E)
$23.43
$25.94
1.00
6
1.51
$24
$26Interest ExpenseDeficit ex. Interest ExpenseDebt
$19.41
$21.27
1.00
1.000.86
1.16
$20
$22Debt
ons)
$16.43
$17.81
1.00
1.00
0.36
0.38
0.6
$16
$18
in Trillio
0.97
$14
$16
($
$10
$12
2012 2013 2014 (E) 2015 (E) 2016 (E) 2017 (E)2012 2013 2014 (E) 2015 (E) 2016 (E) 2017 (E)Deficit = The amount by which expenses exceed income or costs outstrip revenues.Interest Expense = The amount reported by a company or individual as an expense for borrowed money.U.S. Debt = The United States debt is the outstanding amount owed by the federal government of the United States from the issue of securities by the Treasury and other federal government agencies.Bloomberg, DoubleLine
21

Corporate Income Tax Rates January 1, 1947 through December 31, 2011
Source: Bungalow Bill’s Conservative Wisdom, May 10, 2011 http://bungalowbillscw.blogspot.com/2011/05/corporate‐tax‐rates‐in‐united‐states.htmlOECD = Organization for Economic Co‐operation and Development 22

Corporate Income Tax Rates January 1, 1947 through December 31, 2012
GDP = The monetary value of all the finished goods and services produced within a country's borders in a specific time period, though GDP is usually calculated on an annual basis.Source: The Economist
23

Corporate Profits Hit All Time High As % of GDPJanuary 1, 1947 through March 31, 2012
0.10
0.11
0.08
0.09
Nom
inal GDP
0.06
0.07
Corporate Profits
/
0.04
0.05
C
0.02
0.03
Jan‐47 Jan‐57 Jan‐67 Jan‐77 Jan‐87 Jan‐97 Jan‐07
Source: http://www.businessinsider.com/corporate‐profits‐just‐hit‐an‐all‐time‐high‐wages‐just‐hit‐an‐all‐time‐low‐2012‐6?utm_source=feedburner&utm_medium=feed&utm_campaign=Feed%3A+clusterstock+%28ClusterStock%29&utm_content=Google+ReaderGDP = Gross domestic product (GDP) is the monetary value of all the finished goods and services produced within a country’s borders in a specific time period, though GDP is usually calculated on an annual basis.Shaded areas indicate U.S. Recessions.
24

Corporate Profitability By Industry
Source: The Economist “Corporate –tax Reform: The Trouble with Tax reform”, Pelican Parts http://forums.pelicanparts.com/off‐topic‐politics‐religion/631503‐why‐does‐government‐give‐tax‐breaks.html. As of September 30, 2011
25
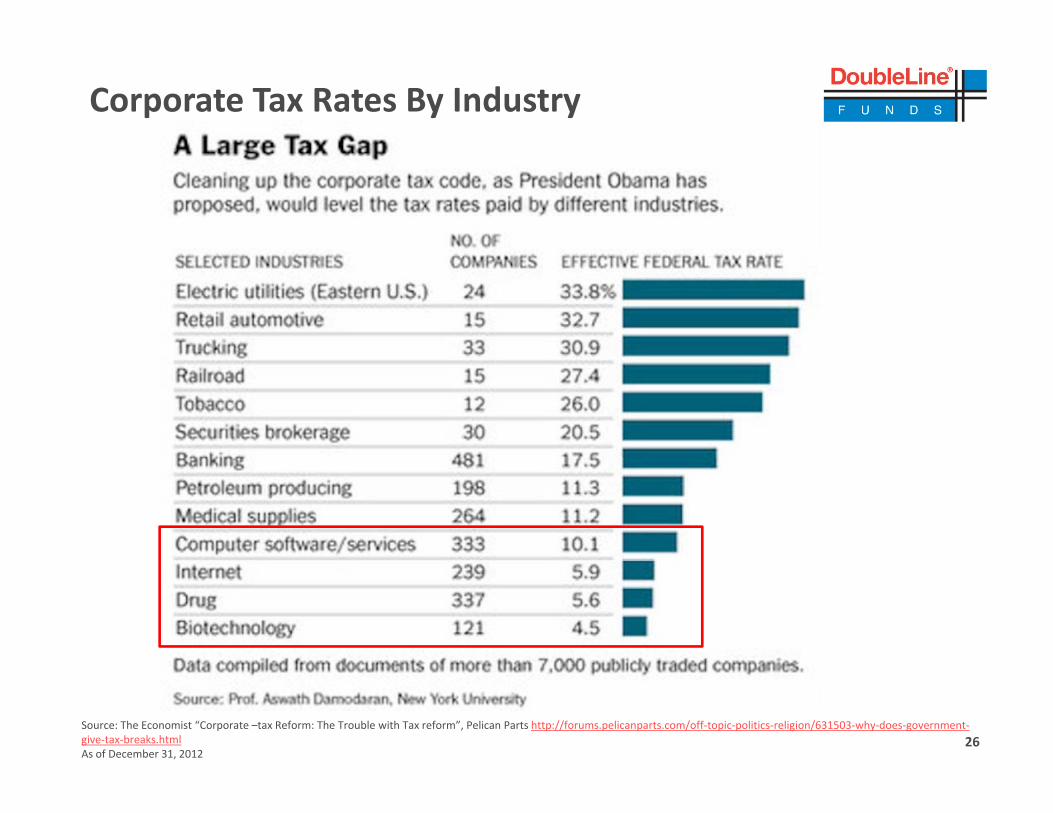
Corporate Tax Rates By Industry
Source: The Economist “Corporate –tax Reform: The Trouble with Tax reform”, Pelican Parts http://forums.pelicanparts.com/off‐topic‐politics‐religion/631503‐why‐does‐government‐give‐tax‐breaks.htmlAs of December 31, 2012
26

U.S. Median Household Income Stagnant
?
As of December 31, 2011. Source: Bloomberg 27

US Personal Income Less Current Transfer ReceiptsDecember 1, 2001 through March 30, 2013
1000
1200
10500
11000
al
Transfer Receipts (RHS)
Personal Income (LHS)
US Personal Income less Current Transfer Receipts (Real)
800
1000
9000
9500
10000
e Re
alh 20
13)
pts Ind
ex Value
Rea
h 20
13
600
8000
8500
9000
snfer R
eceipts V
alue
embe
r 200
1 ‐M
arc
Income Less Receip
embe
r 200
1 ‐M
arch
200
400
7000
7500
Tras
(Dece
Person
al In
come/
Dece
06000
6500
ec‐01
pr‐02
ug‐02
ec‐02
pr‐03
ug‐03
ec‐03
pr‐04
ug‐04
ec‐04
pr‐05
ug‐05
ec‐05
pr‐06
ug‐06
ec‐06
pr‐07
ug‐07
ec‐07
pr‐08
ug‐08
ec‐08
pr‐09
ug‐09
ec‐09
pr‐10
ug‐10
ec‐10
pr‐11
ug‐11
ec‐11
pr‐12
ug‐12
ec‐12
28
Source: Bureau of Economic Analysis, DoubleLine CapitalDisposable personal income. Total after‐tax income received by persons; it is the income available to persons for spending or saving. Related terms: Personal consumption expenditures (PCE), Personal income, Personal saving.Personal current transfer receipts. Consists of income payments to persons for which no current services are performed and net insurance settlements. It is the sum of government social benefits and net current transfer receipts from business.
De Ap Au De Ap Au De Ap Au De Ap Au De Ap Au De Ap Au De Ap Au De Ap Au De Ap Au De Ap Au De Ap Au De

Average Hourly EarningsJanuary 1, 1985 through April 30, 2013
29Source: St. Louis Federal Reserve Bank
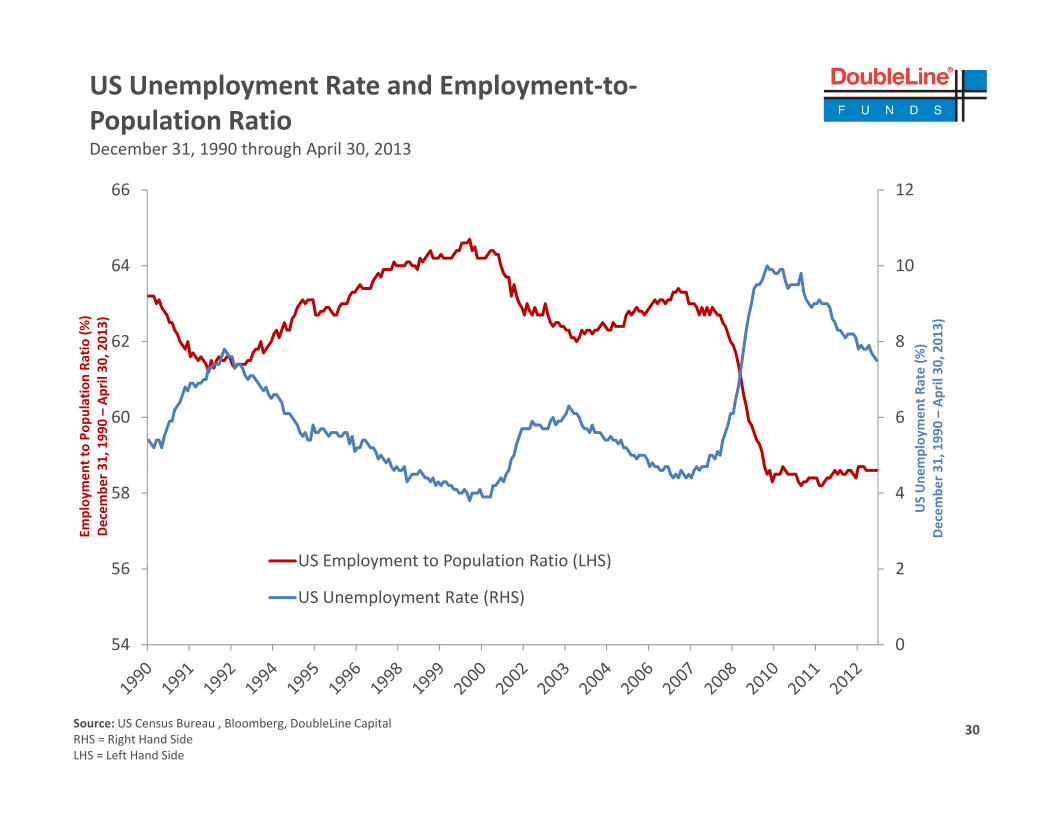
US Unemployment Rate and Employment‐to‐Population RatioDecember 31 1990 through April 30 2013December 31, 1990 through April 30, 2013
1266
8
10
62
64
%) 2013
)
tio (%
), 201
3)
660
mploymen
t Rate (%
, 199
0 –Ap
ril 30,
to Pop
ulation Ra
1, 199
0 –Ap
ril 30,
458
US Une
mDecem
ber 3
1
Employmen
t Decem
ber 3
1
US Employment to Population Ratio (LHS)
0
2
54
56 US Employment to Population Ratio (LHS)
US Unemployment Rate (RHS)
30Source: US Census Bureau , Bloomberg, DoubleLine CapitalRHS = Right Hand SideLHS = Left Hand Side
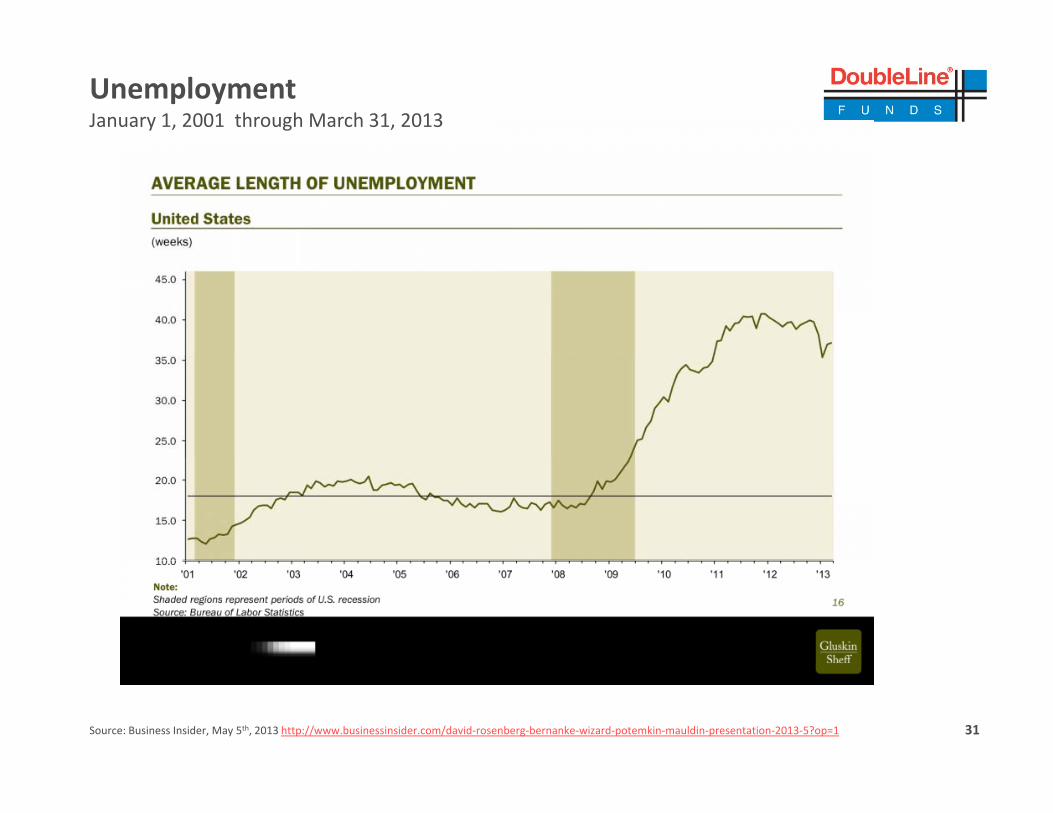
UnemploymentJanuary 1, 2001 through March 31, 2013
31Source: Business Insider, May 5th, 2013 http://www.businessinsider.com/david‐rosenberg‐bernanke‐wizard‐potemkin‐mauldin‐presentation‐2013‐5?op=1

Labor Participation Rates by Age GroupJanuary 1, 1990 through 2020 Projected Estimates
http://www.calculatedriskblog.com/2012/10/understanding‐decline‐in‐participation.html
Source: Calculated Risk Blog
32

Gallup Opinion PollJanuary 1, 1991 through March 31, 2013
Source: http://www.ritholtz.com/blog/wp‐content/uploads/2013/05/retire.jpg 33

Gallup Opinion PollJanuary 1, 1991 through March 31, 2013
• Survey of percentage of people that believe they will retire before age 65, at age 65 or over the age of 65
Source: http://www.ritholtz.com/blog/wp‐content/uploads/2013/05/retire‐2.jpg 34

Labor Participation January 1, 2001 through March 31, 2013
• If educated labor participation is falling, where will skilled labor come from in the U.S?
35Source: Gluskin Sheff, Business Insider, May 5th, 2013 http://www.businessinsider.com/david‐rosenberg‐bernanke‐wizard‐potemkin‐mauldin‐presentation‐2013‐5?op=1

TAB II“ f ”“Bloodless Verdict of the Market”

BofA/Merrill Fixed Income Index Returns
Grey = Year 2012Blue = Year‐To‐Date 2013
3 84%
12.00%15.44%
13.63%
High Yield (JOAO)
Convertibles (VOSO)
‐3.30%
3.84%
9.52%
18.30%
Corporate (COAO)
International‐Emerging (IGOV)
0.31%
‐0.50%
2 59%
3.28%International‐Developed (NOGO)
Corporate (COAO)
‐1.04%
‐1.17%2.19%
2.59%
Government (G0A0)
Mortgages (MOAO)
37Data Source: BofA/Merrill Lynch Indices through year‐end December 31, 2012 and June 3, 2013 for the respective years indicated.Please see the Appendix for index definitions. An investment cannot be made directly in an index.
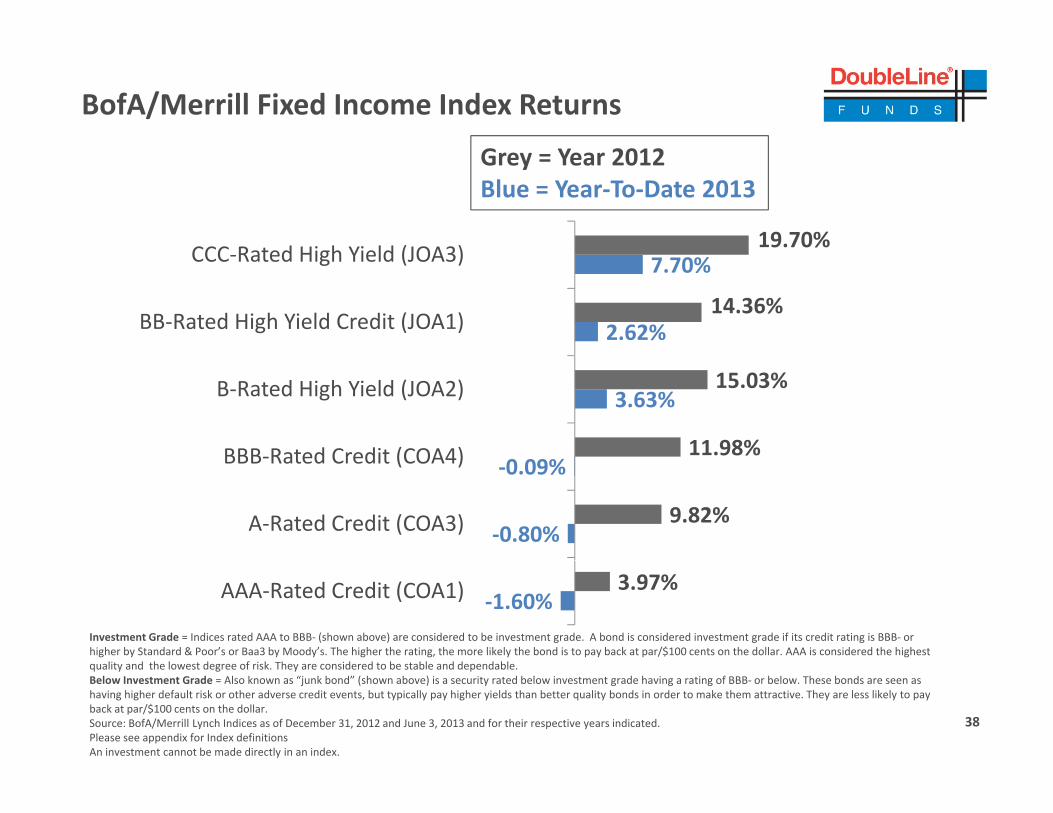
BofA/Merrill Fixed Income Index Returns
G Y 2012
19.70%CCC Rated High Yield (JOA3)
Grey = Year 2012Blue = Year‐To‐Date 2013
2.62%
7.70%
14.36%BB‐Rated High Yield Credit (JOA1)
CCC‐Rated High Yield (JOA3)
3.63%
11.98%
15.03%
BBB‐Rated Credit (COA4)
B‐Rated High Yield (JOA2)
‐0.80%
‐0.09%
9.82%A‐Rated Credit (COA3)
BBB‐Rated Credit (COA4)
‐1.60%3.97%AAA‐Rated Credit (COA1)
Investment Grade = Indices rated AAA to BBB‐ (shown above) are considered to be investment grade. A bond is considered investment grade if its credit rating is BBB‐ or higher by Standard & Poor’s or Baa3 by Moody’s. The higher the rating, the more likely the bond is to pay back at par/$100 cents on the dollar. AAA is considered the highest
lit d th l t d f i k Th id d t b t bl d d d bl
38
quality and the lowest degree of risk. They are considered to be stable and dependable.Below Investment Grade = Also known as “junk bond” (shown above) is a security rated below investment grade having a rating of BBB‐ or below. These bonds are seen as having higher default risk or other adverse credit events, but typically pay higher yields than better quality bonds in order to make them attractive. They are less likely to pay back at par/$100 cents on the dollar.Source: BofA/Merrill Lynch Indices as of December 31, 2012 and June 3, 2013 and for their respective years indicated.Please see appendix for Index definitionsAn investment cannot be made directly in an index.

Global Equity Performance – Price ReturnJanuary 1, 2013 through June 4, 2013
27.58%28.00%
Global Equity Performance(YTD Price Return)
15.02%16.41%
14.77%16.62%
8 85%10.64%13.00%
18.00%
23.00%
8.85%7.68%
1.33%
‐0 37%
0.95%
4.48%
‐2.00%
3.00%
8.00%
‐11.50%
‐5.97%
‐1.65%0.37%
‐12.00%
‐7.00%
2.00%
‐17.00%
Source: Bloomberg; DoubleLine. Performance in local currencies. YTD Returns as of June 4, 2013.Please see Appendix for Index definitions.DXY = US Dollar Spot Index. US dollar index indicating the general international value of the US dollar by averaging the exchange rates between US dollar and major world currencies.An investment cannot be made in and index.
39

U.S. Bond, Currency, and Commodity Performance –Total ReturnJanuary 1 2013 through June 4 2013January 1, 2013 through June 4, 2013
12.52%15.00%
US Bond, Currency, and Commodities Performance1(YTD Total Return)
3.62%
0.00%
5.00%
10.00%
‐2.02%
‐5.28%
‐0.89%
‐12.88%
‐8.04%
‐0.35%
‐10.49%
‐3.75% ‐3.43%
‐9.66%
‐15.00%
‐10.00%
‐5.00%
12.88%
‐16.05%
30 00%
‐25.00%
‐20.00%
15.00%
Source: Bloomberg; DoubleLineDXY = US Dollar spot price, EUR = Euro spot price, JPY = Japanese Yen spot priceCopper, Gold , Crude‐Oil and Natural Gas are quoted in spot prices. Wheat and Corn are quoted in units per bushel.
‐30.00%UST 10yr UST 30yr DXY EUR JPY Copper Gold Crude Oil NatGas Wheat Corn CRB Index VIX
Copper, Gold , Crude Oil and Natural Gas are quoted in spot prices. Wheat and Corn are quoted in units per bushel.CRB =The TR/J CRB Commodity Excess Return Index is an arithmetic average of commodity futures prices with monthly rebalancing.VIX = Market Volatility Index, a popular measure of the implied volatility of S&P 500 index options. Notes: (1) Returns YTD ending June 4, 2013 ; (2) Based on BofA Merrill Lynch Current 10yr UST Index ; (3) Based on BofA Merrill Lynch Current 30yr UST Index; (4) Based on S&P GSCI Index representing a single name commodity Excess Return.UST 10 and 30, S&P GSCI = Please see the appendix for Index definitions.You cannot invest directly in an index.
40

Global Equity Performance ‐ Price Return in US Dollars (USD)January 1, 2013 through June 4, 2013
15 02%16.41%
14 77%16.62%
20.00%
Global Equity Performance(YTD Price Return in USD)
15.02% 14.77%
7.71%6.76%
4.46%3 03%
10.66%
5.00%
10.00%
15.00%
‐4.96%
‐1.80%
3.03%
‐4.91%
‐2.03% ‐1.71%‐5.00%
0.00%
5.00%
‐15.30%
4.96% 9 %
‐15.00%
‐10.00%
‐20.00%
Source: Bloomberg; DoubleLine, YTD Returns as of June 4, 2013.Please see Appendix for index definitions.DXY = US Dollar Spot Index. US dollar index indicating the general international value of the US dollar by averaging the exchange rates between US dollar and major world currencies.An investment cannot be made directly in and index.
41

Performance Since Inception QE2 October 4, 2011 through June 3, 2013
Source: Bloomberg Financial ServicesCRY = TR/J CRB Commodities Excess Return Index is an arithmetic average of commodity futures process with monthly rebalancing.SPX = Standard & Poor’s 500 Index is a capitalization‐weighted index of 500 stocks. The index is designed to measure performance of the broad domestic economy.TLT = iShares Barclays 20+ Year Treasury Bond Fund in an exchange traded fund incorporated in the USA.You cannot directly invest in an index.
42

What Did the Aggregate QE programs Give us?
QE = Quantitative Easing programs. Source: Bloomberg, DoubleLine CapitalPlease see Appendix for S&P 500 definition. You cannot invest directly in an index. 43

What Did the Aggregate QE programs Give us?
QE = Quantitative Easing programs. Source: Bloomberg, DoubleLine CapitalUS Treasury performance as measured by the BofA/Merrill Lynch US Treasury (GOQO) index. Please see Appendix for index definition. You cannot invest directly in an index
44

Shanghai Index December 31, 2009 through June 4, 2013
Source: Bloomberg Financial Services, DoubleLine Capital LPNote: The Shanghai Stock Exchange Composite is a capitalization‐weighted index tracking daily price performance of all A and B‐shares listed on the Shanghai Stock Exchange. This index was developed December 19, 1990 with a base value of 100.An investment cannot be made directly in an index.
45
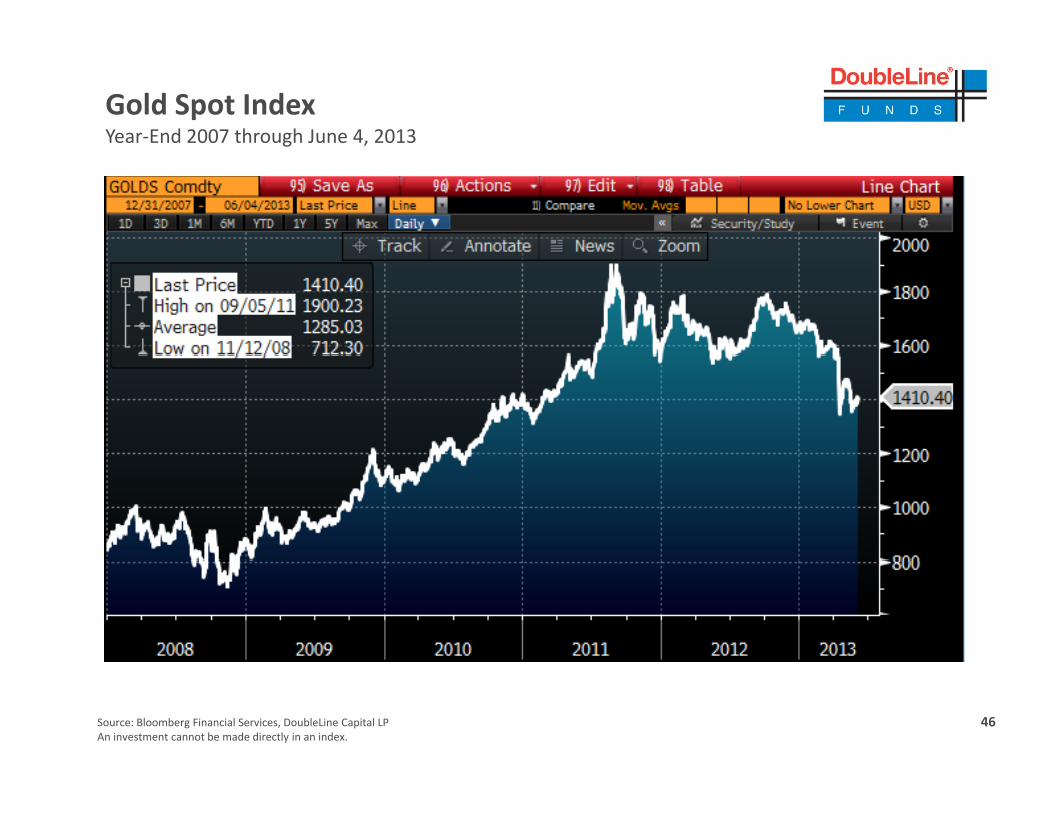
Gold Spot Index Year‐End 2007 through June 4, 2013
Source: Bloomberg Financial Services, DoubleLine Capital LPAn investment cannot be made directly in an index.
46
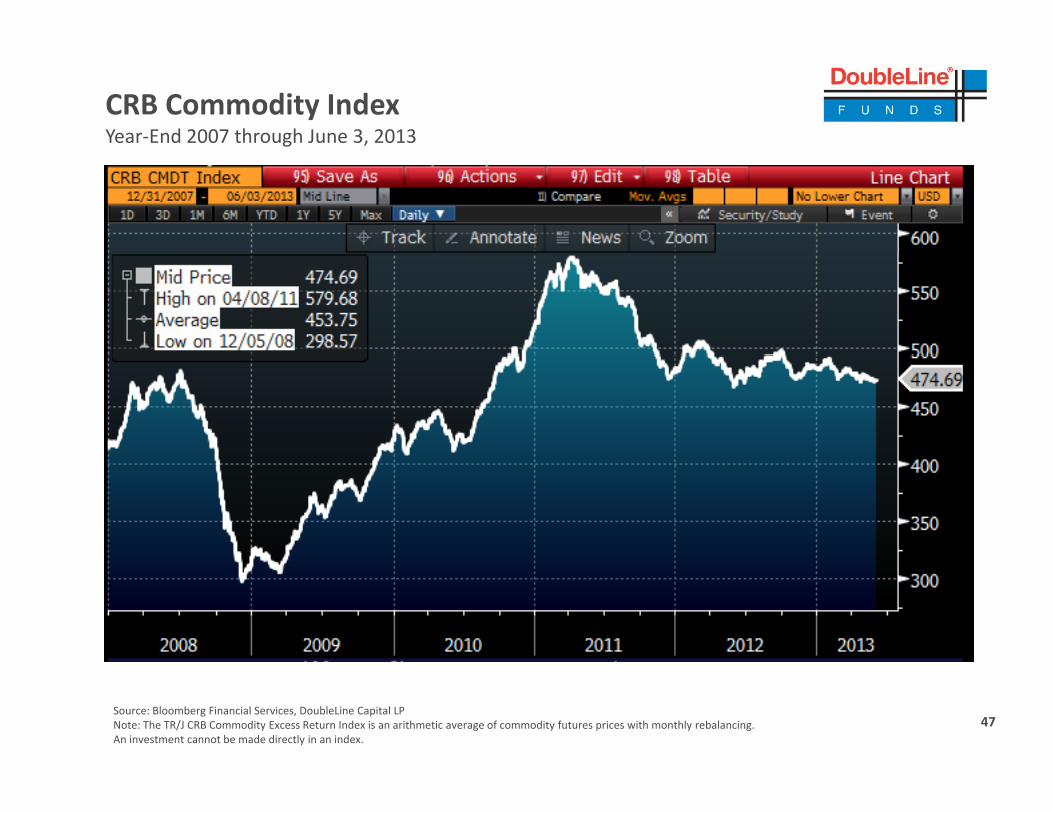
CRB Commodity Index Year‐End 2007 through June 3, 2013
Source: Bloomberg Financial Services, DoubleLine Capital LPNote: The TR/J CRB Commodity Excess Return Index is an arithmetic average of commodity futures prices with monthly rebalancing.An investment cannot be made directly in an index.
47

TAB IIIHousing and MBS Market Trends
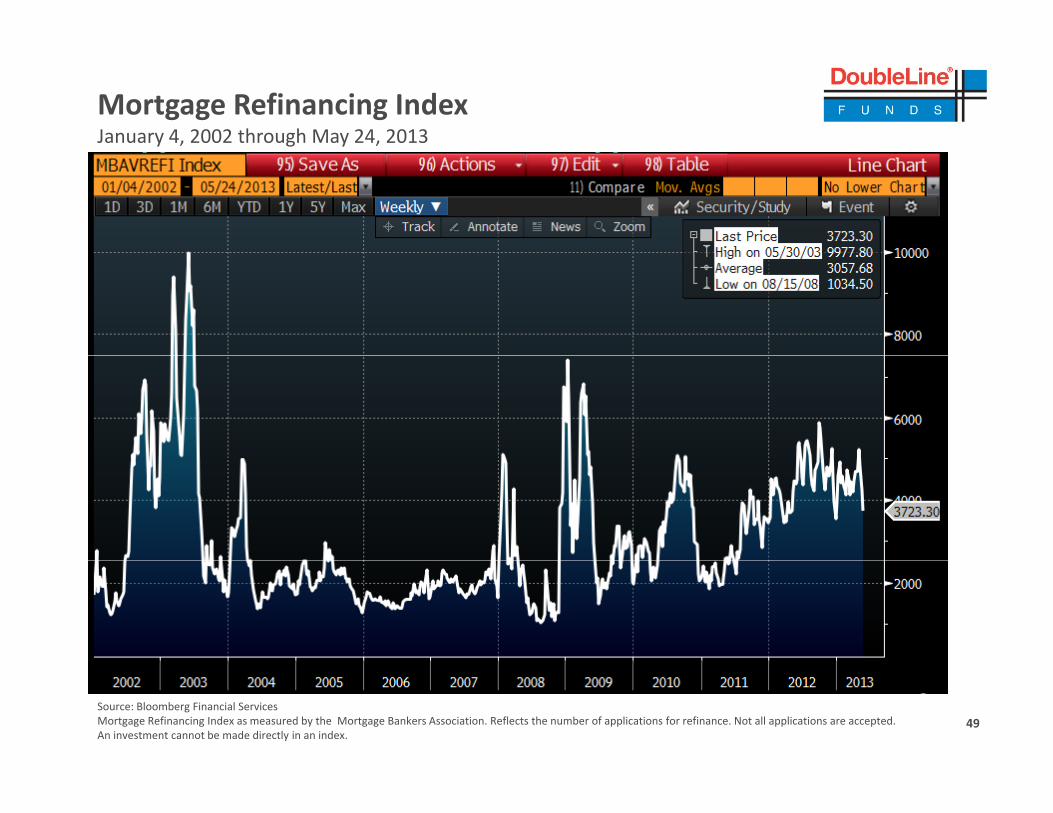
Mortgage Refinancing IndexJanuary 4, 2002 through May 24, 2013
Source: Bloomberg Financial Services Mortgage Refinancing Index as measured by the Mortgage Bankers Association. Reflects the number of applications for refinance. Not all applications are accepted.An investment cannot be made directly in an index.
4949

30‐Year U.S. Mortgage RatesDecember 31, 2007 through June 3, 2013
Source: Bloomberg Financial Services, Bankrate.comILM3NAVG = The Overnight National Average of the U.S. 30 year Treasury interest rate. They help consumers see the movement of rates day‐to‐day. Subject to one day lag.
5050

Home Price Index Levels and Year‐Over‐Year ChangeJanuary 1, 2000 and January 1, 2001 through March 31, 2013
Source: Bloomberg Financial Services, Case‐ShillerS& /C Shill H i I d i i d f i h i hi h f ll i b f 20 li k 10 Ci I d Chi L V L
5151
S&P/Case‐Shiller Home Price Index is comprised of price changes within the following subset of 20 metropolitan markets: 10 –City Index Boston, Chicago, Denver, Las Vegas, Los Angeles, Miami, New York, San Diego, San Francisco and Washington DC. In addition to the 10‐City Index it includes: Atlanta, Charlotte, Cleveland, Dallas, Detroit, Minneapolis, Phoenix, Portland, Seattle, and Tampa.Core Logic National Housing Price Index (HPI) = Core Logic is a leading provider of information and analytics. This index covers 6,208 zip codes, 572 statistical areas and 1,027 counties located in all 50 states and District of Columbia. It is a national average.An investment cannot be made directly in an index.

ABX AAA 07‐1 IndexJanuary 1, 2010 through June 4, 2013
Source: Bloomberg Financial Services, DoubleLine Capital LPThe ABX 07‐1 AAA Index is a basket of home equity. Constituted from reference obligations issued by 20 issuers of residential mortgage‐backed securities.An investment cannot be made directly in an index.
52

Non‐Agency RMBS 60++ Delinquency RateJanuary 31, 2005 through April 30, 2013
50%
60%
PrimeAlt‐A
37.7%
40%
Delinqu
encies
ough
April 20
13 Subprime
22.4%
20%
30%
60++
Serious D
Janu
ary 20
05 th
r
10.7%10%
0%
Serious Delinquencies is defined by mortgages that are 60++ delinquency rates defined as loans 60 or 90 days late in mortgage payments, or already in foreclosure or REO status.Prime defined as FICO > 725 and LTV < 75Alt‐A defined as FICO 675‐725; or FICO > 725 and LTV >= 75Subprime defined as FICO < 675Source: Loan Performance, Vichara, DoubleLine Capital as of April 30, 2013.
53

Non‐Agency RMBS Conditional Default RateJanuary 31, 2005 through April 30, 2013
16%
18%
Prime
10%
12%
14%
gh April 20
13
Alt‐A
Subprime
7.9%
8.3%
6%
8%
10%
CDR
anua
ry 200
5 throug
3.7%2%
4%
Ja
i li i i d fi d b h d li d fi d l d l i l d i f l
0%
54
Serious Delinquencies is defined by mortgages that are 60++ delinquency rates defined as loans 60 or 90 days late in mortgage payments, or already in foreclosure or REO status.Prime defined as FICO > 725 and LTV < 75Alt‐A defined as FICO 675‐725; or FICO > 725 and LTV >= 75Subprime defined as FICO < 675Source: Loan Performance, Vichara, DoubleLine Capital as of April 30, 2013.

Non‐Agency RMBS Loss SeverityJanuary 31, 2005 through April 30, 2013y , g p ,
71.7%80%
90%
Prime
Alt‐A
57.7%50%
60%
70%
y April 20
13
Subprime
44.8%
30%
40%
50%
Loss Severity
uary 200
5 through
10%
20%
Jan
0%
55
Serious Delinquencies is defined by mortgages that are 60++ delinquency rates defined as loans 60 or 90 days late in mortgage payments, or already in foreclosure or REO status.Prime defined as FICO > 725 and LTV < 75Alt‐A defined as FICO 675‐725; or FICO > 725 and LTV >= 75Subprime defined as FICO < 675Source: Loan Performance, Vichara, DoubleLine Capital as of April 30, 2013.

Non‐Agency RMBS Conditional Repayment RateJanuary 31, 2005 through April 30, 2013
40%
45%
PrimeAlt‐A
30%
35%
ugh Ap
ril 201
3
Subprime
20.0%
15%
20%
25%
CRR
Janu
ary 20
05 th
rou
9.0%
3.1%5%
10%
J
0%
Serious Delinquencies is defined by mortgages that are 60++ delinquency rates defined as loans 60 or 90 days late in mortgage payments, or already in foreclosure or REO status.Prime defined as FICO > 725 and LTV < 75Alt‐A defined as FICO 675‐725; or FICO > 725 and LTV >= 75Subprime defined as FICO < 675Source: Loan Performance, Vichara, DoubleLine Capital as of April 30, 2013.
56

bl i d i
TAB IVDoubleLine Funds Overview
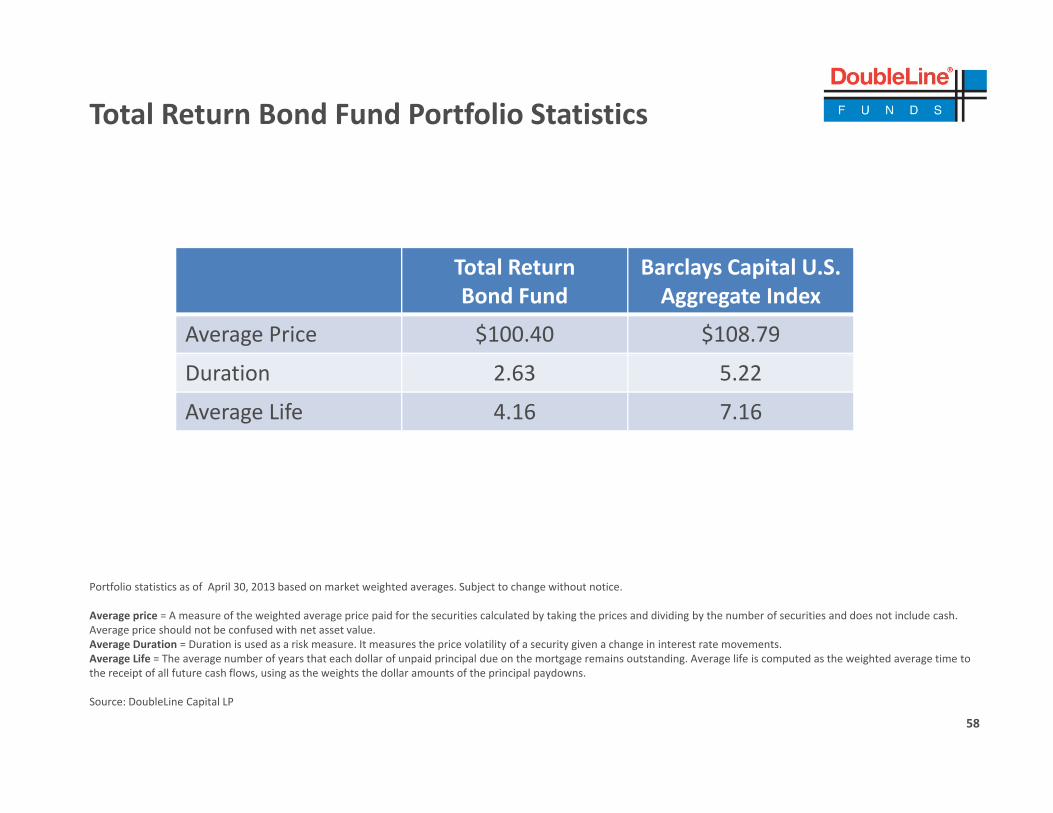
Total Return Bond Fund Portfolio Statistics
Total Return Bond Fund
Barclays Capital U.S. Aggregate Index
Average Price $100.40 $108.79
Duration 2.63 5.22
Average Life 4.16 7.16
Portfolio statistics as of April 30, 2013 based on market weighted averages. Subject to change without notice.
Average price = A measure of the weighted average price paid for the securities calculated by taking the prices and dividing by the number of securities and does not include cash. Average price should not be confused with net asset value.Average Duration = Duration is used as a risk measure. It measures the price volatility of a security given a change in interest rate movements.Average Life = The average number of years that each dollar of unpaid principal due on the mortgage remains outstanding. Average life is computed as the weighted average time to g g y p p p g g g g p g gthe receipt of all future cash flows, using as the weights the dollar amounts of the principal paydowns.
Source: DoubleLine Capital LP
58

Total Return Bond Fund Portfolio Composition –By Security Type
Cash15.0%
Other2.9%
Government4.8%
CMBS
Non Agency25.8%
CMBS5.7%
Agency45.8%
Portfolio composition as of May 31, 2013. Subject to change without notice.Source: DoubleLine Capital LP. Sector allocations are subject to change and should not be considered a recommendation to buy or sell any security.
Cash = The value of assets that can be converted into cash immediately. Can include marketable securities, such as government bonds, banker's acceptances, cash equivalents on balance sheets that may include securities that mature within 90 days.Government – U.S. treasury securities.Agency = Mortgage securities whose principal and interest guaranteed by the U.S. Government agency including Fannie Mae (FNMA) or Freddie Mac (FHLMC).Non‐Agency = Residential Mortgages Bond Securities are a type of bond backed by residential mortgages. Non‐Agency means they were issued by a private issuer.CMBS = Commercial Mortgage‐Backed Securities. Securitized loans made on commercial rather than residential property.Other = Collateralized Mortgage Obligations (CLOs)
59

Total Return Bond Fund Portfolio Composition –By Collateralize Mortgage Obligation (CMO) Security Type
IO Current, 0.9%
IO Locked, 0.0%
Cash, 15.0%CMO Current
CMO Locked, 10.5%
Agency CMO Composition
Cash 15.0%Inverse Floater 0.8%
Inverse Floater, 0.8%
Current, 4.3% Pass‐Through 29.2%
CMO Current 4.3%CMO Locked 10.5%IO Current 0.9%IO Locked 0 0%
P tf li iti f M 31 2013 S bj t t h ith t ti
Pass‐Through, 29.2%
IO Locked 0.0%Subtotal 60.8%
Portfolio composition as of May 31, 2013. Subject to change without notice.Source: DoubleLine Capital LP. Sector allocations are subject to change and should not be considered a recommendation to buy or sell any security.
Cash = The value of assets that can be converted into cash immediately. Can include marketable securities, such as government bonds, banker's acceptances, cash equivalents on balance sheets that may include securities that mature within 90 days.Pass‐Through = Mortgage pass‐through securities whose principal and interest guaranteed by the U.S. Government agency including Fannie Mae (FNMA) or Freddie Mac (FHLMC) or non‐agency private issue with no government guarantee.CMO Current = Collateralized Mortgage Obligation (CMO) is a financial debt vehicle/special purpose entity called a “pool”. Investors buy bonds issued by the entity and receive payments g g g ( ) / p p p y p y y y p yaccording to a defined set of rules. The mortgages themselves are the collateral, the bonds are the tranches (also called classes), and the set of rules that dictates how money is received from the collateral will be distributed is called the structure. The legal entity, collateral and structure are collectively referred to as the deal.IO = Interest Only mortgage pools in which the borrower’s monthly payment is only toward the interest on the loan. A non‐amortized loan.Inverse Floater = A mortgage pool that has a yield that is inversely related to interest rates.IO Current pay = Loans that are currently receiving principal payments.Locked Out/ CMO Locked Out = Loans that for a set period of time will not receive principal payments.
60

Total Return Bond Fund Portfolio –Non‐Agency Residential Mortgage‐Backed Securities (RMBS) Breakdown By Original Rating(RMBS) Breakdown By Original Rating
A
BBB+0%
BBB3%
Non‐Agency Original Credit
AA+0%
AA0%
A1%
A‐0% NR
9%
AAA87%
Portfolio composition and credit ratings as of security origination. Portfolio composition is subject to change without notice. There are some non‐rated securities in the Fund as shown in the graph above. Credit distribution is determined from the highest available credit rating from any Nationally Recognized Statistical Rating Organization (S&P, Moody’s, and Fitch).
Investment Grade = Securities rated AAA to BBB‐ are considered to be investment grade. A bond is considered investment grade if its credit rating is BBB‐ or higher by Standard & $Poor’s or Baa3 by Moody’s. Ratings based on corporate bond model. The higher the rating, the more likely the bond is to pay back at par/$100 cents on the dollar. AAA is considered the
highest quality and the lowest degree of risk. They are considered to be extremely stable and dependable.Below Investment Grade = Also known as “junk bond” is a security rated below investment grade having a rating of BBB‐ or below. These bonds are seen as having higher default risk or other adverse credit events, but typically pay higher yields than better quality bonds in order to make them attractive. They are less likely to pay back at par/$100 cents on the dollar.NR = Not Rated . Securities that are not rated by the three rating agencies.Credit quality may be assessed by different agencies for different bonds for reasons beyond the control of the Fund. Source: DoubleLine Capital LP as of May 31, 2013.
61

Total Return Bond Fund Portfolio –Non‐Agency RMBS Breakdown By Current Credit Quality
AAA0%
AA+0%AA
0%A+2%A1%
A‐0%
BBB+3%BBB1%
BBB‐0% BB+
3%BB1%NR
9% BB‐1%
B+2%
B3%
D16%
9%
3%
B‐3%
CCC+6%
C0%
CCC24%
CCC‐14%
CC11%
Portfolio composition as of May 31, 2013. Portfolio composition is subject to change without notice. There are some non‐rated securities in the portfolio as shown in the chart above. Credit distribution is determined from the highest available credit rating from any Nationally Recognized Statistical Rating Organization (S&P, Moody’s, and Fitch).
Investment Grade = Securities rated AAA to BBB‐ (shown in blue above) are considered to be investment grade. A bond is considered investment grade if its credit rating is BBB‐ of higher by Standard & Poor’s or Baa3 by Moody’s. Ratings based on corporate bond model. The higher the rating, the more likely the bond is to pay back at par/$100 cents on the dollar. AAA i id d h hi h li d h l d f i k Th id d b l bl d d d blAAA is considered the highest quality and the lowest degree of risk. They are considered to be extremely stable and dependable.Below Investment Grade = Also known as “junk bond” (shown in grey above) is a security rated below investment grade having a rating of BBB‐ or below. These bonds are seen as having higher default risk or other adverse credit events, but typically pay higher yields than better quality bonds in order to make them attractive. They are less likely to pay back at par/$100 cents on the dollar.Credit quality may be assessed by different agencies for different bonds for reasons beyond the control of the Fund. NR = Not Rated . Securities that are not rated by the three rating agencies.Source: DoubleLine Capital LP
62

Total Return Bond Fund Portfolio –Non‐Agency RMBS Breakdown By Price
8.0%
Non‐Agency Price Breakdown
d
6.0%
7.0%
% of Fun
3.0%
4.0%
5.0%
1.0%
2.0%
Dollar Price
0.0%
Portfolio price composition as of May 31, 2013. Subject to change without notice. Source: DoubleLine Capital LP. Sector allocations are subject to change and should not be considered a recommendation to buy or sell any security. 63

Core Fixed Income Fund Portfolio Statistics
Core Fixed Income Fund
Barclays Capital U.S Aggregate Index
Average Price $103.92 $108.79
Duration 4.61 5.22
Average Life 6.71 7.16
Portfolio statistics as of April 30, 2013 based on market weighted averages. Subject to change without notice.
Average price = A measure of the weighted average price paid for the securities calculated by taking the prices and dividing by the number of securities and does not include cash. Average price should not be confused with net asset value.Average Duration = Duration is used as a risk measure. It measures the price volatility of a security given a change in interest rate movements. Average Life = The average number of years that each dollar of unpaid principal due on the mortgage remains outstanding. Average life is computed as the weighted average time to g g y p p p g g g g p g gthe receipt of all future cash flows, using as the weights the dollar amounts of the principal paydowns.
Source: DoubleLine Capital LP
64

Core Fixed Income Fund Portfolio CompositionC hCash2.99%
GovtHY
Bank Loans3.98%
CLO2.50%
CMBS7.06%
17.85%
IG Corporate
Corporate0.16%
MBS35 16%
EM
15.91%
Portfolio composition as of May 31, 2013. Subject to change without notice.Bank Loans = A debt financing obligation issued by a bank or similar financial institution to a company.Commercial Mortgage‐Backed Securities (CMBS) = Commercial Mortgage‐Backed Securities Securitized loans made on commercial rather than residential property
35.16%14.38%
Commercial Mortgage‐Backed Securities (CMBS) = Commercial Mortgage‐Backed Securities. Securitized loans made on commercial rather than residential property. Collateralized Loan Obligations (CLOs) = A form of securization where payments from multiple middle sized and large business loans are pooled together and passed on to different classed of owners in various tranches Cash = Cash holding include the value of assets that can be converted into cash immediately. Can include marketable securities, such as government bonds, banker's acceptances, cash equivalents on balance sheets that may include securities that mature within 90 days.Government = Government debt (also known as public debt or national debt) is money (or credit) owed by any level of government; either central government, federal government, municipal government or local government. Mortgage‐Backed Securities = A mortgage‐backed security (MBS) is an asset‐backed security or debt obligation that represents a claim on the cash flows from mortgage loans, mostMortgage Backed Securities A mortgage backed security (MBS) is an asset backed security or debt obligation that represents a claim on the cash flows from mortgage loans, most commonly on residential propertyEmerging Markets Fixed Income = Emerging market debt (EMD) is a term used to encompass bonds issued by less developed countries.Investment Grade and High Yield Corporates (IG) = Investment grade and non‐investment grade corporate credit. Bonds issued by corporations to raise money in order to expand itsbusiness. Credit distribution is determined from the highest available credit rating from any Nationally Recognized Statistical Rating Organization (S&P, Moody’s, and Fitch). A bond rated BBB or higher would be considered Investment Grade. Any bond rated BBB or below would be High Yield.Source: DoubleLine Capital LP. Sector allocations are subject to change and should not be considered a recommendation to buy or sell any security. 65
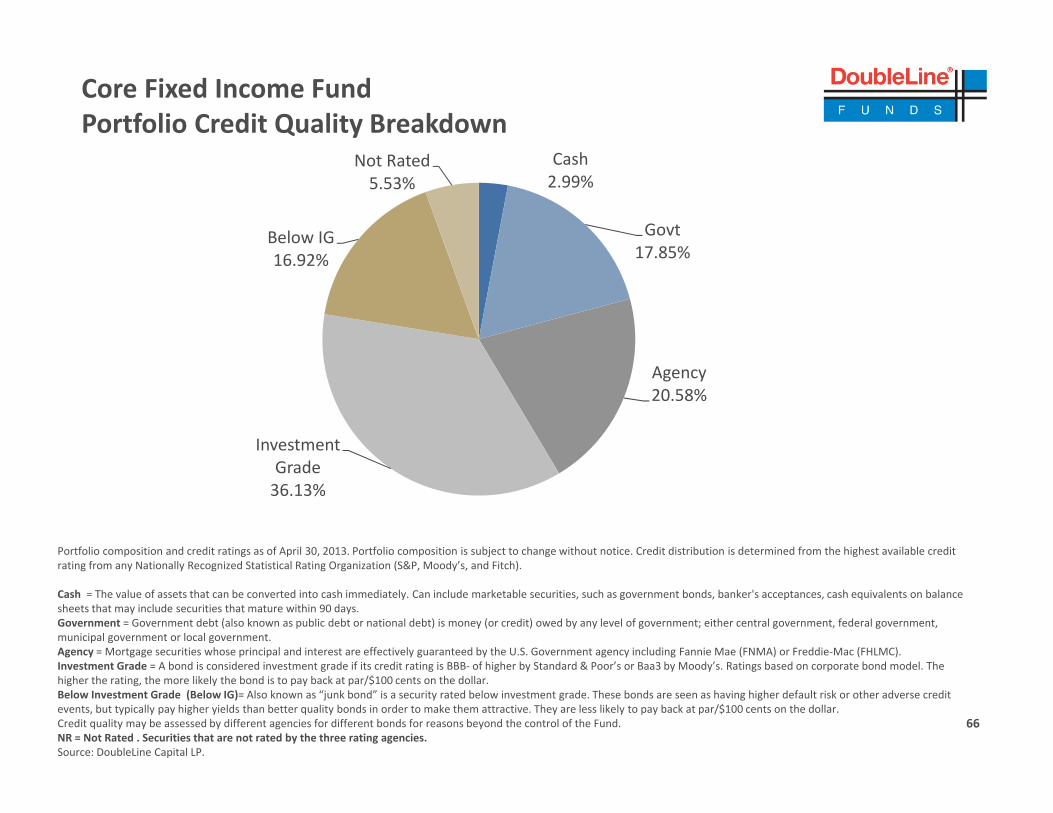
Core Fixed Income Fund Portfolio Credit Quality Breakdown
Cash2.99%
Govt17 85%
Below IG
Not Rated5.53%
17.85%16.92%
Agency20.58%
Investment
Portfolio composition and credit ratings as of April 30, 2013. Portfolio composition is subject to change without notice. Credit distribution is determined from the highest available credit
Grade36.13%
rating from any Nationally Recognized Statistical Rating Organization (S&P, Moody’s, and Fitch).
Cash = The value of assets that can be converted into cash immediately. Can include marketable securities, such as government bonds, banker's acceptances, cash equivalents on balance sheets that may include securities that mature within 90 days.Government = Government debt (also known as public debt or national debt) is money (or credit) owed by any level of government; either central government, federal government, municipal government or local government. Agency = Mortgage securities whose principal and interest are effectively guaranteed by the U.S. Government agency including Fannie Mae (FNMA) or Freddie‐Mac (FHLMC).I t t G d A b d i id d i t t d if it dit ti i BBB f hi h b St d d & P ’ B 3 b M d ’ R ti b d t b d d l ThInvestment Grade = A bond is considered investment grade if its credit rating is BBB‐ of higher by Standard & Poor’s or Baa3 by Moody’s. Ratings based on corporate bond model. The higher the rating, the more likely the bond is to pay back at par/$100 cents on the dollar.Below Investment Grade (Below IG)= Also known as “junk bond” is a security rated below investment grade. These bonds are seen as having higher default risk or other adverse credit events, but typically pay higher yields than better quality bonds in order to make them attractive. They are less likely to pay back at par/$100 cents on the dollar.Credit quality may be assessed by different agencies for different bonds for reasons beyond the control of the Fund. NR = Not Rated . Securities that are not rated by the three rating agencies.Source: DoubleLine Capital LP.
66

“What in the World is G i O ?”Going On?”
Live Webcast hosted by:
Jeffrey Gundlach
Chief Executive Officer
June 4, 2013

Index DescriptionsBarclays Capital US Aggregate Index ‐ The Barclays Capital US Aggregate Index represents securities that are SEC‐registered, taxable, and dollar denominated. The index covers the US investment grade fixed rate bond market, with index components for government and corporate securities, mortgage pass‐through securities, d t b k d iti Th j t bdi id d i t ifi i di th t l l t d d t d l b iand asset‐backed securities. These major sectors are subdivided into more specific indices that are calculated and reported on a regular basis.
Barclays Capital US Treasury Index ‐ This index is the US Treasury component of the US Government index. Public obligations of the US Treasury with a remaining maturity of one year or more.Barclays Capital US Treasury 10 Year Index ‐ This index is the 10 year component of the US Government index.Barclays Capital Capital US Treasury 30 Year Index ‐ This index is the 30 year component of the US Government index.Barclays Capital US High Yield Index ‐ The Barclays Capital US High Yield Index covers the universe of fixed rate, non‐investment grade debt. Eurobonds and debt issuer from countries designated as emerging markets (e.g. Argentina, Brazil, Venezuela, etc.) are excluded, but Canadian and global bonds (SEC registered) of g g g ( g g , , , ) , g ( g )issuers in non‐EMG countries are included. Original issue zereos, step‐up coupon structures, 144‐As and pay‐in‐kind (PIK, as of October 1, 2009) are also included.BofA Merrill Lynch US Government Index (GOAO) ‐ The Merrill Lynch US Government Index tracks the performance of US government (i.e. securities in the Treasury and Agency indices.)BofA Merrill Lynch US 15+ Year Treasury Index “Long Treasuries” (G802)‐ This index is a subset of the BofA Merrill Lynch US Treasury Index including all securities with a remaining term of final maturity greater than 15 years..BofA Merrill Lynch US Corporate Index (COAO) “Investment Grade”‐ The Merrill Lynch Corporate Index tracks the performance of US dollar denominated
d d b bl l d h d k l f h d (b d finvestment grade corporate debt publicly issued in the US domestic market. Qualifying securities must have an investment grade rating (based on an average of Moody’s, S&P and Fitch) and an investment grade rated country of risk (based on an average of Moody’s, S&P and Fitch foreign currency long term sovereign debt ratings). Securities must have at least one year remaining term to final maturity, a fixed coupon schedule and a minimum amount outstanding of $250MM.BofA Merrill Lynch US All Convertibles Index (VOSO) ‐ The Merrill Lynch All Convertible Index is a rule driven index. which includes all bonds and preferred stocks of U.S.‐registered companies, which have $50 million or more in aggregate market value and are convertibles in U.S. dollar‐denominated common stocks, ADRs or cash equivalents. Please note an investor cannot invest directly in an index.CRB Commodity Index (CRY)‐ An unweighted geometric average of some important commodities It averages prices across 17 commodities and across time TheCRB Commodity Index (CRY) An unweighted geometric average of some important commodities. It averages prices across 17 commodities and across time. The index tracks energy, grains, industrials, livestock, precious metals, and agriculturals.S&P 500 (SPX)‐ S&P 500 is a free‐float capitalization‐weighted index published since 1957 of the prices of 500 large‐cap common stocks actively traded in the United States.Standard Deviation – Sigma = standard deviation. It shows how much variation there is from the “average” (mean, or expected/budgeted value). A low standard deviation indicated that the data point tend to be very close to the mean, whereas high standard deviation indicated that the date is spread out over a large range of values.Dow Jones – UBS DJ Commodity Index ‐ The Dow Jones UBS – Commodity index is composed of commodities traded on U.S. exchanges, with the exception of aluminum, nickel and zinc, which trade on the London Metal Exchange (LME).“Copper”= Copper Spot Price (HGI) Copper is the world’s third most used metal behind iron and aluminum primarily used in highly cyclical industries including construction and industrial machinery manufacturing. Spot price quoted in USD/lb.“Gold”= Gold Spot Price (Golds) The Gold Spot price is quoted as US Dollar per Troy Ounce.Crude Oil= Crude oil varies greatly in appearance depending on its composition. West Texas intermediate (WTI )= Texas light sweet crude is used as a benchmark in oil pricing It’s “light” because of the low density and sweet because of low sulfur Brent crude = Is a major trading classification of sweet light crude Brent is the oiloil pricing. It s light because of the low density and sweet because of low sulfur. Brent crude = Is a major trading classification of sweet light crude. Brent is the oil maker also known as Brent Blend.Volatility Index (VIX) ‐The VIX shows the market's expectation of 30‐day volatility. It is constructed using the implied volatilities of a wide range of S&P 500 index options. This volatility is meant to be forward looking and is calculated from both calls and puts. The VIX is a widely used measure of market risk and is often referred to as the "investor fear gauge". 68
getIndexA1U.S. AggrIWS?requBack to In

Index DescriptionsBofA Merrill Lynch US Dollar Emerging Markets Sovereign Plus Index (IGOV)This index tracks the performance of US dollar denominated emerging market and cross‐over sovereign debt publicly issued in the eurobond or US domestic market. Qualifying countries must have a BB1 or lower foreign currency long‐term sovereign debt rating (based on an average of Moody’s, S&P, and Fitch).BofA Merrill Lynch U.S. High Yield Cash Pay Index (J0A0) “Below Investment Grade”‐The Merrill Lynch High Yield Index tracks the performance of US dollar denominated below investment grade corporate debt, currently in a coupon paying period, that is publicly issued in the US domestic market. Qualifying securities must have a below investment grade rating (based on an average of Moody’s, S&P and Firth foreign currency long term sovereign debt ratings). Must have one year remaining to final maturity and a minimum outstanding amount of $100MM.BofAMerrill Lynch International Government Index (NOGO)BofA Merrill Lynch International Government Index (NOGO)The Merrill Lynch International Index tracks the performance of Australia, Canadian, French, German, Japan, Dutch, Swiss and UK investment grade sovereign debt publicly issued and denominated in the issuer’s own domestic market and currency. Qualifying securities must have at least one year remaining term to final maturity, a fixed coupon schedule and a minimum amount outstanding.BofA Merrill Lynch Mortgage‐Backed Securities Index (MOA0)This index tracks the performance of US dollar denominated fixed rate and hybrid residential mortgage pass‐through securities publicly issued by US agencies in the US domestic market. 30‐year, 20‐year, 15‐year and interest only fixed rate mortgage pools are included in the Index provided they have at least one year remaining term to final maturity and a minimum amount outstanding of at least $5 billion per generic coupon and $250MM per production year within each generic coupon.BofA Merrill Lynch U.S. Municipal Securities Index (UOA0)This index tracks the performance of US dollar denominated investment grade tax‐exempt debt publicly issued by US states and territories, and their political subdivisions, in the US domestic market. Qualifying securities must have at least one year remaining term to final maturity, a fixed coupon schedule and an investment grade rating (based on Moody’s, S&P and Fitch). Minimum size vary based on the initial term to final maturity at time of issuance.Barclays Capital Global Emerging Markets Index ‐ The Barclays Capital Global Emerging Markets Index represents the union of the USD‐denominated US Emerging Markets index and the predominately EUR denominated Pan Euro Emerging Markets Index covering emerging markets in the following regions: Americas EuropeMarkets index and the predominately EUR‐denominated Pan Euro Emerging Markets Index, covering emerging markets in the following regions: Americas, Europe, Middle East, Africa, and Asia. As with other fixed income benchmarks provided by Barclays Capital, the index is rules‐based, which allows for an unbiased view of the marketplace and easy replicability.JP Morgan Investment Grade Corporate Index ‐ JP Morgan Investment Grade Corporate Index includes performance of US dollar denominated investment grade corporate debt publicly issued in the US domestic market. Qualifying securities must have an investment grade rating (based on an average of Moody’s, S&P and Fitch) and an investment grade rated country of risk (based on an average of Moody’s, S&P and Fitch foreign currency long term sovereign debt ratings). Securities must have at least one year remaining term to final maturity, a fixed coupon schedule and a minimum amount outstanding of $250MM.y g y p gDraw Down ‐ The peak‐to‐trough decline during a specific record period of an investment, fund or commodity. A drawdown is usually quoted as the percentage between the peak and the trough. NAV – A mutual fund's price per share or exchange‐traded fund's (ETF) per‐share value. In both cases, the per‐share dollar amount of the fund is calculated by dividing the total value of all the securities in its portfolio, less any liabilities, by the number of fund shares outstanding. CMO – A type of mortgage‐backed security that creates separate pools of pass‐through rates for different classes of bondholders with varying maturities, called tranches. The repayments from the pool of pass‐through securities are used to retire the bonds in the order specified by the bonds' prospectusTIPS T I fl ti P t ti A t it th t i i d d t i fl ti i d t t t i t f th ti ff t f i fl ti TIPSTIPS– Treasury Inflation Protection. A treasury security that is indexed to inflation in order to protect investors from the negative effects of inflation. TIPS are considered an extremely low‐risk investment since they are backed by the U.S. government and since their par value rises with inflation, as measured by the Consumer Price Index, while their interest rate remains fixed.CPI– Consumer Price Index. A measure that examines the weighted average of prices of a basket of consumer goods and services, such as transportation, food and medical care.Cash Flow – Cash flow measures the cash generating capability of a company by adding non‐cash charges (e.g. depreciation) and interest expense to pretax income.
69
getIndexA1U.S. AggrIWS?requBack to In

Index DescriptionsBofA/Merrill Lynch High Yield Cash Pay CCC –rated Index (JOA3) – .A component of the BofA/Merrill Lynch High Yield Cash Pay Index concentrating on CCC rated High Yield credit only. BofA/Merrill Lynch High Yield Cash Pay BB rated Index (JOA1) A component of the BofA/Merrill Lynch High Yield Cash Pay Index concentrating on BB ratedBofA/Merrill Lynch High Yield Cash Pay BB–rated Index (JOA1) – .A component of the BofA/Merrill Lynch High Yield Cash Pay Index concentrating on BB rated High Yield credit only.BofA/Merrill Lynch High Yield Cash Pay B–rated Index (JOA2) – .A component of the BofA/Merrill Lynch High Yield Cash Pay Index concentrating on B rated High Yield credit only.BofA/Merrill Lynch Credit Index BBB‐rated Index (COA4) – .A component of the BofA/Merrill Lynch Credit Index concentrating on the lower rated BBB investment grade credits.BofA/Merrill Lynch Credit Index A–rated Index (COA3) – . A component of the BofA/Merrill Lynch Credit Index concentrating on the A rated investment grade / y ( ) p / y g gcredits.BofA/Merrill Lynch Credit Index AAA –rated Index (COA1) – . A component of the BofA/Merrill Lynch Credit Index concentrating on the highest rated AAA investment grade credits.BofAMerrill Lynch US Treasury Index (G0Q0) ‐The Merrill Lynch US Treasury Index tracks the performance of US dollar denominated sovereign debt publicly issued by the US government in its domestic market. Qualifying securities must have at least one year remaining term to final maturity, a fixed coupon schedule and a minimum amount outstanding of $1 billion.B fAM ill L h US 10 15 Y T I d “L T ” Th M ill L h US 10 15 T I d k h f f US d ll d i d 10BofA Merrill Lynch US 10‐15 Year Treasury Index “Long Treasury”‐The Merrill Lynch US 10‐15 Treasury Index tracks the performance of US dollar denominated 10‐15 year sovereign debt publicly issued by the US government in its domestic market. It is a subset of the BofA Merrill Lynch U.S. Treasury Index (GOQO).BofAMerrill Lynch Municipal Index‐The Merrill Lynch Municipal BofAMerrill Lynch Current 10 year UST Index –‐ This index is the 10 year component of the US Government index.BofAMerrill Lynch Current 30 year UST Index –‐ This index is the 30 year component of the US Government index.S&P GSCI Single‐Name Commodity Excess Return Index ‐ This index is a single name commodity (ex. Corn) singled out of the S&P GSCI Index to show the total return for that specific commodity.return for that specific commodity.Shanghai Index ‐ The Shanghai Stock Exchange Composite is a capitalization‐weighted index tracking daily price performance of all A and B‐shares listed on the Shanghai Stock Exchange. This index was developed December 19, 1990 with a base value of 100.S&P/Case‐Shiller Composite Home Price Index ‐ The Case‐Shiller Home Price Indices, one comprised of price changes within all 20 metropolitan markets, and another comprised of price changes within the following subset of 10 metropolitan markets: Boston, Chicago, Denver, Las Vegas, Los Angeles, Miami, New York, San Diego, San Francisco and Washington DC. In addition to those 10 markets, the 20‐Home Price index reflects price changes for Atlanta, Charlotte, Dallas, Detroit, Minneapolis, Phoenix, Portland, Seattle and Tampa.NASDAQ‐ A computerized system that facilitates trading and provides price quotations on more than 5,000 of the more actively traded over the counter stocks. Created in 1971, the Nasdaq was the world's first electronic stock market.Transports‐ The Industrials Sector includes companies whose businesses are dominated by one of the following activities: The manufacture and distribution of capital goods, including aerospace & defense, construction, engineering & building products, electrical equipment and industrial machineryUtilities‐ A public utility is a business that furnishes an everyday necessity to the public at large. Public utilities provide water, electricity, natural gas, telephone service, and other essentials. Utilities may be publicly or privately owned, but most are operated as private businesses.Basis Point‐ A basis point is a unit that is equal to 1/100th of 1% and is used to denote the change in a financial instrumentBasis Point‐ A basis point is a unit that is equal to 1/100 of 1%, and is used to denote the change in a financial instrument.REIT‐ Real Estate Trust. A security that sells like a stock on the major exchanges and invests in real estate directly, either through properties or mortgagesDuration – Duration is a commonly used measure of the potential volatility of the price of a debt security, or the aggregate market value of a portfolio of debt securities, prior to maturity. Securities with a longer duration generally have more volatile prices than securities of comparable quality with a shorter duration.Prime X Index – Prime X is an index offered by Markit. It allows investors to synthetically gain exposure to non‐agency Prime residential mortgage collateral. An investment cannot be made directly in and index.
70
getIndexA1U.S. AggrIWS?requBack to In

Index Descriptions
BofA/Merrill Lynch Inflation Linked Index (G0Q1) – The BofA Merrill Lynch US Inflation‐Linked Treasury Index tracks the performance of US dollar denominated inflation linked sovereign debt publicly issued by the US government in its domestic market. Citigroup TIPS (SBUSILSI)– . It measures the returns of the inflation‐linked bonds with fixed‐rate coupon payments that are linked to an inflation index. The price of each issue in the USLSI is adjusted by using an index ratio. The index ratio is determined by dividing the current inflation index level by the inflation index level at the time of issue of the security. The inflation index is published on a monthly basis, and the intra‐month index ratio is calculated using linear interpolation.pBarclays Capital CMBS Index – tracks the performance of US dollar‐denominated securitized commercial mortgage‐backed securities.Russell 2000 – measures the performance of the small‐cap segment of the US equity universe. Russell 2000 is a subset of the Russell 3000 index representing approximately 10% of the total market capitalization of that index.S&P GSCI – is a composite index of commodity sector return representing an unleveraged, long‐only investment in commodity futures that is broadly diversified across the spectrum of commodities. S&P GSCI Agriculture – is a composite index of agriculture commodity futures unleveraged, long‐only investment.Barclays Capital US 30 Year TIPS Index Barclays Capital 30 year TIPS on the run index quoted in US Dollars traded intradayBarclays Capital US 30 Year TIPS Index ‐ . Barclays Capital 30‐year TIPS on‐the‐run index quoted in US Dollars traded intradayCitigroup Economic Surprise Index ‐ . The Citigroup Economic Surprise Indices are objective and quantitative measures of economic news. They are defined as weighted historical standard deviations of data surprises (actual releases vs Bloomberg survey median). A positive reading of the Economic Surprise Index suggests that economic releases have on balance beating consensus. The indices are calculated daily in a rolling three‐month window. The weights of economic indicators are derived from relative high‐frequency spot FX impacts of 1 standard deviation data surprises. The indices also employ a time decay function to replicate the limited memory of markets.DAX ‐ This index is the German Stock Index is a total return index of 30 selected German blue chip stocks traded on the Frankfurt Stock Exchange.DAX This index is the German Stock Index is a total return index of 30 selected German blue chip stocks traded on the Frankfurt Stock Exchange.CAC 40 – This index the most widely‐used indicator of the Paris market, reflects the performance of the 40 largest equities listed in France, measured by free‐float market capitalization and liquidity.FTSE 100 – Is a capitalization‐weighted index of the 100 most highly capitalized companies traded on the London Stock Exchange.Mexico IPC – The Mexican IPC index is a capitalization weighted index of the leading stocks traded on the Mexican Stock Exchange.Hang Seng – The Hang Seng China Enterprises Index is a freefloat capitalization‐weighted index comprised of H‐shares listed on the Hong Kong Stock Exchange and included in the Hang Seng Mainland Composite Index.KOSPI ‐ This index is a capitalized‐weighted index of all common shares on the Korean Stock Exchanges.Nikkei 225 – The Nikkei‐225 Stock average is a price‐weighted average of 225 top‐rated Japanese companies listed in the First Section of the Tokyo Stock Exchange.Australia AORD – S&P/ASX All Ordinaries represents 500 largest companies in the Australian equities market. Index constitutes are drawn from eligible companies listed on the Australian Stock Exchange.Brazil Bovespa Index (IBOV) ‐The Bovespa Idnex is a gross return index weighted by traded volume and is comprised of the most liquid stocks traded on the Sao Paulo Stock Exchange. The Bovespa Index has been divided 10 times by a factor of 10 since January 1, 1985.Shanghai Index (SHCOMP) ‐The Shanghai Stock Exchange Composite Index is a capitalization‐weighted index The index tracks the daily performance of all A‐sharesShanghai Index (SHCOMP) ‐The Shanghai Stock Exchange Composite Index is a capitalization weighted index. The index tracks the daily performance of all A shares and B‐shares listed on the Shanghai Stock Exchange. The index was developed on December 19,1990 with a base value of 100.BSE India Sensitive Index (Sensex) ‐The Sensex is a cap‐weighted index. The selection of the index members has been made on the basis of liquidity, depth and floating‐stock‐adjustment depth and industry representation.
71
getIndexA1U.S. AggrIWS?requBack to In

DisclaimerImportant Information Regarding This Report
l i d l ill d h h hi i l d b difi d i di ll h h h l l dIssue selection processes and tools illustrated throughout this presentation are samples and may be modified periodically. Such charts are not the only tools used by the investment teams, are extremely sophisticated, may not always produce the intended results and are not intended for use by non‐professionals.DoubleLine has no obligation to provide revised assessments in the event of changed circumstances. While we have gathered this information from sources believed to be reliable, DoubleLine cannot guarantee the accuracy of the information provided. Securities discussed are not recommendations and are presented as examples of issue selection or portfolio management processes. They have been picked for comparison or illustration purposes only. No security presented within is either offered for sale or purchase. DoubleLine reserves the right to change its investment perspective and outlook without notice as market conditions dictate or as additional information becomes availabledictate or as additional information becomes available.Important Information Regarding Risk FactorsInvestment strategies may not achieve the desired results due to implementation lag, other timing factors, portfolio management decision‐making, economic or market conditions or other unanticipated factors. The views and forecasts expressed in this material are as of the date indicated, are subject to change without notice, may not come to pass and do not represent a recommendation or offer of any particular security, strategy, or investment. Past performance is no guarantee of future results.Important Information Regarding DoubleLineImportant Information Regarding DoubleLineIn preparing the client reports (and in managing the portfolios), DoubleLine and its vendors price separate account portfolio securities using various sources, including independent pricing services and fair value processes such as benchmarking. To receive a complimentary copy of DoubleLine’s current Form ADV Part II (which contains important additional disclosure information), a copy of the DoubleLine’s proxy voting policies and procedures, or to obtain additional information on DoubleLine’s proxy voting decisions, please contact DoubleLine’s Client Services. Important Information Regarding DoubleLine’s Investment StyleDoubleLine seeks to maximize investment results consistent with our interpretation of client guidelines and investment mandate. While DoubleLine seeks to p gmaximize returns for our clients consistent with guidelines, DoubleLine cannot guarantee that DoubleLine will outperform a client's specified benchmark. Additionally, the nature of portfolio diversification implies that certain holdings and sectors in a client's portfolio may be rising in price while others are falling; or, that some issues and sectors are outperforming while others are underperforming. Such out or underperformance can be the result of many factors, such as but not limited to duration/interest rate exposure, yield curve exposure, bond sector exposure, or news or rumors specific to a single name.DoubleLine is an active manager and will adjust the composition of client’s portfolios consistent with our investment team’s judgment concerning market conditions and any particular security. The construction of DoubleLine portfolios may differ substantially from the construction of any of a variety of bond market i di A h D bl Li tf li h th t ti l t d f t f b d k t i d Si k t i i ffi i tl i d findices. As such, a DoubleLine portfolio has the potential to underperform or outperform a bond market index. Since markets can remain inefficiently priced for long periods, DoubleLine’s performance is properly assessed over a full multi‐year market cycle.
As of March 31, 2013 the Total Return Bond Fund held 0.00% Bank of Cyprus, 30.14% in Fannie Mae (FNMA), 14.59% in Freddie Mac (FHLMC) and 1.12% in GinnieMae (GNMA). As of March 31, 2013 he Core Fixed Income Fund held 0.00% Bank of Cyprus, 11.57% in Fannie Mae (FNMA), 10.43% in Freddie Mac (FHLMC) and 1.81% in Ginnie Mae (GNMA). Fund holdings and sector allocations are subject to change and are not recommendations to buy or sell any security.
References to other Funds should not be interpreted as an offer of those securities.Diversification does not assure a profit or protect against a loss in a declining market.Opinions expressed are subject to change at any time, are not a guarantee and should not be considered investment advice.
© 2013 DoubleLine Capital LP72

AnnouncementsW b NWebcast News –
Bonnie Baha & Robert Cohen – June 25, 2013Floating Rate Fund Launch1:15 pm PDT/4:15 pm EDT1:15 pm PDT/4:15 pm EDT
Jeff Sherman – July 9, 2013Multi‐Asset Growth1:15 pm PDT/4:15 pm EDT
Luz Padilla – July 23, 2013Emerging Markets Fixed Income 1:15 pm PDT/4:15 pm EDT
Jeffrey Gundlach – September 10, 2013Total Return & Core Fixed Income1:15 pm PDT/4:15 pm EDT
To Receive Presentation Slides:You can emailYou can email [email protected]
The Floating Rate Fund will not be available to retail investors until 7/1/2013.
73


