
144 The Wilson Bulletin--September, 1932
LIFE ZONES, MODERN ECOLOGY, AND THE TEMPERATURE SUMMING”
BY VICTOR E. SHELFORD
I. Introduction.
II. Fundamental Basis of Merriam’s
III. Relation to Physical Conditions.
1. Merriam’s View. 2. Experimental Results.
FAILURE OF
Work.
3. Analysis by students of plants.
IV. Relations of the Zones to Communities and the Major Facts of Distribution.
INTRODUCTION
There is a large degree of confusion as to the relations of life
zones as originally described by Merriam, and the plant-animal com-
munities recognized in modern ecology. There are two points of view
in the study of distribution: (1) the f aunistic-floristic view which
bases its principal regions on genera, is purely qualitative and aims
at the discovery of facts bearing upon evolution and migration as con-
sidered in this field; (2) the ecological point of view which bases its
communities (regions) upon species and varieties, is purely quantita-
tive, evaluating all important organisms on the basis of quantity and
individual potency, and aims at the discovery of facts bearing on
dynamic life relations of all kinds-fluctuations in abundance, compe-
tition, invasion, succession, etc. In order to compare this viewpoint
with that of Merriam and his followers, it is necessary to go back to
the initial thesis of Merriam (1591) and trace its later developments.
FUNDAMENTAL BASIS OF MERRIAM’S WORK
Merriam began his work as strictly a faunistic study. His re-
marks in his original presentation of his subject were directed mainly
as a criticism of Wallace (Geographical Distribution of Animals,
1876), whose distribution of regions is shown in figure 29. Zoogeog-
raphical regions as worked out by Wallace and many others are based
upon genera or families, no consideration being taken of the abun-
dance, habitats, or habitat relations of the animals. The aim was to
clarify (historical) evolution, migration, and barriers. Merriam set
out to prove that Wallace’s mapping is incorrect, constructing a table given below (Fig. 30).
*Contribution from the Zoological Laboratories, University of Illinois, No. 426.

Failure of Temperature Summing and Life Zones 145
CAL/FOAN/AN 111
ROCKY MOUNTAIN 121
ALLEGHANY 13]
141
FIG. 29. The subregians nf Wallace, 1576.

146 The Wilson Bulletin--September, 1932
FIG. 30. Merriam’s Life Zones, after Anthony.

Failure of Temperature Summing and Life Zones 147
TABLE I.
Generic Basis of Zones. MkUlll7l~h Birds Tottll
Families Genera Families Genera Families Genera
Arid Sonoran distinguished from humid Sonoran by ________ 1 10 0 24 1 34
Humid Sonoran distinguished from arid Sonoran by ___....._. 1 4 0 7 1 11
Common to both arid and humid Sonoran _______....___________ 13 27 12 31 25 58
Sonoran as a whole distin- guished from Boreal by ..______ 8 41 10 100 18 141
Boreal as a whole distin- guished from Sonoran by...... 6 30 3 40 9 70
Common to Boreal and Sono- ran ____._______________.... _ ___________..______ 8 8 ____ 18 _.__ 26
In this table Merriam showed that more genera are different from
north to south than from east to west. The comparison is made be-
tween his Boreal and his Sonoran regions for the north and south dif-
ference and between the arid and humid portions of the Sonoran for
the east and west difference. Th’ 1s agrees with Wallace in one feature of the latter’s classification, but disputes his division into Californian,
Rocky Mountain, and Alleghanian areas, as shown in Wallace’s map
(Fig. 29). In other words he practically called Wallace’s 1, 2, and 3
(Fig. 30) Sonoran. and Wallace’s Canadian, Boreal. He then used these
conclusions to disprove the subdivision into Californian, Rocky Moun-
tain, and Alleghanian sections, but presented no table to establish his
three transcontinental divisions, namely the Transition, upper Sonoran
(or Austral) and lower Sonoran (or Austral). He contended, how-
ever, that within the Sonoran zone there are more generic differences
from north to south than from east to west. In other words genera,
which are the basis of the first subdivision of the large zoogeographical
regions, range cross-wise of the North American continent.
RELATIONS TO PHYSICAL FACTORS
1. Merriam’s view and method. He had noted correlations be-
tween isotherms and distribution limits of birds and mammals, and
contended that their limits coincide with certain temperature phe-
nomena, particularly the total temperature above 6’ Centigrade (ap-
proximately 43O F.) . He insisted that temperature is the most im-
portant limiting factor, though no experiments were performed and no
inquiries as to the method of its operation were undertaken. His sums
of temperatures were calculated by the Weather Bureau. Through
some error, those given him for publication were not calculated above
6’ C. but above zero Centigrade, with all days in which the mean did
not reach 6’ C., omitted. A note was published in Science calling at-
148 The Wilson Bulletin--September, 1932
tention to this error (Merriam ‘99), but the new totals were never
substituted. The sums published are, therefore, unlike those compiled
elsewhere.
This assumption of the sum of temperatures had received consid-
erable attention in the few decades preceding the announcement of the
Life Zone idea. Merriam, however, merely took the relation for granted
32 59 68 77 86 95 /04 /I3
40 72
63
JO 54
F
~MPL’ ATURE &tVt &I
45
36
27
1.3
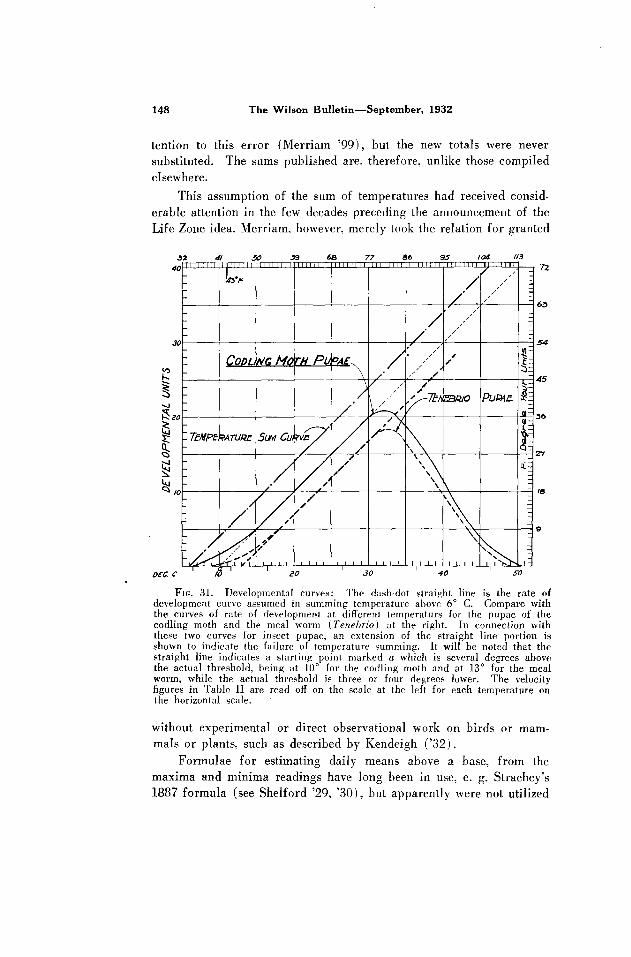
FIG. 31. Developmental curves: The dash-dot straight line is the rate of development curve assumed in summing temperature above 6” C. Compare with the curves of rate of development at different temperaturs for the pupae of the codling moth and the meal worm (Tenebrio) at the right. In connection with these two curves for insect pupae, an extension of the straight line portion is shown to indicate the failure of temperature summing. It will be noted that the straight line indicates a starting point marked a which is several degrees above the actual threshold, being at 10” for the codling moth and at 13” for the meal worm, while the actual threshold is three or four degrees lower. The velocity figures in Table II are read off on the scale at the left for each temperature on the horizontal scale.
without experimental or direct observational work on birds or mam-
mals or plants, such as described by Kendeigh (‘32).
Formulae for estimating daily means above a base, from the
maxima and minima readings have long been in use, e. g. Strachey’s
1887 formula (see Shelford ‘29, ‘30), but apparently were not utilized

Failure of Temperature Summing and Life Zones 149
by Merriam. It is well known that sums of temperature to be of
biological significance must be based upon hourly or bihourly read-
ings. The writer has further conducted extensive experiments showing
that temperature sums are not a good index to rate of development or
of other biological processes (Shelford ‘29)) a fact originally pointed
out by Krogh (1914).
2. Comparison of actual developmental rates and rates assumed
in summing. The actual rates of development for the codling moth
were determined in detail and checked against thousands of cases in
nature. Figures 31 and 32 show the actual velocities of development
as determined experimentally (codling moth, Shelford ‘25; meal worm,
0 5 /o 20 25 35 40 45
TEMPFRATURE DEGREE C
FIG. 32. The 6” summing curw in conlparison with the actual rate of growth of the Indian corn plant, according to Lehenhauer (from Shelford ‘29).
Krogh ‘14, with extension to conform with the codling moth; Indian
corn plant, Lebenbauer ‘14, and Livingston and Shreve ‘21). The
units shown on the scale at the left equal the effect of one degree
(C.) for one hour on all the curves. The straight lines (summation
curves) are based on the assumption that the effect of one degree is
the same at all temperatures.
The results of summing temperatures and developmental units
(Table II) for two weeks, April 3-10 and August 28-September 4
(Fig. 33) are shown in Table III. In this table the sums made by the
two-hour mean temperatures of figure 33 are divided by twelve to get
the degree days and degree day developmental units of Table III.

150 The Wilson Bulletin-September, 1932
TABLE II
Table showing the rate of development expressed as the effect of one degree for an hour (developmental units) in the straight line portions of the velocity curves in figures 31 and 32.
OC.
3
5” 6
8’ 9 10 11 12 13 14 15
:; 18
z
:: 23
;%z
z
;; 30 31
;: 34 35 36 37
Meal Worm Pupa
::
:
0 0
“C.
i
Fi 7 8 9 10 11 12 13 14 15 16 17 18
l”o 21 22 23 24 25
;;
;; 30
3”;
3”: 35
E
Codling Moth Pupa
:
0”
0.2
Indian Corn Plant
0.05
0.5 1.2 1.7
1.2 1.8
0.10 0.2 0.3
00:: 0.8 1.0
::;
2.4 3.0
2.0 2.5
3.6
::: 6.0 7.0 8.0 9.0
10.0 110 12.0 13.0 14.0 15.0 16.0 17.0 17.8 18.2 18.3 17.8 17.0 15.4 14.2
2.1 2.7
43:; 5.0 6.0 7.0 80 9.0
10.0 11.0 12.0 13.0 14.0 15.0 16.0 17.0 18 0 19 0 20.0
“C.
i
2 7 8
:0 11 12 13 14
:: 17
:9” 20 21 22 23
2”:
;:
;; 30 31 32
::
:z 37
f”, 6:0 7.0 80 9.0
10.0 11.0 12.0 13.0 14.0 15.0
20.5 21.0 20.7
16.0 16.7
19.8 18.8 17.5
17.0 16.8 15.7 14.0 12.7
16.1 TABLE III
11.5 10.0
Table showing the application of the Merriam sums (sums above 0 with days at or below 6O C. omitted) of degree days, actual sums above 6’ C., the progress of the meal worm pupa, of the codling moth pupa, and the growth of the Indian corn plant. Degree days may be compared with degree day developmental units in the case of the two insects.
Aoril 3 to 7ulv 28 to
1.
2. 3.
4.
5.
76:
Sum of temperature (degree days) above 6” which are Apkl lo,1916 AL&U& 4.1916
the assumed developmental units (See 3 and 4) ..__.._._.. 8.0 154.0 Merriam’s sum ____________________.................................................... 26.0 196.0 Degree day developmental units for the pupa of Tenebrio (See curve Fig. 31) _____.......____.............................. 1.6 97.5 Degree day developmental units for the codling moth pupa ___________ _ ____________________.......................................................... 116.6 Growth of corn plant in mm . . . . . . .._________.______________________. ;.; 326.5 Assumed growth for 6” starting point (in mm.) ____________ 28:8 554.4 Assumed growth under Merriam’s calculations (in mm.) 93.6 705.6


152 The Wilson Bulletin--September, 1932
It will be seen from a study of the three rate curves that their
form is radically different from the straight line assumption which
rises at the same rate as the temperature rises. First the straight line
type of curve does not begin until about one-fifth of the temperature
range (compatible with growth) above the threshold or starting point
has been covered. It then rises directly in proportion to the rise in
temperature through about one-third the range compatible with life.
The rate is rapidly retarded through the remainder of the life-com-
patible temperature range (less than one-half of the entire range).
The 6’ C. starting point is not far from the correct threshold tern-
perature, but the rise in rate of growth or development does not begIn
to be proportional to the rise in temperature until 7’ to 10’ hi&r
and ceases to be proportional at about 30’ C. (86O F.). Figure 23
shows the bihourly average temperature for the week April 3-10, 1916,
Olney, Illinois, and the week July 2SAugust 4, 1916, Olney, Illinois.
For the warm week the sums of the two hourly means are shown for
each day. The daily mean and daily mean above 6O C. are derived
from the sum. For the cold week the sum of two hourly means above
6’ C. are given, followed by the mean derived from the maximum and
minimum and this mean less 6 degrees. There is considerable differ-
ence between this and one-twelfth the sum of two-hour means (see the
fourth and seventh days).
The Tenebrio pupa requires 104 degree C. day units for comple-
tion and the codling moth 150 degree C. day units. The Merriam
sum for the cold week is fifteen times as great as the actual progress
of the Tenebrio pupa (compare items 2 and 3, Table III j . Merriam’s
sum for the hot week is more than twice the actual progress. Com-
paring items 5 and 7, Merriam’s assumed growth of the corn plant is
nearly ten times the actual growth for the cold week and more than
twice that for the hot week. The d’ rscrepancies due to the error in
summing are large and those for the simple summing of temperatures
are merely smaller. The sum-of-temperature assumptions are without
scientific foundation and must be discarded.
3. Views of students of plants. Livingston and Shreve (‘21)
after a detailed analysis of climatic conditions (p. 528) in relations
to plants, state: “From the preceding discussion, and from considera-
tions presented in Part II, it appears that the system of life zones
worked out by Merriam and now rather widely used in a descriptive
way, especially by the United States Biological Survey, will require
much modification before it may become at all satisfactory to a serious
student of etiological plant geography. It is extremely unfortunate

Failure of Temperature Summing and Life Zones 153
that the actual data on which this system was originally based, and
on which its applications are based in current descriptions, do not
exist in the published literature. Neither Merriam nor any of his fol-
lowers has thus far attempted to present the actual basis for the sys-
tem in form such that a critical study of its good and bad features
may be undertaken. Perhaps this may be a main reason why the
whole subject of the climatic relations of floral and fauna1 areas has
received so little attention at the hands of students who are able and
willing to undertake the complex analyses which are involved in such
a subject. The publication of the charts without the data on which
they were based, together with the general and official adoption of
the system by the United States Biological Survey, have given this
important problem the appearance of having been satisfactorily solved
-of being a closed subject. Those who have employed this zone
system have either refrained from any discussion of its good and bad
characteristics, or else they have merely taken the standpoint of advo-
cates, and the lack of numerical data that are absolutely necessary for
a critical study has tended strongly to discourage such inquiries. Also,
a sort of authoritative atmosphere that seems to hang over govern-
ment publications in general, together with the apparent authority
and dogmatism that invariably go with well-printed (and especially
colored) charts, to the exoteric reader, tend in the same direction, to
retard real progress. Ecological students should realize that this is
not by any means a closed subject, but that it is in a very early,
formative stage, and that it requires vastly more critical and original
study than has ever been accorded it.”
RELATIONS OF THE ZONES TO COMMUNITIES AND THE MAJOR
FACTS OF DISTRIBUTION
On his expedition to the San Francisco Mountain in 1889 Merriam
discovered the altitudinal zonation of plant and animal communities
in that region and named them primarily after the vegetation. He
recognized the Alpine Zone. T’ b -1 rm er ine Zone, Spruce or Hudsonian.
Zone, Balsam Fir or Canadian Zone, Yellow Pine Zone, Pinon Zone,
and the Desert Zone.
Starting with the San Francisco Mountain and with belts that
correspond to vegetation. Merriam carried his zones across the con-
tinent on the basis of his temperature theory, cutting the major com-
munities crosswise from west to east. Lengthwise, or from north to
south, on the great plains grassland area, the dominant grasses belong-
ing to several genera are distributed throughout. These are divided
into three zones. Likewise, the bison, pronghorn antelope, prairie

154 The Wilson Bulletin--September, 1932
FIG. 34. Map of plant climaxes, modified from Weaver and Clement.

Failure of Temperature Summing and Life Zones 155
dog, kit fox, in fact, all the more important grassland animals, have
their population divided between three zones, though constituting a
part of our best known plant-animal formation (biome) .
Where the great plant-animal communities are cut across by the
life zones, subclimax plants, river margin shrubs, and animals belong-
ing to local conditions have to be the main reliance as indicators. The
trees and shrubs skirting the streams and animals such as the elk and
grizzly bear which were found among them occasionally are used
though their presence here is governed by soil and water and trees
rather than climate. Again in a few cases biotically equivalent varie-
ties of the same species may show relation to life zones. The zonal
basis is, however, entirely a secondary matter. Similar violence is
done the Deciduous Forest Community. The zones are quite gener-
ally out of accord with vegetation areas and natural communities
over the southeastern third of North America. The Transition Zone,
in particular, includes beech-maple forest, tall and short grassland,
poplar parkland, chaparral, yellow pine forest, etc.
Disagreement of the major facts of distribution with the Merriam
zones has been indicated by students both with taxonomic-faunistic
viewpoint and with a quasi-ecological viewpoint.
Disagreement with the zones is indicated also for mollusca by
Pilsbry and Ferriss (‘06) in the following terms: “For the student
of molluscan distribution, the life zones of the United States as mapped
by Dr. Merriam emphasize the secondary and not the primary facts of
distribution. The laws of temperature control, which he has de-
veloped with keen insight, do not define transcontinental zones of pri-
mary import zoologically. Th ese zones are secondary divisions of
vertical life areas of which the molluscan faunas were evolved in
large part independently.”
In his studies of the mammals of the Flathead Lake Region in
Montana, Dice (‘SB), after pointing out the correspondence of the
faunas with those one to two hundred miles away, points out difficul-
ties with life zones (p. 259) in the following terms:
“However, the correlation of these faunas with faunas of more dis-
tant regions offers greater difficulties, and little seems to be gained
by trying to homologize the fauna1 area of the bunchgrass near Flat-
head Lake with the Alleghanian fauna1 area of the eastern United
States in order to form a Transition life zone. The relationships of
the lower coniferous forests near Flathead Lake to the Canadian fauna
and those of the higher mountains to the Hudsonian fauna respec-
tively of eastern North America are also somewhat remote.”

156 The Wilson Bulletin--September, 1932
Further, Dice (‘23A) takes issue with the life zones in general
with reference to the life zones of Alabama (Howell ‘21). On page 43 he states, “The life zones of Merriam are founded on the belief
that there are zones of life extending transversely across the continent
of North America, in the south as well as in the north. However, no
species of mammal listed in this paper as characteristic of the Upper
Austral Zone of Alabama is listed by Hall and Grinnell as character-
istic of the corresponding zone in California.” On page 47 he states,
“The distribution of the species of mammals in the State of Alabama
is not well shown by the life zone map presented. Only a relatively
small percentage of the species known from the state agree closely in
distribution with the boundaries of the life zones as mapped; and
the presentation of such a life zone map gives an appearance of
finality and precision to the classification of distribution which the
facts do not justify.
“The recognition of transcontinental Upper Austral and Lower
Austral Zones wrongly represents the fauna1 relationships of the parts
of these zones mapped in Alabama and California respectively.”
In the western mountains there is considerable agreement between
the plant-animal communities and life zones. Grinnell (‘14) has at-
tempted to bring these two systems into harmony and has progressed
a long way toward the modern ecological viewpoint, especially from
the standpoint of biotic interaction. This would have been imprac-
ticable had he not been dealing with a mountain-dominated region, in
which the life zones and biotic communities are quite generally in
agreement.
As ordinarily presented in America, however, the two systems
are so completely out of harmony as to viewpoint, that it is best to
leave the life zones to the field of zoogeography, having for its aim
the explanation of evolutionary phenomena, but with no ideas of mod-
ern community analysis or experimental work. The American life
zone viewpoint has been carried so far in the United States Biological
Survey that it has faced modern problems of biotic balance, relation
to weather and other relations of agriculture, and grazing without suit-
able scientific foundation.
Modern ecology is concerned with the dynamics of communities.
Their development in denuded or other new areas has occupied a
large amount of attention and the final stage of this development is
taken to stand out as the chief guide to such mappings as are shown
in figure 31. Competition between species, both plant and animal,
control of the habitat by organisms, fluctuations in abundance and
their causes, are the chief interests of modern ecologists. Their work

Failure of Temperature Summing and Life Zones 157
has essentially little relation to the mere mapping of regions based
upon a record of occurrence of genera, in which abundance, domi-
nance, or influence of species in the community are matters of no
concern. Such mapping comes into the field of ecology only when a
consideration of the long historical development of the aggregations
of species with changes in climate is sought.
European ecologists refer from time to time to North American
life zones (Elton, ‘27, p. 11) as ecological regions. The Russian
ecologists (Kashkarov ‘27, Filipjev ‘29B, and Kashkarov and Korovin
‘31) use life zones which correspond to the vegetation. Filipjev has mapped what is essentially the vegetation of Eurasia as Zife zones.
The secondary and purely qualitative faunistic character of the life
zones recognized in North America by mammalogists and ornithologists
and their lack of agreement with natural ecological regions (com-
munities) outside the western mountains has hitherto not been made
clear to them. BIBLIOGRAPHY
1928. Anthony, H. E. Field book of North American mammals. 1923A. Dice, Lee R. Life zones and mammalian distribution. Jour. Mammalogy,
4 (1):43. 1923B. Dice, Lee R. Mammal associations and habits of the Flathead Lake
region, Montana. Ecol. 4 (3) :259-260. 1929. Elton, Charles. Animal ecology. London. 1929A. Filipjev, I. N. The locust question in Soviet Russia. International
Cong. of Ent.; 2:803-812. 1929B. FiliDiev. I. N. Life-zones in Russia and their iniurious insects. Inter-
1914.
1919.
1921. 1927.
1931.
1932.
1921.
1892.
1899. 1906.
1929. 1930.
1876.
nation’ai dong. of Ent., 2:813-820. Grinnell, Joseph. An account of the mammals and birds of the lower Colorado valley. Univ. of Calif. Pub. in Zool., 12:51-294. Hall, H. M. and J. Grinnell. Life zone indicators in California. Proc. Cal. Acad. Sci., 9:37-67. Howell, Arthur H. North American fauna. No. 45. U. S. Dept. Agri. Kashkarov, Daniel N. An ecological survey in the environments of the Lake Sary-Tshilek, North Ferghana. Title of abstract. (Jour. of the Middle Asiatic Committee on Museums and Protection of Historical Monu- ments of Art and Nature) Title of Journal in Russian. Kashkarov, Daniel N. and E. Korovin. Essay on the analysis of the eco- logical routes of the distribution of the flora and fauna in Middle Asia. Title of abstract. Jour. of Ecol. and Biocenol. 1:58-87. Kendeigh, S. Charles. A study of Merriam’s temperature laws. WILSON BULLETIN, 44 : 129-143. Livingston, Burton E. and Forrest Shreve. Distribution of vegetation in the United States. Publ. Carnegie Inst. of Wash. No. 284. Pp. 528.529. Merriam, C. Hart. The geographic distribution of life in North America. Smithsonian Rep. 1891:365-415. Merriam, C. Hart. Zone temperature. Science n. s. 9(212) :116. Pilsbry, H. A. and J. H. Ferriss. Mollusca of the southwestern states. Proc. Acad. Nat. Sciences of Philadelphia. 58:123. Shelford, Victor E. Laboratory and field ecology. Baltimore. Shelford, Victor E. Phenology and one of its modern descendants. Quart. Rev. of Biol. 5:207-216. Wallace, Alfred R. The geographical distribution of animals.
UNIVERSITY OF ILLINOIS,
CHAMPAIGN, ILLINOIS.


