Download - Lic Profile

PROFILE OF LIFE INSURANCE CORPORATION OF
INDIA
INTRODUCTION
The present chapter portrays the marketing activities of LIC of India
and discusses briefly the business performance of the Corporation during
the period before and after liberalization of the insurance sector. An
attempt is made to compare the business performance of LIC with that of
the private players and the impact of privatization on LIC.
Life insurance business in India was being transacted by private
companies until 1956. As a result of the long felt need and in the interest
of insuring public, the life insurance business was nationalized in 1956. The
nationalization resulted in the establishment of Life Insurance Corporation
of India (LIC) by an act of the Parliament. The Corporation was formed and
began to function on September1, 1956 by taking over 170 companies and
75 provident societies. The entire initial capital of Rs.5crore was contributed
by the government of India. The objective of nationalization was described
by the then finance minister, Dr. Deshmukh as “to see that the gospel of
insurance is spread as far and wide as possible so that we reach beyond the
more advanced urban areas well into the hither to neglected rural areas” 1.
Headquartered in Mumbai, which is considered the financial capital of
India, Life Insurance Corporation of India currently has 8 Zonal Offices,
101Divisional Offices, 2048 Branch Offices located in different cities and
towns in India. The Corporation has a network of above one million agents
for soliciting life insurance business from the public 2. It is the largest life
insurance agency in the world. The LIC also transacts business abroad and

has offices in Fiji, Mauritius and United Kingdom. The Corporation is
associated with joint ventures abroad in the field of insurance, namely, Ken-
India Assurance Company Limited, Nairobi, United Oriental Assurance
Company Limited, Kuala Lumpur and Life Insurance Corporation
(International) E.C. Bahrain.
As a result of the insurance sector reforms process initiated in India,
the monopoly of the Corporation came to an end in 2000. The long 44
years of monopoly shows many ups and downs in the business of LIC. The
Corporation has been rated as No.1 Company in net worth and net profits
and No. 2 in total income in India.
Objectives of the Life Insurance Corporation of India
The Life Insurance Corporation of India (LIC) was set-up by the
Government of India to achieve the following objectives: 3
Spread Life Insurance widely and in particular to the rural areas and to
the socially and economically backward classes with a view to reaching
all insurable persons in the country and providing them adequate
financial cover against death at a reasonable cost.
Maximize mobilization of people’s savings by making insurance linked
savings adequately attractive.
Deploy the funds to the best advantage of the investors as well as the
community as a whole, keeping in view national priorities and
obligations of attractive return.
Conduct business with utmost economy and with the full realization that
the moneys belong to the policy holders.
Act as trustees of the insured public in their individual and collective
capacities.
Meet the various life insurance needs of the community that would arise
in the changing social and economic environment.
101

Involve all people working in the corporation to the best of their
capabilities in furthering the interests of the insured public by providing
efficient service with courtesy.
Promote amongst all agents and employees of the Corporation a sense
of participation, pride and job satisfaction through discharge of their
duties with dedication towards achievement of corporate objectives.
Organizational Structure of LIC of India
The Life Insurance Corporation Act, 1956 gives broadly the pattern of
its organization which is given in Figure 4.1.
CHAIRMAN
MANAGING DIRECTORS
Central Office (Mumbai)
Zonal Offices -8
Hyderabad Delhi Bhopal PatnaMumbai Kolkatta Chennai
Kanpur
102
LIFE INSURANCE CORPORATION OF INDIA
BOARD OF DIRECTORS
Divisional Offices - 101
Branch Offices - 2048

Figure 4.1. Organizational set up of Life Insurance Corporation of
India
The Corporation consists of members not exceeding 15 in number
appointed by the Central Government. The Chairman is the chief executive
of the Corporation. Various committees of the Corporation are constituted
under the Life Insurance Corporation Act and the regulations framed there
under. General superintendence and direction of the affairs of business of
LIC is entrusted to the Executive Committee which would be formed from
among its own members not exceeding five. The Chairman of the
Corporation is the Chairman of all these committees. The organizational
structure envisaged by the Act consists of a four-tier structure. The central
office at the top is primarily concerned with the formulation of policies.
Below the central office there are zonal offices to assist the central office in
the matter of development, planning and review of business and
supervision of divisional offices within their jurisdiction. Divisional office is
akin to a head office of an erstwhile insurer and is concerned with all
activities of the insurer from procurement of new business to settlement of
claims. Under each divisional office there are branch offices and sub-
offices.
At the time of nationalization, LIC had 5 Zonal Offices, 33 Divisional
Offices and 240 Branch Offices. As on 31st March 2007, the Corporation has
8 Zonal Offices, 101 Divisional Offices, 2048 Branch Offices and 132
Satellite Offices (SOs) 4. One Divisional Office at Mumbai is functioning
exclusively for business under Salary Savings Scheme.
MARKETING ACTIVITIES OF LIFE INSURANCE CORPORATION OF
INDIA
103

A life insurance company’s success reflects the consolidated effort of
all of its activities. These activities may be arranged into three major
functional classifications – marketing, investments, and administration. Of
these three areas, marketing is the largest in terms of both personnel
requirements and costs and is critical to success5.
Insurance marketing is an effort to transform the prospects into
actual policyholders6. The twofold goal of marketing is to attract new
customers by promising superior value and to keep current customers
satisfied by delivering value added services 7. Ensuring life security to an
individual and his family calls for the concerted efforts at four levels,
namely; (i) Insurer (LIC of India), (ii) Branch Manager, (iii) Development
officer, and (iv) Agent (Intermediary). The duties and responsibilities of
different functionaries of LIC of India are briefly described in the following
pages.
Central Office
The Central Office located at Mumbai has mainly a policy making and
co-ordinating role. In general, at the Central Office broad policy decisions
are taken on the recommendations of the Departmental Heads by the
Chairman or the appropriate committee of the Corporation or the
Corporation itself. Marketing department of the Central Office deals with
the planning of the development of new business, opening up of new
offices. All matters relating to development officers and agents are
processed by the marketing department of the Central Office, in assistance
with the various operating Divisional Offices. The foreign operations cell of
the marketing department handles all foreign business of the Corporation.
The Corporation mobilizes peoples’ savings and invests the same according
to the investment priorities prescribed by the IRDA Regulations and the LIC
104
of India Act, 1956. It acts as trustees of the policyholders. It is the duty
and responsibility of the Corporation to conduct business with care.
Product development and pricing are the important functions of the
Corporation. It is the function of the Development Department to develop
training programme for branch officials, development officers and agents.
Publicity and public relations are also looked after by this department.
Zonal Office
The Zonal Offices of the Corporation are at Mumbai, Hyderabad, New
Delhi, Bhopal, Kanpur, Patna, Kolkatta, and Chennai. Southern Zone
comprises of the States of Tamil Nadu, Kerala, Union Territories of
Pondicherry and Lakshadweep. A Zonal Office has under its jurisdiction a
number of Divisional Offices as well as Branch Offices for effective and
better services to the policyholders. The marketing department at the
Zonal Office prepares marketing strategy for development of new business.
Proposals on sub-standard risk and proposals beyond the limits of the
divisional offices are underwritten by the Zonal Offices. It reviews the
Divisional Office’s budget for various departments, aids and advises
Divisional Offices for better services to policyholders, conducts product
research, and organizes the training programme for the Development
Officers.
Divisional Office
A divisional office is akin to a head office of an erstwhile insurer and
is concerned with all activities of the insurer from procurement of new
business to settlement of claims. There are 12 Divisions in the Southern
Zone; 8 in Tamil Nadu and 4 in Kerala. The Divisional Offices in Kerala are:
(1) Thiruvananthapuram, (2) Kottayam, (3) Ernakulam and (4) Kozhikode.
The branches in Kasargod and Kannur districts fall under the jurisdiction of
Kozhikode Division.
105
The marketing department at Divisional Office supervises the quality
of work done in various branches through its various sections. The sales
section is entrusted with the functions of product research vis-à-vis the
markets, review of branch plans to develop agency force, recruitment of
agents, appointment of development officers, opening of branches,
allocation of territories between branches, analysis and review of monthly
performance of branches, conducting of training programme for Assistant
Branch Managers (sales), Development Officers and Agents, deciding cases
beyond the branch authority, processing of ‘early claims’, etc. As on March
31, 2007, there were 101 divisional offices in India including one salary
savings scheme (SSS) division at Mumbai.
Branch Office
The Branch Office of the Corporation is the main operating office in
the sense that this is the only office where sales of insurance products are
made and services given. At the time of nationalization LIC had 240 branch
offices; the number increased to 2,048 by 1998 8. During the period
between 1998 and 2007 no single branch office was opened. But with a
vision of providing easy access to its policyholders, LIC has launched as
many as 132 Satellite Offices (SOs) during the period from 2005 to 2007.
These satellite offices, which are attached to the respective parent
branches, are basically an extension of the large parent branches for
services to policyholders. Processing of new proposals and collection of
renewal premium are the main functions of these offices.
Each branch is given a specific area of operation and is expected to
strictly adhere to the territorial limits for procuring business. New business
is brought in by licensed agents, banks under the bancassurance and
corporate agents. Issue or renewal of license to agents is made according
106
to the provisions contained in the Insurance Regulatory and Development
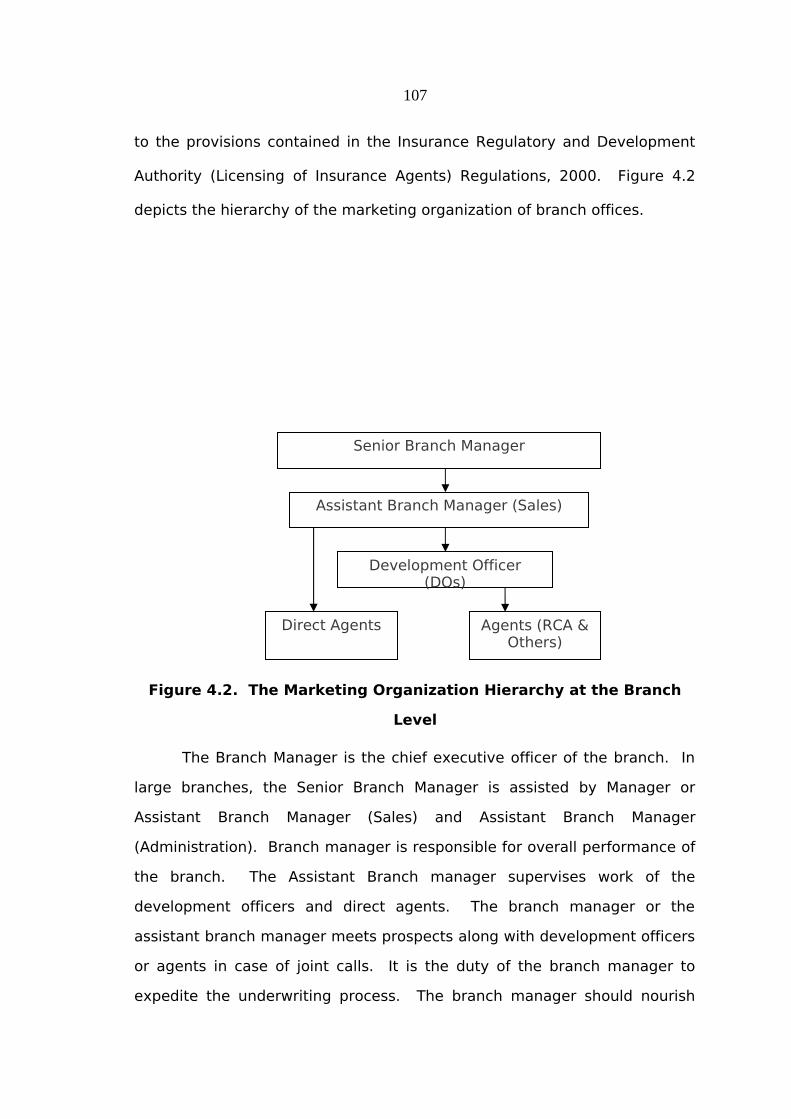
Authority (Licensing of Insurance Agents) Regulations, 2000. Figure 4.2
depicts the hierarchy of the marketing organization of branch offices.
Figure 4.2. The Marketing Organization Hierarchy at the Branch
Level
The Branch Manager is the chief executive officer of the branch. In
large branches, the Senior Branch Manager is assisted by Manager or
Assistant Branch Manager (Sales) and Assistant Branch Manager
(Administration). Branch manager is responsible for overall performance of
the branch. The Assistant Branch manager supervises work of the
development officers and direct agents. The branch manager or the
assistant branch manager meets prospects along with development officers
or agents in case of joint calls. It is the duty of the branch manager to
expedite the underwriting process. The branch manager should nourish
Senior Branch Manager
Assistant Branch Manager (Sales)
Development Officer (DOs)
Agents (RCA & Others)
Direct Agents
107
enthusiasm in employees and agents. Preparing performance budgets at
the branch level, timely reporting of performance of the branch to Divisional
Office, and prompt and unfailing service to the customers are the duties of
the branch manager.
Development Officers
Development officers are the field personnel in the distribution of life
insurance products. They create time, place and possession utility to
insurance products. They can appoint agents and give the initial training
for selling life insurance products. The duties and responsibilities of a
development officer shall be:
To develop and increase the production of life insurance business in a
planned way as far as may be practicable in the area allotted by the
Corporation.
To guide, supervise and direct the activities of the agents placed
under their supervision by the Corporation.
To introduce suitable persons to the Corporation for appointment as
new agents.
To act generally in such a way as to activate existing agents and
motivate new agents, so as to develop a stable agency force.
To render all such services to policyholders conducive to better policy
servicing.
To carry out the investigation of claims, revival of lapsed policies and
liaison work in connection with the Salary Savings Scheme business.
It is the obligation of development officers to ensure that the agents
under them conduct their work and / or business strictly in accordance with
the provisions of the Insurance Act, 1938 and Rules framed there under, LIC
of India (Agents) rules 1972 read with IRDA (licensing of Insurance Agents)
108
Regulations, 2000 as amended from time to time and in the best interest of
the Corporation.
Individual Agents
Individual agents are the most important distribution channels in life
insurance marketing. The success of an insurance company is highly
dependent on the army of agents and brokers 9. The Insurance Act, 1938
defines “Insurance Agent” as agent licensed under section 42 being an
individual who receives or agrees to receive payment by way of commission
or other remuneration in consideration of his soliciting or procuring
insurance business including business relating to the continuance, renewal
or revival of policies of insurance. Individual agents are classified into
Direct Agents and Career Agents. The Corporation has a scheme of career
agents to promote the cause of professionalising the agency force. There
are two types of Career Agents: (i) Urban Career Agents (UCAs), and (ii)
Rural Career Agents (UCAs). UCAs are recruited for the Career Branch at
the Divisional Office. To carry out the field operations, the Divisional
Marketing Manager appoints career agents and ordinary (direct) agents on
the recommendation of the Branch Manager. Direct agent’s job is
supervised by the Branch Manager or Assistant Branch Manager (Sales) and
career agent’s job is supervised by the development officer. Career agents
are paid stipend for three years and they are given training at the branch
office.
The regulation regarding appointment, licensing and remuneration of
agents are laid in the Insurance Agents’ Regulations, 2000 of the IRDA Act.
As per the Regulation, each person aspiring to be an agent has to undergo
practical training of 100 hours in life or general insurance, as the case may
be. In case of composite agent, he/she should have completed at least 150
hours of practical training in life and general insurance business combined.
109

The training has to be conducted by an institute approved and notified by
the IRDA.
An agent is required to do a Minimum Business Guarantee (MBG) of
12 policies (12 lives) in a year. If he/ she can’t achieve the minimum
guaranteed business, agency is terminated. There is no limit regarding the
number of career agents that a development officer can recruit and
supervise. Similar is the case of direct agents. The functions of agents laid
down in Rule 8 of the Life Insurance Corporation of India (Agents) Rules
1972 are as under 10.
Every agent shall solicit and procure new life insurance business which
shall not be less than the minimum prescribed in these rules and shall
endeavour to conserve the business already secured.
In procuring new business, an agent shall take into consideration the
needs of the prospect and his premium paying capacity.
The agent should make all reasonable enquiries in regard to the lives to
be insured before recommending proposals for acceptance. He should
bring to the notice of the Corporation any circumstances which may
adversely affect the risk to be underwritten. For this purpose, Agent’s
Confidential Report and in all cases of large sum proposed, a Moral
Hazard Report (MHR) is obtained from agents.
An agent shall not interfere with any proposal introduced by any other
agent.
Every agent shall maintain contact with all persons who have become
policyholders of the Corporation through him and shall advice every
policyholder to effect nomination or assignment in respect of their policy
and offer necessary assistance in this behalf.
110

The agent shall endeavour to ensure that the policyholder remits
premium within the days of grace, and prevent lapsing of a policy or its
conversion into a paid-up policy.
Render all reasonable assistance to the claimants in filling claim forms.
As per the Rules, agents are strictly prohibited:
• From advancing premium on behalf of proposers or policyholders.
• From printing, publishing or circulating any leaflets, handbills or
advertisements, etc. relating in any way to the Corporation even
at their own cost.
• From allowing or offering to allow directly or indirectly commission
or rebate to a proposer or life assured.
• From collecting any moneys from proponents or policyholders.
They may however collect deposits towards the first premium and
renewal premium, and remit the same to the Corporation
immediately.
The total number of agents on roll of the Corporation was 11,03,047
as at 31st March, 2007 against 10,52,283 as at 31st March 2006. Agents get
commission at the prescribed rate in respect of policies canvassed by them.
The rate of commission is 2 percent for single premium and on regular
premium policies it varies between 5 to 25 percent and depends on type of
policies11. Life insurance salesmen, unlike other salesmen, receive renewal
commission on their past business. Renewal commission is paid for
continued service the agent is expected to render to the policyholders.
Unlike the case of other commodities, insurance customers do not
normally go in search of agent or the product. The agent has to find out
people, meet them, discuss with them, and convert the prospect in to
customer. Different steps followed in insurance selling process are given in
111

figure 4.3. A sale results when the salesman takes the prospect along with
him through well defined steps. These steps are not separate and clear-cut
but blend into one integrated process if it can be so called.
Figure 4.3. Life Insurance Selling Process
Source: Yogakshema, Vol. IX, Issue 1, January 2001.
Over the years on account of the trust and the huge network of
agents that has been built, LIC has come to occupy a special place in the
hearts of its policy holders. The impact that the agent will make on his
prospect on the basis of his personality, knowledge and presentation skills
will be crucial and may finally help him to close the sale. The agent will
also have to work from the point of view of the best interest of the
customer; his own interest will have to get relegated to secondary place 12.
Table 4.1 shows the growth in the number of active agents and their
average business during the last twelve years from 1996 to 2007. The
total number of agents on the roll of LIC was 11,03,047 as at 31.03.2007 as
against 10,52,283 as at 31.03.2006. Whereas the number of active agents
was 10,28,047 as at 31.03.2007 as compared to 9,87,689 as at
31.03.2006.
112
Prospecting Pre-approach and Approach
Interview Solicitation
Policy Preparation
Underwritting Acceptance Offer-Proposal
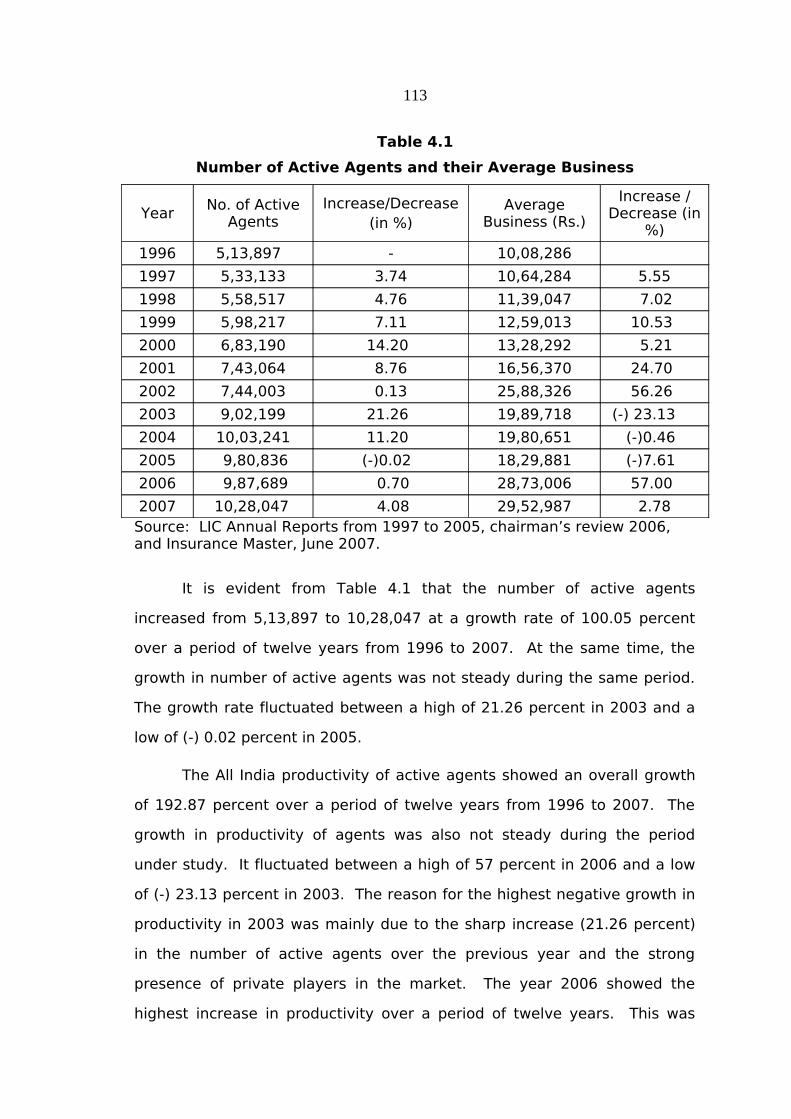
Table 4.1
Number of Active Agents and their Average Business
YearNo. of Active
AgentsIncrease/Decrease
(in %)Average
Business (Rs.)
Increase / Decrease (in
%)
1996 5,13,897 - 10,08,286
1997 5,33,133 3.74 10,64,284 5.55
1998 5,58,517 4.76 11,39,047 7.02
1999 5,98,217 7.11 12,59,013 10.53
2000 6,83,190 14.20 13,28,292 5.21
2001 7,43,064 8.76 16,56,370 24.70
2002 7,44,003 0.13 25,88,326 56.26
2003 9,02,199 21.26 19,89,718 (-) 23.13
2004 10,03,241 11.20 19,80,651 (-)0.46
2005 9,80,836 (-)0.02 18,29,881 (-)7.61
2006 9,87,689 0.70 28,73,006 57.00
2007 10,28,047 4.08 29,52,987 2.78Source: LIC Annual Reports from 1997 to 2005, chairman’s review 2006, and Insurance Master, June 2007.
It is evident from Table 4.1 that the number of active agents
increased from 5,13,897 to 10,28,047 at a growth rate of 100.05 percent
over a period of twelve years from 1996 to 2007. At the same time, the
growth in number of active agents was not steady during the same period.
The growth rate fluctuated between a high of 21.26 percent in 2003 and a
low of (-) 0.02 percent in 2005.
The All India productivity of active agents showed an overall growth
of 192.87 percent over a period of twelve years from 1996 to 2007. The
growth in productivity of agents was also not steady during the period
under study. It fluctuated between a high of 57 percent in 2006 and a low
of (-) 23.13 percent in 2003. The reason for the highest negative growth in
productivity in 2003 was mainly due to the sharp increase (21.26 percent)
in the number of active agents over the previous year and the strong
presence of private players in the market. The year 2006 showed the
highest increase in productivity over a period of twelve years. This was
113

because of the aggressive marketing strategy followed for LIC’s golden
jubilee product ‘Bima Gold’ and active participation of many agents in the
campaign. Up on analysis of Table 4.1, one could find that the increase in
number of active agents was not followed by proportionate increase in
productivity.
Alternative Channels
Any sales process which does not involve the tied channels will be
called an alternative channel13. Channels play a pivotal role in marketing ;
they perform a number of vital distribution functions. Firms rely on the
marketing channels for generating customer satisfaction and for achieving
differentiation over competitors. Channels are thus a vital source of
competitive advantage. Agents were the only mode of distribution of life
insurance products in India till 2003. Today a number of innovative
alternative channels are being offered to consumers. The alternative
channels became popular in India with the emergence of private players
with foreign collaboration14. Some of them are Bancassurance, Brokers,
Corporate Agents, Internet Marketing, Tele Marketing, etc. The figure 4.4
gives a clear picture of the marketing channels of LIC.
Figure 4.4. Marketing Channels of LIC
114
Individual Agents
Alternative Channels
Bancassurance Broker
s
Corporate Agents
Marketing Channels of LIC
Bancassurance
Bancassurance in its simplest form is the distribution of insurance
products though banks distribution channels. The concept of bancassurance
originated in France and the first bancassurer started its operation way
back in the 1970s. The success of bancassurance in France attracted the
attention of banks and insurers all over the world and it spread
subsequently in other parts of Europe, USA, Australia, and Asia 15.
However, the concept was introduced in India in the year 2003.
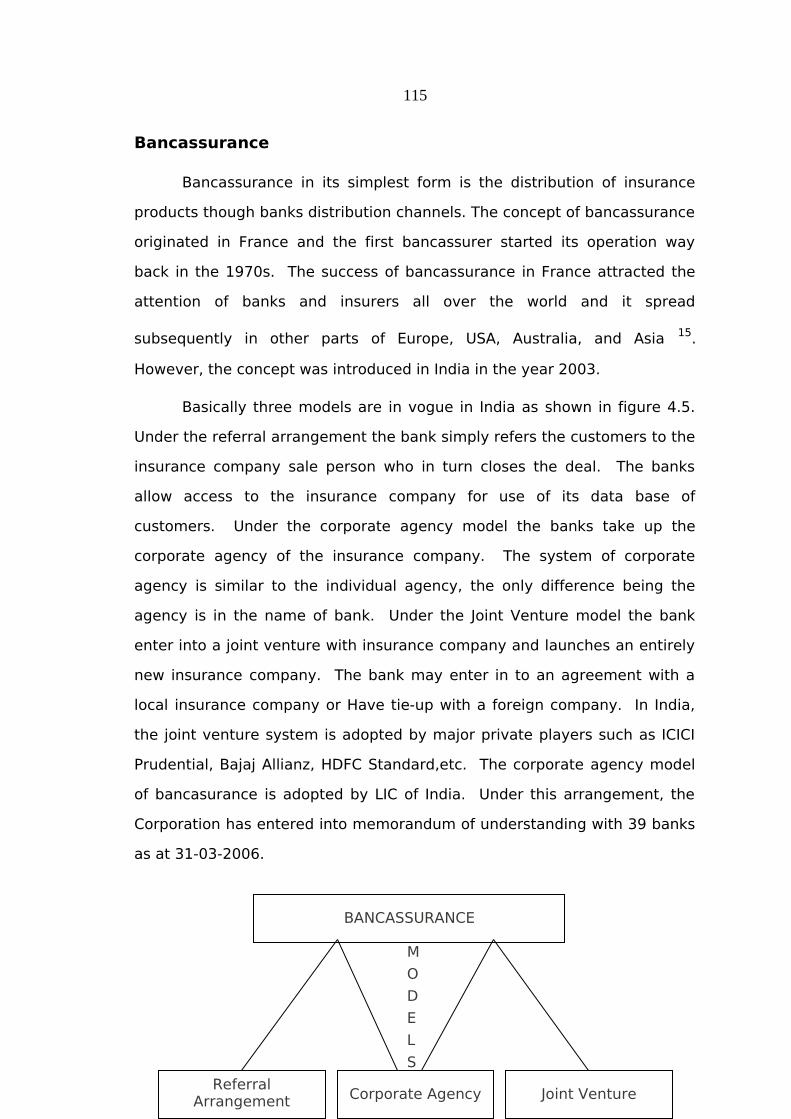
Basically three models are in vogue in India as shown in figure 4.5.
Under the referral arrangement the bank simply refers the customers to the
insurance company sale person who in turn closes the deal. The banks
allow access to the insurance company for use of its data base of
customers. Under the corporate agency model the banks take up the
corporate agency of the insurance company. The system of corporate
agency is similar to the individual agency, the only difference being the
agency is in the name of bank. Under the Joint Venture model the bank
enter into a joint venture with insurance company and launches an entirely
new insurance company. The bank may enter in to an agreement with a
local insurance company or Have tie-up with a foreign company. In India,
the joint venture system is adopted by major private players such as ICICI
Prudential, Bajaj Allianz, HDFC Standard,etc. The corporate agency model
of bancasurance is adopted by LIC of India. Under this arrangement, the
Corporation has entered into memorandum of understanding with 39 banks
as at 31-03-2006.
115
Referral Arrangement Corporate Agency Joint Venture
M
O
D
E
L
S
BANCASSURANCE

Figure 4.5. Bancassurance Models in India
Source: The Insurance Times, October 2004.
Corporate Agents
Many companies, firms, non-banking finance companies, co-
operative societies, etc., are also taking corporate agencies to market
insurance products. As on 31st March 2007, LIC had tie up with 628
corporate agents across the country. The Kerala State Financial Enterprises
Limited and District Co-operative Banks function as the corporate agents of
LIC in Kannur and Kasargod districts to sell life insurance products.
Brokers
The institution of brokers in India is in a nascent stage. But brokers,
who are professionals in the area of insurance, will be acting on behalf of
the customers, rendering quality advice to them not only on the products
but also on the life insurance company through which they can take such
products. There were 103 brokers in the marketing network of LIC as on
31st March, 2006 16. Table 4.2 reveals the percentage of new business
premium underwritten by the intermediaries of LIC and private players
during the four year period immediately following the year of introduction of
bancassurance in India.
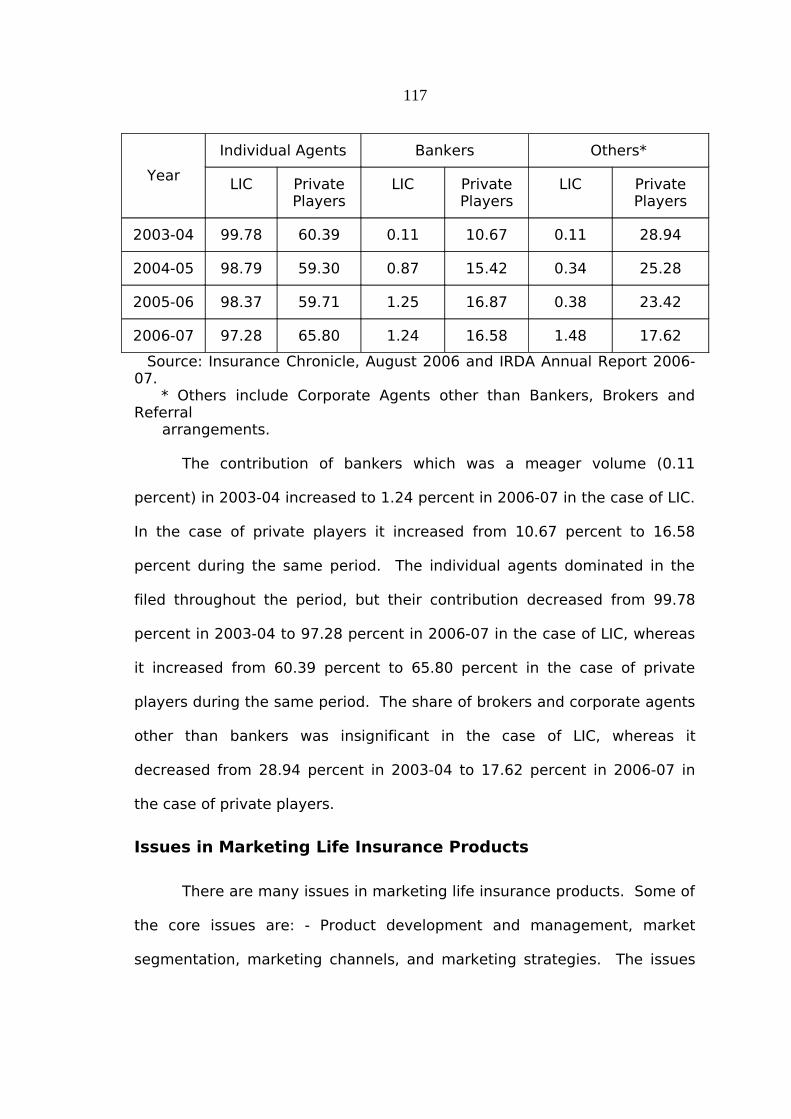
Table 4.2
New Business Premium Underwritten through Various
Intermediaries
(In percent)
116
Year
Individual Agents Bankers Others*
LIC Private Players
LIC Private Players
LIC Private Players
2003-04 99.78 60.39 0.11 10.67 0.11 28.94
2004-05 98.79 59.30 0.87 15.42 0.34 25.28
2005-06 98.37 59.71 1.25 16.87 0.38 23.42
2006-07 97.28 65.80 1.24 16.58 1.48 17.62
Source: Insurance Chronicle, August 2006 and IRDA Annual Report 2006-07. * Others include Corporate Agents other than Bankers, Brokers and Referral arrangements.
The contribution of bankers which was a meager volume (0.11
percent) in 2003-04 increased to 1.24 percent in 2006-07 in the case of LIC.
In the case of private players it increased from 10.67 percent to 16.58
percent during the same period. The individual agents dominated in the
filed throughout the period, but their contribution decreased from 99.78
percent in 2003-04 to 97.28 percent in 2006-07 in the case of LIC, whereas
it increased from 60.39 percent to 65.80 percent in the case of private
players during the same period. The share of brokers and corporate agents
other than bankers was insignificant in the case of LIC, whereas it
decreased from 28.94 percent in 2003-04 to 17.62 percent in 2006-07 in
the case of private players.
Issues in Marketing Life Insurance Products
There are many issues in marketing life insurance products. Some of
the core issues are: - Product development and management, market
segmentation, marketing channels, and marketing strategies. The issues
117
regarding marketing channels were discussed in the preceding pages. The
other core issues are elaborated in the following pages.
Product Development and Management
In marketing, a product is anything that can be offered to a market
that might satisfy a want or need. When used as a business term, a
‘product’ can be either a physical, tangible good or service. A product is
both what a seller has to sell and what a buyer has to buy17. The policy is
termed as product in life insurance business. Since, in insurance business
the companies are engaged in selling services, and therefore, services are
their products18. Product management involves developing strategies and
tactics that will increase product demand over the products life cycle.
When an individual or an organization buys a policy from insurance
companies, not only policies are bought but agent’s assistance, advice and
prestige of insurance companies and the facilities of claim are also
bought19.
New product development starts with idea generation – the
systematic search for new-product ideas. Major sources of new-product
ideas include internal sources, and external sources such as customers,
competitors, agents and others. Using internal sources, the LIC find new
ideas through formal research survey and development. Meetings at
branch office and divisional office level with development officers, agents,
and customers, etc. will be helpful in understanding their needs and
requirements which will lead to development of new product ideas.
Practices developed by the marketing wing will encourage generation of
118
new ideas which can be screened and brought up to the Zonal Office (Z.O.)
and Central Office (C.O.). Procedures would also be evolved which would
facilitate interaction between marketing and actuarial wing so that
thorough consideration is given to feasibility of proposals vis-a-vis customer
needs and pricing.
Life Insurance Corporation offers a basket of schemes to meet the
various needs of an individual and his family. Only individual plans are
available for sale from branch offices through the intermediaries. The
group schemes and social security schemes are sold through Divisional
office. Under group scheme, LIC offers life insurance protection to various
groups such as employer-employee, professionals, co-operatives, weaker
sections of the society, etc.
119

Fig 4.6. LIC’s products
1. Basic Life Insurance Plansa) Whole Life Schemeb) Endowment Scheme
1. Group Term Assurance Schemes
1 Janasree Bima Yojana (JBY)
2. Term Assurance Plans Anmol Jeevan-I, New Bima Kiran. 3. Plans for Children Jeevan Anurag, KomalJeevan, Jeevan kishore, Jeevan Chhaya, Marriage/Education, Deferred Endowment.
4. Pension Plans – JeevanNidhi, Jeevan Akshay, New Jeevan Dhara, New Jeevan Suraksha, Future Plus.
5. Plans for HandicappedDependents – Jeevan Adar, Jeevan Viswas.
6. Joint Life PlanJeevan Sathy.
8. Unit Linked Plans - Bima Plus, Future Plus, Market Plus, Money Plus.
2. Group Term Insurance in lieu of EDLI
3. Group Gratuity Scheme
4. Group Super Annuation Scheme
5. Group Savings Linked Insurance
6. Group Leave Encash- ment Scheme
7. Group Mortgage Redemption Insurance
8. Scheme for Deposit Holders of Banks
2 Shiksha Sahayog Yojana (SSY)
7. Periodic Money Back PlanJeevan Rekha, Jeevan Surabhi, Jeevan Bharathi
9. Other Plans.
II GROUP SCHEMESI INDIVIDUAL PLANS III SOCIAL SECURITY SCHEMES
120
L I C’S P R O D U C T S

Figure 4.6 depicts popular plans developed by LIC. The object of
Social Security Scheme is to provide insurance protection to the rural and
urban poor below the poverty line or marginally above it. Under the
Janashree Bima Yojana, 50 percent of the premium is subsidized from the
Social Security Fund maintained by LIC and the remaining 50 percent is
contributed by members / Nodal agency / State Government. Products
launched by LIC before IRDA set up were 127. Products cleared by IRDA up
to 2007-08 are 46 plus 8 rider benefit products.
Unit-Linked Products of LIC
Unit-Linked policy is a new generation product which became popular
in Indian market after the entry of private players. Internationally, till
1960s, life insurance policies were sold as traditional or non-linked policies.
A unit-linked plan provides an opportunity for the discerning investor to
benefit from the returns available in the capital market without going for
direct investment in the capital market. In ULIPs, the investment element,
expenses and benefits are to the account of the policyholder20.
During the period from 2000 to 2007, LIC introduced five unit linked
policies such as Bima Plus, Future Plus, Jeevan Plus, Market Plus, and Money
Plus. Future Plus is a ULIP pension plan. The Bima Plus and Future Plus
ULIPs were closed for sale in the year 2006.
The Corporation grew at a rate of 23 percent in FPI during the pre-
liberalisation period (i.e., from 1994-95 to 1999-2000), whereas during the
competition period from 2000-01 to 2005-06, the average growth rate was
41 percent. The private sector has also performed well, growing at a rate of
105 percent 21. The analysis of the market performance indicates two
specific reasons for this growth. One, the market has shifted from
conventional products to ULIPS. Two, introduction of pure protection
121
products and riders and add-ons have changed the market. About 80 per
cent of the premium income of private players was from ULIPs, whereas it
was about 20 percent in the case of LIC in the year 2004-05. From 2005-06
onwards, LIC also has shifted from conventional products to ULIPs and
about 45 percent of the premium income was from this segment.
Life insurance companies give much importance to ULIPs because
these products impose very little liability on companies compared to
conventional products. As per the IRDA rules, an insurance company need
to keep 1.5 times of its insurance liability as solvency margin. In the case
of conventional products the entire premium amount is used for insurance
coverage, whereas only 20 percent of ULIPs premium amount is used for
insurance coverage. Therefore, companies are in a better position to make
available insurance products with low capital. But, focusing exclusively on
these could impair growth and long-term profitability for India’s life insurers
22.
Market Segmentation for LIC
The market for life insurance business is found vast, the potential
policyholders are large in number and their needs and requirements are not
identical. If the market segmentation is done in a right fashion, the
marketers find it convenient to identify the level of expectations of users.
The main purpose of market segmentation is to know the market. Unless
the Corporation knows the needs and requirements and identifies the level
of expectations of the policyholders, it is difficult to formulate a sound
marketing strategy.
122

Figure 4.7. Market Segmentation for LIC
The segmentation would help insurance professionals in making the
promotional measures creative which would be very much instrumental in
sensitizing the prospects. The advertisement appeals, messages,
campaigns can be made proactive to the receiving capacity of the target
audience. The sales promotion measures can also be innovated to get a
positive response. The segmentation would help insurance companies for
better product designing, identifying the agents for various segments and
preparing those agents to cater to their needs. Segment wise collected
SEGMENTS Sub-segments
REGION WISE
Central ZoneNorthern “ “Eastern “ “Southern “ “Western “ “
AREA WISE Urban AreaRural Area
INDUSTRIAL SECTORPublic sectorPrivate sector
Co-operative sector
INSTITUTIONAL SECTOR Universities, Colleges,Schools, Institutes
TRADE SECTOR Small businessBig business
GENDER WISE Men, Women
AGE WISE Kids, Teens, Youth, Grey
HOUEHOLD SECTORSalaried classSelf employed
Retired employeesWage earners
123

data simplifies the task of branch manager, especially while identifying a
profitable segment23.
Marketing Strategies of LIC
Just like manufacturing businesses, good service firm use marketing
to position them strongly in chosen target markets. Since services differ
from tangible products, they often require additional marketing approaches.
Successful service companies focus their attention on both their customers
and their employees. This suggests that services marketing also require
internal and interactive marketing24. The Corporation effectively train and
motivate its customer-contact employees and all the supporting service
people to work as a team to provide customer satisfaction. The Corporation
provides in house training facilities and external training opportunities to its
employees. Officers in the executive cadre were trained at MDC, Mumbai,
Insurance Institute of India located at 25 centres throughout India, and NIA,
Pune. Depending on the training needs, LIC also expose their agents and
development officers to different External Training Institutes (ETIs) for
specialized training.
During the year 2005-06, MDC conducted a total of 87 programmes
and training was imparted to 2,230 officials. Development officers and
agents were trained at 8 Zonal Training Centres, 25 Sales Training Centres,
101 Divisional Training Centres, and 520 agents’ Training Centres. In
addition to the above, meeting of managers at different levels,
development officers and agents were used to be conducted frequently, at
branch offices and divisional offices to evaluate the business performance
and services provided to customers.
One of the hottest strategies in marketing today is Customer
Relationship Marketing (CRM). CRM in life insurance is about understanding
the policyholders’ needs and encouraging this knowledge to increase sales
124

and improve service quality. CRM requires a team approach to serve the
policyholders, which makes it easier to take care of the needs and
expectations of the policyholders. At the branch offices of the Corporation,
there is one Customer Relations Executive to understand the policyholders’
needs and behaviours. This officer is required to hold at least two meeting
of customers; one before 31st January and second before 30th September of
every year. At the divisional office, the Manager Planning is given the
additional charge of Customer Relations Manager.
The Manager (Planning) at the divisional office has to prepare the
business budget for the branches under the control of the division, after
conducting market survey. But in actual practice, the budget is prepared
by adding a certain percentage (20% to 25%) to the previous year’s actual
performance. Designing and development of products take place at the
Central Office of the Corporation. The marketing strategies for the products
identified to market are also developed at the Central Office. But selection
of banks and other corporate agents, signing Memorandum of
Understanding (MoU) with them, etc. is done at the divisional office.
Advertising and other promotional activities, excepting erection of banners
and boards are done at the Zonal office level.
The marketing strategies of LIC are influenced by various factors.
Changes in the external and internal environment such as the Government
policies, financial markets, competitors’ policies, customer expectations,
regulatory mechanisms, technological developments, global scenario of
insurance market, etc. influence the marketing strategy of the Corporation.
BUSINESS PERFORMANCE OF LIC
With the opening of the insurance sector in 1999, more than a score
players entered into the insurance market. These new players have grown
steadily over a period of time and captured more than 20 percent of the
125

market by the end of March 2007 25. LIC during the last 52 years of its
existence has undergone several trials and tribulations, faced ups and
downs in business growth but managed to grow and metamorphose into a
giant in the industry. In the light of the above, the business performance of
LIC viewed from different dimensions like new business in terms of number
of products, sum assured, first premium income of products marketed,
growth of rural new business, etc. is presented in the following sections.
New Business – Number of Products (Individual Insurance)
Marketed
To spread life insurance at a reasonable cost is the first and foremost
objective of the Corporation. New business is a pointer towards the spread
of message of insurance among those people who have never availed of the
benefits of life insurance as well as the existing policyholders. LIC has its
insurance business in India as well as outside India. The business outside
India is negligible compared to the business in India. The new business
performance of LIC in terms of number of products marketed both in and
outside India for a period of twelve years from 1995-96 to 2006-07 is
depicted in Table 4.3.
The number of products marketed in India rose from 110.20 lakhs in
1995-96, which account for 99.87 percent, to 381.92 lakhs in 2006-07,
which constitute 99.96 percent of total products marketed. Number of
products marketed under new business – individual insurance has grown at
a rate of 246.28 percent over a period of 12 years from 1995-96 to 2006-
07. But the annual growth rate of products marketed fluctuated between a
low of (-) 17.53 percent in 2004-05 and a high of 44.65 percent in 2005-06.
The number of products marketed out of India was a meager 13,345
products in 1995-96, which constitute 0.12 percent only, and it rose to
15,792 in 2006-07, which constitute 0.04 per cent of total products
marketed by LIC. The annual growth rate of business outside India also
126

fluctuated between a low of (-) 37.45 percent in 2000-01 and a high of
19.42 per cent in 2004-05.
Table 4.3
Number of Products Marketed under New Business-Individual
Insurance
YearNo. of Products Marketed
Trend (%)
Annual Growth (in %)
In IndiaOutside India
Total In IndiaOutside
India1995-96 1,10,20,825
(99.87 %)13,345(0.12 %)
1,10,34,170 100 - -
1996-971,22,68,476
(99.89 %)12,296(0.11 %)
1,22,80,772 111.30 11.32 (-)7.86
1997-981,33,11,294
(99.89 13,904
(0.11 %)1,33,25,198 120.76 8.50 13.07
1998-991,48,43,687(99.90 %)
13,356(0.10 %)
1,48,57,043 134.64 11.51 (-)3.94
1999-001,69,76,782(99.93 %)
12,648(6.07 %)
1,69,89,430 153.97 14.37 (-)5.30
2000-011,96,56,663(99.95 %)
7,911(0.05 %)
1,96,64,574 178.21 15.78 (-)37.45
2001-022,24,91,304(99.95 %)
8,695(0.05 %)
2,24,99,999 203.91 14.42 9.91
2002-032,42,68,416((99.94 %)
10,359(0.06 %)
2,42,78,775 220.03 7.90 19.14
2003-042,64,56,320(99.56 %)
11,562(0.04 %)
2,64,67,882 239.87 9.01 11.61
2004-052,18,17,967(99.94 %)
13,807(0.06 %)
2,18,31,774 197.85 (-)17.53 19.42
2005-063,15,59,177(99.96 %)
13,370(0.04 %)
3,15,72,547 286.13 44.65 (-)3.16
2006-073,81,92,783(99.96 %)
15,792(0.04 %)
3,82,08,575 346.27 21.02 18.11
Source: Annual Reports of LIC of India (1995-96 to 2004-05) and Insurance Master, June 2007.Note: Figures in parenthesis shows percentage to total.
The relatively low annual growth rate of products marketed in India
in 2002-03 and the negative growth in 2004-05 could be attributed to
various factors like the withdrawal of tax benefits on single premium bonds
in 2002-03, the imposition of 5 percent service tax on premium payments
made which was subsequently withdrawn, the fall of interest rates and the
127
resultant withdrawal of guaranteed return products. The drought situation
during 2002-03 also had adversely affected the business of LIC.
The introduction of more and more Unit Linked Products by private
players, decline in number of agents, severe competition from new players
and strike by development officers as a result of withdrawal of certain
benefits enjoyed by them previously, resulted into negative growth of
business in the year 2004-05 26. The spurt growth of 44.65 percent in
2005-06 can be attributed to: (i) aggressive marketing strategy adopted by
the Corporation for marketing its golden jubilee product – ‘Bima Gold’, (ii)
concentration on unit linked products, and (iii) recovery of agriculture
sector.
Sum Assured of products Marketed
Up to the year 2004-05, LIC gave much emphasis for both sum
assured and premium income of products marketed. But from the year
2005-06 onwards greater emphasis was being given for premium income
and number of policies marketed. The sum assured under new business for
the period from 1995-96 to 2006-07 is depicted in Table 4.4.
During 1995-96, the sum assured under new business in India was
Rs.51,815.54 crores, which accounts 99.51 percent while it was Rs.255.99
crores outside India, which constitutes 0.49 percent only. Sum assured of
business in India rose to Rs.2,92,752.63 crores (99.86 percent) in 2006-07,
while it was Rs.423.15 crores (0.14 percent) outside India. In case of sum
assured of products marketed in India, the performance of the Corporation
has been quite satisfactory during the period under study except for two
years, i.e., 2002-03 and 2004-05 when there was a fall in the amount of
sum assured.
128
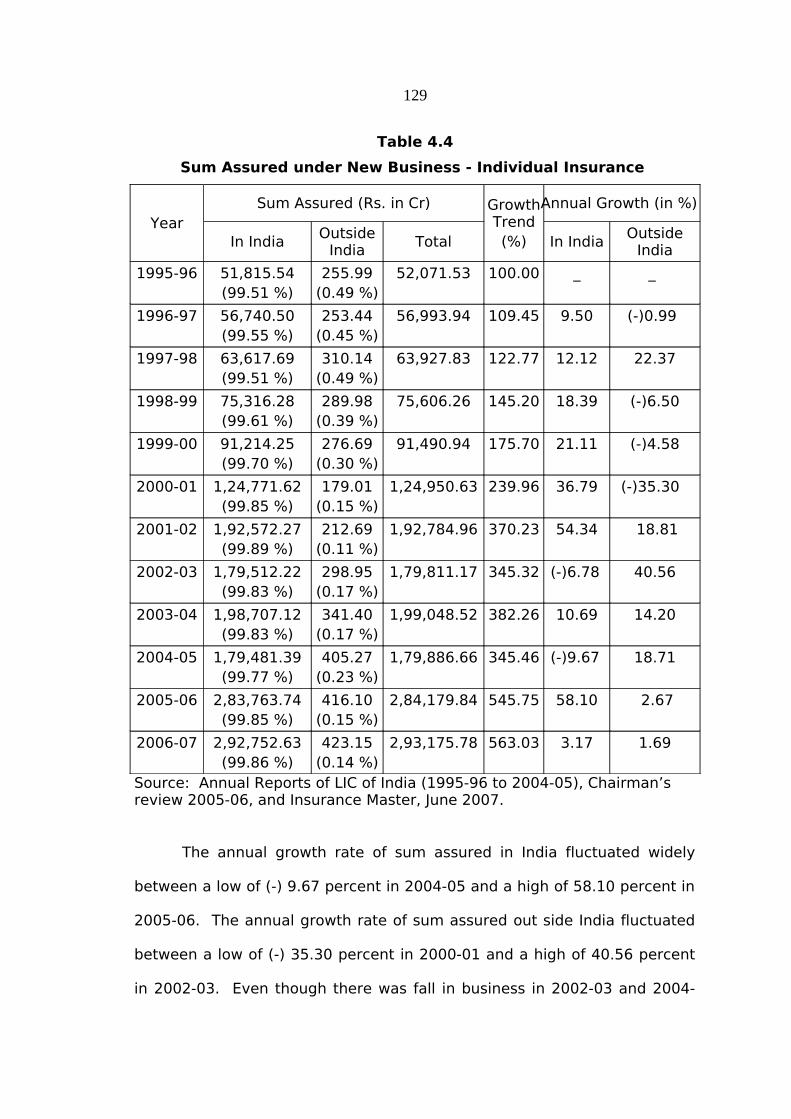
Table 4.4
Sum Assured under New Business - Individual Insurance
YearSum Assured (Rs. in Cr) Growth
Trend(%)
Annual Growth (in %)
In IndiaOutside
IndiaTotal In India
Outside India
1995-96 51,815.54(99.51 %)
255.99(0.49 %)
52,071.53 100.00 _ _
1996-97 56,740.50(99.55 %)
253.44(0.45 %)
56,993.94 109.45 9.50 (-)0.99
1997-98 63,617.69(99.51 %)
310.14(0.49 %)
63,927.83 122.77 12.12 22.37
1998-99 75,316.28(99.61 %)
289.98(0.39 %)
75,606.26 145.20 18.39 (-)6.50
1999-00 91,214.25(99.70 %)
276.69(0.30 %)
91,490.94 175.70 21.11 (-)4.58
2000-01 1,24,771.62(99.85 %)
179.01(0.15 %)
1,24,950.63 239.96 36.79 (-)35.30
2001-02 1,92,572.27(99.89 %)
212.69(0.11 %)
1,92,784.96 370.23 54.34 18.81
2002-03 1,79,512.22(99.83 %)
298.95(0.17 %)
1,79,811.17 345.32 (-)6.78 40.56
2003-04 1,98,707.12(99.83 %)
341.40(0.17 %)
1,99,048.52 382.26 10.69 14.20
2004-05 1,79,481.39(99.77 %)
405.27(0.23 %)
1,79,886.66 345.46 (-)9.67 18.71
2005-06 2,83,763.74(99.85 %)
416.10(0.15 %)
2,84,179.84 545.75 58.10 2.67
2006-07 2,92,752.63(99.86 %)
423.15(0.14 %)
2,93,175.78 563.03 3.17 1.69
Source: Annual Reports of LIC of India (1995-96 to 2004-05), Chairman’s review 2005-06, and Insurance Master, June 2007.
The annual growth rate of sum assured in India fluctuated widely
between a low of (-) 9.67 percent in 2004-05 and a high of 58.10 percent in
2005-06. The annual growth rate of sum assured out side India fluctuated
between a low of (-) 35.30 percent in 2000-01 and a high of 40.56 percent
in 2002-03. Even though there was fall in business in 2002-03 and 2004-
129
05, the Corporation improved its performance in 2005-06 as is evident from
the fact that the annual growth rate showed 58.10 percent increase over
the previous year. This can be attributed to the massive sale of LIC’s
golden jubilee policy – ‘Bima Gold’ and concentration on unit linked
products.
Premium Income from New Business
Premium is the fragmented value of the sum assured payable
continuously at regular intervals to the insurance company until maturity of
the policy. The quantum of premium income collected is the most
important indicator to assess the working results of an insurance company
27. Premium income can be classified into two: (i) first year premium, and
(ii) renewal premium. Premium collected on the new business is called first
year premium and premium collected on business in force is called renewal
premium. First Year Premium Income (FYPI) collected is taken to assess the
growth of a life insurance company 28. Premium income of LIC from new
business for the year 1995-96 to 2005-06 is depicted in Table 4.5.
Premium income of the Corporation has shown tremendous growth
during the period under study. The first year premium income which was
Rs.2,829.26 crores in 1995-96 increased to Rs. 44,540.41 in 2006-07 at a
growth rate of 1474 percent. But the annual growth in first year premium
income was not consistent throughout the period under study. FYPI growth
fluctuated between a high of 121 percent in 2001-02 and a low of (-) 18.44
percent in 2002-03. FYPI showed an increasing trend through out the
period under study except the year 2002-03.
130
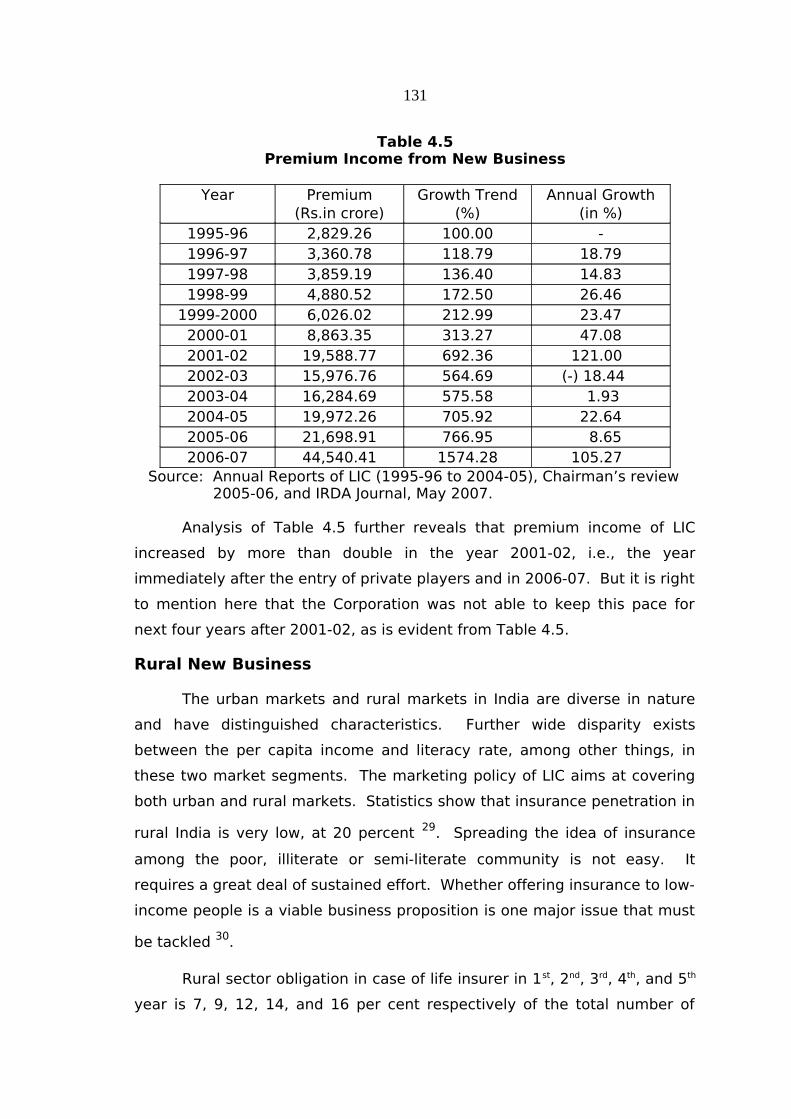
Table 4.5 Premium Income from New Business
Year Premium(Rs.in crore)
Growth Trend(%)
Annual Growth(in %)
1995-96 2,829.26 100.00 -1996-97 3,360.78 118.79 18.791997-98 3,859.19 136.40 14.831998-99 4,880.52 172.50 26.46
1999-2000 6,026.02 212.99 23.472000-01 8,863.35 313.27 47.082001-02 19,588.77 692.36 121.002002-03 15,976.76 564.69 (-) 18.442003-04 16,284.69 575.58 1.932004-05 19,972.26 705.92 22.642005-06 21,698.91 766.95 8.652006-07 44,540.41 1574.28 105.27
Source: Annual Reports of LIC (1995-96 to 2004-05), Chairman’s review 2005-06, and IRDA Journal, May 2007.
Analysis of Table 4.5 further reveals that premium income of LIC
increased by more than double in the year 2001-02, i.e., the year
immediately after the entry of private players and in 2006-07. But it is right
to mention here that the Corporation was not able to keep this pace for
next four years after 2001-02, as is evident from Table 4.5.
Rural New Business
The urban markets and rural markets in India are diverse in nature
and have distinguished characteristics. Further wide disparity exists
between the per capita income and literacy rate, among other things, in
these two market segments. The marketing policy of LIC aims at covering
both urban and rural markets. Statistics show that insurance penetration in
rural India is very low, at 20 percent 29. Spreading the idea of insurance
among the poor, illiterate or semi-literate community is not easy. It
requires a great deal of sustained effort. Whether offering insurance to low-
income people is a viable business proposition is one major issue that must
be tackled 30.
Rural sector obligation in case of life insurer in 1st, 2nd, 3rd, 4th, and 5th
year is 7, 9, 12, 14, and 16 per cent respectively of the total number of
131
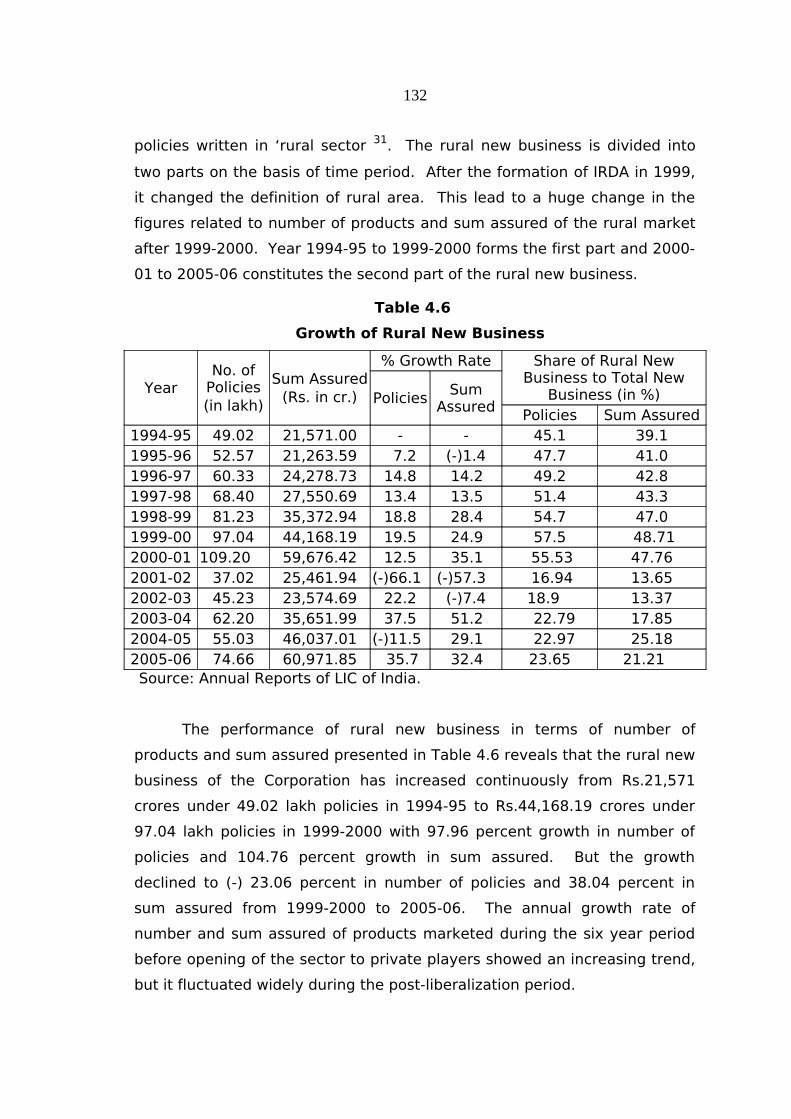
policies written in ‘rural sector 31. The rural new business is divided into
two parts on the basis of time period. After the formation of IRDA in 1999,
it changed the definition of rural area. This lead to a huge change in the
figures related to number of products and sum assured of the rural market
after 1999-2000. Year 1994-95 to 1999-2000 forms the first part and 2000-
01 to 2005-06 constitutes the second part of the rural new business.
Table 4.6
Growth of Rural New Business
YearNo. of
Policies(in lakh)
Sum Assured(Rs. in cr.)
% Growth Rate Share of Rural New Business to Total New
Business (in %)PoliciesSum
AssuredPolicies Sum Assured
1994-95 49.02 21,571.00 - - 45.1 39.11995-96 52.57 21,263.59 7.2 (-)1.4 47.7 41.01996-97 60.33 24,278.73 14.8 14.2 49.2 42.81997-98 68.40 27,550.69 13.4 13.5 51.4 43.31998-99 81.23 35,372.94 18.8 28.4 54.7 47.01999-00 97.04 44,168.19 19.5 24.9 57.5 48.712000-01 109.20 59,676.42 12.5 35.1 55.53 47.762001-02 37.02 25,461.94 (-)66.1 (-)57.3 16.94 13.652002-03 45.23 23,574.69 22.2 (-)7.4 18.9 13.372003-04 62.20 35,651.99 37.5 51.2 22.79 17.852004-05 55.03 46,037.01 (-)11.5 29.1 22.97 25.182005-06 74.66 60,971.85 35.7 32.4 23.65 21.21 Source: Annual Reports of LIC of India.
The performance of rural new business in terms of number of
products and sum assured presented in Table 4.6 reveals that the rural new
business of the Corporation has increased continuously from Rs.21,571
crores under 49.02 lakh policies in 1994-95 to Rs.44,168.19 crores under
97.04 lakh policies in 1999-2000 with 97.96 percent growth in number of
policies and 104.76 percent growth in sum assured. But the growth
declined to (-) 23.06 percent in number of policies and 38.04 percent in
sum assured from 1999-2000 to 2005-06. The annual growth rate of
number and sum assured of products marketed during the six year period
before opening of the sector to private players showed an increasing trend,
but it fluctuated widely during the post-liberalization period.
132

Figure 4.8Rural new business (number of policies) in India
0
20
40
60
80
100
120
1994-95 1995-96 1996-97 1997-98 1998-99 1999-00 2000-01 2001-02 2002-03 2003-04 2004-05 2005-06
Year
Num
ber
(Lak
hs)
Figure 4.9Growth in Rural New Business (Sum Assured)
0
10,000
20,000
30,000
40,000
50,000
60,000
70,000
1994-95 1995-96 1996-97 1997-98 1998-99 1999-00 2000-01 2001-02 2002-03 2003-04 2004-05 2005-06
Year
Am
ount
(C
rore
s)
133
The share of products marketed in rural area to total new products
marketed has steadily increased from 45.1 percent in 1994-95 to 57.5
percent in 1999-2000. Similarly, the sum assured has steadily increased
from 39.1 percent to 48.71 percent during the same period. But the share
of rural products marketed and sum assured which was 55.53 percent and
47.76 percent respectively in 2000-01 declined to 23.65 percent and 21.21
percent respectively in 2005-06. From the above analysis it is evident that
LIC concentrated in urban areas and lost business in rural areas after
liberalization of the sector, as private players established their presence in
rural areas also by opening more and more branches. Figure 4.8 and 4.9
portrays the growth in number and sum assured of products marketed by
LIC in rural area during the pre-libralisation and post-liberalisation period.
LIFE INSURANCE MARKETING IN KASARGOD AND KANNUR
The Kasargod and Kannur districts which are situated in the northern
part of Kerala come under the Kozhikode Division of the LIC. Kozhikode
division is one of the prominent divisions under the Southern Zone. The
performance of marketing individual life insurance products of LIC in
Kasargod and Kannur districts vis-a vis the performance at national level is
evaluated from different dimensions like number of products marketed,
sum assured of products marketed, premium income on products
marketed, during the post liberalization period from 2001-02 to 2006-07.
Since the first private insurer after opening of the sector was established in
October 2000, the year 2001-02 has been taken as the first full year of
operations for assessing the business performance of LIC in the areas of
study.
Number of Products Marketed
Sustained and conscious efforts are required to carry the message of
life insurance into the rural areas, especially backward and remote areas.
The LIC agents play a vital role in persuading the rural folks to purchase life
134

insurance products of their choice by giving required information about
various insurance products. From 2004-05 onwards, LIC lay greater
emphasis for number of products sold as well as premium income for
measuring the growth of business. Table 4.7 exhibits the number as well as
growth of products marketed in Kannur and Kasargod districts and at All
India level during the period from 2001-2002 to 2006-2007.
Table 4.7Growth of Products Marketed (2001-02 to 2006-07)
YearNo. of Products Marketed in Growth (in %)
KANNUR KASAR-GOD
ALL INDIA KANNUR KASAR-GOD
ALL INDIA
2001-02 97,912 33,308 2,24,91,304 - - -
2002-03 1,12,615 39,095 2,42,68,416 15.02 17.37 7.90
2003-04 1,10,605 41,284 2,64,56,320 (-)1.78 5.60 9.01
2004-05 97,495 33,625 2,18,17,967 (-)11.85 (-)18.55
(-) 7.53
2005-06 1,41,327 52,433 3,15,72,547 44.96 55.93 44.71
2006-07 1,31,433 54,035 3,82,08,575 (-) 7.00 3.05 21.02
CAGR 6.07 10.16 11.18Source: Compiled from Divisional Office, Annual Reports of LIC (2002 to 2005), and IRDA Journal various issues.
Analysis of the Table 4.7 reveals that number of products marketed
showed a growth rate of 134.24 percent in Kannur and 162.23 percent in
Kasargod district, whereas it was 169.88 percent at all India level during the
post-liberalisation period from 2001-02 to 2006-07,. The annual growth
rate of products marketed fluctuated between a high of 44.96 percent in
2005-06 and a low of (-) 11.85 percent in 2004-05 in Kannur district,
whereas it fluctuated between a high of 55.93 percent in 2005-06 and a low
of (-) 18.55 percent in 2004-05 in Kasargod district. The Compound Annual
Growth Rate (CAGR) of 6.07 in Kannur and 10.16 in Kasargod reveals that
there is significant difference between the two districts regarding the
growth in number of products sold. Kasargod district was ahead of Kannur
district regarding growth in number of products sold, throughout the period,
135
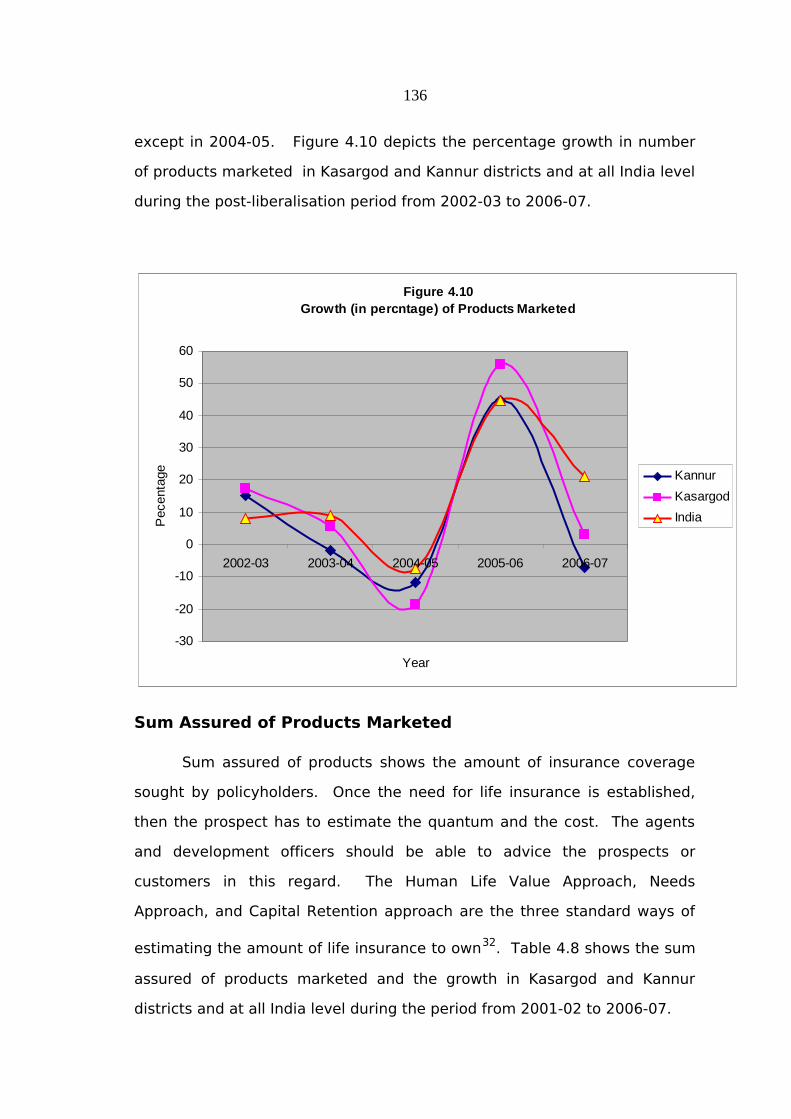
except in 2004-05. Figure 4.10 depicts the percentage growth in number
of products marketed in Kasargod and Kannur districts and at all India level
during the post-liberalisation period from 2002-03 to 2006-07.
Figure 4.10Growth (in percntage) of Products Marketed
-30
-20
-10
0
10
20
30
40
50
60
2002-03 2003-04 2004-05 2005-06 2006-07
Year
Pec
enta
ge Kannur
Kasargod
India
Sum Assured of Products Marketed
Sum assured of products shows the amount of insurance coverage
sought by policyholders. Once the need for life insurance is established,
then the prospect has to estimate the quantum and the cost. The agents
and development officers should be able to advice the prospects or
customers in this regard. The Human Life Value Approach, Needs
Approach, and Capital Retention approach are the three standard ways of
estimating the amount of life insurance to own32. Table 4.8 shows the sum
assured of products marketed and the growth in Kasargod and Kannur
districts and at all India level during the period from 2001-02 to 2006-07.
136
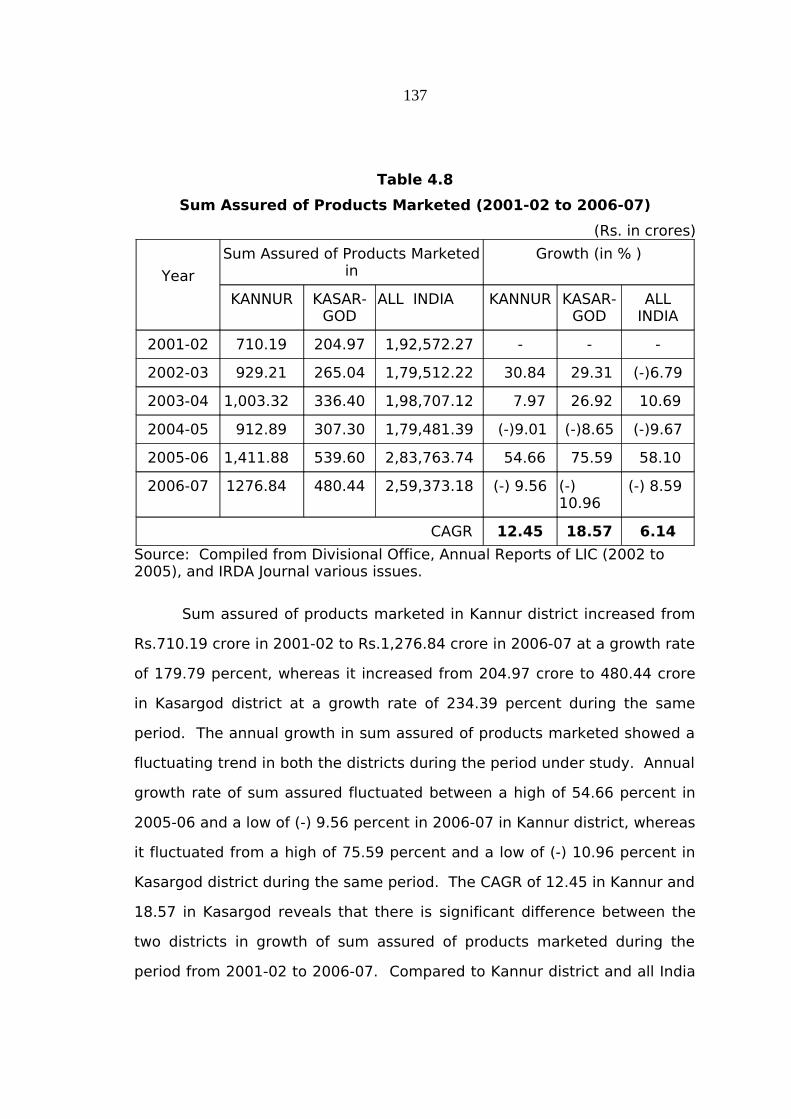
Table 4.8
Sum Assured of Products Marketed (2001-02 to 2006-07)
(Rs. in crores)
Year
Sum Assured of Products Marketed in
Growth (in % )
KANNUR KASAR-GOD
ALL INDIA KANNUR KASAR-GOD
ALL INDIA
2001-02 710.19 204.97 1,92,572.27 - - -
2002-03 929.21 265.04 1,79,512.22 30.84 29.31 (-)6.79
2003-04 1,003.32 336.40 1,98,707.12 7.97 26.92 10.69
2004-05 912.89 307.30 1,79,481.39 (-)9.01 (-)8.65 (-)9.67
2005-06 1,411.88 539.60 2,83,763.74 54.66 75.59 58.10
2006-07 1276.84 480.44 2,59,373.18 (-) 9.56 (-) 10.96
(-) 8.59
CAGR 12.45 18.57 6.14
Source: Compiled from Divisional Office, Annual Reports of LIC (2002 to 2005), and IRDA Journal various issues.
Sum assured of products marketed in Kannur district increased from
Rs.710.19 crore in 2001-02 to Rs.1,276.84 crore in 2006-07 at a growth rate
of 179.79 percent, whereas it increased from 204.97 crore to 480.44 crore
in Kasargod district at a growth rate of 234.39 percent during the same
period. The annual growth in sum assured of products marketed showed a
fluctuating trend in both the districts during the period under study. Annual
growth rate of sum assured fluctuated between a high of 54.66 percent in
2005-06 and a low of (-) 9.56 percent in 2006-07 in Kannur district, whereas
it fluctuated from a high of 75.59 percent and a low of (-) 10.96 percent in
Kasargod district during the same period. The CAGR of 12.45 in Kannur and
18.57 in Kasargod reveals that there is significant difference between the
two districts in growth of sum assured of products marketed during the
period from 2001-02 to 2006-07. Compared to Kannur district and all India
137
level, the sum assured of products marketed had grown significantly in
Kasargod district during the years 2003-04 and 2005-06.
Analysis of table 4.7 and 4.8 further reveals that there was fall in the
number as well as sum assured of products marketed in both the districts
and at all India level during the year 2004-05. The performance of the
division also showed a negative growth in the same year. The main
reasons for this can be attributed to: (i) concentration on Unit Linked
Products in 2004-05, and (ii) laxity on the part of Development Officers and
Agents as part of their All India strike in 2004-05 and competition from
private players.
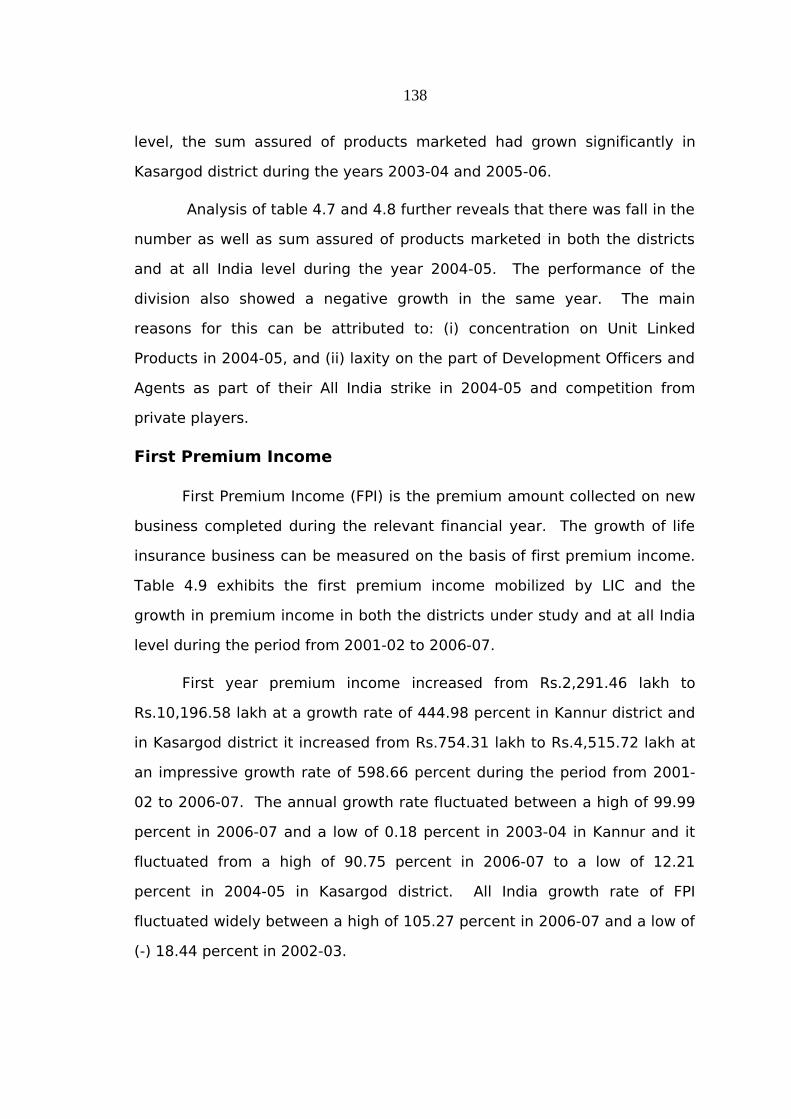
First Premium Income
First Premium Income (FPI) is the premium amount collected on new
business completed during the relevant financial year. The growth of life
insurance business can be measured on the basis of first premium income.
Table 4.9 exhibits the first premium income mobilized by LIC and the
growth in premium income in both the districts under study and at all India
level during the period from 2001-02 to 2006-07.
First year premium income increased from Rs.2,291.46 lakh to
Rs.10,196.58 lakh at a growth rate of 444.98 percent in Kannur district and
in Kasargod district it increased from Rs.754.31 lakh to Rs.4,515.72 lakh at
an impressive growth rate of 598.66 percent during the period from 2001-
02 to 2006-07. The annual growth rate fluctuated between a high of 99.99
percent in 2006-07 and a low of 0.18 percent in 2003-04 in Kannur and it
fluctuated from a high of 90.75 percent in 2006-07 to a low of 12.21
percent in 2004-05 in Kasargod district. All India growth rate of FPI
fluctuated widely between a high of 105.27 percent in 2006-07 and a low of
(-) 18.44 percent in 2002-03.
138

Table 4.9
First Premium Income Collected (2001-02 to 2006-07)
(Rs. in Lakhs)
Year
First Premium Income Collected in Growth (in %)
KANNUR KASAR-GOD
ALL INDIA KANNUR KASAR-GOD
ALL INDIA
2001-02 2,291. 46 754. 31 19,58,877.25 - - -
2002-03 3,232. 04 1,180. 90 15,97,676.15 41. 05 56. 55 (-)18.44
2003-04 3,237. 88 1,414. 63 16,28,468.67 0.18 19.79 1.93
2004-05 3,725. 45 1,587. 40 19,97,225.52 15.06 12.21 22.64
2005-06 5,098. 32 2,367. 35 21,69,891.21 36.85 49.13 8.65
2006-07 10,196.58 4,515.72 44,54,041.01 99.99 90.75 105.27
CAGR 34.79 43.03 22.69
Source: Compiled from Divisional Office, Annual Reports of LIC (2002 to 2005), and IRDA Journal various issues.
The CAGR reveals that there is significant difference between
Kasargod and Kannur districts regarding FPI collected during the period
under study. Figure 4.11 depicts percentage growth in first premium
income in Kasargod and Kannur districts and at all India level during the
period from 2002-03 to 2006-07. The heavy growth in the first premium
income in the last two years of study can be attributed to: (i) concentration
on Unit Linked Policies, and (ii) aggressive marketing campaign adopted by
LIC for its Golden Jubilee product ‘Bima Gold’.
139
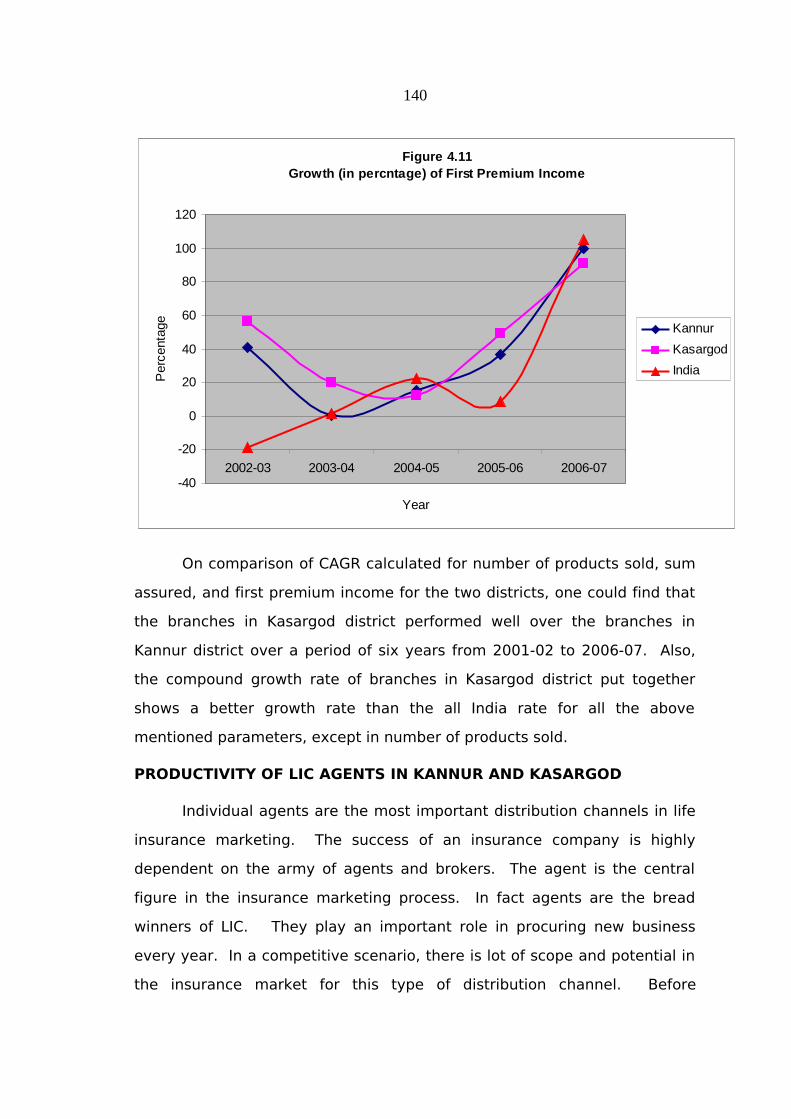
Figure 4.11Growth (in percntage) of First Premium Income
-40
-20
0
20
40
60
80
100
120
2002-03 2003-04 2004-05 2005-06 2006-07
Year
Per
cent
age
Kannur
Kasargod
India
On comparison of CAGR calculated for number of products sold, sum
assured, and first premium income for the two districts, one could find that
the branches in Kasargod district performed well over the branches in
Kannur district over a period of six years from 2001-02 to 2006-07. Also,
the compound growth rate of branches in Kasargod district put together
shows a better growth rate than the all India rate for all the above
mentioned parameters, except in number of products sold.
PRODUCTIVITY OF LIC AGENTS IN KANNUR AND KASARGOD
Individual agents are the most important distribution channels in life
insurance marketing. The success of an insurance company is highly
dependent on the army of agents and brokers. The agent is the central
figure in the insurance marketing process. In fact agents are the bread
winners of LIC. They play an important role in procuring new business
every year. In a competitive scenario, there is lot of scope and potential in
the insurance market for this type of distribution channel. Before
140
measuring productivity of agents, growth of individual agents in the two
districts and at all India level is assessed.
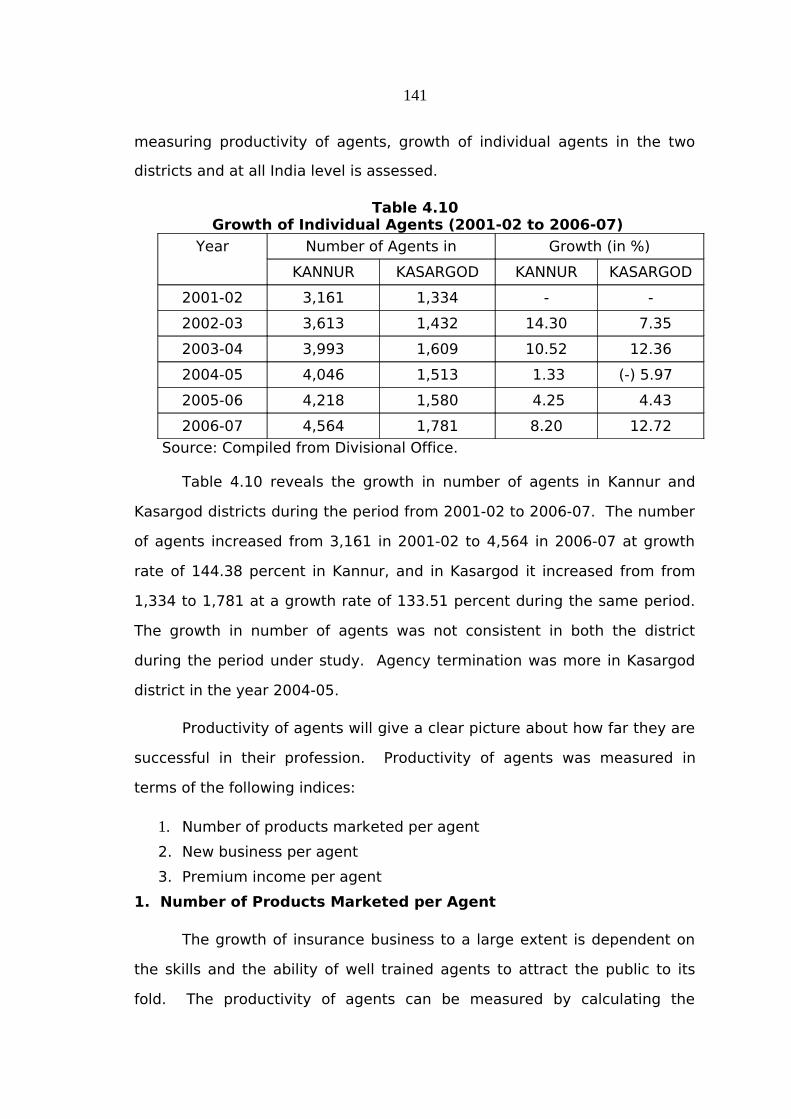
Table 4.10 Growth of Individual Agents (2001-02 to 2006-07)
Year Number of Agents in Growth (in %)
KANNUR KASARGOD KANNUR KASARGOD
2001-02 3,161 1,334 - -
2002-03 3,613 1,432 14.30 7.35
2003-04 3,993 1,609 10.52 12.36
2004-05 4,046 1,513 1.33 (-) 5.97
2005-06 4,218 1,580 4.25 4.43
2006-07 4,564 1,781 8.20 12.72
Source: Compiled from Divisional Office.
Table 4.10 reveals the growth in number of agents in Kannur and
Kasargod districts during the period from 2001-02 to 2006-07. The number
of agents increased from 3,161 in 2001-02 to 4,564 in 2006-07 at growth
rate of 144.38 percent in Kannur, and in Kasargod it increased from from
1,334 to 1,781 at a growth rate of 133.51 percent during the same period.
The growth in number of agents was not consistent in both the district
during the period under study. Agency termination was more in Kasargod
district in the year 2004-05.
Productivity of agents will give a clear picture about how far they are
successful in their profession. Productivity of agents was measured in
terms of the following indices:
1. Number of products marketed per agent
2. New business per agent
3. Premium income per agent
1. Number of Products Marketed per Agent
The growth of insurance business to a large extent is dependent on
the skills and the ability of well trained agents to attract the public to its
fold. The productivity of agents can be measured by calculating the
141
average business done by each agent in terms of number of products, i.e.,
by dividing the total number of policies of a particular year by the number
of agents in that year. The productivity for the period from 2001-02 to
2006-07 is shown in the Table 4.11.
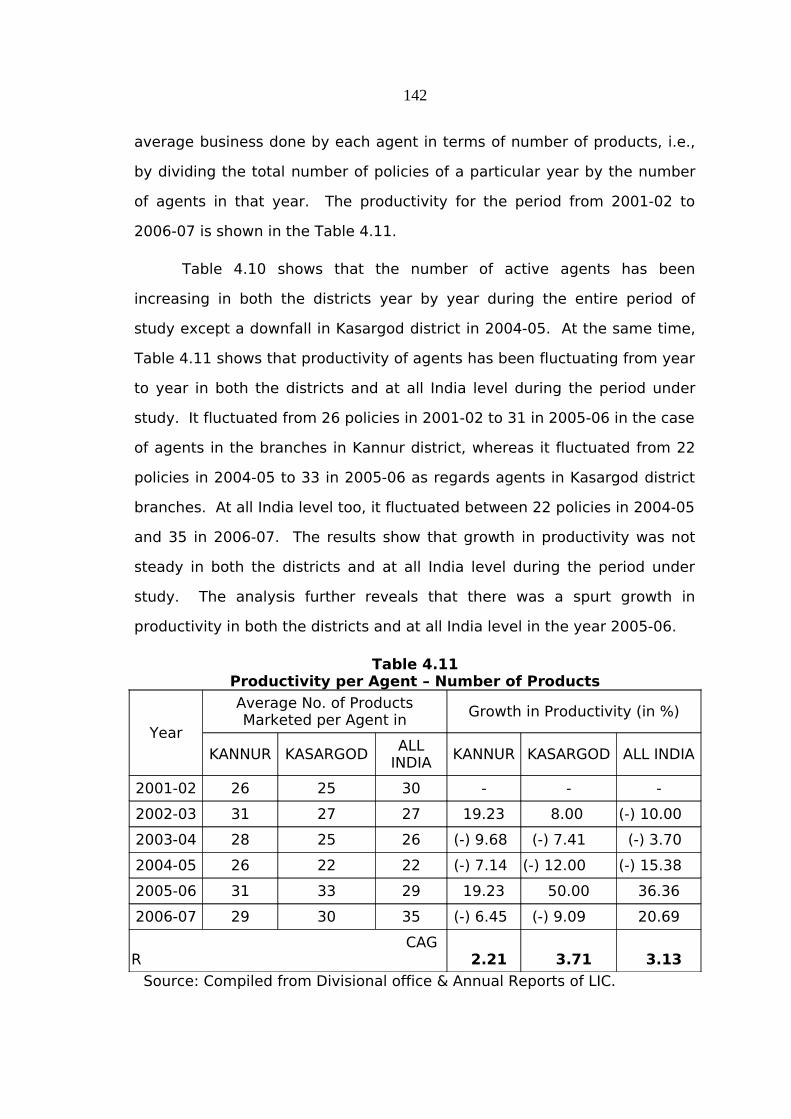
Table 4.10 shows that the number of active agents has been
increasing in both the districts year by year during the entire period of
study except a downfall in Kasargod district in 2004-05. At the same time,
Table 4.11 shows that productivity of agents has been fluctuating from year
to year in both the districts and at all India level during the period under
study. It fluctuated from 26 policies in 2001-02 to 31 in 2005-06 in the case
of agents in the branches in Kannur district, whereas it fluctuated from 22
policies in 2004-05 to 33 in 2005-06 as regards agents in Kasargod district
branches. At all India level too, it fluctuated between 22 policies in 2004-05
and 35 in 2006-07. The results show that growth in productivity was not
steady in both the districts and at all India level during the period under
study. The analysis further reveals that there was a spurt growth in
productivity in both the districts and at all India level in the year 2005-06.
Table 4.11Productivity per Agent – Number of Products
Year
Average No. of Products Marketed per Agent in
Growth in Productivity (in %)
KANNUR KASARGODALL
INDIAKANNUR KASARGOD ALL INDIA
2001-02 26 25 30 - - -
2002-03 31 27 27 19.23 8.00 (-) 10.00
2003-04 28 25 26 (-) 9.68 (-) 7.41 (-) 3.70
2004-05 26 22 22 (-) 7.14 (-) 12.00 (-) 15.38
2005-06 31 33 29 19.23 50.00 36.36
2006-07 29 30 35 (-) 6.45 (-) 9.09 20.69
CAGR 2.21 3.71 3.13
Source: Compiled from Divisional office & Annual Reports of LIC.
142

The CAGR of productivity for the entire study period was 2.21 in
Kannur, 3.71 in Kasargod, and 3.13 at all India level. On the basis of CAGR,
it can be concluded that growth in productivity of agents in the branches in
Kasargod district was better than the agents in the branches in Kannur
district and at all India level over a period of six years.
Table 4.12Analysis of Variance of Products Marketed per Agent
District Mean S D F ‘p’ value Significance
Kannur 28 2.26
0.652174
0.438124
Not SignificantKasargod 27 3.95
Total 27 3.17
The mean number of products marketed per agent was 28 (S.D. 2.26)
in Kannur and 27 (S.D. 3.95) in Kasargod. The analysis further reveals that
there is no significant difference in productivity in terms of number of
products marketed, between the agents in Kasargod and Kannur district
branches.
2. New Business per Active Agent
Agents play an important role in procuring new business every year.
In a competitive scenario, there is lot of scope and potential in the
insurance market for this type of distribution channel. Productivity in terms
of new business per LIC agent can be measured by dividing the total sum
assured in a year by the total number of active agents in that year. It gives
the average business per active agents.
Table 4.13 reveals that productivity per agent in terms of sum
assured of new business has been fluctuating in both the districts under
study from 2001-02 to 2006-07. It increased from Rs. 21.03 lakhs in 2001-
02 to Rs. 27.98 lakhs in 2006-07 at a growth rate which fluctuated between
143
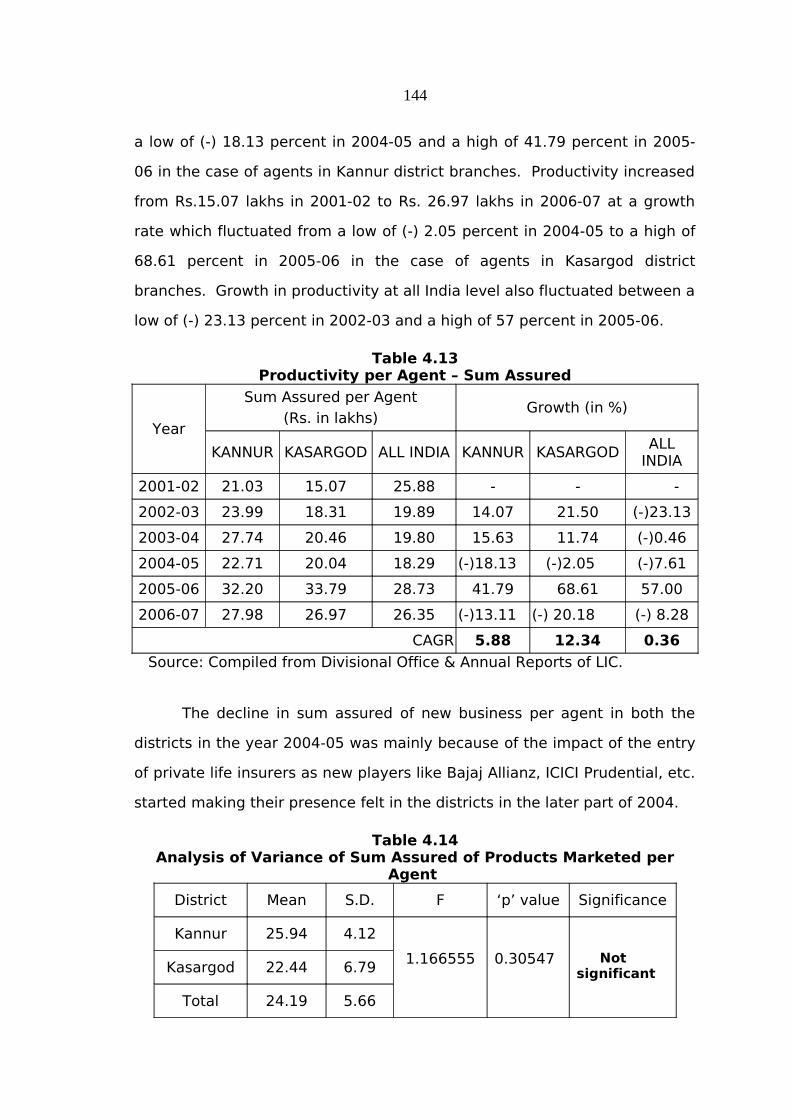
a low of (-) 18.13 percent in 2004-05 and a high of 41.79 percent in 2005-
06 in the case of agents in Kannur district branches. Productivity increased
from Rs.15.07 lakhs in 2001-02 to Rs. 26.97 lakhs in 2006-07 at a growth
rate which fluctuated from a low of (-) 2.05 percent in 2004-05 to a high of
68.61 percent in 2005-06 in the case of agents in Kasargod district
branches. Growth in productivity at all India level also fluctuated between a
low of (-) 23.13 percent in 2002-03 and a high of 57 percent in 2005-06.
Table 4.13Productivity per Agent – Sum Assured
Year
Sum Assured per Agent(Rs. in lakhs)
Growth (in %)
KANNUR KASARGOD ALL INDIA KANNUR KASARGODALL
INDIA
2001-02 21.03 15.07 25.88 - - -
2002-03 23.99 18.31 19.89 14.07 21.50 (-)23.13
2003-04 27.74 20.46 19.80 15.63 11.74 (-)0.46
2004-05 22.71 20.04 18.29 (-)18.13 (-)2.05 (-)7.61
2005-06 32.20 33.79 28.73 41.79 68.61 57.00
2006-07 27.98 26.97 26.35 (-)13.11 (-) 20.18 (-) 8.28
CAGR 5.88 12.34 0.36
Source: Compiled from Divisional Office & Annual Reports of LIC.
The decline in sum assured of new business per agent in both the
districts in the year 2004-05 was mainly because of the impact of the entry
of private life insurers as new players like Bajaj Allianz, ICICI Prudential, etc.
started making their presence felt in the districts in the later part of 2004.
Table 4.14Analysis of Variance of Sum Assured of Products Marketed per
Agent
District Mean S.D. F ‘p’ value Significance
Kannur 25.94 4.12
1.166555 0.30547 Not significantKasargod 22.44 6.79
Total 24.19 5.66
144

Analysis of variance in Table 4.14 reveals no significant difference in
mean sum assured of products marketed per agent in Kasargod and Kannur
districts during the period under study. Even though there is no significant
difference in mean sum assured of products marketed per agent in the two
districts, the CAGR of productivity of agents in Kasargod district branches
shows a heavy growth of 12.34 percent over a period of six years from
2001-02 to 2006-07.
3. First Premium Income per Agent
Agents are motivated and trained to pursue more and more people
to purchase life insurance policies. The performance of agents is highly
linked with the premium they collect as they are paid commission on the
basis of premium collected in a particular year. The first premium income
collected is used to assess the growth in business of insurance companies.
The productivity of agents in terms of FPI is calculated by dividing first
premium collected in a particular year by the number of agents in that year.
Table 4.15First Premium Income per Agent
Year
Premium income per Agent (in Rs.)
Growth (in %)
KANNUR KASARGOD ALL INDIA KANNUR KASARGOD ALL INDIA
2001-02 72,492 55,046 2,15,344 - - -
2002-03 89,456 82,465 1,38,805 23.40 49.81 (-)35.54
2003-04 81,089 87,920 1,25,235 (-) 9.35 6.61 (-)9.78
2004-05 92,077 1,04,917 1,14,705 13.55 19.33 (-)8.41
2005-06 1,20,871 1,49,832 1,53,722 31.27 42.81 34.02
2006-07 2,53,549 2,23,413 4,03,794 109.76 49.11 162.68
CAGR 28.46 32.34 13.40
Source: Compiled from Divisional Office & Annual Reports of LIC.
145
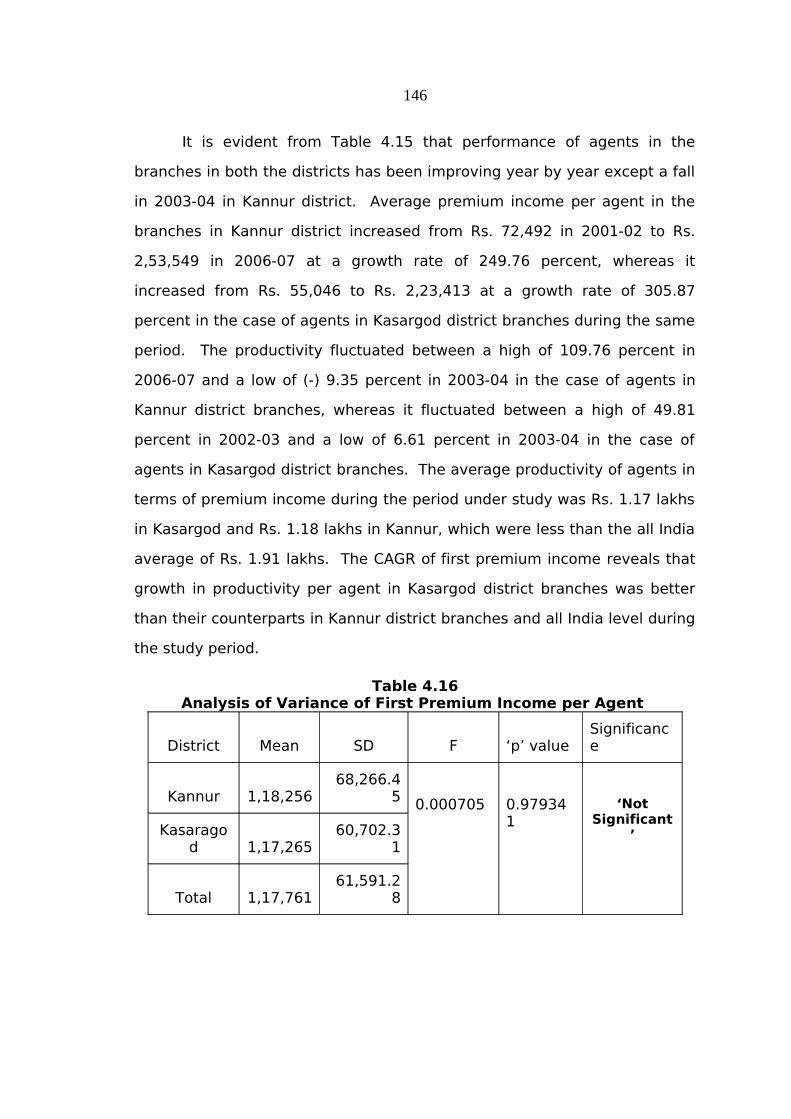
It is evident from Table 4.15 that performance of agents in the
branches in both the districts has been improving year by year except a fall
in 2003-04 in Kannur district. Average premium income per agent in the
branches in Kannur district increased from Rs. 72,492 in 2001-02 to Rs.
2,53,549 in 2006-07 at a growth rate of 249.76 percent, whereas it
increased from Rs. 55,046 to Rs. 2,23,413 at a growth rate of 305.87
percent in the case of agents in Kasargod district branches during the same
period. The productivity fluctuated between a high of 109.76 percent in
2006-07 and a low of (-) 9.35 percent in 2003-04 in the case of agents in
Kannur district branches, whereas it fluctuated between a high of 49.81
percent in 2002-03 and a low of 6.61 percent in 2003-04 in the case of
agents in Kasargod district branches. The average productivity of agents in
terms of premium income during the period under study was Rs. 1.17 lakhs
in Kasargod and Rs. 1.18 lakhs in Kannur, which were less than the all India
average of Rs. 1.91 lakhs. The CAGR of first premium income reveals that
growth in productivity per agent in Kasargod district branches was better
than their counterparts in Kannur district branches and all India level during
the study period.
Table 4.16Analysis of Variance of First Premium Income per Agent
District Mean SD F ‘p’ valueSignificance
Kannur 1,18,25668,266.4
5 0.000705 0.979341
‘Not Significant
’Kasaragod 1,17,265
60,702.31
Total 1,17,76161,591.2
8
146
Analysis of variance in Table 4.16 reveals that the difference in mean
premium income per agent, between Kannur and Kasargod district is not
significant at 0.05 percent level.
The productivity analysis on the whole reveals that it increased
heavily in 2005-06 in both the districts and at all India level in terms of
parameters like number of policies, sum assured and FPI, as an aggressive
marketing campaign was followed for LIC’s golden jubilee product ‘Bima
Gold’ and the Corporation emphasized much for marketing Unit Linked
policies from 2005-06 onwards. On the basis of CAGR of productivity of
agents with respect to parameters analysed, one can reach to a conclusion
that productivity of agents in Kasargod district branches improved better
than the productivity of agents in Kannur district and at all India level.
IMPACT OF PRIVATISATION ON THE PERFORMANCE OF LIC
After liberalization, the structure of the insurance industry has
undergone a drastic change. The public sector giant, i.e., LIC now has to
compete with the private players who boast of the rich and long experience
of their partners from the developed countries of the world. The new
entrants to the market are coming up with different types of innovative
products. So it is imperative on the part of the researcher to study the
impact of privatization on the performance of LIC. Since first of the licenses
for the companies in the private sector was issued in October, 2000 and the
first full year of operation was 2001-02, the analysis covers a period of six
years from 2001-02 to 2006-07. The impact of privatization on the
performance of LIC has been evaluated on the basis of parameters like
premium income, number of policies, growth rates of premium and number
of policies, and market share of players in the field.
Total Premium Income and Market Share of Life Insurers
147
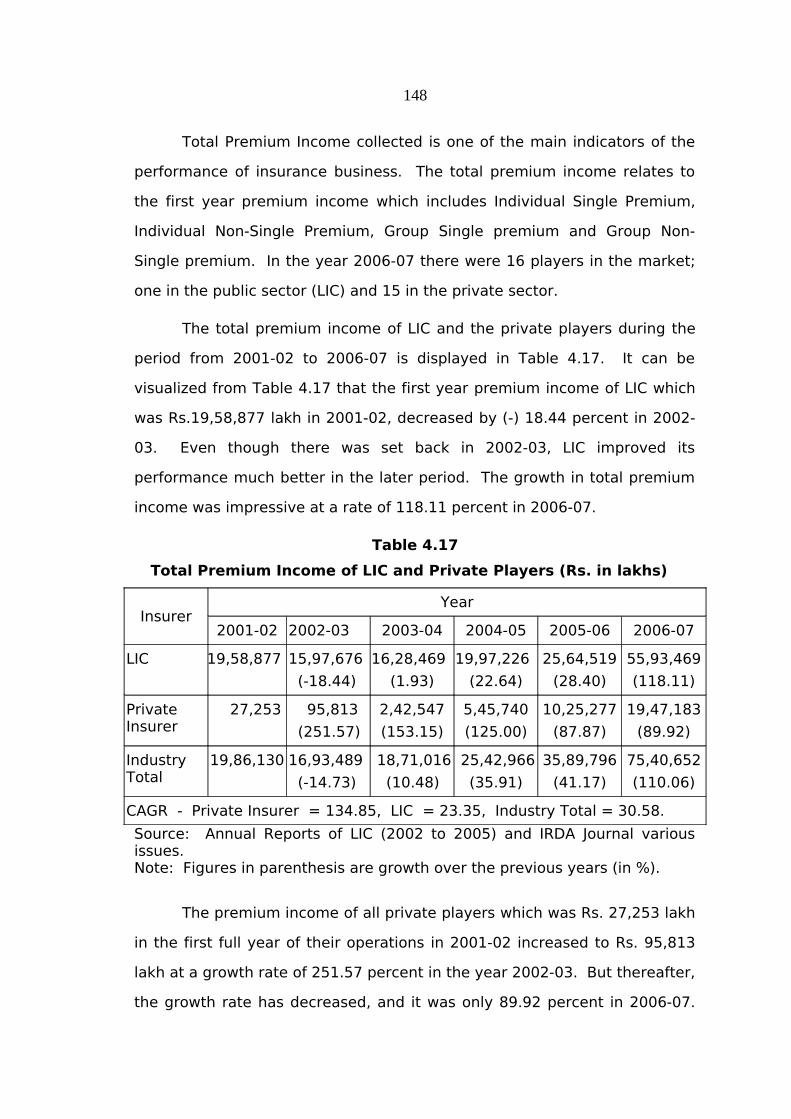
Total Premium Income collected is one of the main indicators of the
performance of insurance business. The total premium income relates to
the first year premium income which includes Individual Single Premium,
Individual Non-Single Premium, Group Single premium and Group Non-
Single premium. In the year 2006-07 there were 16 players in the market;
one in the public sector (LIC) and 15 in the private sector.
The total premium income of LIC and the private players during the
period from 2001-02 to 2006-07 is displayed in Table 4.17. It can be
visualized from Table 4.17 that the first year premium income of LIC which
was Rs.19,58,877 lakh in 2001-02, decreased by (-) 18.44 percent in 2002-
03. Even though there was set back in 2002-03, LIC improved its
performance much better in the later period. The growth in total premium
income was impressive at a rate of 118.11 percent in 2006-07.
Table 4.17
Total Premium Income of LIC and Private Players (Rs. in lakhs)
InsurerYear
2001-02 2002-03 2003-04 2004-05 2005-06 2006-07
LIC 19,58,877 15,97,676
(-18.44)
16,28,469
(1.93)
19,97,226
(22.64)
25,64,519
(28.40)
55,93,469
(118.11)
Private Insurer
27,253 95,813
(251.57)
2,42,547
(153.15)
5,45,740
(125.00)
10,25,277
(87.87)
19,47,183
(89.92)
Industry Total
19,86,130 16,93,489
(-14.73)
18,71,016
(10.48)
25,42,966
(35.91)
35,89,796
(41.17)
75,40,652
(110.06)
CAGR - Private Insurer = 134.85, LIC = 23.35, Industry Total = 30.58.
Source: Annual Reports of LIC (2002 to 2005) and IRDA Journal various issues.Note: Figures in parenthesis are growth over the previous years (in %).
The premium income of all private players which was Rs. 27,253 lakh
in the first full year of their operations in 2001-02 increased to Rs. 95,813
lakh at a growth rate of 251.57 percent in the year 2002-03. But thereafter,
the growth rate has decreased, and it was only 89.92 percent in 2006-07.
148

Over a period of six years from 2001-02 to 2006-07, the total premium
income of all private players increased at an impressive growth rate of
7,145 percent, whereas the premium income of LIC has grown at a rate of
286 percent during the same period. The CAGR of premium income was
134.85 percent in the case of private players and 23.35 percent in the case
of LIC over a period of six years from 2001-02 to 2006-07. It is to be noted
that the CAGR of total premium income of LIC was less than the industry
average of 30.58 percent during the six year period under study.
Table 4.18 Market Share of Life Insurers in Total Premium Income
Name of insurer
Market Share (in %)
2001-02 2002-03 2003-04 2004-05 2005-06 2006-07
LIC 98.68 94.34 87.05 78.63 71.43 72.47
Private Players
1.32 5.66 12.95 21.37 28.57 27.53
Total 100.00 100.00 100.00 100.00 100.00 100.00
Source: IRDA Journal various issues.
The market share of different life insurers in total premium income
during the period from 2001-02 to 2006-07, depicted in Table 4.18 reveals
that the share of LIC has been decreasing year by year with the entry of
private players. It has decreased from 98.68 percent in 2001-02 to 72.47
percent in 2006-07. Over a period of six years from 2001-02, the market
share of LIC has decreased by 26.21 percent.
Contrary to this, the private players with 1.32 percent market share
in 2001-02, captured 27.53 percent of the market in the year 2006-07. This
clearly shows that private players has been improving year by year with
regard to premium income, thus affecting the performance of LIC in the
market. However, the Corporation managed to improve its performance in
the year 2006-07 by collecting Rs.44,540.4 crore first premium income on
149

3.82 crore policies with a market share of 72.47 percent. Even though
there was very much increase in the premium income of private players in
2006-07, its market share has declined by 1.04 percent from the previous
year. Figure 4.12 shows the market share of life insurers in total premium
income for the period from 2001-02 to 2006-07.
Figure 4.12 Market Share of Life Insurers in Total Premium Income (in Percentage)
0
10
20
30
40
50
60
70
80
90
100
2001-02 2002-03 2003-04 2004-05 2005-06 2006-07
Year
Per
cent
age
Private Total
LIC
Number of Products Sold and Market Share of Life Insurers
New business in terms of number of products sold is another
indicator of the growth of the insurance companies. It is a pointer towards
the spread of message of insurance among people. Since the data relating
to the number of products sold by private players was not available for
2001-02, the analysis of this variable has been done for 2002-03 to 2005-
06. Table 4.19 indicates number of new products sold by different insurers
for the years from 2002-03 to 2006-07.
150
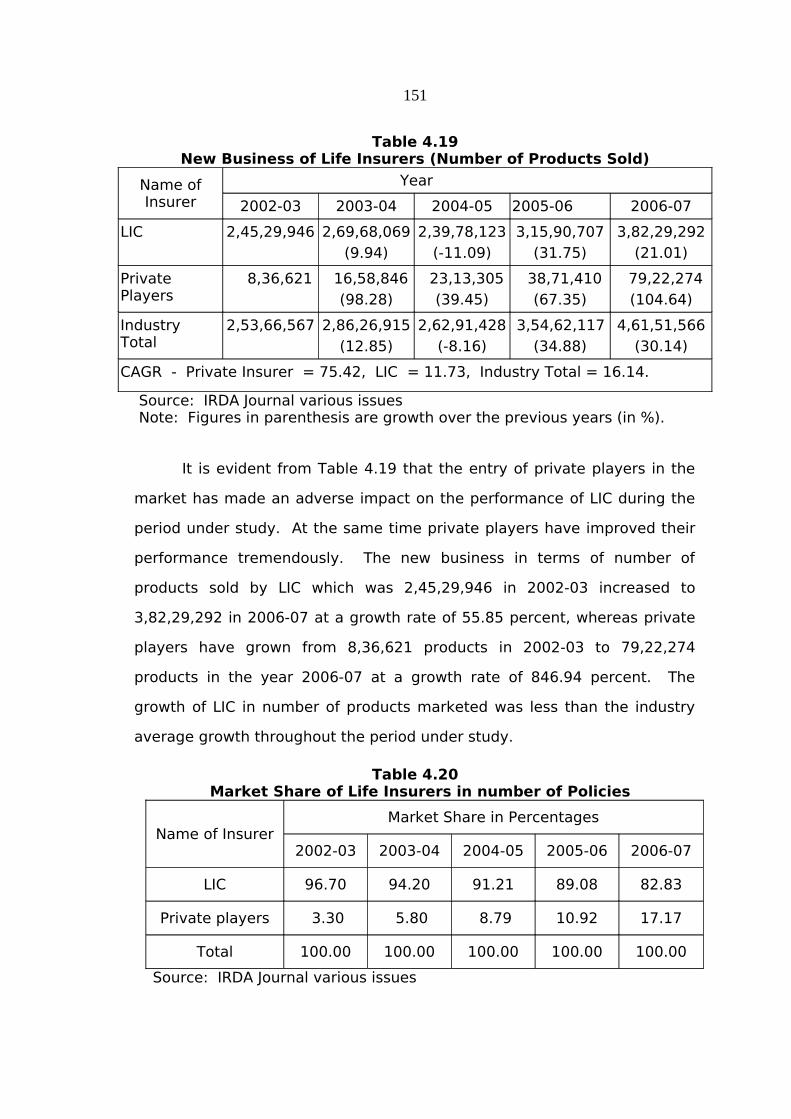
Table 4.19 New Business of Life Insurers (Number of Products Sold)
Name of Insurer
Year
2002-03 2003-04 2004-05 2005-06 2006-07
LIC 2,45,29,946 2,69,68,069(9.94)
2,39,78,123(-11.09)
3,15,90,707(31.75)
3,82,29,292(21.01)
Private Players
8,36,621 16,58,846(98.28)
23,13,305(39.45)
38,71,410(67.35)
79,22,274(104.64)
Industry Total
2,53,66,567 2,86,26,915(12.85)
2,62,91,428(-8.16)
3,54,62,117(34.88)
4,61,51,566(30.14)
CAGR - Private Insurer = 75.42, LIC = 11.73, Industry Total = 16.14.
Source: IRDA Journal various issues Note: Figures in parenthesis are growth over the previous years (in %).
It is evident from Table 4.19 that the entry of private players in the
market has made an adverse impact on the performance of LIC during the
period under study. At the same time private players have improved their
performance tremendously. The new business in terms of number of
products sold by LIC which was 2,45,29,946 in 2002-03 increased to
3,82,29,292 in 2006-07 at a growth rate of 55.85 percent, whereas private
players have grown from 8,36,621 products in 2002-03 to 79,22,274
products in the year 2006-07 at a growth rate of 846.94 percent. The
growth of LIC in number of products marketed was less than the industry
average growth throughout the period under study.
Table 4.20 Market Share of Life Insurers in number of Policies
Name of InsurerMarket Share in Percentages
2002-03 2003-04 2004-05 2005-06 2006-07
LIC 96.70 94.20 91.21 89.08 82.83
Private players 3.30 5.80 8.79 10.92 17.17
Total 100.00 100.00 100.00 100.00 100.00
Source: IRDA Journal various issues
151

Figure 4.13Market Share of Life Insurers in Number of Policies (in percentage)
0
10
20
30
40
50
60
70
80
90
100
2002-03 2003-04 2004-05 2005-06 2006-07
Year
Per
cent
age
Private Total
LIC
Table 4.20 depicts the market share and Figure 4.13 depicts the
growth in market share in number of products marketed by LIC and private
players during the period from 2002-03 to 2006-07. It is evident from Table
4.20 that the market share of LIC in terms of number of policies has been
decreasing year after year with the entry of private players. The share of
LIC, which was 96.70 per cent in the year 2002-03 decreased to 82.83
percent in 2006-07. The private players have steadily increased their
market share from 3.30 per cent in 2002-03 to 17.17 per cent in 2006-07.
152

CONCLUSION
From the above analysis it can be concluded that the LIC, during the
last 52 years of its existence has undergone several trials and tribulations,
faced ups and downs in business growth but managed to grow and
metamorphose into a giant in the industry. At the same time, there has
been a tremendous growth in the life insurance business in India after the
entry of private players. The growth in terms of number of products, sum
assured of products and premium income in Kannur and Kasargod districts
have been found decreasing from 2003-04 onwards. The growth in
productivity of agents in both the districts was not steady during the period
under study. At the same time, agents in the branches in Kasargod district
showed a better productivity than their counterparts in Kannur and all India
Level. The market share of Life Insurance Corporation of India has been
showing a constant fall after the entry of private players. The performance
of LIC has been affected badly in terms of premium income and number of
policies, after privatization of the insurance sector.
The next chapter analysis views of the policyholders.
153
References:
1. Life Insurance Administration, Insurance Institute of India, Mumbai,
1988, pp. 1-4.
2. http://en.wikipedia.org/wiki/Life Insurance Corporation of India.
3. Kishore, R.B., LIC Golden Jubilee-50 Years’ Saga of Security,
Insurance Chronicle, Jan. 2006, Vol. VI, Issue I, pp. 57-72.
4. The Annual Report of LIC 2005-06.
5. Kenneth Black, Jr. and Harold, D. Skipper, Jr., Life and Health
Insurance, 13th ed., Pearson Education, Singapore, pp. 600-632.
6. Jha, S.M., Services Marketing, 6th ed., Himalaya Publishing House,
Mumbai, 2005, pp. 161-203.
7. Philip Kotler and Gary Armstrong, Principles of Marketing, 9th ed.,
Prentice-Hall of India, 2001, pp. 5-43.
8. The Life Insurance Compendium 1999-2000, The Insurance Times,
Calcutta, p. 27.
9. Philip Kotler., op. cit., pp. 5-43.
10. Manual for Agents 1999, LIC of India.
11. Ibid.
12. Sharma, N.C., The Selling of Life Insurance in India (Part II),
Yogakshema, May 2003, No.5, pp.5-8.
13. Viswanathan, S., Alternative Channels of Distribution, Yogakshema,
No. 8, August 2004, pp. 8-9.
14. http:/www.etstrategicmarketing.com/Smjan-feb 04/artl.html
accessed on 19/5/2007.
15. Rakesh Agarwal, “Bancassurance”, The Insurance Times, Vol. XXIV,
No. 10, October 2004, pp. 19-25.
16. LIC Chairman’s review 2006.
17. Philip Kotler et al, Marketing 7th ed., Pearson Education, Singapore,
2006, pp. 343-353.
154
18. Vijayarani, J., ‘Cost Effective Distribution Channels of Life Insurance
Products’, The Journal of Insurance Institute of India, Vol. No. XXIV,
July-December 1999, pp.53-62.
19. Ibid.
20. Ramakrishna Rao, T.S., ‘Unit-Linked Insurance Products – The Big
Leap’, Insurance Chronicle, Vol. VI, Isue III, March 2006, pp. 15-18.
21. Business India, No. 755, February 25, 2007, pp. 86-96.
22. Out Look Money, November30, 2007, Vol. 6, Issue 22, p.54.
23. Jha, S.M., op. cit., pp. 161-203.
24. Philip Kotler., op. cit., pp 343-353.
25. Roy Abhijith, “Insurance: Smooth Opening Up Phase”, The Hindu
Survey of Indian Industry, 2004, pp. 67-68.
26. Ibid.
27. Rajesh, C. Jampala and Venkateswara Rao Bh, “The Indomitable and
Invincible LIC”, Insurance Chronicle Vol. V, Issue VIII, August 2005, pp.
31-37.
28. Jawaharlal, U, “Physical Hazard and Life Insurance Premium”,
Insurance Chronicle, Vol. IV, Issue IX, September, 2004 pp. 23-24.
29. India Insurance Report – I, Allied Publishers,New Delhi, 2006, p. 25.
30. Rajeev Ahuja, “Micro Insurance for the Poor: Policy Choices”,
Economic and Political Weekly, Vol. XXXVIII, No. 48, Nov. – Dec. 2003,
pp. 5034-5036.
31. IRDA Notification, Insurance Regulatory and Development Authority
(Obligations of Insurers to Rural Social Sectors) Regulations, Delhi,
October 16, 2002.
32. The Hindu Business Review, February 10, 1999.
155


