www.elsevier.com/locate/jmarsys
Journal of Marine System
Land-fast ice off Adelie Land (Antarctica): short-term variations in
nutrients and chlorophyll just before ice break-up
C. Riaux-Gobina,*, P. Treguerb, G. Dieckmannc, E. Mariaa, G. Vetiona, M. Poulind
aCNRS, Laboratoire d’Oceanographie Biologique, 66650 Banyuls/mer, FrancebCNRS, IUEM, Technopole Brest-Iroise, 29280 Plouzane, France
cAlfred Wegener Institut fuer Polar und Meeresforschung Am, 27570 Bremerhaven, GermanydResearch Division, Canadian Museum of Nature, Ottawa, ON K1P 6P4, Canada
Received 21 January 2004; accepted 26 August 2004
Available online 14 November 2004
Abstract
This study focused on the short-term variations of sea ice microalgal biomass and nutrients, in Adelie Land coastal area
(Antarctica). The annual land-fast ice, bplatelet ice-likeQ layer (PLI) and under-lying seawater were sampled during the 1999
austral spring. The study was conducted during 33 days preceding the ice break-up, with a daily sampling when the
meteorological conditions were favourable. Time-series for salinity, chlorophyll a (Chl a), NH4+, NO2
�, NO3�, PO4
� and Si(OH)4are shown. We also provide satellite data and meteorological variables for the same period. During the study period, the solid
ice thickness varied from 1.47 to 1.05 m. Pigments were concentrated in bottom ice, but progressively invaded the PLI. Phaeo a
increased in the PLI during the last weeks, in parallel with increasing NO2� concentration. Si(OH)4, in lowest concentrations in
bottom ice, increased progressively in the under-ice water (UIW) and PLI, this was because of offshore water inputs. NH4+
concentrations were high in every sea ice component (particularly in the bottom ice) and were inversely correlated to pigments
in the bottom ice. NH4+ concentrations progressively increased in the PLI and underlying seawater just before the break-up. In
the bottom ice, PO4� concentrations were related to high pigment concentrations, but with a short lag close to the break up
period, indicating in situ regeneration. Neither NO3� nor NH4
+ concentrations were exhausted in the bottom ice. NO2� and NH4
+
concentrations increased in PLI and under-ice water just before the break-up period, which might indicate strong inorganic
nitrogen recycling in land-fast ice. Approximately 0.4 kmol km�1 linear coast of NH4+ (1 kmol NO3
� and 2 kmol PO4�) were
released to the under-ice seawater during break-up, along with 0.12 tons km�1 Chl a (9.6 tons POC km�1 equivalent). These
nutrient sea ice inputs to the coastal zone waters, during the ice recession and break-up, may vary annually depending upon the
local meteorological conditions that control ice formation, duration of ice cover and melting.
D 2004 Elsevier B.V. All rights reserved.
Keywords: Annual land-fast ice; Time-series; Break-up; Nutrients; Sympagic biomass
0924-7963/$ - s
doi:10.1016/j.jm
* Correspondi
E-mail addr
s 55 (2005) 235–248
ee front matter D 2004 Elsevier B.V. All rights reserved.
arsys.2004.08.003
ng author. Tel.: +33 4 68887308; fax: +33 4 68887395.
ess: [email protected] (C. Riaux-Gobin).
C. Riaux-Gobin et al. / Journal of Marine Systems 55 (2005) 235–248236
1. Introduction
The biogeochemical characteristics of Antarctic
land-fast ice have been mainly investigated on multi-
year sea ice environments whereas annual land-fast ice
has been less documented. Recent studies on fast ice,
however, have focused on platelet ice layer and
highlight the importance of both nutrients and pigments
(i.e., Sullivan et al., 1982; Arrigo et al., 1993, 1995).
Whereas these variables/parameters seem highly var-
iable within site and season, it has been demonstrated
that the fast ice is related to high microalgal biomass
and production, and high nutrient regeneration (Tho-
mas and Papadimitriou, 2003; Arrigo, 2003).
To quantify the fast ice contribution to the enrich-
ment of the underlying water masses and benthos at
spring, researchers have assessed and reported the
nutrient and particulate organic matter inputs to the
coastal zone waters (i.e., Palmisano and Sullivan, 1983;
Matsuda et al., 1990; McMinn et al., 2000; Thomas et
al., 2001; Leventer, 2003). In Antarctic coastal zones, 2
or 3 weeks after sea ice break-up, a phytoplankton
bloom generally takes place. In Adelie Land, a study
already has been conducted after sea ice break-up, in
open water, and the spatial repartition of the phyto-
plankton described (Fiala and Delille, 1992). However,
neither the initiation nor the development of the bloom
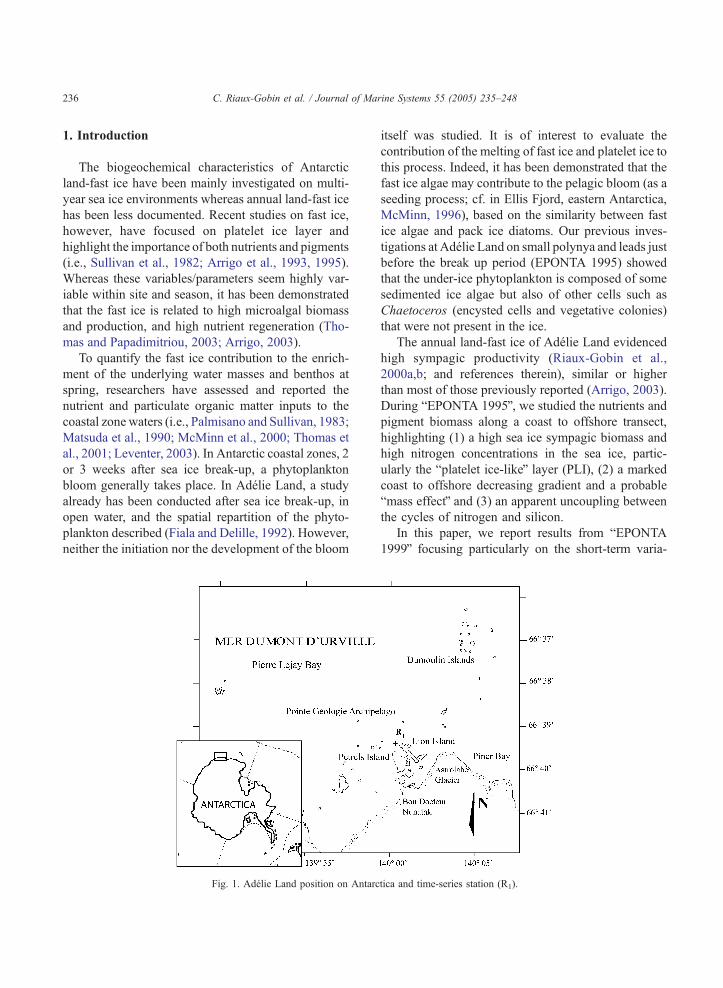
Fig. 1. Adelie Land position on Antarc
itself was studied. It is of interest to evaluate the
contribution of the melting of fast ice and platelet ice to
this process. Indeed, it has been demonstrated that the
fast ice algae may contribute to the pelagic bloom (as a
seeding process; cf. in Ellis Fjord, eastern Antarctica,
McMinn, 1996), based on the similarity between fast
ice algae and pack ice diatoms. Our previous inves-
tigations at Adelie Land on small polynya and leads just
before the break up period (EPONTA 1995) showed
that the under-ice phytoplankton is composed of some
sedimented ice algae but also of other cells such as
Chaetoceros (encysted cells and vegetative colonies)
that were not present in the ice.
The annual land-fast ice of Adelie Land evidenced
high sympagic productivity (Riaux-Gobin et al.,
2000a,b; and references therein), similar or higher
than most of those previously reported (Arrigo, 2003).
During bEPONTA 1995Q, we studied the nutrients and
pigment biomass along a coast to offshore transect,
highlighting (1) a high sea ice sympagic biomass and
high nitrogen concentrations in the sea ice, partic-
ularly the bplatelet ice-likeQ layer (PLI), (2) a marked
coast to offshore decreasing gradient and a probable
bmass effectQ and (3) an apparent uncoupling between
the cycles of nitrogen and silicon.
In this paper, we report results from bEPONTA1999Q focusing particularly on the short-term varia-
tica and time-series station (R1).
C. Riaux-Gobin et al. / Journal of Marine Systems 55 (2005) 235–248 237
bility in nutrients and pigment biomass concentra-
tions, at a coastal land-fast ice station, during the 5-
week period that preceded the break-up. Specifically,
we studied the variations of dissolved nitrogen (NH4+,
NO3�, NO2
�), and of silicate [Si(OH)4] and phosphate
(PO4�). Compared to EPONTA 1995, significant
differences were observed in the conditions and
lasting of the ice cover and break-up conditions.
Nevertheless, the physical structure of the ice and the
presence of the sympagic layer were more or less
similar, reinforcing the prediction of the concentration
of nutrients within the sea ice released in the coastal
zone waters during the spring break-up.
2. Sampling site, material and methods
2.1. Sampling site and ice conditions
The study area in Adelie Land is close to the
continent and to the Astrolabe Glacier (Fig. 1); the
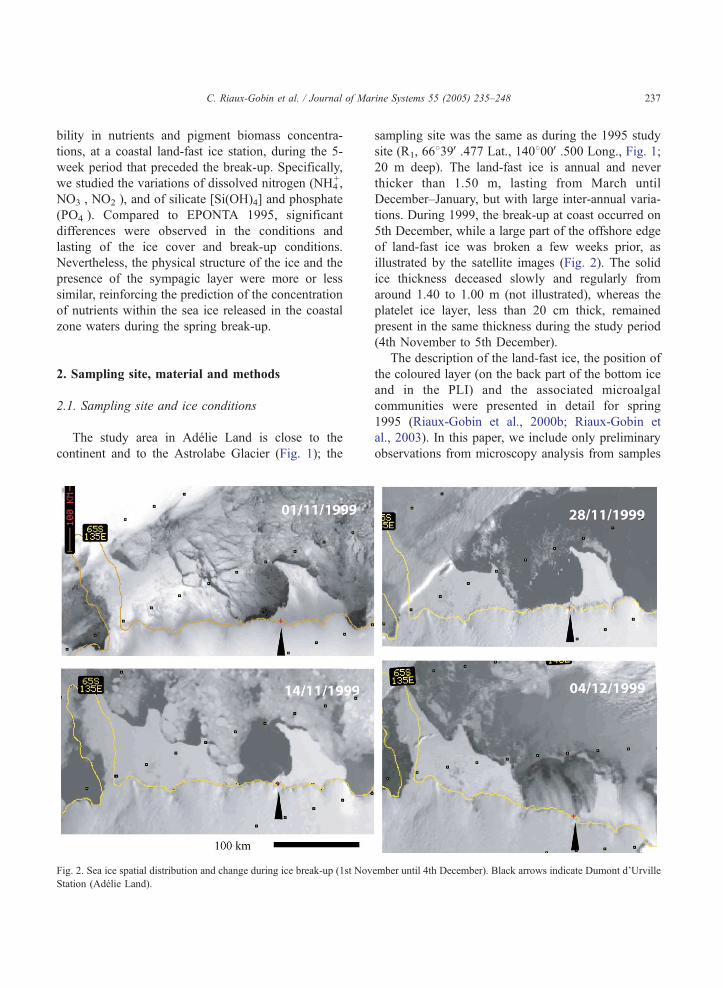
Fig. 2. Sea ice spatial distribution and change during ice break-up (1st Nov
Station (Adelie Land).
sampling site was the same as during the 1995 study
site (R1, 66839V.477 Lat., 140800V.500 Long., Fig. 1;
20 m deep). The land-fast ice is annual and never
thicker than 1.50 m, lasting from March until
December–January, but with large inter-annual varia-
tions. During 1999, the break-up at coast occurred on
5th December, while a large part of the offshore edge
of land-fast ice was broken a few weeks prior, as
illustrated by the satellite images (Fig. 2). The solid
ice thickness deceased slowly and regularly from
around 1.40 to 1.00 m (not illustrated), whereas the
platelet ice layer, less than 20 cm thick, remained
present in the same thickness during the study period
(4th November to 5th December).
The description of the land-fast ice, the position of
the coloured layer (on the back part of the bottom ice
and in the PLI) and the associated microalgal
communities were presented in detail for spring
1995 (Riaux-Gobin et al., 2000b; Riaux-Gobin et
al., 2003). In this paper, we include only preliminary
observations from microscopy analysis from samples
ember until 4th December). Black arrows indicate Dumont d’Urville
C. Riaux-Gobin et al. / Journal of Marine Systems 55 (2005) 235–248238
at Adelie Land; the assemblages and time successions
specific to the spring 1999 will be presented
separately. In the present paper, we used the same
abbreviated names for the different ice layers and
water masses sampled as previously used.
2.2. Sample collection and chemical parameters
The time-series was conducted in area ofF60 m2 to
minimize the impact of spatial heterogeneity of the ice.
Ice samples were collected using a motorized SIPRE
corer (Medlin and Priddle, 1990). The diameter of the
ice cores was 7.5 cm. At each sampling, two or three
cores were taken spaced 30–50 cm from each other; one
core was used for nutrient measurement and another
was for taxonomy and biomass. After measuring its
length, each core was stored in a dark plastic bag. From
each core, 10-cm slices were cut from the snow, solid
ice surface, middle and bottom ice layers. This study
only reports on the bottom-ice layer corresponding to
the solid granular ice containing the bulk of microalgal
biomass (as well as the platelet ice-like layer) and
which occurred as a brownish layer at the bottom of the
core (1–3 cm thick). Occasionally, we additionally
sampled two or three more cores specifically to study
the b3 cm bottom iceQ level. Following the removal of
the ice core, the PLI was rapidly sampled from the core
hole and stored in plastic containers; the thickness of
the PLI was estimated when scooping out from the core
hole. This layer was present in 1995 as well in 2001
(personal observation). Although the environmental
conditions suggest that this PLI layer originated from
the platelet ice, it was composed of soft millimeter
crystals and not of plate-like crystals (Riaux-Gobin et
al., 2000b). After removing the remaining crystals of
the PLI, we sampled the immediate under-ice water
(UIW) with 2-l glass bottles. From 18th November
until 5th December, the under-ice water at 5 m was also
sampled with a simplified system (PVC cylinder,
weighted, open from the surface and rapidly lift
through the core hole). These water samples, although
somewhat contaminated by some remaining PLI
crystals, are more representative of the underlying
seawater (not illustrated).
To follow the time variations occurring in the ice
during the last weeks preceding the break-up, we
sampled the ice, PLI and under-ice water at station R1
daily at mid-day when possible. Twenty-six samples
from the 4th November (Day 1) were collected over
33 days.
To confirm the coast to offshore gradient as
observed in 1995, in early November 1999, we
sampled at 4 km (OS1) and 20 km offshore (OS2),
measuring the same parameters as for the time-series.
At OS2, the snow cover was 80 cm deep, and the sea
ice thickness was 2 m.
Bottom ice, PLI, under-ice water samples were
collected and immediately frozen at �20 8C for later
nutrients analyses. Six months later at Brest (IUEM),
the samples were melted and filtered; nitrate, nitrite,
phosphate and silicic acid concentrations were meas-
ured using methods described by Treguer and Le
Corre (1975); results were expressed per unit liquid
(AM). Salinity was measured with a refractometer and
salinity results were corrected on the basis of some
deep-frozen samples (from sea ice to seawater) that
were measured later in salinity with a salinometer
(IUEM, Brest). NH4+ was measured at Adelie Land,
following Koroleff’s (1969, 1976) method with gentle
melting of samples in the dark at 4–7 8C and with
only the most microphyte enriched samples being
filtered (20 Am sieve). Analysis was undertaken in
replicate throughout. For pigment analysis, UIW
samples were filtered 1 or 2 h after sampling, onto
GF/F filters. PLI and bottom-ice samples (melted in
the dark at 4–7 8C) were also filtered, after complete
melting (from a few hours for PLI to 12–16 h for the
bottom ice) onto GF/F filters. The filters were frozen
(�20 8C) until further analysis six months later at the
LOB (Banyuls/mer). Chloropigments were extracted
in acetone and measured using spectrofluorometry
(Neveux and Lantoine, 1993).
Meteorological and satellite data (Figs. 2 and 3)
were provided by the meteorological team at Dumont
d’Urville Station (Meteo France and MeteoSat),
whereas the tidal data and bottom seawater temper-
ature were provided by ROSAME team (LEGOS/
CRGS Toulouse, France).
3. Results
3.1. Climatic conditions
Whereas in November, a large offshore bay was
open in the fast ice North of Adelie Land (Fig. 2),
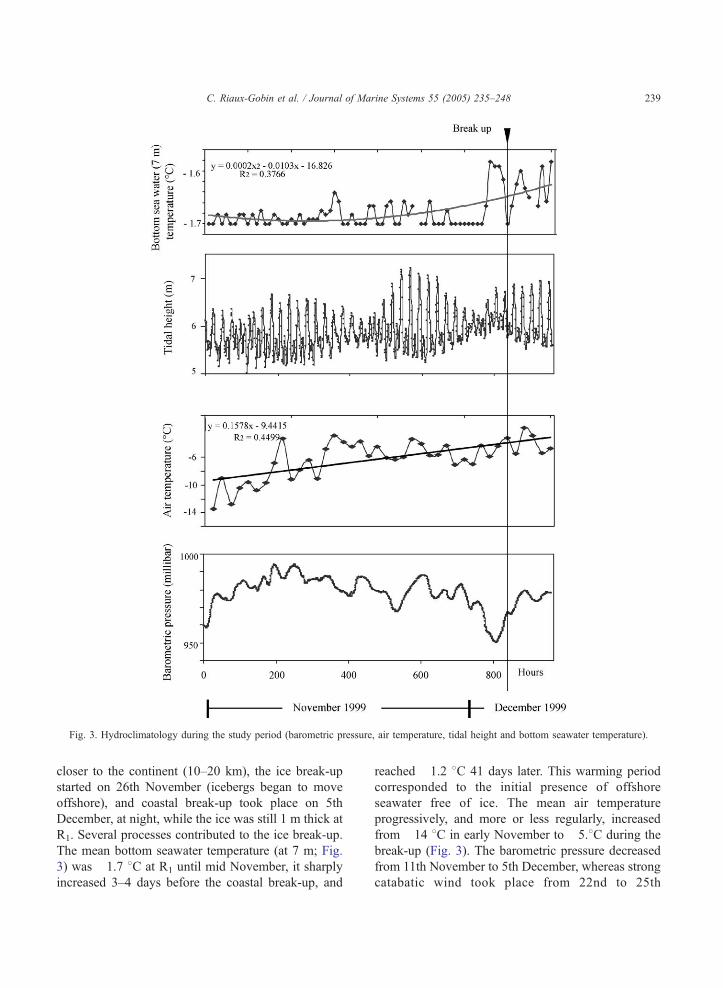
Fig. 3. Hydroclimatology during the study period (barometric pressure, air temperature, tidal height and bottom seawater temperature).
C. Riaux-Gobin et al. / Journal of Marine Systems 55 (2005) 235–248 239
closer to the continent (10–20 km), the ice break-up
started on 26th November (icebergs began to move
offshore), and coastal break-up took place on 5th
December, at night, while the ice was still 1 m thick at
R1. Several processes contributed to the ice break-up.
The mean bottom seawater temperature (at 7 m; Fig.
3) was �1.7 8C at R1 until mid November, it sharply
increased 3–4 days before the coastal break-up, and
reached �1.2 8C 41 days later. This warming period
corresponded to the initial presence of offshore
seawater free of ice. The mean air temperature
progressively, and more or less regularly, increased
from �14 8C in early November to �5.8C during the
break-up (Fig. 3). The barometric pressure decreased
from 11th November to 5th December, whereas strong
catabatic wind took place from 22nd to 25th
C. Riaux-Gobin et al. / Journal of Marine Systems 55 (2005) 235–248240
November and also from 3rd and 4th December (up to
137 km/h), along with strong swell that significantly
modified the sea ice extent. During the study period,
the tidal range was maximal, from 22nd to 25th
November, probably helping to weaken the ice. All
these processes were in favour of the break-up that
took place on 5th December night.
3.2. Ice conditions
At station R1 the mean ice depth varied from 147
cm on Day 1 (4th November), to 105 cm at Julian Day
33 (5th December, before break-up). Taking into
account the spatial heterogeneity of the ice sheet, the
melting was regular over time (not illustrated). If the
conditions of the break-up were completely different
from those of 1995 (and also 2001; personal
observation), the ice, platelet ice structure and snow
cover at the coast were similar from one year to
another; the land-fast ice was composed of columnar
ice with no infiltration level, and the bottom ice was
composed of 1–5 cm of granular ice, often coloured
deep brown by microalgae. The solid bottom ice layer
was always very distinct from the unconsolidated PLI
layer. While the ice was melting, the coloured bottom
ice layer became thinner, loosely connected and
brittle. At the same time, the PLI became more and
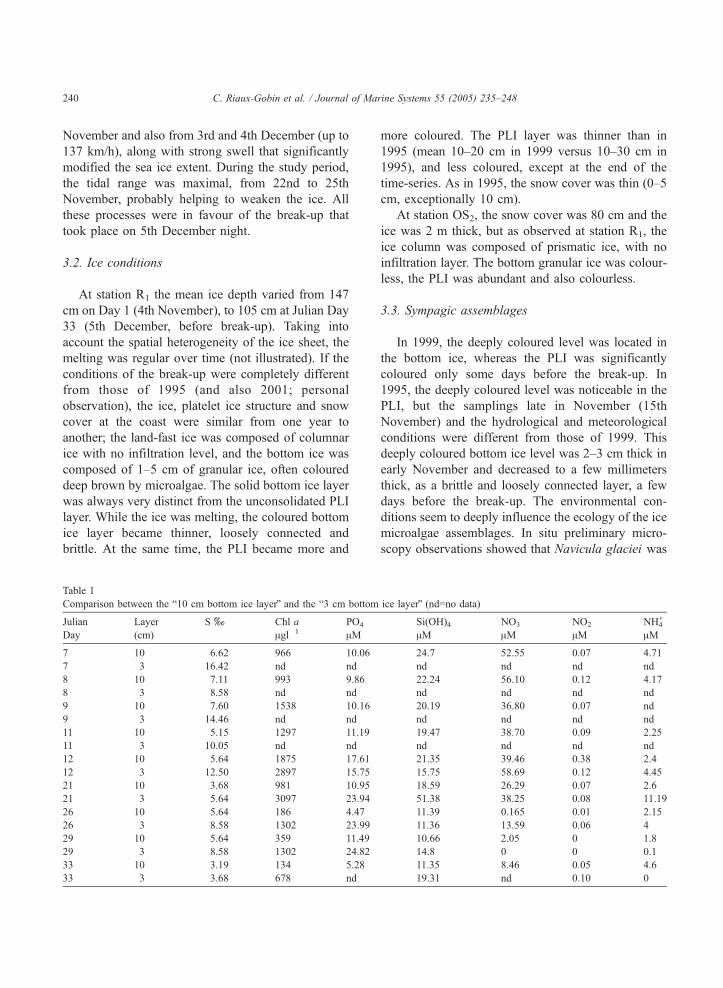
Table 1
Comparison between the b10 cm bottom ice layerQ and the b3 cm bottom
Julian
Day
Layer
(cm)
S x Chl a
Agl�1
PO4�
AM
7 10 6.62 966 10.06
7 3 16.42 nd nd
8 10 7.11 993 9.86
8 3 8.58 nd nd
9 10 7.60 1538 10.16
9 3 14.46 nd nd
11 10 5.15 1297 11.19
11 3 10.05 nd nd
12 10 5.64 1875 17.61
12 3 12.50 2897 15.75
21 10 3.68 981 10.95
21 3 5.64 3097 23.94
26 10 5.64 186 4.47
26 3 8.58 1302 23.99
29 10 5.64 359 11.49
29 3 8.58 1302 24.82
33 10 3.19 134 5.28
33 3 3.68 678 nd
more coloured. The PLI layer was thinner than in
1995 (mean 10–20 cm in 1999 versus 10–30 cm in
1995), and less coloured, except at the end of the
time-series. As in 1995, the snow cover was thin (0–5
cm, exceptionally 10 cm).
At station OS2, the snow cover was 80 cm and the
ice was 2 m thick, but as observed at station R1, the
ice column was composed of prismatic ice, with no
infiltration layer. The bottom granular ice was colour-
less, the PLI was abundant and also colourless.
3.3. Sympagic assemblages
In 1999, the deeply coloured level was located in
the bottom ice, whereas the PLI was significantly
coloured only some days before the break-up. In
1995, the deeply coloured level was noticeable in the
PLI, but the samplings late in November (15th
November) and the hydrological and meteorological
conditions were different from those of 1999. This
deeply coloured bottom ice level was 2–3 cm thick in
early November and decreased to a few millimeters
thick, as a brittle and loosely connected layer, a few
days before the break-up. The environmental con-
ditions seem to deeply influence the ecology of the ice
microalgae assemblages. In situ preliminary micro-
scopy observations showed that Navicula glaciei was
ice layerQ (nd=no data)
Si(OH)4AM
NO3�
AMNO2
�
AMNH4
+
AM
24.7 52.55 0.07 4.71
nd nd nd nd
22.24 56.10 0.12 4.17
nd nd nd nd
20.19 36.80 0.07 nd
nd nd nd nd
19.47 38.70 0.09 2.25
nd nd nd nd
21.35 39.46 0.38 2.4
15.75 58.69 0.12 4.45
18.59 26.29 0.07 2.6
51.38 38.25 0.08 11.19
11.39 0.165 0.01 2.15
11.36 13.59 0.06 4
10.66 2.05 0 1.8
14.8 0 0 0.1
11.35 8.46 0.05 4.6
19.31 nd 0.10 0
C. Riaux-Gobin et al. / Journal of Marine Systems 55 (2005) 235–248 241
less abundant in 1999 than in 1995. We also noticed
large amounts of Berkeleya adeliensis clumps in
bottom ice at the end of the time-series (Riaux-Gobin
et al., 2000a). Time succession within species, and
spatial repartition within the different ice levels, will
be reported elsewhere.
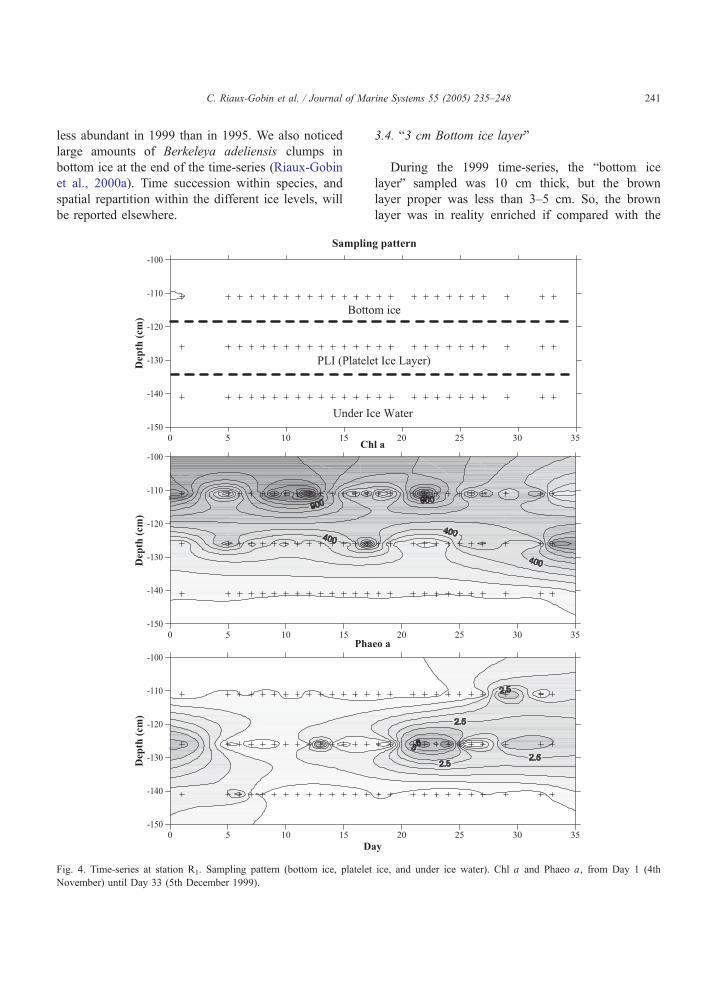
Fig. 4. Time-series at station R1. Sampling pattern (bottom ice, platelet
November) until Day 33 (5th December 1999).
3.4. b3 cm Bottom ice layerQ
During the 1999 time-series, the bbottom ice
layerQ sampled was 10 cm thick, but the brown
layer proper was less than 3–5 cm. So, the brown
layer was in reality enriched if compared with the
ice, and under ice water). Chl a and Phaeo a, from Day 1 (4th
C. Riaux-Gobin et al. / Journal of Marine Systems 55 (2005) 235–248242
10 cm layer analyzed. To quantify this under-
estimate of concentration in pigments and nutrients
of the brown layer itself, for selected samples we
studied in detail the b3 cm bottom ice layerQ(Table 1).
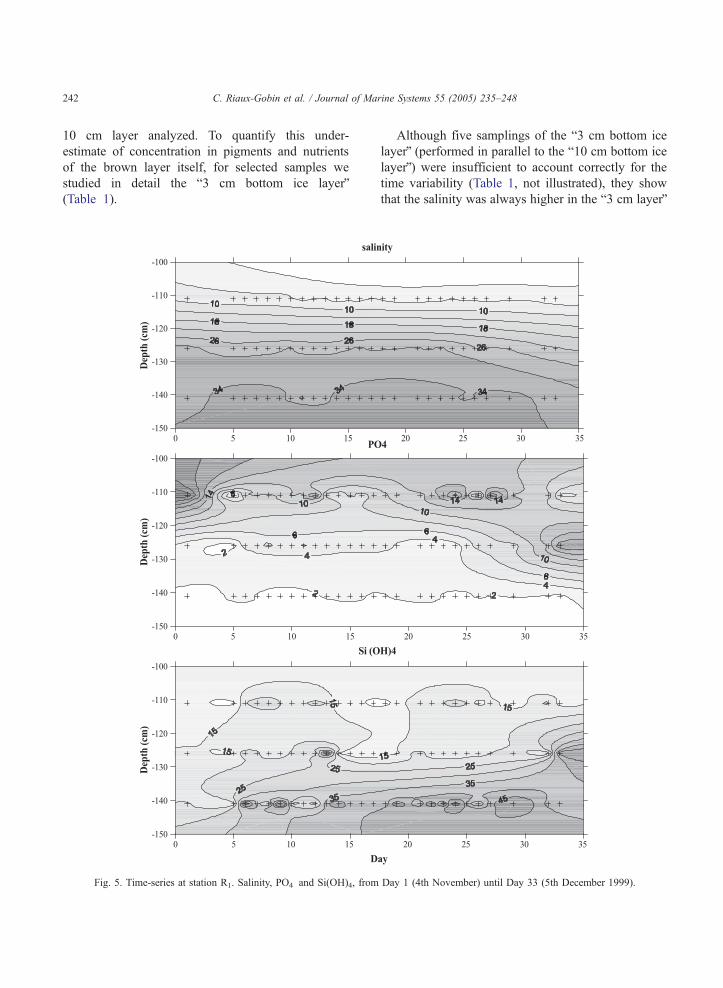
Fig. 5. Time-series at station R1. Salinity, PO4� and Si(OH)4, from
Although five samplings of the b3 cm bottom ice
layerQ (performed in parallel to the b10 cm bottom ice
layerQ) were insufficient to account correctly for the
time variability (Table 1, not illustrated), they show
that the salinity was always higher in the b3 cm layerQ
Day 1 (4th November) until Day 33 (5th December 1999).
C. Riaux-Gobin et al. / Journal of Marine Systems 55 (2005) 235–248 243
and decreased with time, this was also true for the
pigments (chlorophyll a [Chl a], up to 3 mg l�1 at
Day 21). The PO4� concentrations were also higher in
the b3 cm layerQ and decreased with time. For other
parameters, the differences between the b10 cm layerQand the b3 cm layerQ were less marked.
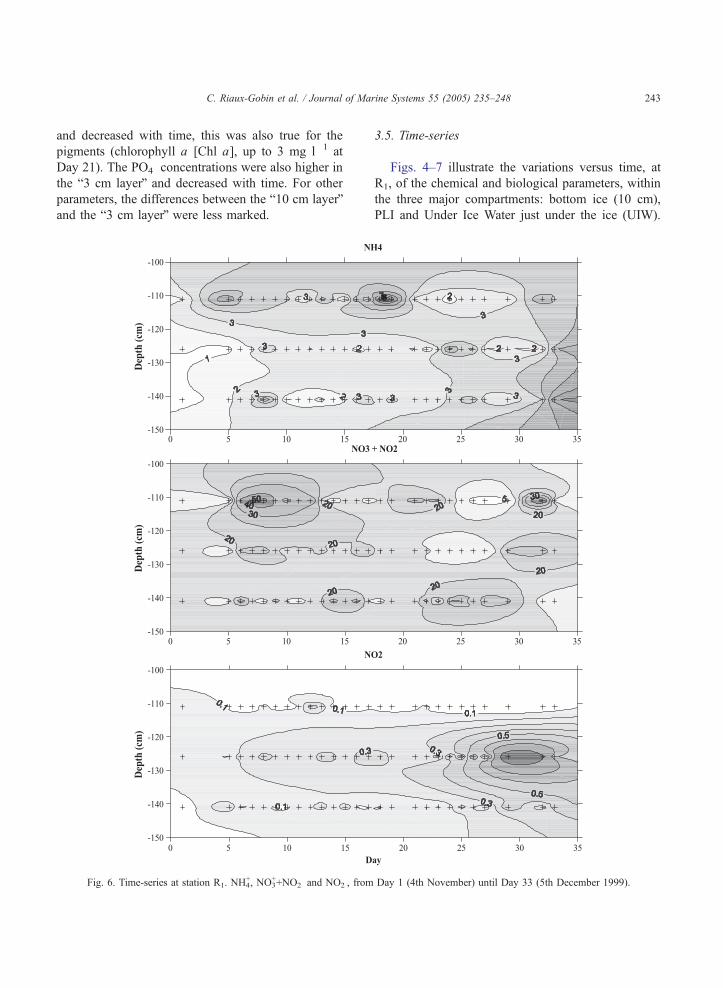
Fig. 6. Time-series at station R1. NH4+, NO3
++NO2� and NO2
�, from
3.5. Time-series
Figs. 4–7 illustrate the variations versus time, at
R1, of the chemical and biological parameters, within
the three major compartments: bottom ice (10 cm),
PLI and Under Ice Water just under the ice (UIW).
Day 1 (4th November) until Day 33 (5th December 1999).
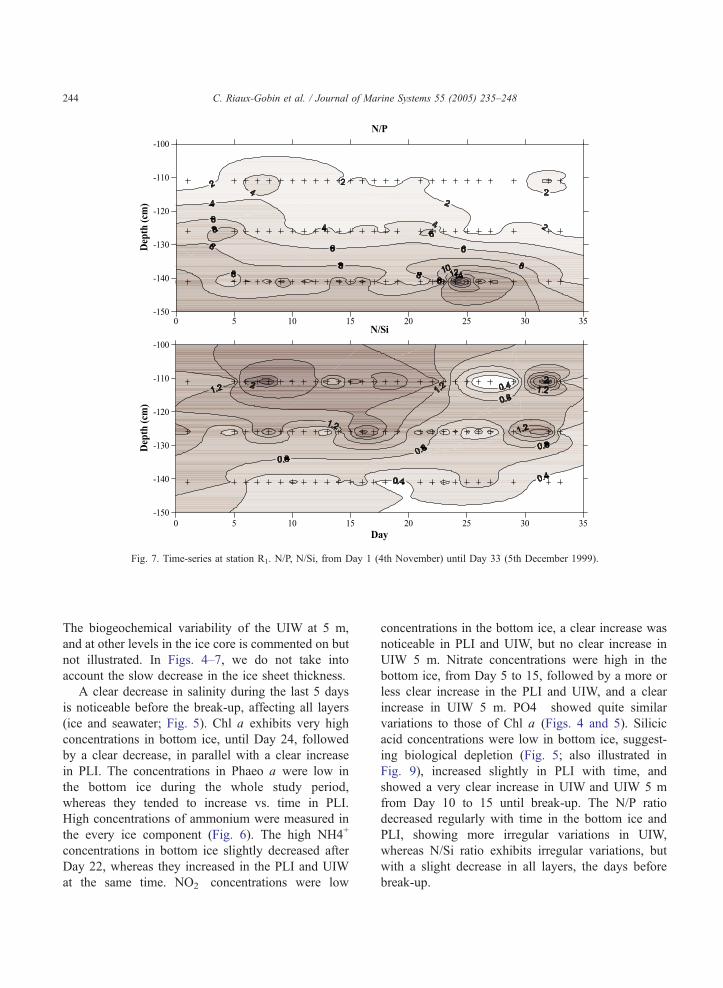
Fig. 7. Time-series at station R1. N/P, N/Si, from Day 1 (4th November) until Day 33 (5th December 1999).
C. Riaux-Gobin et al. / Journal of Marine Systems 55 (2005) 235–248244
The biogeochemical variability of the UIW at 5 m,
and at other levels in the ice core is commented on but
not illustrated. In Figs. 4–7, we do not take into
account the slow decrease in the ice sheet thickness.
A clear decrease in salinity during the last 5 days
is noticeable before the break-up, affecting all layers
(ice and seawater; Fig. 5). Chl a exhibits very high
concentrations in bottom ice, until Day 24, followed
by a clear decrease, in parallel with a clear increase
in PLI. The concentrations in Phaeo a were low in
the bottom ice during the whole study period,
whereas they tended to increase vs. time in PLI.
High concentrations of ammonium were measured in
the every ice component (Fig. 6). The high NH4+
concentrations in bottom ice slightly decreased after
Day 22, whereas they increased in the PLI and UIW
at the same time. NO2� concentrations were low
concentrations in the bottom ice, a clear increase was
noticeable in PLI and UIW, but no clear increase in
UIW 5 m. Nitrate concentrations were high in the
bottom ice, from Day 5 to 15, followed by a more or
less clear increase in the PLI and UIW, and a clear
increase in UIW 5 m. PO4� showed quite similar
variations to those of Chl a (Figs. 4 and 5). Silicic
acid concentrations were low in bottom ice, suggest-
ing biological depletion (Fig. 5; also illustrated in
Fig. 9), increased slightly in PLI with time, and
showed a very clear increase in UIW and UIW 5 m
from Day 10 to 15 until break-up. The N/P ratio
decreased regularly with time in the bottom ice and
PLI, showing more irregular variations in UIW,
whereas N/Si ratio exhibits irregular variations, but
with a slight decrease in all layers, the days before
break-up.
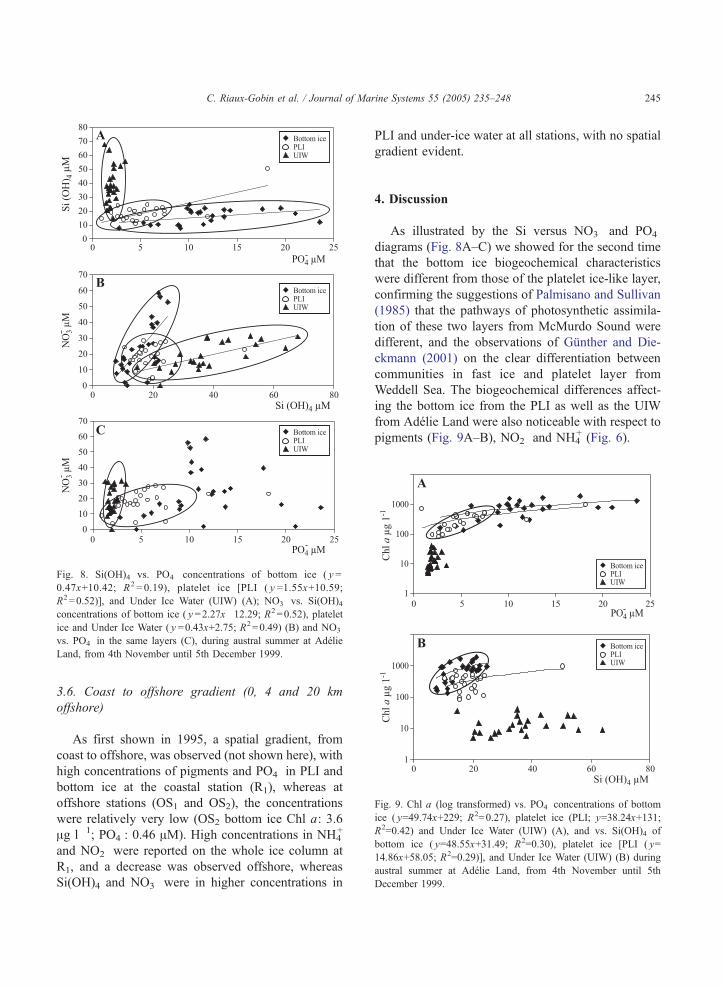
Fig. 8. Si(OH)4 vs. PO4� concentrations of bottom ice ( y =
0.47x+10.42; R2 = 0.19), platelet ice [PLI ( y =1.55x+10.59;
R2=0.52)], and Under Ice Water (UIW) (A); NO3� vs. Si(OH)4
concentrations of bottom ice ( y =2.27x�12.29; R2=0.52), platelet
ice and Under Ice Water ( y =0.43x+2.75; R2=0.49) (B) and NO3�
vs. PO4� in the same layers (C), during austral summer at Adelie
Land, from 4th November until 5th December 1999.
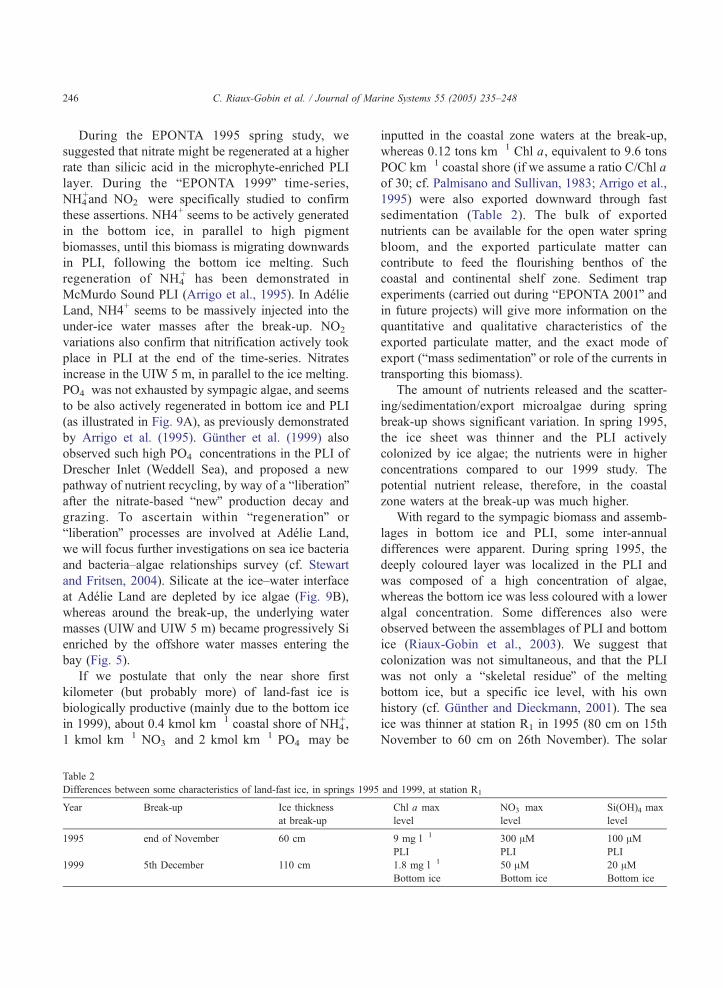
Fig. 9. Chl a (log transformed) vs. PO4� concentrations of bottom
ice ( y=49.74x+229; R2=0.27), platelet ice (PLI; y=38.24x+131
R2=0.42) and Under Ice Water (UIW) (A), and vs. Si(OH)4 o
bottom ice ( y=48.55x+31.49; R2=0.30), platelet ice [PLI ( y=
14.86x+58.05; R2=0.29)], and Under Ice Water (UIW) (B) during
austral summer at Adelie Land, from 4th November until 5th
December 1999.
C. Riaux-Gobin et al. / Journal of Marine Systems 55 (2005) 235–248 245
3.6. Coast to offshore gradient (0, 4 and 20 km
offshore)
As first shown in 1995, a spatial gradient, from
coast to offshore, was observed (not shown here), with
high concentrations of pigments and PO4� in PLI and
bottom ice at the coastal station (R1), whereas at
offshore stations (OS1 and OS2), the concentrations
were relatively very low (OS2 bottom ice Chl a: 3.6
Ag l�1; PO4�: 0.46 AM). High concentrations in NH4
+
and NO2� were reported on the whole ice column at
R1, and a decrease was observed offshore, whereas
Si(OH)4 and NO3� were in higher concentrations in
PLI and under-ice water at all stations, with no spatial
gradient evident.
4. Discussion
As illustrated by the Si versus NO3� and PO4
�
diagrams (Fig. 8A–C) we showed for the second time
that the bottom ice biogeochemical characteristics
were different from those of the platelet ice-like layer,
confirming the suggestions of Palmisano and Sullivan
(1985) that the pathways of photosynthetic assimila-
tion of these two layers from McMurdo Sound were
different, and the observations of Gunther and Die-
ckmann (2001) on the clear differentiation between
communities in fast ice and platelet layer from
Weddell Sea. The biogeochemical differences affect-
ing the bottom ice from the PLI as well as the UIW
from Adelie Land were also noticeable with respect to
pigments (Fig. 9A–B), NO2� and NH4
+ (Fig. 6).
;
f
C. Riaux-Gobin et al. / Journal of Marine Systems 55 (2005) 235–248246
During the EPONTA 1995 spring study, we
suggested that nitrate might be regenerated at a higher
rate than silicic acid in the microphyte-enriched PLI
layer. During the bEPONTA 1999Q time-series,
NH4+and NO2
� were specifically studied to confirm
these assertions. NH4+ seems to be actively generated
in the bottom ice, in parallel to high pigment
biomasses, until this biomass is migrating downwards
in PLI, following the bottom ice melting. Such
regeneration of NH4+ has been demonstrated in
McMurdo Sound PLI (Arrigo et al., 1995). In Adelie
Land, NH4+ seems to be massively injected into the
under-ice water masses after the break-up. NO2�
variations also confirm that nitrification actively took
place in PLI at the end of the time-series. Nitrates
increase in the UIW 5 m, in parallel to the ice melting.
PO4� was not exhausted by sympagic algae, and seems
to be also actively regenerated in bottom ice and PLI
(as illustrated in Fig. 9A), as previously demonstrated
by Arrigo et al. (1995). Gunther et al. (1999) also
observed such high PO4� concentrations in the PLI of
Drescher Inlet (Weddell Sea), and proposed a new
pathway of nutrient recycling, by way of a bliberationQafter the nitrate-based bnewQ production decay and
grazing. To ascertain within bregenerationQ or
bliberationQ processes are involved at Adelie Land,
we will focus further investigations on sea ice bacteria
and bacteria–algae relationships survey (cf. Stewart
and Fritsen, 2004). Silicate at the ice–water interface
at Adelie Land are depleted by ice algae (Fig. 9B),
whereas around the break-up, the underlying water
masses (UIW and UIW 5 m) became progressively Si
enriched by the offshore water masses entering the
bay (Fig. 5).
If we postulate that only the near shore first
kilometer (but probably more) of land-fast ice is
biologically productive (mainly due to the bottom ice
in 1999), about 0.4 kmol km�1 coastal shore of NH4+,
1 kmol km�1 NO3� and 2 kmol km�1 PO4
� may be
Table 2
Differences between some characteristics of land-fast ice, in springs 1995
Year Break-up Ice thickness
at break-up
1995 end of November 60 cm
1999 5th December 110 cm
inputted in the coastal zone waters at the break-up,
whereas 0.12 tons km�1 Chl a, equivalent to 9.6 tons
POC km�1 coastal shore (if we assume a ratio C/Chl a
of 30; cf. Palmisano and Sullivan, 1983; Arrigo et al.,
1995) were also exported downward through fast
sedimentation (Table 2). The bulk of exported
nutrients can be available for the open water spring
bloom, and the exported particulate matter can
contribute to feed the flourishing benthos of the
coastal and continental shelf zone. Sediment trap
experiments (carried out during bEPONTA 2001Q andin future projects) will give more information on the
quantitative and qualitative characteristics of the
exported particulate matter, and the exact mode of
export (bmass sedimentationQ or role of the currents intransporting this biomass).
The amount of nutrients released and the scatter-
ing/sedimentation/export microalgae during spring
break-up shows significant variation. In spring 1995,
the ice sheet was thinner and the PLI actively
colonized by ice algae; the nutrients were in higher
concentrations compared to our 1999 study. The
potential nutrient release, therefore, in the coastal
zone waters at the break-up was much higher.
With regard to the sympagic biomass and assemb-
lages in bottom ice and PLI, some inter-annual
differences were apparent. During spring 1995, the
deeply coloured layer was localized in the PLI and
was composed of a high concentration of algae,
whereas the bottom ice was less coloured with a lower
algal concentration. Some differences also were
observed between the assemblages of PLI and bottom
ice (Riaux-Gobin et al., 2003). We suggest that
colonization was not simultaneous, and that the PLI
was not only a bskeletal residueQ of the melting
bottom ice, but a specific ice level, with his own
history (cf. Gunther and Dieckmann, 2001). The sea
ice was thinner at station R1 in 1995 (80 cm on 15th
November to 60 cm on 26th November). The solar
and 1999, at station R1
Chl a max
level
NO3� max
level
Si(OH)4 max
level
9 mg l�1 300 AM 100 AMPLI PLI PLI
1.8 mg l�1 50 AM 20 AMBottom ice Bottom ice Bottom ice
C. Riaux-Gobin et al. / Journal of Marine Systems 55 (2005) 235–248 247
irradiation cumulated period in November was very
high (433 h) and the global solar irradiation reached
82746 J/cm2. The daily maximal temperatures were
above 0 8C during 6 days in November, and small
polynya and briversQ opened at the same time.
During spring 1999, the deeply coloured level was
localized in the bottom ice; in contrast, the PLI was
colourless in early November and only brownish
some days before the break-up. The thickness of the
ice was 147 cm (in early November), 115 cm on 16th
November and still 105 cm at break-up on 5th
December. So, the ice sheet was much thicker than
in 1995. The solar irradiation cumulated period in
November was only 349 h and the global solar
irradiation reached 77697 J/cm2; the daily maximal
temperatures were positive during only 3 days in
November, and the last decade was under the mean
(mean over the previous 10 years). At the same time,
high tidal range, low barometric conditions and
significant swell occurred. All these factors favoured
break-up, despite the thickness of the ice. The greater
thickness of the ice probably resulted from low
temperature periods in the winter. This consequently
decreased the solar irradiation reaching the PLI, and
also reduced PLI colonization by ice algae in 1999.
This pairing of a colourless PLI layer with the bottom
ice that was deeply colonized favours the hypothesis
of a different origin and evolution of communities
within PLI and bottom ice (cf., Figs. 8 and 9).
In conclusion, the environmental conditions pre-
vailing during the months before the ice break-up
might significantly influence the conditions of colo-
nization in the different ice levels, and induce differ-
ences in melting and break-up conditions, from one
year to another. The land-fast ice, located in the
vicinity of Dumont d’Urville basis, shows some
reproducible features: this annual ice is less than 2
m thick and does not have intercalary coloured layers,
but present a bottom granular ice layer. This bottom
granular ice presents a coloured layer at the coast
(around 2–3 km wide, more or less thick, and showing
time variations). A platelet ice-like layer, never thicker
than 20 cm at the coast, but more than 40 cm offshore
is also present. At the coast, it may or may not be
coloured; this varies temporally and as a function of
climate. The colonization by sympagic algae of the
different components of the sea ice, particularly the
bottom ice and platelet ice, seems to be linked to
climatic and hydrographic conditions (cf Ackley and
Sullivan, 1994; Arrigo, 2003). These physical ice
features, which show relatively reproducible patterns
of nutrient distribution in the different ice layers and
under-ice water (but with concentrations depending
on the ice formation and thickness, and in great part
related to the presence of ice algae), release nutrients
and ice algae in such Antarctic coastal zone waters, at
the spring break-up, thus impacting both the open
ocean and bottom communities.
Acknowledgments
We thank the over-wintering team members for
their field assistance and fellowship during bEPONTA99Q research program. Thanks are also due to the
bAstrolabeQ polar ship crew. Thanks are due to the
Service d’Observation ROSAME (Laboratoire
d’Etudes en Geophysique et Oceanographie Spatiales;
LEGOS/CRGS Toulouse, F), for the tidal data, and
the meteorological team at Dumont d’Urville Station
(Meteo France) for their collaboration. Thanks are
also due to Dr. Amy Leventer, Dr. Michael P. Lizotte
and Dr. Carole Llewellyn for the critical review of the
manuscript, amendments and corrections. Funds and
logistic assistance on field were supported by the
Institut Polaire Francais, Paul-Emile Victor (IPEV)
formerly the bInstitut Francais pour la Recherche et laTechnologie PolairesQ (IFRTP).
References
Ackley, S.F., Sullivan, C.W., 1994. Physical controls on the
development and characteristics of Antarctic sea ice biological
communities—a review and synthesis. Deep-Sea Research 41,
1583–1604.
Arrigo, K.R., 2003. Primary production in sea ice. In: Thomas,
D.N., Dieckmann, G.S. (Eds.), Sea Ice, An Introduction to Its
Physics, Chemistry, Biology and Geology. Blackwell Science,
Oxford, pp. 143–183.
Arrigo, K.R., Robinson, D.H., Sullivan, C.W., 1993. A high
resolution study of the platelet ice ecosystem in McMurdo
Sound, Antarctica: photosynthetic and bio-optical characteristics
of a dense microalgal bloom. Marine Ecology. Progress Series
98, 173–185.
Arrigo, K.R., Dieckmann, G., Gosselin, M., Robinson, D.H., Fritsen,
C.H., Sullivan, C.W., 1995. High resolution study of the platelet
ice ecosystem in McMurdo Sound, Antarctica: biomass, nutrient,
C. Riaux-Gobin et al. / Journal of Marine Systems 55 (2005) 235–248248
and production profiles within a dense microalgal bloom. Marine
Ecology. Progress Series 127, 255–268.
Fiala, M., Delille, D., 1992. Variability and interactions of
phytoplankton and bacterioplankton in the Antarctic neritic
area. Marine Ecology. Progress Series 89, 135–146.
Gqnther, S., Dieckmann, G.S., 2001. Vertical zonation and
community transition of sea-ice diatoms in fast ice and platelet
layer, Weddell Sea, Antarctica. Annals of Geology 33, 287–296.
Gqnther, S., Gleitz, M., Dieckmann, G.S., 1999. Biogeochemistry of
antarctic sea ice: a case study on platelet ice layers at Drescher
Inlet, Weddell Sea. Marine Ecology. Progress Series 177, 1–13.
Koroleff, F., 1969. Direct determination of ammonia in natural
waters as indophenol blue. ICES, C.M.1969/C: 9 Hydr. Comm.
Koroleff, F., 1976. Determination of ammonia. In: K. Grasshoff, K.,
Editor, 1976. Methods of sea water analysis, Verlag Chemie,
RFA, Weinheim, pp. 126–133.
Leventer, A., 2003. Particulate flux from sea ice in polar waters. In:
Thomas, D.N., Dieckmann, G.S. (Eds.), Sea Ice, An Introduc-
tion to Its Physics, Chemistry, Biology and Geology. Blackwell
Science, Oxford, pp. 303–332.
Matsuda, O., Ishikawa, S., Kawaguchi, K., 1990. Seasonal variation
of particulate organic matter under the Antarctic fast ice and its
importance to benthic life. In: Kerry, K.R., Hempel, G. (Eds.),
Antarctic Ecosystems: Ecological Change and Conservation.
Springer-Verlag, Berlin, pp. 145–148.
McMinn, A., 1996. Preliminary investigation of the contribution of
fast-ice algae to the spring phytoplankton bloom in Ellis Fjord,
eastern Antarctica. Polar Biology 16, 301–307.
McMinn, A., Ashworth, C., Ryan, K.G., 2000. In situ net primary
productivity of an Antarctic fast ice bottom algal community.
Aquatic Microbial Ecology 21, 177–185.
Medlin, L.K., Priddle, J., 1990. Polar marine diatoms. British
Antarctic Survey, Cambridge, University Press, Cambridge,
214 pp.
Neveux, J., Lantoine, F., 1993. Spectrofluorometric assay of
chlorophylls and phaeopigments using the least squares
approximation technique. Deep-Sea Research 40, 1747–1765.
Palmisano, A.C., Sullivan, C.W., 1983. Sea ice microbial commun-
ities (SIMCO): 1. Distribution, abundance, and primary
production of ice microalgae in McMurdo Sound, Antarctica
in 1980. Polar Biology 2, 171–177.
Palmisano, A.C., Sullivan, C.W., 1985. Pathways of photosynthetic
carbon assimilation in sea-ice microalgae from McMurdo Sound
Antartica. Limnology and Oceanography 30, 674–678.
Riaux-Gobin, C., Poulin, M., Maria, E., 2000a. Role des fortes
concentrations en diatomees epontiques dans la dissociation du
cycle de l’azote et de la silice en zone cotiere antarctique et
evolution lors de la debacle. Rapport de fin de mission a Terre
Adelie (EPONTA 99-2000), IPEV, 6 pp.
Riaux-Gobin, C., Treguer, P., Poulin, M., Vetion, G., 2000b.
Nutrients, algal biomass and communities in land-fast ice and
seawater off Adelie Land (Antarctica). Antarctic Science 12,
160–171.
Riaux-Gobin, C., Poulin, M., Prodon, R., Treguer, P., 2003. Land-
fast ice microalgal and phytoplanktonic communities (Adelie
Land, Antarctica) in relation to environmental factors during ice
break-up. Antarctic Science 15 (3), 354–364.
Stewart, F.J., Fritsen, C.H., 2004. Bacteria–algae relationships in
Antarctica sea ice. Antarctic Science 16, 143–156.
Sullivan, C., Palmisano, A.C., Kottmeier, S.T., Moe, R., 1982.
Development of the sea ice microbial community in McMurdo
Sound. Antarctic Journal of the United States 17, 155–157.
Thomas, D.N., Kennedy, H., Kattner, G., Gerdes, D., Gough, C.,
Dieckmann, G.S., 2001. Biochemistry of platelet ice: its
influence on particle flux under fast ice in the Weddell Sea,
Antarctica. Polar Biology 24, 486–496.
Thomas, D.N., Papadimitriou, S., 2003. Biogeochemistry of sea ice.
In: Thomas, D.N., Dieckmann, G.S. (Eds.), Sea Ice, An
Introduction to Its Physics, Chemistry, Biology and Geology.
Blackwell Science, Oxford, pp. 267–302.
Treguer, P., Le Corre, P., 1975. Manuel d’analyses automatiques
des sels nutritifs dans l’eau de mer. Utilisation de l’Auto-
Analyzer II Technicon. Universite Bretagne Occidentale, Brest.
150 pp. (Unpublished).


