
Strictly Private and Confidential
NYSE/LSE: KOS
June 2018
InvestorPresentation

1
DisclaimerForward-Looking Statements
This presentation contains forward-looking statements within the meaning of Section 27A of the Securities Act of 1933 and Section 21E of the SecuritiesExchange Act of 1934. All statements, other than statements of historical facts, included in this presentation that address activities, events or developmentsthat Kosmos Energy Ltd. (“Kosmos” or the “Company”) expects, believes or anticipates will or may occur in the future are forward-looking statements.Without limiting the generality of the foregoing, forward-looking statements contained in this presentation specifically include the expectations ofmanagement regarding plans, strategies, objectives, anticipated financial and operating results of the Company, including as to estimated oil and gas in placeand recoverability of the oil and gas, estimated reserves and drilling locations, capital expenditures, typical well results and well profiles and production andoperating expenses guidance included in the presentation. The Company’s estimates and forward-looking statements are mainly based on its currentexpectations and estimates of future events and trends, which affect or may affect its businesses and operations. Although the Company believes that theseestimates and forward-looking statements are based upon reasonable assumptions, they are subject to several risks and uncertainties and are made in lightof information currently available to the Company. When used in this presentation, the words “anticipate,” “believe,” “intend,” “expect,” “plan,” “will” orother similar words are intended to identify forward-looking statements. Such statements are subject to a number of assumptions, risks and uncertainties,many of which are beyond the control of the Company, which may cause actual results to differ materially from those implied or expressed by the forward-looking statements. Further information on such assumptions, risks and uncertainties is available in the Company’s Securities and Exchange Commission(“SEC”) filings. The Company’s SEC filings are available on the Company’s website at www.kosmosenergy.com. Kosmos undertakes no obligation and doesnot intend to update or correct these forward-looking statements to reflect events or circumstances occurring after the date of this presentation, whether asa result of new information, future events or otherwise, except as required by applicable law. You are cautioned not to place undue reliance on theseforward-looking statements, which speak only as of the date of this presentation. All forward-looking statements are qualified in their entirety by thiscautionary statement.
Cautionary Statements regarding Oil and Gas Quantities
The SEC permits oil and gas companies, in their filings with the SEC, to disclose only proved, probable and possible reserves that meet the SEC’s definitionsfor such terms, and price and cost sensitivities for such reserves, and prohibits disclosure of resources that do not constitute such reserves. The Companyuses terms in this presentation, such as “discovered resources,” “potential,” “significant resource upside,” “resource,” “net resources,” “recoverableresources,” “discovered resource,” “world-class discovered resource,” “significant defined resource,” “gross unrisked resource potential,” “defined growthresources,” “recovery potential” and similar terms or other descriptions of volumes of reserves potentially recoverable that the SEC’s guidelines strictlyprohibit the Company from including in filings with the SEC. These estimates are by their nature more speculative than estimates of proved, probable andpossible reserves and accordingly are subject to substantially greater risk of being actually realized. Investors are urged to consider closely the disclosuresand risk factors in the Company’s SEC filings, available on the Company’s website at www.kosmosenergy.com.
Potential drilling locations and resource potential estimates have not been risked by the Company. Actual locations drilled and quantities that may beultimately recovered from the Company’s interest may differ substantially from these estimates. There is no commitment by the Company to drill all of thedrilling locations that have been attributed these quantities. Factors affecting ultimate recovery include the scope of the Company’s ongoing drilling program,which will be directly affected by the availability of capital, drilling and production costs, availability of drilling and completion services and equipment,drilling results, agreement terminations, regulatory approval and actual drilling results, including geological and mechanical factors affecting recovery rates.Estimates of reserves and resource potential may change significantly as development of the Company’s oil and gas assets provides additional data.

2
Kosmos is positioned for the upturn: well-capitalized, pure-play deepwater company with growing production, a pipeline of development opportunities, and a balanced exploration portfolio
Kosmos – The Case for Investment
• To meet growing energy demand, the world needs both deepwater and shale– The shale and deepwater companies with the best portfolios and the best execution will be successful– Premium acreage positions and terms, coupled with low costs drive attractive returns
• Lower costs and less competition are making the deepwater more attractive– Majors returning to frontier deepwater exploration– Industry consolidation, attrition, or a re-focus on shale creates significant opportunities for leading independent
explorers like Kosmos to play with and alongside the majors– Recent success in opening world-class basins (e.g. Mauritania/Senegal, Guyana), fewer players, bigger fields
(e.g. Liza, Tortue, Yakaar)– Continuing cost deflation is reducing capital intensity, facilitating business execution and maximizing returns
• Kosmos’ counter-cyclical strategy has created competitive advantage– Leveraged the downturn to our advantage– Consistently built a sustainable production, development, and exploration portfolio through the cycle– Remain focused on core strengths as a pure-play, deepwater company Consistent exploration strategy Innovative development solutions Strategic partnerships
• Kosmos has a balanced portfolio with growth from production, development and exploration assets

3
Leveraged the downturn to our advantage, built a balanced production, development and exploration portfolio
Kosmos: Stronger Portfolio, More Balanced Growth
1. High-margin production assets delivering growth– ~$40 operating cash margin at $60 Brent in 20181
2. Low-cost, competitively positioned Tortue gas project provides next phase of growth– 15 Tcf resource base supports development of 10 mmtpa scheme
– On plateau, 10 mmtpa scheme would be expected to generate substantial, steady long-term annual cash flow
– $533mm BP development carry funds substantial portion of Kosmos share of initial phase (2.5 mmtpa), establishing infrastructure for full development and providing early cash flow
– 20 Tcf discovered resource base in Yakaar/Teranga adds potential for second hub
3. Sustainable exploration program with balance of proven, emerging, and frontier basins offering multiple catalysts in 2018, 2019, and beyond (2-3 wells/year)
– Proven: Short cycle tie-back (Equatorial Guinea)
– Emerging: Prove up plays with follow on opportunity (Mauritania, Senegal, Suriname)
– Frontier: Capture significant position in petroleum system to fully explore (Sao Tome & Principe, Cote d’Ivoire)
4. Strong balance sheet supports strategy execution– Low leverage of less than 2.0x net debt / EBITDAX
1. Operating cash margin defined as Brent price less opex and cash taxes for Ghana and Equatorial Guinea

4
0
10,000
20,000
30,000
40,000
50,000
60,000
70,000
Total Kosmos Energy ExxonMobil Tullow Oil BP Shell Woodside Anadarko Eni Repsol Chevron Hess Corporation CNOOC Ltd Statoil PETRONAS Cairn Energy BHP Billiton Apache Noble Energy ONGC Marathon Oil DEA INPEX Corporation Petrobras Maersk Oil Premier Oil
Kosmos is ideally positioned as a pure deepwater company with a substantial portfolio of prospectivity to take advantage of lower costs and reduced competition
Deepwater Now More Attractive
1. Source: Wood Mackenzie. Data excludes Brazil. Kosmos acreage data provided by Kosmos and includes Ghana, Equatorial Guinea, Mauritania, Senegal, Suriname, Sao Tome & Principe, and Cote d’Ivoire2. Source: Rystad Energy
Net Active Exploration AcreageIn West Africa & Northeast South America1
Sq.
Km
.
Major Independent
100
95
90
85
80
75
70
Cap
ital C
osts
North American Shale vs. Offshore Capital Costs(Indexed to 2014)2
2014 2015 2016 2017 2018 2019 2020
Year of Contract Execution
North America ShaleDrilling & Completion
Capex
Offshore Capex

5
$35
$40
$45
$50
Trion Lapa Eagle Ford Iara NW Shelf Itapu Stone s San Juan Basin Lancaste r Carcara DJ Basin SNE Lucius CBP Johan Sverdrup Buzios Viking Delaware Midland Buzzard Jubilee Liza
High-quality deepwater assets can compete for capital with the best of shale; execution efficiency and quality of acreage matter to both
The Best Deepwater & Shale Companies Will Win
Jubilee
Breakeven Price of Top Quartile Assets
Deepwater Shale
Bre
akev
en P
rice1
1. Source: RS Energy Group, PV-10 Breakeven at 20:1 WTI:HH Ratio (RS Energy Group) 2. Source: Rystad EnergyNote: Shale plays include: Eagle Ford, NW Shelf, San Juan Basin, DJ Basin, CBP, Viking, and Permian (Delaware and Midland)
2017
Deepwater
Shale
Rest of World
Global Oil Supply2
12%
7%
6
Strong Reserve BaseDelivering growing, high-margin production

7
0
50
100
150
200
250
2015 2016 2017
Jubilee and TEN fields provide foundation of high-margin cash flow
Ghana: Big Fields Get Bigger
• High-margin barrels– Growing production into improving macro environment– Declining opex/bbl supports margin expansion– ~$40/bbl operating margin at $60/bbl Brent in 2018
• Strong reserve replacement– Averaged over 140% last 3 years
• Future development – Greater Jubilee Full Field Development Plan approved– ITLOS concluded with no impact to TEN– Drilling recommenced to grow production at TEN and
Jubilee– Turret Remediation Plan Turret stabilization: ~4 week shutdown of oil
production underway Rotation to optimal heading: around year-end 2018
with minimal impact to 2018 production
Jubilee & TEN Net Production1
MB
opd
Ghana 1P Reserve Replacement %
RR
R %
Jubilee TEN
1. Represents net entitlement volumesNote: Operating margin defined as Brent oil price less operating expense and taxes
0
5
10
15
20
25
30
35
2016 2017 2018E

8
Acquisition of high-margin production at Ceiba/Okume and capture of exploration blocks provides multiple avenues to create value with rapid payback…already exceeding expectations
Equatorial Guinea: A Good Deal Gets Better
@ Acquisition Current
2018EGrossProduction(Mbopd)
@ Acquisition Current
~$60
Oil Price1
(Brent, $/bbl)
@ Acquisition Current
Payback2
(Years)
Value Creation
+
+
3743
~$55
~3<2
• Strategic Rationale– Diversifies existing production base– Accesses proven oil basin – Highly-economic tie-back opportunities provide potential
to shorten cycle times for production growth
• Highly accretive deal with accelerated payback– Purchased at < 2x EBITDAX vs. trading multiple of ~7x– High-margin barrels (~$40/bbl at $60/bbl Brent in 2018)
create significant free cash flow < 2 year payback expected
• Innovative partnership – Leverages Kosmos exploration/subsurface capabilities
with Trident’s production/operating expertise
1. Source: Bloomberg, price is 2018 strip at transaction announcement.2. Payback of initial $231MM net closing consideration; approximate 3 year payback based on $55 Brent, less than 2 year current payback based on $60 Brent3. Includes opex, taxes, and capex

9
01020304050607080
Activities focused on maximizing existing resource value and finding new resources, with 2018 work program enabling 2019 tie-back focused drilling
Equatorial Guinea: 2018 Work Program
Maximizing Value of Existing Resource1
1H:18 2H:18 1H:19 2H:19Existing well optimization
MaximizingValue
Of Existing Resource Phase 1 ESP installation2
Acquire 3D Seismic overBlocks W, S, EG-21
Finding New Resource Infield / Near Field: Short
Cycle Tie Backs
Enhanced Production
Extended Field Life
Waterflood Optimization
Process acquired 3D seismic
Large, standalone Prospects
Finding New Resource
BLOCKW EG-21
3D seismicsurvey
CeibaOkume
BLOCKS
Previous Operator Kosmos / Trident With Exploration Success
Further Value EnhancementDecreased ARO via:• Optimized work scope• Cost deflation• Lower NPV from higher
discounting due to field life extension
Tie Back Potential
2020+
1. Illustrative production profile2. ESP installations expected to generate > 100% rate of return
EG-24
10
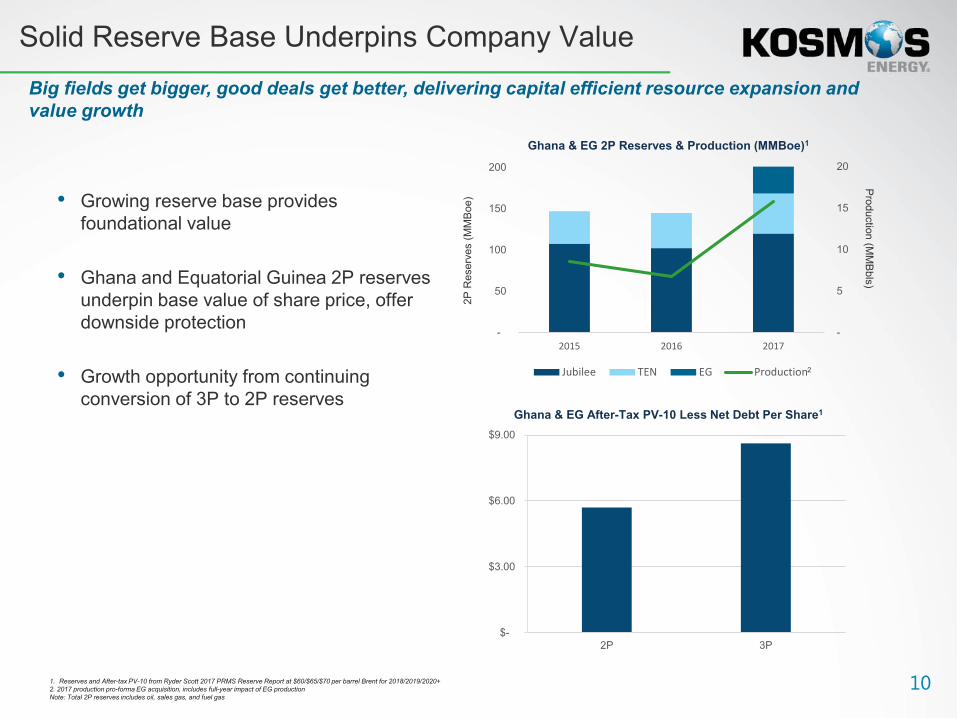
• Growing reserve base provides foundational value
• Ghana and Equatorial Guinea 2P reserves underpin base value of share price, offer downside protection
• Growth opportunity from continuing conversion of 3P to 2P reserves
Big fields get bigger, good deals get better, delivering capital efficient resource expansion and value growth
Solid Reserve Base Underpins Company Value
Ghana & EG After-Tax PV-10 Less Net Debt Per Share1
$-
$3.00
$6.00
$9.00
2P 3P
Ghana & EG 2P Reserves & Production (MMBoe)1
-
5
10
15
20
-
50
100
150
200
2015 2016 2017
Jubilee TEN EG Production2
2P R
eser
ves
(MM
Boe
)
Production (M
MB
bls)
1. Reserves and After-tax PV-10 from Ryder Scott 2017 PRMS Reserve Report at $60/$65/$70 per barrel Brent for 2018/2019/2020+2. 2017 production pro-forma EG acquisition, includes full-year impact of EG productionNote: Total 2P reserves includes oil, sales gas, and fuel gas

11
Pipeline of World-Scale DevelopmentsDelivering sustainable cash flow for the long term

12
• 15 Tcf gas resource– World scale gas field underpins leading LNG
project– 10 mmtpa project would be expected to generate
cash flow of ~$350 MM/yr net to Kosmos over ~20+ year plateau
• Innovative development solution– BP-led phased development expected to FID
around end 2018 and deliver first gas in late 2021– 2.5 mmtpa first phase development establishes
infrastructure for future expansion– First phase delivers early cash flow and
substantially funded by BP carry
• Cost competitive with Atlantic Margin LNG– First phase using cost competitive, industry-led
liquefaction solution– High-quality reservoir and resource density leads
to fewer wells and more efficient development– Future expansion planned, providing economies
of scale
Kosmos-BP partnership aligned to deliver low cost, highly competitive gas project on accelerated pace with room for expansion
Greater Tortue: World-Scale, Fast-Track Gas Project
$-
$2
$4
$6
$8
$10
$12
$14
$16
$18
Australia / Asia East Africa North America Russia West Africa
Lowest Decile on LNG Cost Curve1
Tortue
Tortue HOUSTON
1. Source: Goldman Sachs

13
BP project team has made significant progress towards FID
Greater Tortue: Cost Competitive LNG
• BP plan for 2.5 mmtpa first phase selected – Innovative near-shore solution provides cost-competitive LNG and establishes infrastructure
for future expansion
• Approval of ICA provides clear path to FID around year end 2018 and first gas late 2021– Front End Engineering Design underway
– Key subcontracts awarded
– LNG marketing underway

14
Sustainable and Balanced Exploration PortfolioDelivering Long-Term Growth

151. Source: Wood Mackenzie2. Source: Richmond Energy Partners, data include frontier, deepwater exploration wells drilled from 2013-2017
0%
5%
10%
15%
20%
25%
0
4
8
12
16
Shell Total Anadarko BP Tullow Oil WoodsidePetroleum
Repsol Petrobras Cairn Energy Statoil ExxonMobil Kosmos Energy
Frontier Deepwater Exploration Wells, Discoveries, Success Rates 2013-20172
Com
mercial S
uccess Rate
Wel
ls D
rille
d
• Strategy– Focus on south Atlantic margin, Cretaceous,
deepwater petroleum systems– Concentrated portfolio, rifle shot exploration drilling
• Execution– Contrarian, technical ideas and countercyclical
business initiatives provide first mover advantage– Investment through low price cycle takes advantage of
better access opportunity and deflated costs– Large, operated positions in selected basins provide
significant potential and enable exploration risk to be managed
• Results− Concentrated, balanced, exploration portfolio with a
mix of proven, emerging and frontier basins − Top quartile historical record of success in opening
frontier basins (1 in 5 commercial discovery rate)− Exploration drilling success and active new ventures
ensure a sustainable, exploration drilling program− 2-3 wells each year going forward (e.g. 2018 Suriname,
2019 Mauritania/Senegal, Sao Tome, and Equatorial Guinea)
Top Quartile Exploration Performance – Strategy and Execution
Kosmos’ exploration strategy is being executed with discipline, creating a balanced portfolio which has delivered top quartile success and provides a sustainable drilling program going forward
0
100
200
300
400
500
-
10,000
20,000
30,000
2015 2016 2017
Offshore E
xploration Wells
Sq.
Km
.
Kosmos vs. Industry Exploration Activity
Commercial Success Rate
CommercialDiscoveries
Gross ExplorationWells
Kos
mos
Kosmos Gross Acreage Additions
Kosmos Seismic Acquired
Industry Offshore Exploration Wells1
Companies

16
Proven Basin Exploration – Equatorial GuineaNearfield exploration in the proven, but underexplored Rio Muni basin includes lower risk, short-cycle time, high-value, tie-back exploration opportunities to the Ceiba /Okume facilities
• Underexplored opportunity involves three primary Cretaceous fairways
– Infield/nearfield Campanian upper slope/channel play fairway
and deeper, Santonian and Albian potential underlying the producing fields
Multiple leads/prospects identified
– Step-out Potential mid-late Cretaceous mid-slope
channel systems downdip and along trend
– Standalone Outboard lower slope play fairways
• Plan to acquire new 3D seismic this year ahead of high grading opportunity set for drilling starting in late 2019
BLOCK WEG-21
Regional 3Dseismic survey
Ceiba OkumeBLOCK S
Standalone
Step-outexploration
Infield / Near-field
EG-24

17
Emerging Basin Exploration – Mauritania / Senegal
• Exploration to date– Two phases of exploration completed 7 prospects tested with a success rate of ~60% Discovered 40 Tcf of gas and derisked/delineated 40 Tcf at a
cost of $0.20/boe
– First phase – Inboard Central Anticline Trend 3 discoveries, 100% success rate, Tortue, Marsouin, and Teranga Tortue discovery targeting first gas late 2021
– Second phase – Outboard Basin Floor Fan Fairway 4 prospects tested, including 33% success rate in southern
Mauritania/northern Senegal gas trend, and 0 for 1 in northern Mauritania oil trend
Yaakar Field gas discovery (largest find in the world in 2017), together with Teranga creates potential additional gas hub
Gained proprietary technical knowledge providing key petroleum system insights and competitive advantage for next phase of exploration
• Future exploration of this emerging basin– 2018 Drilling pause to integrate well results and rebuild prospect inventory
– 2019 and beyond Design and execute program to target oil in northern Mauritania (both
inboard and outboard) Delineate gas resources in southern Mauritania /northern Senegal for
additional gas hubs
Giant gas resource base found at best-in-class metrics with significant remaining potential
MAURITANIA
SENEGAL
Yakaar
SNE OILAlbian/CT
Gas Discovery
Liquids or Gas Lead / Prospect
Gas Prospect
Future 3D Seismic
Explore for oil
Explore / appraise for
gas
Hippocampe
Lamantin
Teranga
Tortue
Requin Tigre
Marsouin

18
Extension of emerging oil petroleum system recently opened in Guyana, provides up to five independent plays and multi-billion barrel potential, with drilling to commence 2Q’18
Emerging Basin Exploration – Suriname
• Multi-billion barrel prospectivity to be tested across 5 independent Cretaceous plays
• In 2018, testing two plays:
– Anapai – 700 MMBbl gross unrisked early Cretaceous structural / stratigraphic trap in Block 45
– Pontoenoe/Aurora/Apetina – 500+ MMBbl gross unrisked late Cretaceous Liza-type stratigraphic play in Block 42
• Follow-on exploration drilling to test other independent plays in 2019 – 2021
Tertiary
Albian
UpperAlbianSands
Mid AlbianSource
Anapai
UpperCretaceous
TertiaryLiza-1
ACT Source
AuroraTrendApetina
Trend
Turbot
GU
YAN
A
SUR
INA
ME
Upper Cretaceous ProspectsLower Cretaceous ProspectsUpper Cretaceous SourceLower Cretaceous Source
Payara-1
Liza-1Turbot-1
BLOCK 42 AnapaiProspect
BLOCK 45
AuroraTrend
ApetinaTrend
Araku-1
PontoenoeProspect
Pontoenoe
19
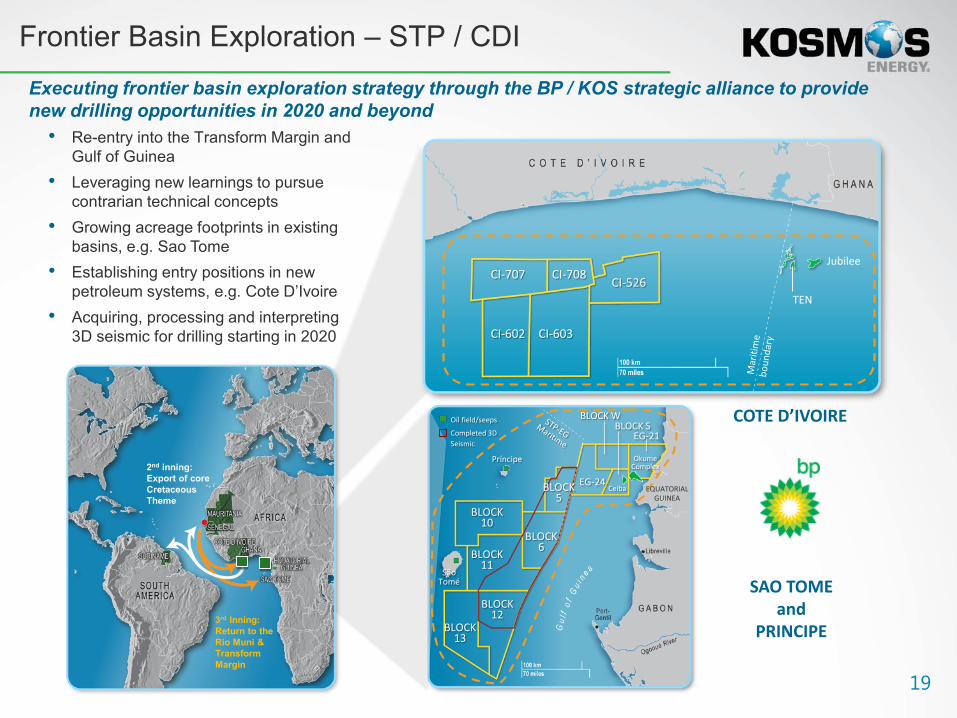
Executing frontier basin exploration strategy through the BP / KOS strategic alliance to provide new drilling opportunities in 2020 and beyond
SAO TOMEand
PRINCIPE
COTE D’IVOIRE
Frontier Basin Exploration – STP / CDI
• Re-entry into the Transform Margin and Gulf of Guinea
• Leveraging new learnings to pursue contrarian technical concepts
• Growing acreage footprints in existing basins, e.g. Sao Tome
• Establishing entry positions in new petroleum systems, e.g. Cote D’Ivoire
• Acquiring, processing and interpreting 3D seismic for drilling starting in 2020
CI-526CI-708CI-707
CI-603CI-602
TEN
Jubilee
BLOCK13
BLOCK11
BLOCK10
BLOCK6
BLOCK5
Príncipe
BLOCK WBLOCK S
EG-21
OkumeComplex
Ceiba
Oil field/seeps
Completed 3D Seismic
SãoTomé
EQUATORIALGUINEA
2nd inning:Export of core Cretaceous Theme
3rd Inning:Return to the Rio Muni & Transform Margin
BLOCK12
EG-24

20
StrongFinancialPlatform

21
0.0x
1.0x
2.0x
3.0x
4.0x
2011 2012 2013 2014 2015 2016 2017
$40
$60
$80
$100
$120
$0.0
$0.5
$1.0
$1.5
$2.0
2010 2011 2012 2013 2014 2015 2016 2017
Prudent balance sheet management has enabled strategy execution
Financial Strength To Execute Through Cycle
1. As of December 31, 2017 and pro-forma RBL refinancing2. Calculated using pro forma EBITDAX ($695 MM), including our 50% interest in KTEGI for full-year 2017, for the purposes of calculation of our covenants under our RBL facility.
Strategy targets self-funded business plan – Strong operating cash flow from producing assets
– Liquidity : $1.3 bn post refinancing of RBL1
Disciplined capital allocation– Balance between production, development, exploration
– Leverage partner funding
Debt maturities actively managed – No debt maturity until 2021
– RBL refinanced until 2025
– RCF (undrawn) expect to refinance prior to maturity in 2018
Low leverage– Exited 2017 with significant headroom on facilities and
covenants2
Disciplined hedging program– Received cash settled hedges of over $450 million since
2015
0x
5x
10x
15x
20x
2011 2012 2013 2014 2015 2016 2017
EBITDAX / Interest Expense covenant > 2.25x
Net Debt / EBITDAX covenant < 3.5x
Liquidity$Bn
Brent Price$/bbl

22
2018 Guidance
1. Represents 100% interest in our equity method investment Kosmos Trident International Petroleum Inc (KTIPI). Kosmos owns a 50% interest in KTIPI which holds an 85% participating interest in the Ceiba Field and Okume Complex through its wholly-owned subsidiary, Kosmos-Trident Equatorial Guinea Inc. ("KTEGI"), representing a 40.375% net indirect interest to Kosmos.
2. Entitlement share of production net to KTIPI in which Kosmos holds a 50% interest
FY FY2018 2018
Kosmos Equatorial Guinea - Equity Method Investment1
Jubilee 7 Gross Production (Bopd) 43,000TEN 4Ghana 11 Cargos2 10
Avg. Cargo Size (MBbls) ~975 Avg. Cargo Size (MBbls) ~1,000
Opex ($/bbl) $14.00 - $17.00 Opex ($/bbl) $13.00- $15.00
DD&A ($/bbl) $24.00 - $26.00 DD&A ($/bbl) $24.00- $26.00
G&A ($MM) $100 Taxes ($/bbl) $15.00 - $17.00% Cash 65% % Cash 45%
Exploration Expense ~$30mm per quarter Capex ($MM) $5(Non Dry Hole)
Taxes ($/bbl) $3.00 - $4.00% Cash 100%
Capex ($MM) $300Ghana $110Exploration
Suriname Drilling $50Seismic $80New Ventures $50
Corporate $10

23
Kosmos: Stronger Portfolio, More Balanced GrowthA balanced production, development, and exploration portfolio with multiple sources of upside
1. High-margin production assets delivering growth− 2P reserves underpin current share price− 3P resources offers significant upside
2. Low-cost, competitively positioned Tortue gas project provides next phase of growth− Tortue Phase 1 project moving forward as planned− Tortue Full Field Development offers further upside
3. Sustainable exploration program with balance of proven, emerging, and frontier basins offering multiple catalysts in 2018, 2019, and beyond
4. Strong balance sheet enables strategy execution

Strictly Private and Confidential
Appendix

25
Kosmos Reserve Summary
Source: Kosmos Energy 2017 10-K, Ryder Scott PRMS Reserve Report as of December 31, 2017 prepared on behalf of Kosmos EnergyNote: EG 1P SEC and PRMS reserve volumes differ due to changes in price and corresponding effect of production sharing contract
Preparer: Ryder Scott Ryder Scott Ryder Scott Ryder ScottParameters: SEC PRMS PRMS PRMSReserve Case: 1P 1P 2P 3P
Brent Oil Price ($/bbl) $54.42 $60/$65/$70 $60/$65/$70 $60/$65/$70
Greater JubileeOil (MMBbls) 50.5 50.5 99.8 140.1Fuel Gas (Bcf) 11.6 11.6 14.2 14.2Sales Gas (Bcf) 0.0 0.0 106.9 184.1Total (MMBoe) 52.4 52.4 120.0 173.1
TENOil (MMBbls) 30.9 30.9 36.6 39.1Fuel Gas (Bcf) 8.8 8.8 10.6 10.6Sales Gas (Bcf) 28.4 28.4 59.7 70.3Total (MMBoe) 37.1 37.1 48.3 52.6
Total GhanaOil (MMBbls) 81.4 81.4 136.4 179.2Fuel Gas (Bcf) 20.5 20.5 24.8 24.8Sales Gas (Bcf) 28.4 28.4 166.6 254.4Total (MMBoe) 89.5 89.5 168.4 225.8
EGOil (MMBbls) 18.6 18.7 29.8 40.5Fuel Gas (Bcf) 12.6 13.2 20.2 21.7Sales Gas (Bcf) 0.0 0.0 0.0 0.0Total (MMBoe) 20.7 20.9 33.1 44.1
Total CompanyOil (MMBbls) 100.0 100.1 166.2 219.7Fuel Gas (Bcf) 33.1 33.7 45.0 46.5Sales Gas (Bcf) 28.4 28.4 166.6 254.4Total (MMBoe) 110.2 110.4 201.5 269.9
Summary Reserve Information

26
Kosmos PV-10 Summary
Source: Kosmos Energy 2017 10-K, Ryder Scott PRMS Reserve Report as of December 31, 2017 prepared on behalf of Kosmos EnergyNote: After-Tax PV-10 Less Net Debt per Share calculated using fourth quarter 2017 weighted average share count of 389.1 million shares
Preparer: Ryder Scott Ryder Scott Ryder Scott Ryder ScottParameters: SEC PRMS PRMS PRMSReserve Case: 1P 1P 2P 3P
Brent Oil Price ($/bbl) $54.42 $60/$65/$70 $60/$65/$70 $60/$65/$70
Greater JubileeFuture Gross Revenue $2,753.1 $3,434.2 $7,177.2 $10,211.1Deductions 1,752.0 1,752.0 1,842.8 1,857.1Future Net Income (FNI) 1,001.1 1,682.2 5,334.5 8,354.1
Discounted FNI @ 10% Before Taxes 705.9 1,106.5 3,041.4 4,231.8Discounted FNI @ 10% After Taxes $543.9 $771.9 $2,011.2 $2,783.0
TENFuture Gross Revenue $1,696.9 $2,112.7 $2,554.3 $2,758.0Deductions 1,223.7 1,223.7 1,337.2 1,342.0Future Net Income (FNI) 473.3 889.0 1,217.1 1,416.0
Discounted FNI @ 10% Before Taxes 405.3 668.2 842.6 934.2Discounted FNI @ 10% After Taxes $418.1 $602.6 $719.5 $779.7
Total GhanaFuture Gross Revenue $4,450.0 $5,546.9 $9,731.5 $12,969.1Deductions 2,975.7 2,975.7 3,180.0 3,199.1Future Net Income (FNI) 1,474.3 2,571.3 6,551.5 9,770.0
Discounted FNI @ 10% Before Taxes 1,111.2 1,774.7 3,883.9 5,166.0Discounted FNI @ 10% After Taxes $962.0 $1,374.5 $2,730.7 $3,562.7
EGFuture Gross Revenue $1,003.1 $1,244.9 $2,002.4 $2,726.7Deductions 768.9 802.3 973.6 1,053.3Future Net Income (FNI) 234.2 442.5 1,028.8 1,821.4
Discounted FNI @ 10% Before Taxes 768.9 802.3 973.6 1,053.3Discounted FNI @ 10% After Taxes $129.5 $235.2 $508.3 $812.0
Total CompanyFuture Gross Revenue $5,453.1 $6,791.8 $11,733.9 $15,695.7Deductions 3,744.6 3,778.0 4,153.6 4,252.3Future Net Income (FNI) 1,708.5 3,013.8 7,580.3 11,591.4
Discounted FNI @ 10% Before Taxes 1,880.1 2,577.0 4,857.5 6,219.3Discounted FNI @ 10% After Taxes $1,091.5 $1,609.7 $3,239.0 $4,374.7
Less Net Debt $1,019.7 $1,019.7 $1,019.7 $1,019.7After Tax PV-10 Less Net Debt / Share $0.18 $1.52 $5.70 $8.62
Summary PV-10 Information ($MM)


