
Killian Elementary STEAM Leaders Magnet
STRATEGIC PLAN

TABLE OF CONTENTS
CHAPTER 1 3
School Renewal Plan Signature Page 3
Assurances for School Renewal Plan 4
Stakeholders Involvement for School Strategic Plan 6
Mission, Vision, Values, and Beliefs 8
Needs Assessment Data 9
Executive Summary of Needs Assessment Data Findings 17
CHAPTER 2 20
Performance Goals and Action Plans 20
Learning 20
Character 25
Community 29
Joy 33
CHAPTER 3 37
Read to Succeed Literacy Plan 37

SCHOOL STRATEGIC PLAN SIGNATURE PAGE
SCHOOL DISTRICT: Richland School District Two
SCHOOL: Killian Elementary School
2621 Clemson Road
Columbia, SC 29229
803-699-2981 www.richland2.org/KES
STRATEGIC PLAN FOR: SY 2018-19 through SY 2022-23 (five years)
Superintendent
Dr. Baron Davis
Printed Name
Signature
Date
Principal
Stacey Franklin
Printed Name
Signature
Date
Chairperson, District Board of Trustees
Craig Plank
Printed Name
Signature
Date
Chairperson, School Improvement Council
Phone Website
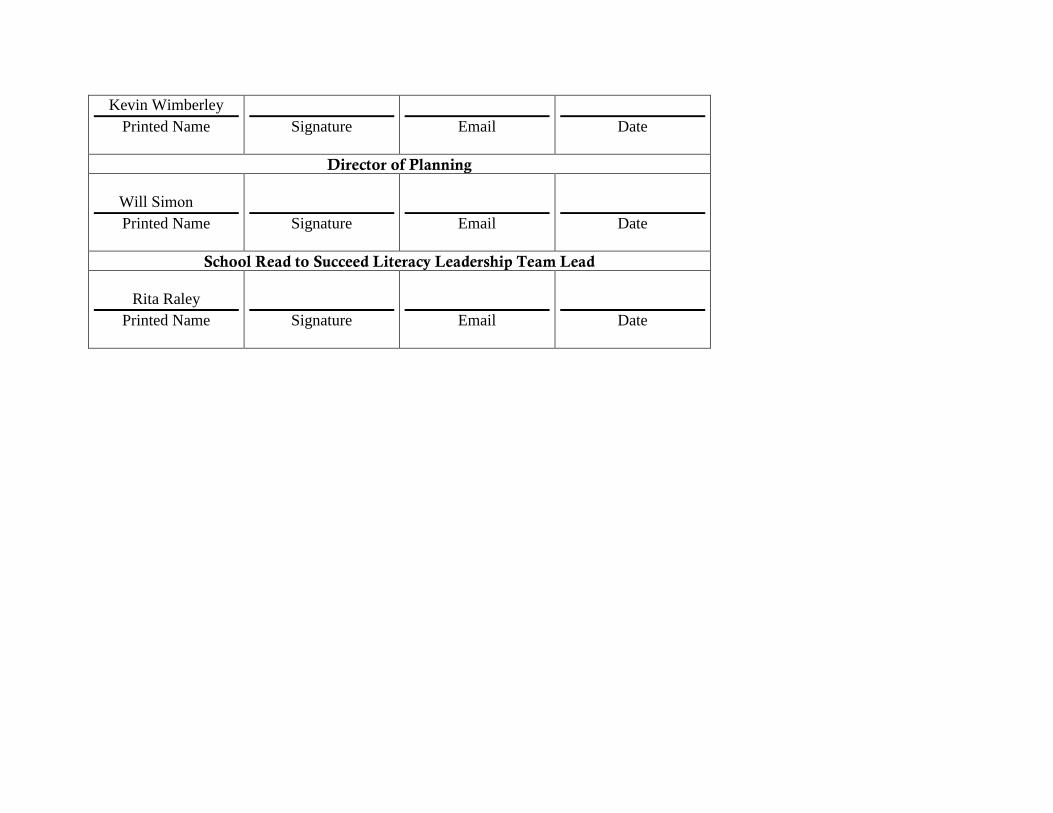
Kevin Wimberley
Printed Name Signature Email Date
Director of Planning
Will Simon
Printed Name Signature Email Date
School Read to Succeed Literacy Leadership Team Lead
Rita Raley
Printed Name Signature Email Date

ASSURANCES FOR SCHOOL PLANS
ACT 135 ASSURANCES
Assurances checked and signed by the district superintendent and the principal, attest that the school/district complies with all
applicable ACT 135 requirements.
Academic Assistance, PreK–3: The school/district makes special efforts to assist children in PreK–3 who demonstrate a need for extra or
alternative instructional attention (e.g., after-school homework help centers, individual tutoring, and group remediation).
Academic Assistance, Grades 4–12: The school/district makes special efforts to assist children in grades 4–12 who demonstrate a need
for extra or alternative instructional attention (e.g., after-school homework help centers, individual tutoring, and group remediation).
Parent Involvement: The school/district encourages and assists parents in becoming more involved in their children‘s education. Some
examples of parent involvement initiatives include making special efforts to meet with parents at times more convenient for them;
providing parents with their child’s individual test results and an interpretation of the results; providing parents with information on the
district’s curriculum and assessment program; providing frequent, two-way communication between home and school; providing parents
an opportunity to participate on decision making groups; designating space in schools for parents to access educational resource materials;
including parent involvement expectations as part of the principal’s and superintendent’s evaluations; and providing parents with
information pertaining to expectations held for them by the school system, such as ensuring attendance and punctuality of their children.
Staff Development: The school/district provides staff development training for teachers and administrators in the teaching techniques and
strategies needed to implement the school/district plan for the improvement of student academic performance. The staff development
program reflects requirements of Act 135, the EAA, and the National Staff Development Council‘s revised Standards for Staff
Development.
Technology: The school/district integrates technology into professional development, curriculum development, and classroom instruction
to improve teaching and learning.
Innovation: The school/district uses innovation funds for innovative activities to improve student learning and accelerate the performance
of all students.
Collaboration: The school/district (regardless of the grades served) collaborates with health and human services agencies (e.g., county
health departments, social services departments, mental health departments, First Steps, and the family court system).
X
X
X
X
X
X
X

Developmental Screening: The school/district ensures that the young child receives all services necessary for growth and development.
Instruments are used to assess physical, social, emotional, linguistic, and cognitive developmental levels. This program normally is
appropriate at primary and elementary schools, although screening efforts could take place at any location.
ASSURANCES FOR SCHOOL PLANS (Continued) Half-Day Child Development: The school/district provides half-day child development programs for four-year-olds (some districts fund
full-day programs). The programs usually function at primary and elementary schools, however, they may be housed at locations with
other grade levels or completely separate from schools.
Developmentally Appropriate Curriculum for PreK–3: The school/district ensures that the scope and sequence of the curriculum for
PreK–3 are appropriate for the maturation levels of students. Instructional practices accommodate individual differences in maturation
level and take into account the student's social and cultural context.
Parenting and Family Literacy: The school provides a four component program that integrates all of the following activities: interactive
literacy activities between parents and their children (Interactive Literacy Activities); training for parents regarding how to be the primary
teachers for their children and how to be full partners in the education of their children (parenting skills for adults, parent education);
parent literacy training that leads to economic self-sufficiency (adult education); and an age-appropriate education to prepare children for
success in school and life experiences (early childhood education). Family Literacy is not grade specific, but is generally most appropriate
for parents of children at the primary and elementary school levels and below as well as for secondary school students who are parents.
Family Literacy program goals are to strengthen parental involvement in the learning process of preschool children ages birth through five
years; to promote school readiness of preschool children; to offer parents special opportunities to improve their literacy skills and
education; to provide parents a chance to recover from dropping out of school; and to identify potential developmental delays in preschool
children by offering developmental screening.
Recruitment: The district makes special and intensive efforts to recruit and give priority to serving those parents or guardians of
children, age’s birth through five years, who are considered at-risk of school failure. “At-risk children are defined as those whose school
readiness is jeopardized by any of, but not limited to, the following personal or family situation(s): parent without a high school graduation
or equivalency, poverty, limited English proficiency, significant developmental delays, instability or inadequate basic capacity within the
home and/or family, poor health (physical, mental, emotional) and/or child abuse and neglect.
Coordination of Act 135 Initiatives with Other Federal, State, and District Programs: The school/district ensures as much program
effectiveness as possible by developing a district wide/school wide coordinated effort among all programs and funding. Act 135 initiatives
are coordinated with programs such as Head Start, First Steps, Title I, and programs for students with disabilities.
X
X
X
X
X
X

Dr. Baron Davis
Superintendent’s Printed Name Superintendent’s Signature Date
(for district and school plans)
Stacey M. Franklin
Principal’s Printed Name Principal’s Signature Date

STAKEHOLDER INVOLVEMENT
The following persons were involved in the development of the five (5)-year strategic plan.
1. PRINCIPAL Stacey M. Franklin
2. TEACHER Felecia Watson
3. PARENT/GUARDIAN Delcia & Bobby Gamble
4. COMMUNITY MEMBER Toni Norton
5. SCHOOL IMPROVEMENT COUNCIL Kevin Wimberly
6. OTHERS* (May include school board members, administrators, School Improvement Council members, students, PTO
members, agency representatives, university partners, etc.)
POSITION NAME
University of South Carolina Professor Dr. Stephen Thompson Magnet Lead Nancy Diggs
CiCi’s Owner/Operator Mitch Uehling
Team Leader Karly Stevens
Team Leader Courtney Rector
Team Leader Felecia Watson
Team Leader Wendy Harris Young
Team Leader Tracy Mitchell
Team Leader Kendra Waring
Assistant Principal Carrie Murray
*REMINDER: If state or federal grant applications require representation by other stakeholder groups, it is appropriate to include
additional stakeholders to meet those requirements and to ensure that the plans are aligned.
School's Purpose
Newly opened in 1998, our vision at Killian is that we will provide every student who enters our doors the opportunity for academic excellence.
Through innovative programs, quality instruction, and high expectations as it relates to teaching and learning, we will provide our students with
the skills necessary to become productive citizens in society.
Our school has constantly experienced great change as a result of the mobility of our surrounding neighborhoods. Student and family
demographics have changed significantly as the school has become more racially isolated and socioeconomic levels have declined. Low to
moderate income houses are springing up which attract many families with young, school-aged children. An accompanying increase in the need
for additional services to meet our families needs, including special education, parent education issues, and social services, has been apparent.
Our Mission:
Killian Elementary School, with the support of its parents and community, dedicates itself to providing optimal instruction and a challenging
curriculum, in a safe, nurturing environment, that will prepare students to be productive citizens in a global society.
Vision:
To prepare our students to become responsible 21st Century leaders and citizens in a global society.
Beliefs:
Students:
We believe all students are capable of learning, especially when provided authentic and engaging opportunities.
Teachers:
We believe teachers facilitate student learning by creating positive and effective classroom communities and by collaborating with colleagues and
parents.
Parents
We believe parental involvement is a significant component to students' academic performance and success.
Community:
We believe developing partnerships with local businesses, organizations, and the community is important to our school's success.
Learning:

We believe 21st Century learning is best achieved in a nurturing, authentic, and collaborative environment. Administration:
We believe administrators' support is necessary to empower faculty, staff, parents, and the community to prepare 21st Century learners.
Killian I Can Statements
1) Lead by example
2) Do my personal best
3) Consider other’s needs
4) Be a team player

NEEDS ASSESSMENT DATA
Provide the link to your district’s most recent School Report Card:
https://ed.sc.gov/data/report-cards/state-report-cards/2017/view/?y=2017&t=E&d=4002&s=086
Directions: Provide additional district’s needs assessment data including both formative and summative assessments used to gauge
student learning. (Charts, graphs, or other formats of data may be used.)
Formative Assessment Data
Measures of Academic Progress (MAP)
Table 1 shows the percent of students who met their reading and math growth target for the 2014-2015 through 2016-2017 school
years by subgroup.
Table 1: Percent of Students Who Met Their Growth Target on MAP by Subject and Subgroup
Subject and Subgroups 2014-2015 2015-2016 2016-2017
Count Percent Count Percent Count Percent
Mathematics
All Students 413 42.9% 395 33.7% 447 44.7%
Ethnicity
American Indian or Alaskan Native -- -- 1 -- 2 --
Asian 1 -- 1 -- 1 --
Black or African American 346 41.6% 333 32.4% 374 45.5%
Hispanic or Latino 32 53.1% 24 29.2% 27 48.1%
Native Hawaiian or Other Pacific Islander 1 -- -- -- 1 --
Two or More Races 13 38.5% 17 52.9% 17 35.3%
White 20 50.0% 19 47.4% 25 36.0%
Gender

Female 213 44.1% 201 32.3% 236 40.7%
Male 200 41.5% 194 35.1% 211 49.3%
Reading
All Students 411 48.4% 393 43.3% 445 49.2%
Ethnicity
American Indian or Alaskan Native -- -- 1 -- 2 --
Asian 1 -- 1 -- 1 --
Black or African American 343 49.0% 330 40.3% 372 48.9%
Hispanic or Latino 32 37.5% 25 48.0% 27 55.6%
Native Hawaiian or Other Pacific Islander 1 -- -- -- 1 --
Two or More Races 14 50.0% 17 64.7% 17 52.9%
White 20 60.0% 19 63.2% 25 44.0%
Gender
Female 212 45.8% 199 48.2% 235 50.2%
Male 199 51.3% 194 38.1% 210 48.1%
-- Data not reported for subgroups less than 10 students.

Summative Assessment Data
South Carolina Kindergarten Readiness Assessment
Table 2 shows the percent of students demonstrating overall readiness and readiness in each of the domains on the 2016-2017 South
Carolina Kindergarten Readiness Assessment (KRA) by subgroup.
Table 2: Percent of students demonstrating readiness by subgroup
Subgroup Count
Overall
Performanc
e
Language &
Literacy
Mathematic
s
Social
Foundations
Physical
Well-Being
and Motor
Developmen
t
All 108 43.5% 44.4% 23.1% 43.5% 60.2%
Gender
Female 51 47.1% 49.0% 25.5% 47.1% 64.7%
Male 57 40.4% 40.4% 21.1% 40.4% 56.1%
Ethnicity
Asian 2 -- -- -- -- --
Afr. American 84 41.7% 45.2% 22.6% 42.9% 64.3%
Hispanic 10 50.0% 40.0% 0.0% 40.0% 50.0%
White 5 -- -- -- -- --
Other 7 71.4% 57.1% 42.9% 71.4% 71.4%
Lunch Status
Free/Reduced 68 38.2% 41.2% 17.6% 41.2% 57.4%
Pay 40 52.5% 50.0% 32.5% 47.5% 65.0%
English

Proficiency
LEP 9 55.6% 44.4% 22.2% 55.6% 55.6%
Non-LEP 99 42.4% 44.4% 23.2% 42.4% 60.6%
IEP Status
Non-Speech IEP 1 -- -- -- -- --
No IEP 107 43.9% 44.9% 23.4% 43.9% 60.7%
Pre-Kindergarten
Head Start 9 44.4% 44.4% 33.3% 44.4% 77.8%
PreK* 67 43.3% 47.8% 20.9% 46.3% 61.2%
None 25 40.0% 40.0% 32.0% 32.0% 52.0%
Unknown 7 57.1% 28.6% 0.0% 57.1% 57.1%
-- Data not reported for subgroups less than 10 students.

South Carolina READY
Tables 3.1 and 3.2 show the percent of students in grades 3 through 5 who scored Meets or Exceeds Expectations on the SC Ready
English Language Arts and Mathematics tests for the 2015-2016 and 2016-2017 school years by subgroup.
Table 3.1: Percent of Students (3-5) Who Score Meets or Exceeds Expectations on SC Ready ELA by Subgroup
Subgroup 2016 2017
Count Percent Count Percent
All Students 342 32.1% 382 31.9%
Gender
Male 161 27.4% 186 22.6%
Female 180 36.7% 196 40.8%
Ethnicity
Hispanic or Latino 28 50.0% 23 0.0%
American Indian or Alaska Native 2 -- 2 --
Asian 1 0.0% 1 0.0%
Black or African American 278 28.1% 318 28.0%
Native Hawaiian or Other Pacific
Islander 0 -- 0 --
White 19 0.0% 23 0.0%
Two or more races 13 0.0% 15 0.0%
Disability
Disabled 42 7.1% 38 7.9%
Not Disabled 300 35.7% 344 34.6%
Migrant Status
Migrant 0 -- 0 --

Non-Migrant 342 32.1% 382 31.9%
English Proficiency
Limited English Proficient 8 0.0% 7 0.0%
Non-Limited English Proficient 334 31.7% 375 31.7%
Poverty
Students in Poverty (SIP) 235 26.4% 263 28.1%
Non-Students in Poverty (SIP) 105 45.7% 117 41.0%
-- Data not reported for subgroups less than 10 students.

Table 3.2: Percent of Students (3-5) Who Scored Meets or Exceeds Expectations on SC Ready Math by Subgroup
Subgroup 2016 2017
Count Percent Count Percent
All Students 342 34.2% 382 39.0%
Gender
Male 161 34.8% 186 36.5%
Female 180 33.9% 196 41.3%
Ethnicity
Hispanic or Latino 28 53.6% 23 0.0%
American Indian or Alaska Native 2 -- 2 --
Asian 1 -- 1 --
Black or African American 278 29.5% 318 36.2%
Native Hawaiian or Other Pacific
Islander 0 -- 0 --
White 19 0.0% 23 0.0%
Two or more races 13 0.0% 15 0.0%
Disability
Disabled 42 9.5% 38 10.5%
Not Disabled 300 37.6% 344 42.2%
Migrant Status
Migrant 0 -- 0 --
Non-Migrant 342 34.2% 382 39.0%
English Proficiency
Limited English Proficient 8 -- 7 --
Non-Limited English Proficient 334 33.8% 375 38.9%

Poverty
Students in Poverty (SIP) 235 30.2% 263 31.6%
Non-Students in Poverty (SIP) 105 43.8% 117 55.5%
-- Data not reported for subgroups less than 10 students.

SCPASS
Table 4.1: Percent of Students (4-5) Who Met or Exceeded Expectations on SCPASS Science by Subgroup
Subgroup 2015 2016 2017
Count Percent Count Percent Count Percent
All Students 243 57.1% 231 60.6% 244 32.8%
Gender
Male 116 56.9% 106 61.3% 116 29.2%
Female 124 58.1% 125 60.0% 128 36.0%
Ethnicity
Hispanic or Latino 16 -- 16 62.5% 15 --
American Indian or Alaska Native -- -- -- -- 2 --
Asian -- -- -- -- 1 --
Black or African American 197 52.8% 193 56.0% 201 29.3%
Native Hawaiian or Other Pacific Islander 1 -- -- -- -- --
White 12 -- 11 -- 16 --
Two or more races 11 -- 11 -- 9 --
Disability
Disabled 26 19.2% 28 25.0% 27 3.7%
Not Disabled 217 61.8% 203 65.5% 217 36.0%
English Proficiency
Limited English Proficient 8 -- 5 -- 5 --
Non-Limited English Proficient 235 56.6% 226 59.8% 239 32.6%
Poverty
Students in Poverty (SIP) 179 52.5% 163 55.2% 167 28.1%

Non-Students in Poverty (SIP) 62 72.6% 67 73.1% 77 42.9%
-- Data not reported for subgroups less than 10 students.
Standards and Scale Changed for 2017

Table 4.2: Percent of Students (4-5) Who Met or Exceeded Expectations on SCPASS Social Studies by Subgroup
Subgroup 2015 2016 2017
Count Percent Count Percent Count Percent
All Students 242 81.0% 231 74.0% 244 72.5%
Gender
Male 115 77.4% 106 71.7% 116 68.9%
Female 124 84.7% 125 76.0% 128 75.8%
Ethnicity
Hispanic or Latino 15 -- 16 62.5% 15 --
American Indian or Alaska Native -- -- -- -- 2 --
Asian -- -- -- -- 1 --
Black or African American 197 79.2% 193 71.5% 201 71.6%
Native Hawaiian or Other Pacific Islander 1 -- -- -- -- --
White 12 -- 11 -- 16 --
Two or more races 11 -- 11 -- 9 --
Disability
Disabled 26 42.3% 28 46.5% 27 40.8%
Not Disabled 216 85.6% 203 77.8% 217 76.5%
English Proficiency
Limited English Proficient 7 -- 5 -- 5 --
Non-Limited English Proficient 235 80.4% 226 73.4% 239 72.0%
Poverty
Students in Poverty (SIP) 178 78.6% 163 69.4% 167 67.7%
Non-Students in Poverty (SIP) 62 88.7% 67 86.6% 77 83.1%
-- Data not reported for subgroups less than 10 students.

School Climate
Table 5 shows the percent of teachers, students and parents who indicated they were satisfied learning environment, the social and
physical environment, and school-home relations on the 2015 through 2017 South Carolina Department of Education School Climate
surveys.
Table 5: School Climate Satisfaction by Teacher, Student and Parent groups for 2015-2017
2015 2016 2017
Count Percen
t Count
Percen
t Count
Percen
t
Satisfied with the Learning Environment
Teacher 50 70.0 % 47 63.8 % 52 88.5 %
Student 124 94.4 % 100 80.0 % 113 87.5 %
Parent 87 91.8 % 23 95.9
% 88 92.2 %
Satisfied with the Social and Physical
Environment
Teacher 50 68.0 % 47 70.2 % 52 90.4 %
Student 124 79.2 % 100 82.0 % 113 91.2 %
Parent 87 95.3 % 23 100.00
% 88 87.9 %
Satisfied with the School-Home Relations
Teacher 50 58 % 47 68.1 % 52 73.1%
Student 124 85.9 % 100 85.0 % 113 84.9 %
Parent 87 71.7 % 23 68.2 % 88 75.9%
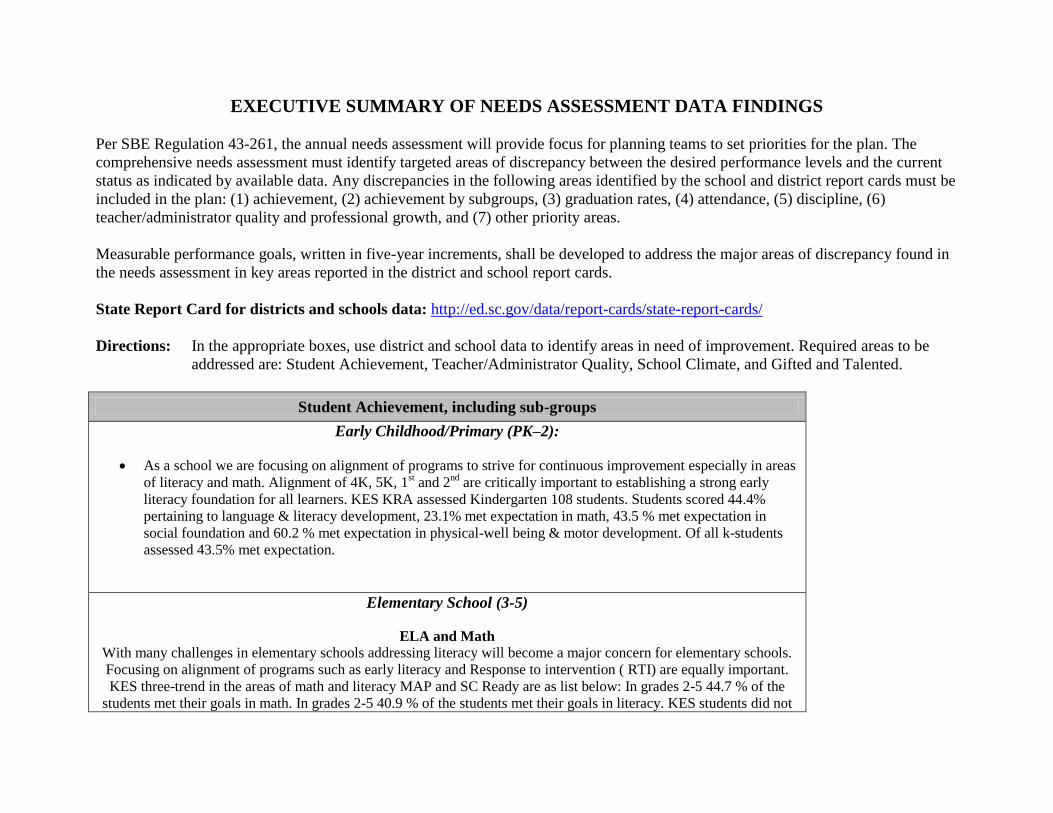
EXECUTIVE SUMMARY OF NEEDS ASSESSMENT DATA FINDINGS
Per SBE Regulation 43-261, the annual needs assessment will provide focus for planning teams to set priorities for the plan. The
comprehensive needs assessment must identify targeted areas of discrepancy between the desired performance levels and the current
status as indicated by available data. Any discrepancies in the following areas identified by the school and district report cards must be
included in the plan: (1) achievement, (2) achievement by subgroups, (3) graduation rates, (4) attendance, (5) discipline, (6)
teacher/administrator quality and professional growth, and (7) other priority areas.
Measurable performance goals, written in five-year increments, shall be developed to address the major areas of discrepancy found in
the needs assessment in key areas reported in the district and school report cards.
State Report Card for districts and schools data: http://ed.sc.gov/data/report-cards/state-report-cards/
Directions: In the appropriate boxes, use district and school data to identify areas in need of improvement. Required areas to be
addressed are: Student Achievement, Teacher/Administrator Quality, School Climate, and Gifted and Talented.
Student Achievement, including sub-groups
Early Childhood/Primary (PK–2):
As a school we are focusing on alignment of programs to strive for continuous improvement especially in areas
of literacy and math. Alignment of 4K, 5K, 1st and 2
nd are critically important to establishing a strong early
literacy foundation for all learners. KES KRA assessed Kindergarten 108 students. Students scored 44.4%
pertaining to language & literacy development, 23.1% met expectation in math, 43.5 % met expectation in
social foundation and 60.2 % met expectation in physical-well being & motor development. Of all k-students
assessed 43.5% met expectation.
Elementary School (3-5)
ELA and Math
With many challenges in elementary schools addressing literacy will become a major concern for elementary schools.
Focusing on alignment of programs such as early literacy and Response to intervention ( RTI) are equally important.
KES three-trend in the areas of math and literacy MAP and SC Ready are as list below: In grades 2-5 44.7 % of the
students met their goals in math. In grades 2-5 40.9 % of the students met their goals in literacy. KES students did not

grow in math MAP and students showed a decrease in literacy by 3.8% from one year to the next year. As it relates to
SC Ready, students in grades 3-5 are below the district and state averages. KES administration and teachers are
constantly working with the elementary academic team to address the indicators of learning in math and literacy.
Science and Social Studies
With Science and Social Studies in tested grades KES scores continue to be a highlight of ours. Based on 2017
administration of SC PASS, 32.8 % of KES fourth and fifth graders met or exceeded expectations in science. 29.4 % of
African American students, 43.8 % . 40.0% Caucasian and 63.6 % other met or exceeded expectations in science.
Based on 2017 administration of SC PASS, 72.5 % of KES fourth and fifth graders met or exceeded expectations in
Social Studies. Based on 2017 SC PASS administration, 71.6% of African Americans students, 81.3 % of Hispanic me
tor exceeded expectations, 66.7 % Caucasian and 81.8 % other met or exceeded expectations in social studies.
SC PASS data in Science and Social Studies has slightly decreased over three years. Work in science will continue to
be supported by USC Professor Dr. Stephen Thompson and district elementary content specialist to assess the
indicators of learning.
Middle School (6-8)
N/A
High School (9-12)
N/A

Teacher/Administrator Quality
Killian Elementary is one of the elementary schools within our district with higher poverty than schools
similar or like ours. Based on zoning reporting & demographic report for 2017-2018 day 11 KES poverty
index is 74 %. A challenge from schools like ours is teacher retention due to our Title One status. We will
continue to focus on high expectations for all stakeholders within our community.
At Killian we will focus on improving student achievement to development student and teacher talents.
Professional Development will be centered the schools goals and achievement goals.
School Climate
Based our 2016-2017 school climate data perception is critical to a schools success. Over the course of a
three year trend parents are satisfied with home-school relations: 84.9 % of students were satisfied, 75.9 % of
parents were satisfied, and 92 % of teachers were satisfied.
The percent of parents who were satisfied with learning at or school were denoted as below: 1) 2015 indicated 91.8 % were satisfied; 2016 indicated 95.9 % were satisfied and 2017 indicated 92.2 % were
satisfied.
The percent of parents who were satisfied with the social and physical environment were denoted below: 1) 2015 indicated 95.3 % were satisfied; 2016 indicated 100.00% were satisfied and 2017 indicated 87.9 % were
satisfied.
Based on our three year trend all stakeholders are satisfied with our climate. We celebrate this perception data
because we at KES are concerned about how the community perceive us. With this trend we look always to
improve KES climate. In addition, KES look to improve teacher communication with parents. Also KES
must look to ensure all students are being treated fair. At KES we must ensure that all stakeholders are aware
of our anti-bullying program.

District Priorities
Killian Elementary goals are aligned with district and state goals. We pride ourselves in the district four
squares of learning, character, community and joy.
Gifted and Talented
Killian does not offer a gifted and Talented Program. Killian does have students that qualified for our district
ALERT Program for Gifted and Talented which begins in second grade.
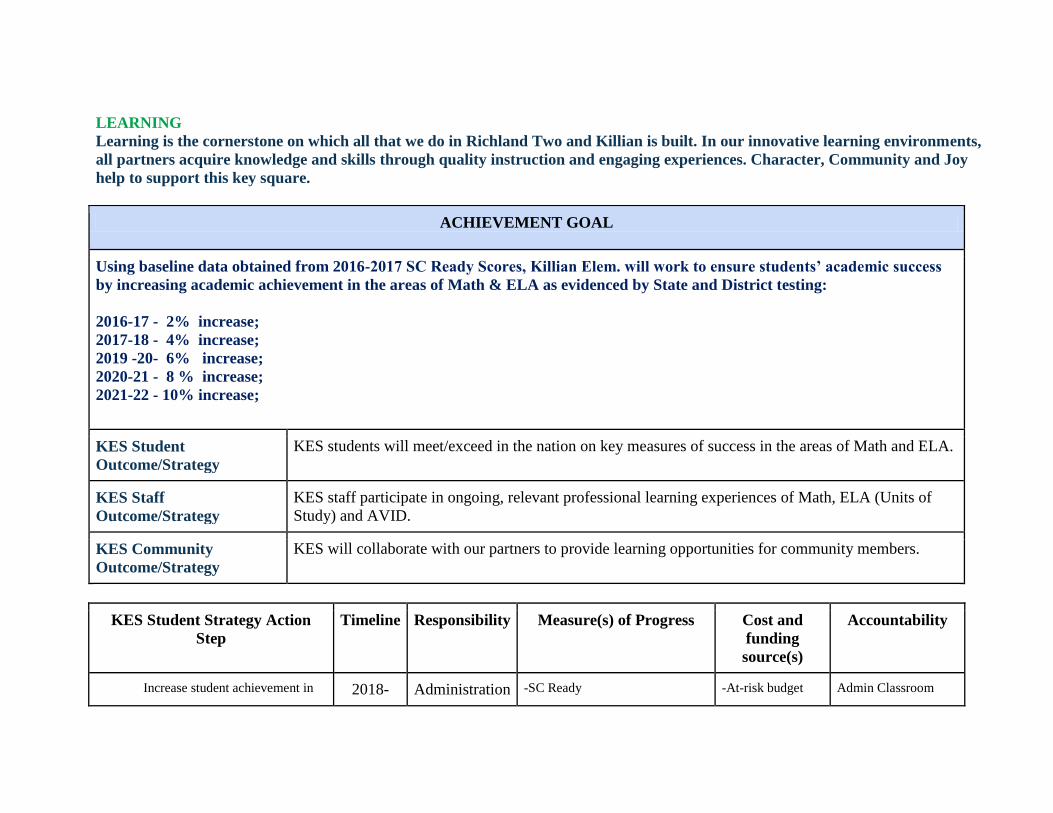
LEARNING
Learning is the cornerstone on which all that we do in Richland Two and Killian is built. In our innovative learning environments,
all partners acquire knowledge and skills through quality instruction and engaging experiences. Character, Community and Joy
help to support this key square.
ACHIEVEMENT GOAL
Using baseline data obtained from 2016-2017 SC Ready Scores, Killian Elem. will work to ensure students’ academic success
by increasing academic achievement in the areas of Math & ELA as evidenced by State and District testing:
2016-17 - 2% increase;
2017-18 - 4% increase;
2019 -20- 6% increase;
2020-21 - 8 % increase;
2021-22 - 10% increase;
KES Student
Outcome/Strategy
KES students will meet/exceed in the nation on key measures of success in the areas of Math and ELA.
KES Staff
Outcome/Strategy
KES staff participate in ongoing, relevant professional learning experiences of Math, ELA (Units of
Study) and AVID.
KES Community
Outcome/Strategy
KES will collaborate with our partners to provide learning opportunities for community members.
KES Student Strategy Action
Step
Timeline Responsibility Measure(s) of Progress Cost and
funding
source(s)
Accountability
Increase student achievement in 2018- Administration -SC Ready -At-risk budget Admin Classroom

mathematics.
Increase student achievement in
Literacy.
2022
2018-
2022
Instructional
Coaches
Faculty and
Staff
Students
Administration
Instructional
Coaches
-Students Meeting MAP target
goals; Benchmarks Mastery Connect Benchmarks SC Ready -Students Meeting MAP target
goals; Benchmarks
-Title One Focus
One -After-school
funds At-risk budget -Title One Focus
One
Observations -Peer Observations -Lesson Plan Checks Admin Classroom
Observations -Peer Observations
KES Staff Strategy Action Step Timeline Responsibility Measure(s) of Progress Cost and
funding
source(s)
Accountability
Provide Project Based Learning and STEAM Professional Development experiences with support
from district pacing guides Develop Professional Learning Plan for
teachers with input from all stakeholders
2018-
2022
2018-
2022
Teachers
Students
Reading
Coach
Teachers
Administration
100% of teachers plan and
implement PBL projects 2X per
year
Plan with calendar events
-At-risk budget -Title One Focus
One -After-school
funds
SC Ready
SC PASS
MAP
Benchmarks
PD Sign in sheets
Minutes from
Meetings
Presentation
Materials
KES Community Strategy Action
Step
Timeline Responsibility Measure(s) of Progress Cost and
funding
source(s)
Accountability
Provide Curriculum Nights and First
Friday Breakfast for parents & community
2018-
2022
Administration
Coaches
Faculty and
Number of families attending
grade level sessions
Afterschool
funds
Number of
volunteers
Number of

Provide parent academy each quarter.
2018-
2022
Staff
Students
SIC
PTO School Counselor Psychologist Administration
Number of parents attending
Afterschool
funds; Focus
One Title One
outreach
opportunities
Number of
community
participants Surveys pictures
TALENT GOAL
By the end of 2022, 50% of KES faculty members will share their talents by leading at least one professional development
session.
2018- 10% increase
2019- 20% increase
2020- 30% increase
2021- 40% increase
2022- 50% increase
KES Student
Outcome/Strategy
KES students benefit from the opportunity to identify their gifts and talents and have the opportunity to
pursue a passion.
KES Staff
Outcome/Strategy
KES employees identify a passion and pursue that passion while working in Richland Two and at KES.
KES Community
Outcome/Strategy
Community members share their gifts and talents with KES, Richland Two students and employees.

KES Students Strategy Action
Step
Timeline Responsibility Measure(s) of Progress Cost and
funding
source(s)
Accountability
Continue Project Based
Learning experiences to allow student
inquiry to pursue their passions
2018-
2022
Teachers
Students
administration
100% of teachers plan and
implement PBL projects 2X per
year.
Showcase of student project
At-risk budget Projects and lesson
plans through
collaboration among
staff. 2 PBL projects per
year
KES Staff Strategy Action Step Timeline Responsibility Measure(s) of Progress Cost and
funding
source(s)
Accountability
Teachers participate in professional
development.
-Lucy Calkins Units of Study
-AVID & WICOR
2018-
2022
Principal
Reading
Coach
Mastery Connect Benchmarks SC Ready -Students Meeting MAP target
goals; Benchmarks
Focus 1
Title 1
SC Ready
MAP
Benchmarks
PD Sign in sheets
KES Community Strategy Action
Step
Continue to host student interns to
strengthen PDS partnership
Continue to host STEAM Career Day
Timeline
2018-
2022
2018-
2022
Responsibility
USC Liaison
Administration
Teachers
School
Counselor
Career
Specialist
Measure(s) of Progress Increase teachers accepting
interns
Number of visitors participating
Cost and
funding
source(s)
Afterschool
funds
Afterschool
funds
Accountability Meeting between USC
adjunct and PDS
advisor. Attending monthly
PDS meetings. Lobby Guard-sign in
sheets Pictures/Twitter Feed Student feedback

CULTURE AND ENVIRONMENT GOAL
KES will promote collaboration among all partners in order to build and add to our collective knowledge and expertise
KES Student Outcome KES maintains a student centered environment that fosters collaboration and supports learning.
KES Staff Outcome KES staff create and maintain an environment that promotes collaboration and supports
learning for students and all other partners including themselves.
KES Community Outcome Collaboration with KES community partners expands and increases learning opportunities for
students, staff, and community members.
KES Student Outcome/Strategy Timeline
Responsibility Measure(s) of Progress Cost and
Funding
Source
Accountability
Provide 21st century learning
environment with STEAM Lab.
2018-
2022
Administration
Teachers/students
SC Ready/Benchmarks
MAP Goals
Title One Pictures
KES Staff Outcome/Strategy Timeline
Responsibility Measure(s) of Progress Cost and
Funding
Source
Accountability
Provide Professional Development
for staff through PLC’s.
2018-
2022
Administration SC Ready/Benchmarks
MAP Goals
Title One
At-Risk
Meeting
Agenda’s
KES Community
Outcome/Strategy
Timeline
Responsibility
Measure(s) of Progress
Cost and
Funding Accountability

Provide Parent Academy and Curriculum Nights
2018-
2022
Administration
Staff
Teachers
Mastery Connect
Benchmarks
MAP Goals
Source
Afterschool
Funds
Pictures
Sign in sheets
CHARACTER
Character is a building block to a great education. Positive character traits are essential to becoming contributing members of
society. Without opportunities to develop and strengthen strong character traits, learning is not complete.
ACHIEVEMENT GOAL
To enhance the overall climate and culture of our school, KES will encourage our students to demonstrate a high level of
ethical character within and outside of the Richland Two community. Using 2016-17 discipline information will be measured
by decreasing referrals and suspensions.
2016-17 5% decrease 2017-18 10% decrease 2018-19 15 % decrease 2019-20 20% decrease 2020-21 25 % decrease
KES Student
Outcome/Strategy
KES students excel in developing and applying the Life and Career Characteristics of the South
Carolina Graduate: Integrity; Self-direction; Global perspective; Perseverance; Work ethic; and
interpersonal skills
KES Staff Outcome/Strategy KES staff consistently model strong character traits, serving as role models for our students and
each other.
KES Community KES works with our community partners to provide opportunities for students and staff to
Outcome/Strategy contribute to society.
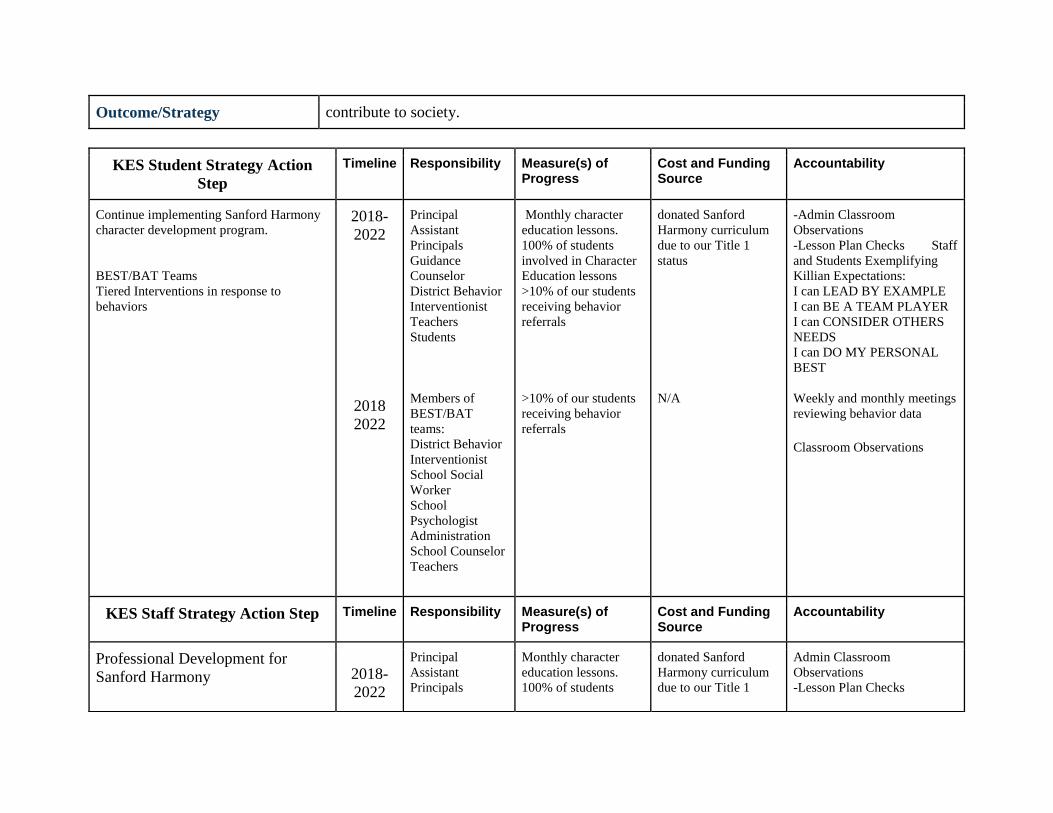
KES Student Strategy Action
Step
Timeline Responsibility Measure(s) of Progress
Cost and Funding Source
Accountability
Continue implementing Sanford Harmony
character development program. BEST/BAT Teams Tiered Interventions in response to
behaviors
2018-
2022
2018
2022
Principal Assistant
Principals Guidance
Counselor District Behavior
Interventionist Teachers Students
Members of
BEST/BAT
teams: District Behavior
Interventionist School Social
Worker School
Psychologist Administration School Counselor Teachers
Monthly character
education lessons. 100% of students
involved in Character
Education lessons >10% of our students
receiving behavior
referrals
>10% of our students
receiving behavior
referrals
donated Sanford
Harmony curriculum
due to our Title 1
status
N/A
-Admin Classroom
Observations -Lesson Plan Checks Staff
and Students Exemplifying
Killian Expectations: I can LEAD BY EXAMPLE I can BE A TEAM PLAYER I can CONSIDER OTHERS
NEEDS I can DO MY PERSONAL
BEST
Weekly and monthly meetings
reviewing behavior data Classroom Observations
KES Staff Strategy Action Step Timeline Responsibility Measure(s) of Progress
Cost and Funding Source
Accountability
Professional Development for
Sanford Harmony
2018-
2022
Principal Assistant
Principals
Monthly character
education lessons. 100% of students
donated Sanford
Harmony curriculum
due to our Title 1
Admin Classroom
Observations -Lesson Plan Checks
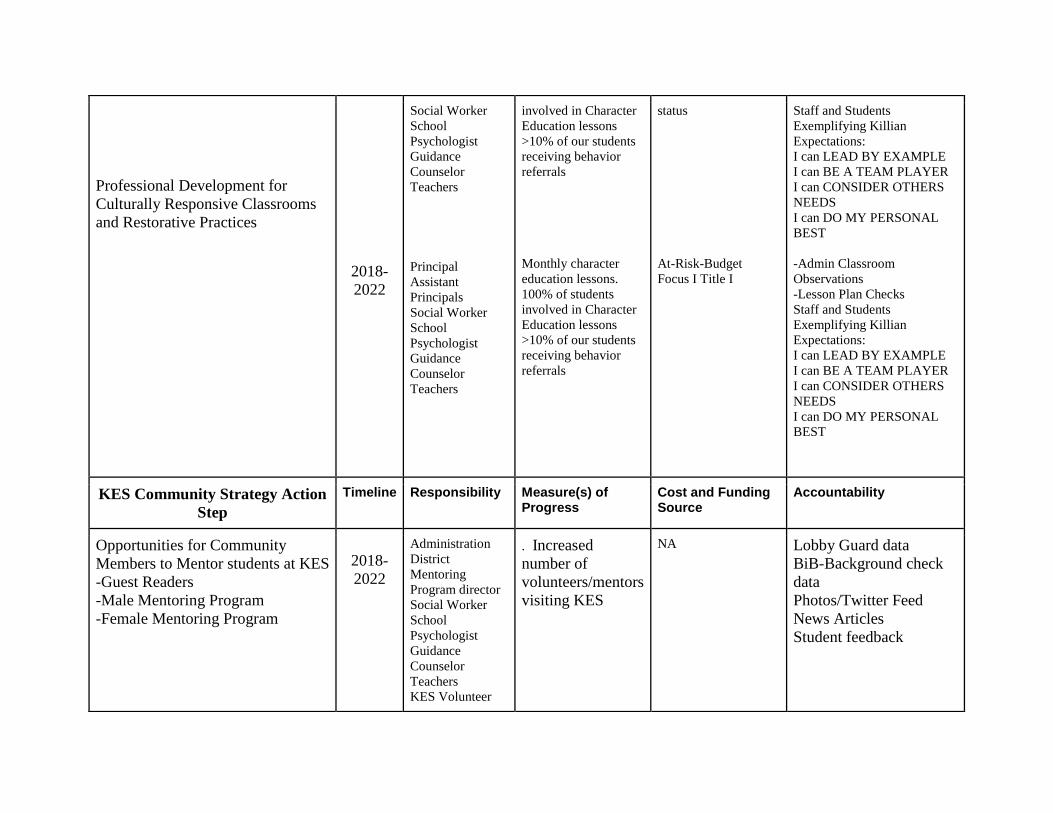
Professional Development for
Culturally Responsive Classrooms
and Restorative Practices
2018-
2022
Social Worker School
Psychologist Guidance
Counselor Teachers
Principal Assistant
Principals Social Worker School
Psychologist Guidance
Counselor Teachers
involved in Character
Education lessons >10% of our students
receiving behavior
referrals
Monthly character
education lessons. 100% of students
involved in Character
Education lessons >10% of our students
receiving behavior
referrals
status
At-Risk-Budget Focus I Title I
Staff and Students
Exemplifying Killian
Expectations: I can LEAD BY EXAMPLE I can BE A TEAM PLAYER I can CONSIDER OTHERS
NEEDS I can DO MY PERSONAL
BEST
-Admin Classroom
Observations -Lesson Plan Checks Staff and Students
Exemplifying Killian
Expectations: I can LEAD BY EXAMPLE I can BE A TEAM PLAYER I can CONSIDER OTHERS
NEEDS I can DO MY PERSONAL
BEST
KES Community Strategy Action
Step
Timeline Responsibility Measure(s) of Progress
Cost and Funding Source
Accountability
Opportunities for Community
Members to Mentor students at KES
-Guest Readers
-Male Mentoring Program
-Female Mentoring Program
2018-
2022
Administration District
Mentoring
Program director Social Worker School
Psychologist Guidance
Counselor Teachers KES Volunteer
. Increased
number of
volunteers/mentors
visiting KES
NA
Lobby Guard data
BiB-Background check
data
Photos/Twitter Feed
News Articles
Student feedback
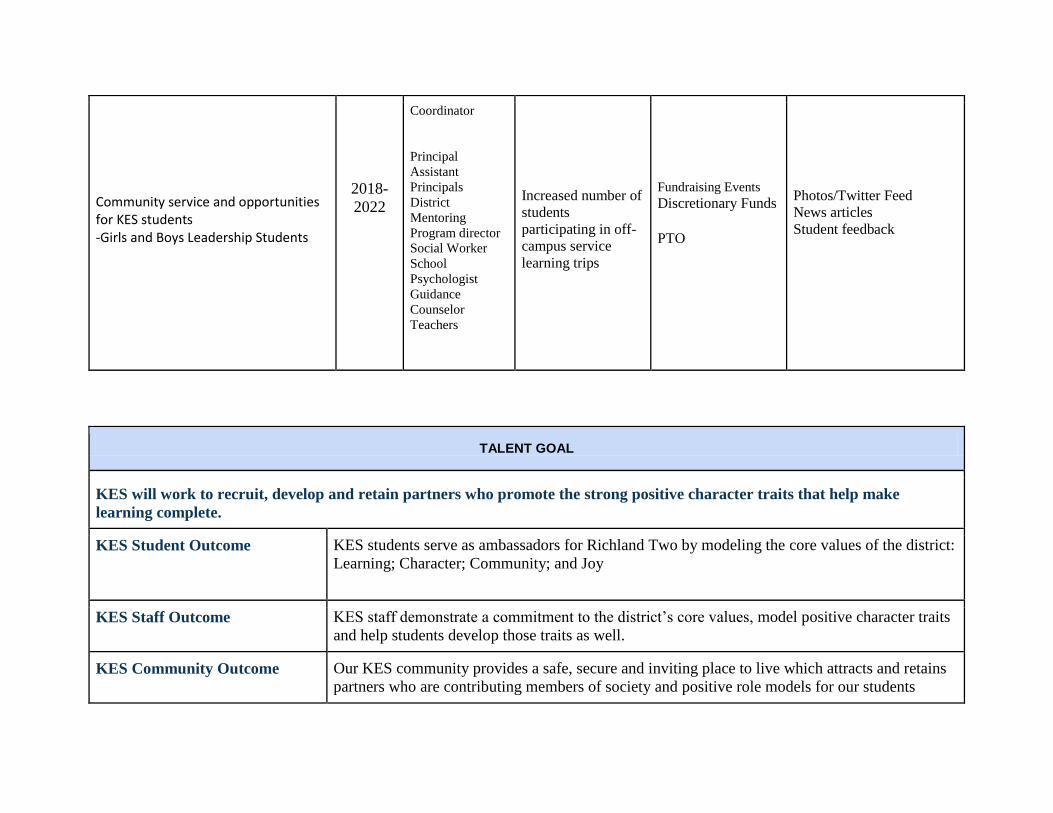
TALENT GOAL
KES will work to recruit, develop and retain partners who promote the strong positive character traits that help make
learning complete.
KES Student Outcome KES students serve as ambassadors for Richland Two by modeling the core values of the district:
Learning; Character; Community; and Joy
KES Staff Outcome KES staff demonstrate a commitment to the district’s core values, model positive character traits
and help students develop those traits as well.
KES Community Outcome Our KES community provides a safe, secure and inviting place to live which attracts and retains
partners who are contributing members of society and positive role models for our students
Community service and opportunities for KES students -Girls and Boys Leadership Students
2018-
2022
Coordinator
Principal
Assistant
Principals District
Mentoring
Program director Social Worker School
Psychologist Guidance
Counselor Teachers
Increased number of
students
participating in off-
campus service
learning trips
Fundraising Events
Discretionary Funds PTO
Photos/Twitter Feed News articles Student feedback

KES Student Strategy Action Step Timeline
Responsibility Measure(s) of Progress
Cost and Funding Source
Accountability
Maintain high achievement levels while
exemplifying high standards of character. 2018-
2022
Principal Assistant
Principals Teachers Students School
Counselor Instructional
Assistants
>10% of our students
receiving behavior
referrals
TBA Students Exemplifying Killian
Expectations
KES Staff Strategy Action Step Timeline
Responsibility Measure(s) of Progress
Cost and Funding Source
Accountability
Monthly character
education lessons and conversations about
expectations on field trips, assemblies, etc.
2018-
2022
Principal Assistant
Principals Teachers Students School
Counselor
Reduction of students
receiving behavior
referrals
N/A Staff Exemplifying Killian
Expectations: I can LEAD BY EXAMPLE I can BE A TEAM PLAYER I can CONSIDER OTHERS
NEEDS I can DO MY PERSONAL
BEST
KES Community Strategy Action
Step
Timeline Responsibility Measure(s) of Progress
Cost and Funding Source
Accountability
Provide opportunities for community to participate in school events.
2018-2022
Administration Teachers
.Service Learning projects with community partners.
N/A Pictures Calendar of events

CULTURE AND ENVIRONMENT GOAL
KES will work to maintain a culture and environment that reinforces positive character traits.
KES Student Outcome From kindergarten through grade 5, our students participate in character education.
KES Staff Outcome KES staff participate in character education and model positive behavior to students
KES Community Outcome We partner with the KES community to provide character education programs, and we recognize
community members who model positive behavior for our students and staff.
KES Student Strategy Action Step Timeline Responsibility Measure(s) of Progress
Cost and Funding Source
Accountability
Develop problem solving strategies to
advocate for self and others 2018-
2022
Guidance Administrators Teachers
Students practice
strategies TBA Framework developed for
implementation
KES Staff Strategy Action Step
Timeline
Responsibility Measure(s) of Progress
Cost and Funding Source
Accountability
Incorporate character focus elements from
Sanford Harmony in guidance lessons 2018-
2022
Guidance Administrators Teachers
Students practice
strategies. N/A Lesson plans for year
KES Community Strategy Action
Step
Timeline Responsibility Measure(s) of Progress
Cost and Funding Source
Accountability
Educate parents in problem solving
strategies to release responsibility to
students for advocacy.
2018-
2022
Guidance Administrators Teachers
Parents practice
strategies Afterschool funds Agenda from sessions

COMMUNITY
We value the power of working with our entire community – students, employees, parents, residents, businesses, faith-based
organizations, government entities and elected officials (partners). Working together, we continuously improve the Richland Two
community and support each other in maximizing our gifts and talents, as we pursue our pathways to purpose.
ACHIEVEMENT
KES will maximize opportunities for partners to collaborate and work together for the greater good.
KES Student Outcome KES Students participate in meaningful and relevant community service projects that provide
opportunities to expand their learning and support the KES and Richland Two community.
KES Staff Outcome Our KES employees support and serve as leaders in community organizations, building their
capacity to support the mission and vision of the district and school while bettering the
community.
KES Community Outcome KES capitalize on mutually beneficial community partnerships that support our students, staff
and community partners as they pursue their pathways to purpose.
KES Student Strategy Action
Step
Timeline Responsibility Measure(s) of
Progress
Cost and
Funding Source
Accountability

Cultivate expectations for interactions with
community members that represent school
norms. (Service Learning through Boys and Girls
Leadership, BETA Club, Essence Pearls,
Boys Mentoring)
2018-
2022
Teachers Students Administration
Positive feedback
from community
members based on
interactions with our
students.
Afterschool
Lesson plans for teaching
norms.
KES Staff Strategy Action Step
Timeline
Responsibility
Measure(s) of
Progress
Cost and
Funding Source
Accountability
Staff will serve as leaders in their
respective communities.
2018-
2022
Teachers
Staff
Staff involvement N/A Documentation of their
roles.
Pictures/meeting
minutes
KES Community Strategy Action
Step
Timeline Responsibility Measure(s) of
Progress
Cost and
Funding Source
Accountability
Establish partnerships with
community members that develop
students talents
2018-
2022
Teachers
Students
Community
members
Number of
community
members involved
N/A Community input
TALENT GOAL
KES will strive to identify and maximize the collective talent of our partners.
KES Student Outcome KES helps our students identify their talents and share them with our community
KES Staff Outcome Our KES staff identifies their talents and uses them to assist our students in pursuing personal
pathways to purpose
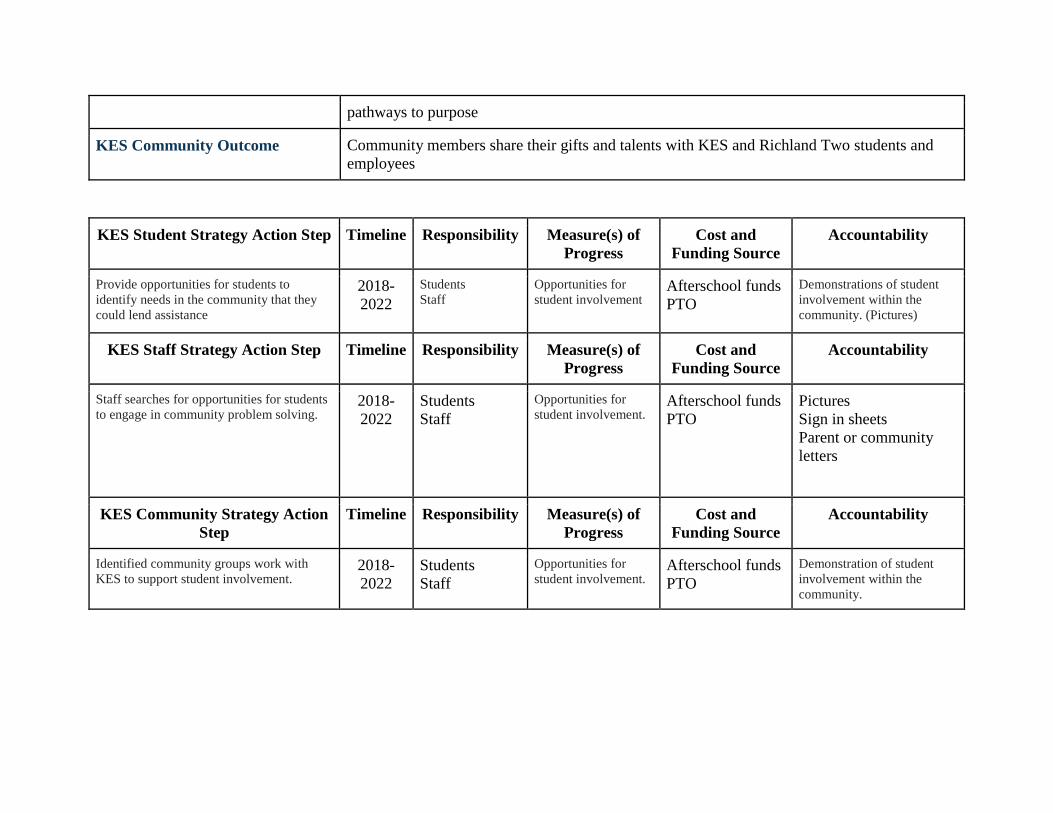
KES Community Outcome Community members share their gifts and talents with KES and Richland Two students and
employees
KES Student Strategy Action Step Timeline Responsibility Measure(s) of
Progress
Cost and
Funding Source
Accountability
Provide opportunities for students to
identify needs in the community that they
could lend assistance
2018-
2022
Students Staff
Opportunities for
student involvement Afterschool funds
PTO
Demonstrations of student
involvement within the
community. (Pictures)
KES Staff Strategy Action Step Timeline Responsibility Measure(s) of
Progress
Cost and
Funding Source
Accountability
Staff searches for opportunities for students
to engage in community problem solving. 2018-
2022
Students
Staff
Opportunities for
student involvement. Afterschool funds
PTO
Pictures
Sign in sheets
Parent or community
letters
KES Community Strategy Action
Step
Timeline Responsibility Measure(s) of
Progress
Cost and
Funding Source
Accountability
Identified community groups work with
KES to support student involvement. 2018-
2022
Students
Staff
Opportunities for
student involvement. Afterschool funds
PTO
Demonstration of student
involvement within the
community.

CULTURE AND ENVIRONMENT GOAL
KES will promote collaboration among all partners in order to build and add to our collective knowledge and expertise.
KES Student Outcome In all KES classrooms, it is evident that every student is valued and appreciated.
KES Staff Outcome A highly qualified, premier teacher is in all KES classrooms
KES Community Outcome We maximize opportunities to bring the community together and lead the way in enhancing Northeast
Richland County and KES community
KES Student Strategy Action Step Timeline Responsibility Measure(s) of
Progress
Cost and
Funding Source
Accountability
Reinforce positive student character with
Sanford Harmony within our classrooms
daily.
2018-
2022
Teachers Students Administrators
Fewer teacher,
student and parent
concerns
N/A Discipline reports
KES Staff Strategy Action Step Timeline Responsibility Measure(s) of
Progress
Cost and
Funding Source
Accountability
Develop a staff that is committed to KES
mission and vision. 2018-
2022
Staff All teachers seek
training and
implement
curriculum with
fidelity
Afterschool
funds
Teacher surveys Professional Development Staff Outings
KES Community Strategy Action
Step
Timeline Responsibility Measure(s) of
Progress
Cost and
Funding Source
Accountability

Provide opportunities for students to share
with community members their
accomplishments.
2018-
2022
Staff Parents Community
members
Showcases for
student
accomplishments.
N/A Programs and photos of
events
JOY
What is success without celebration? We value the practice of honoring our accomplishments. Sharing in the job of a job well done
promotes future success. The Richland Two family takes time to revel in the great achievements made by all of our partners. A
joyful environment produces happy and productive people who embrace innovation and learning.
ACHIEVEMENT GOAL
KES will celebrate and recognize the achievement of all partners
KES Student Outcome KES celebrates and recognize our students for growth and achievements in academics, arts,
athletics, and service.
KES Staff Outcome KES staff earn celebrations and recognition for demonstrating growth and excellence.
KES Community Outcome We honor community partners for maximizing their gifts and talents.
KES Student Strategy Action
Step
Timeline Responsibility Measure(s) of
Progress
Cost and
Funding Source
Accountability
Staff will develop engaging lessons that
foster student’s passion for learning. 2018-
2022
Staff DOK 3 and 4 lessons
where students share
ownership for their
learning
Afterschool funds Lesson plan checks Classroom observations Mastery Connect

KES Staff Strategy Action Step
Timeline
Responsibility
Measure(s) of
Progress
Cost and
Funding Source
Accountability
Teachers challenge themselves to create
lessons that actively engage students in the
creation of learning
2018-
2022
Teachers
Administration
students
Lessons that require
student inquire and
ownership of learning
N/A Student created products Lesson plan checks Classroom observations
KES Community Strategy Action
Step
Timeline
Responsibility Measure(s) of
Progress
Cost and
Funding Source
Accountability
Community support for teachers that assist
in creating experiences outside of the realm
of expertise
2018-
2022
Teachers
Administration
students
Showcase community
members who have
expertise to support
student learning.
N/A Photos of community
members supporting student
learning.
TALENT GOAL
KES will consistently look for ways for our partners to experience joy while learning and working.
KES Student Outcome
KES students benefit from multiple opportunities to discover their passions.
KES Staff Outcome
KES staff participates in ongoing professional and personal growth opportunities to develop
work skills and knowledge, and to ensure a healthy work/personal-life balance.
KES Community Outcome
In joyful settings, we offer community members opportunities to share their gifts and talents
with KES and Richland Two students and employees.

KES Student Strategy Action Step
Timeline Responsibility Measure(s) of
Progress
Cost and
Funding Source
Accountability
Multiple opportunities are given to students
to discover their passions. .
2018-
2022
Teachers Administrators Contracted
outside agencies
Student participation
in special
projects/clubs
Afterschool funds List of opportunities provided
KES Staff Strategy Action Step Timeline Responsibility Measure(s) of
Progress
Cost and
Funding Source
Accountability
Develop staff development calendar to
include social activities that all can enjoy.
2018-
2022
Teachers Administrators
Staff development
events
Afterschool funds
Documentation of events
KES Staff Strategy Action Step Timeline Responsibility Measure(s) of
Progress
Cost and
Funding Source
Accountability
Students develop projects that highlight
their community service and passion.
2018-
2022
Parents Students Teachers
Community service
projects
N/A
Presentations of community
service projects.

CULTURE AND ENVIRONMENT GOAL
KES will strive to have a joyful and productive environment for all partners.
KES Student Outcome KES ensure all students develop meaningful relationships, which are vital to engaging
students in purposeful learning.
KES Staff Outcome KES staff participates in regular motivational and inspirational activities.
KES Community Outcome KES maximizes opportunities to bring the community together
KES Student Strategy Action Step Timeline Responsibility Measure(s) of
Progress
Cost and
Funding Source
Accountability
Develop different configurations of
opportunities for students to engage in
meaningful relationships.
2018-
2022
Staff Parents Community
Varied offerings for
participation to
develop relationships
outside of the
homerooms
N/A Documentation of offerings
KES Staff Strategy Action Step Timeline Responsibility Measure(s) of
Progress
Cost and
Funding Source
Accountability
Develop activities that motivate and inspire
teachers 2018-
2022
Staff Parents Community
Dedicated time
developed in
professional
development
calendars
N/A Documented evidence on
events
KES Community Strategy Action
Step
Timeline
Responsibility
Measure(s) of
Progress
Cost and
Funding Source
Accountability
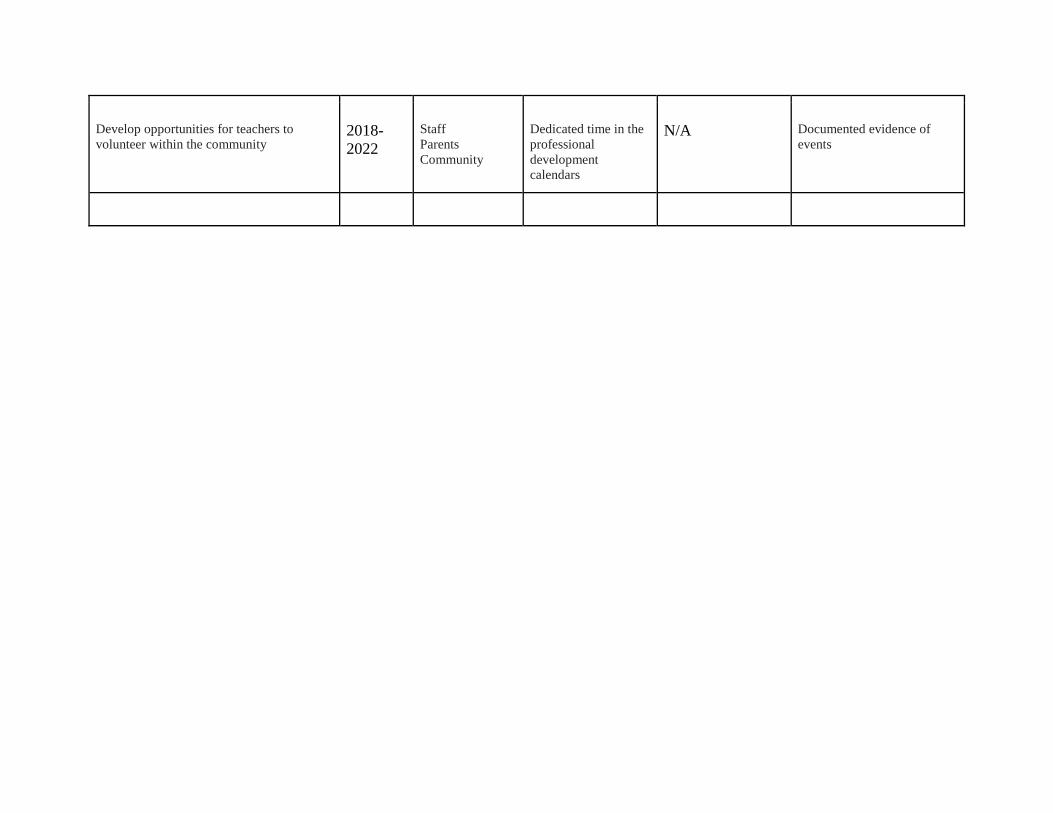
Develop opportunities for teachers to
volunteer within the community
2018-
2022
Staff Parents Community
Dedicated time in the
professional
development
calendars
N/A Documented evidence of
events


