
1
Killam Apartment REIT
Q3-2017 Results Conference CallNovember 8, 201711am Eastern

Cautionary Statement
This presentation may contain forward-looking statements with respect to Killam Apartment REIT and its operations, strategy, financial performance and condition. These statements generally can be identified by use of forward-looking words such as “may”, ”will”, “expect”, “estimate”, “anticipate”, “intends”, “believe” or “continue” or the negative thereof or similar variations. The actual results and performance of Killam Apartment REIT discussed herein could differ materially from those expressed or implied by such statements. Such statements are qualified in their entirety by the inherent risks and uncertainties surrounding future expectations. Important factors that could cause actual results to differ materially from expectations include, among other things, general economic and market factors, competition, changes in government regulation and the factors described under “Risk Factors” in Killam’s annual information form and other securities regulatory filings. The cautionary statements qualify all forward-looking statements attributable to Killam Apartment REIT and persons acting on its behalf. Unless otherwise stated, all forward-looking statements speak only as of the date to which this presentation refers, and the parties have no obligation to update such statements.
2
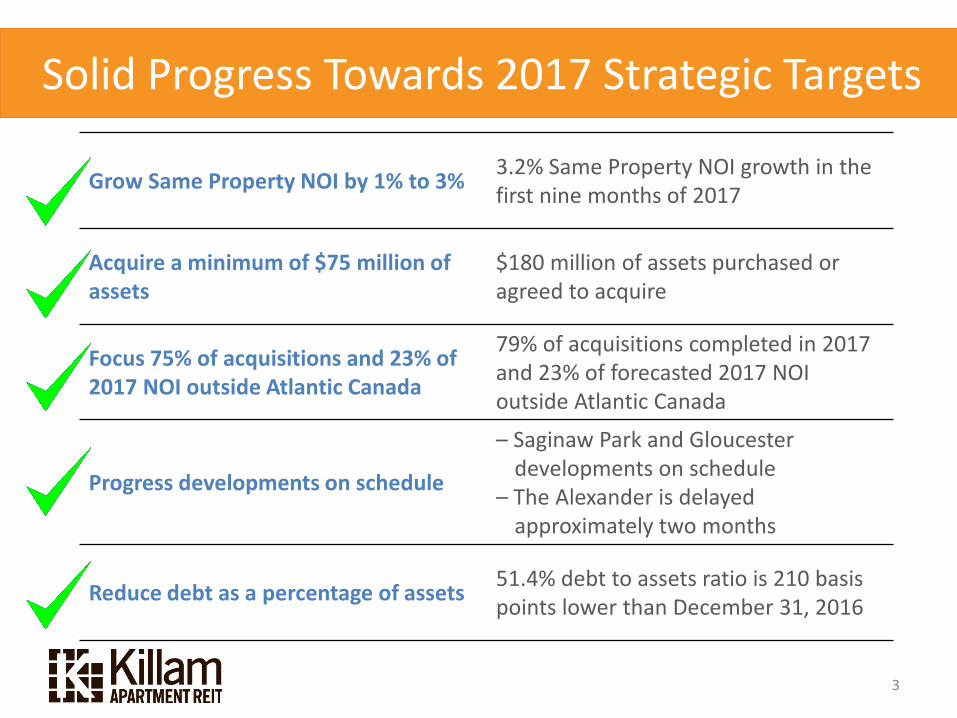
Killam Apartment REITSolid Progress Towards 2017 Strategic Targets
3
Grow Same Property NOI by 1% to 3% 3.2% Same Property NOI growth in the first nine months of 2017
Acquire a minimum of $75 million of assets
$180 million of assets purchased or agreed to acquire
Focus 75% of acquisitions and 23% of 2017 NOI outside Atlantic Canada
79% of acquisitions completed in 2017 and 23% of forecasted 2017 NOI outside Atlantic Canada
Progress developments on schedule
– Saginaw Park and Gloucester developments on schedule
– The Alexander is delayed approximately two months
Reduce debt as a percentage of assets 51.4% debt to assets ratio is 210 basis points lower than December 31, 2016
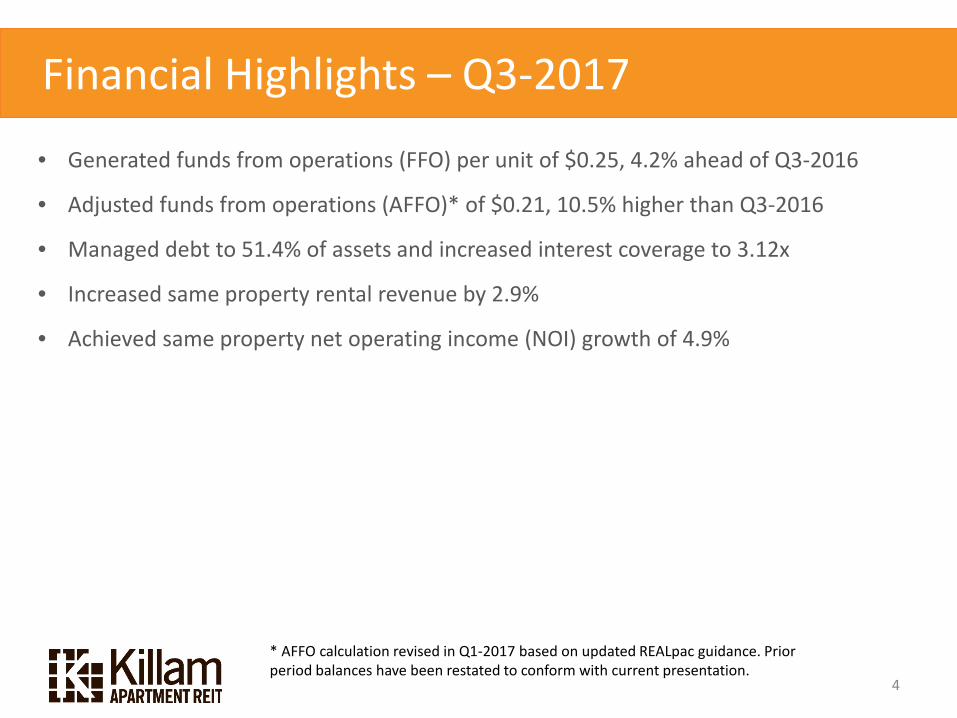
Highlights from Q4-2015Financial Highlights – Q3-2017
4
• Generated funds from operations (FFO) per unit of $0.25, 4.2% ahead of Q3-2016
• Adjusted funds from operations (AFFO)* of $0.21, 10.5% higher than Q3-2016
• Managed debt to 51.4% of assets and increased interest coverage to 3.12x
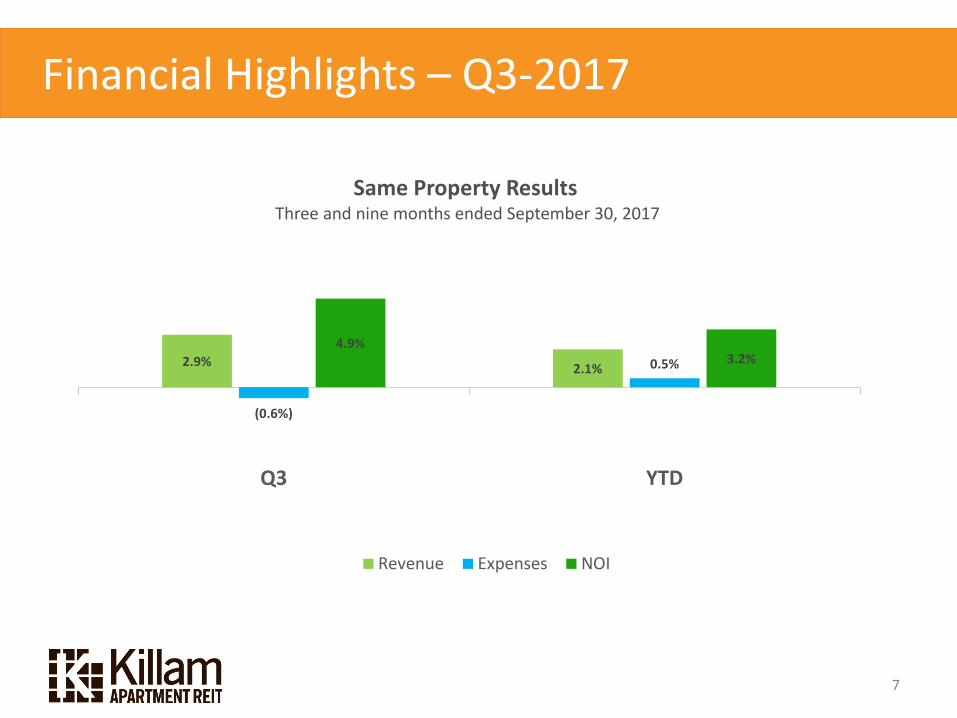
• Increased same property rental revenue by 2.9%
• Achieved same property net operating income (NOI) growth of 4.9%
* AFFO calculation revised in Q1-2017 based on updated REALpac guidance. Prior period balances have been restated to conform with current presentation.
9.7% FFO Per Share Growth 2015
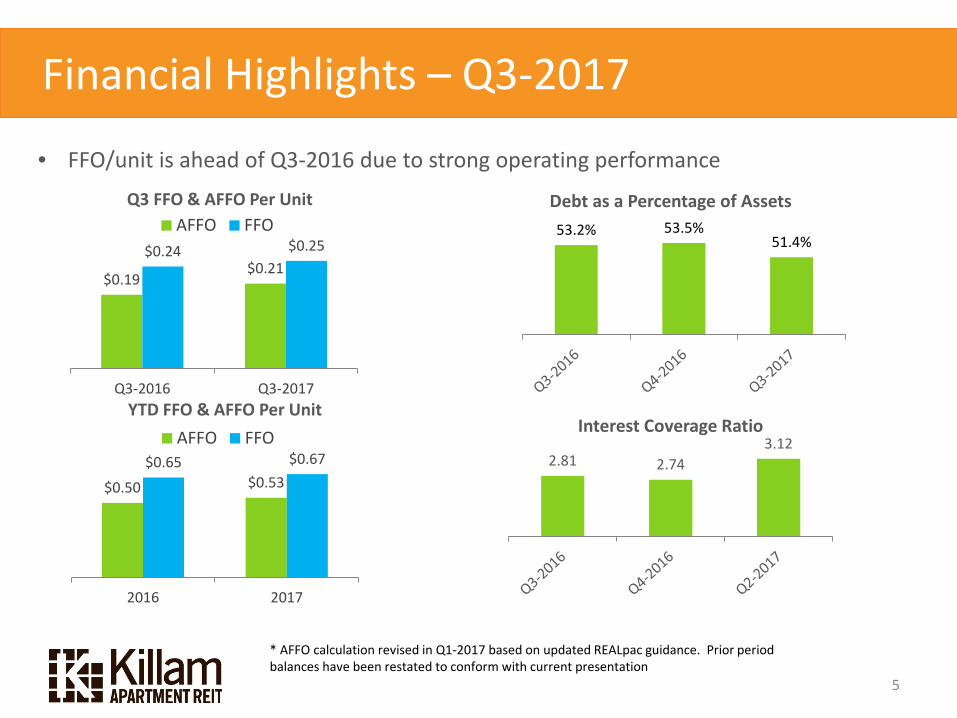
$0.19$0.21
$0.24 $0.25
Q3-2016 Q3-2017
Q3 FFO & AFFO Per UnitAFFO FFO
Financial Highlights – Q3-2017
5
$0.50 $0.53$0.65 $0.67
2016 2017
YTD FFO & AFFO Per UnitAFFO FFO
* AFFO calculation revised in Q1-2017 based on updated REALpac guidance. Prior period balances have been restated to conform with current presentation
53.2% 53.5%51.4%
Debt as a Percentage of Assets
2.81 2.743.12
Interest Coverage Ratio
• FFO/unit is ahead of Q3-2016 due to strong operating performance
Killam Apartment REITFinancial Highlights – Q3-20171.
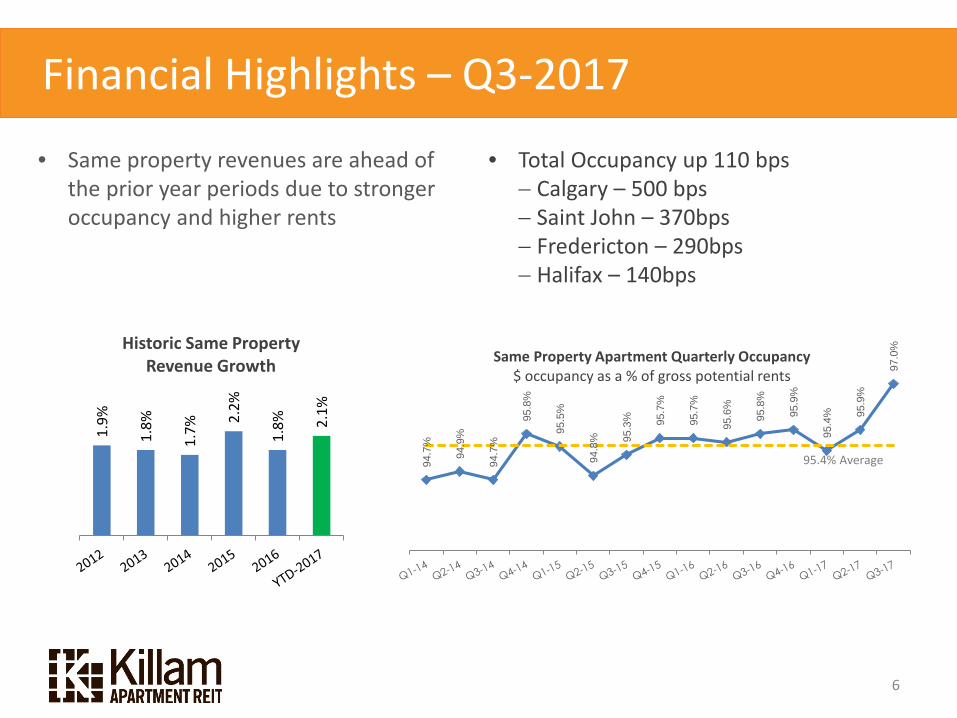
9%
1.8%
1.7%
2.2%
1.8% 2.
1%Historic Same Property
Revenue Growth
• Total Occupancy up 110 bps− Calgary – 500 bps− Saint John – 370bps− Fredericton – 290bps− Halifax – 140bps
6
94.7
%
94.9
%
94.7
%
95.8
%
95.5
%
94.8
% 95.3
% 95.7
%
95.7
%
95.6
%
95.8
%
95.9
%
95.4
% 95.9
%
97.0
%
Same Property Apartment Quarterly Occupancy$ occupancy as a % of gross potential rents
95.4% Average
• Same property revenues are ahead of the prior year periods due to stronger occupancy and higher rents
Financial Highlights – Q3-2017
7
2.9% 2.1%
(0.6%)
0.5%4.9%
3.2%
Q3 YTD
Same Property ResultsThree and nine months ended September 30, 2017
Revenue Expenses NOI

Financial Highlights – Q3-2017
8
-10.0%
-8.0%
-6.0%
-4.0%
-2.0%
0.0%
2.0%
4.0%
6.0%
8.0%
10.0%
Sep
12N
ov 1
2Ja
n 13
Mar
13
May
13
Jul 1
3Se
p 13
Nov
13
Jan
14M
ar 1
4M
ay 1
4Ju
l 14
Sep
14N
ov 1
4Ja
n 15
Mar
15
May
15
Jul 1
5Se
p 15
Nov
15
Jan
16M
ar 1
6M
ay 1
6Ju
l 16
Sep
16N
ov 1
6Ja
n 17
Mar
17
May
17
Jul 1
7Se
p 17% G
row
th
Quarter Ended
Historical Revenue and NOI GrowthRevenue NOI
Impacted by spike in natural gas prices in New England and Atlantic Canada
Benefited from lower heating fuel prices and consumption due to warmer than normal winter weather
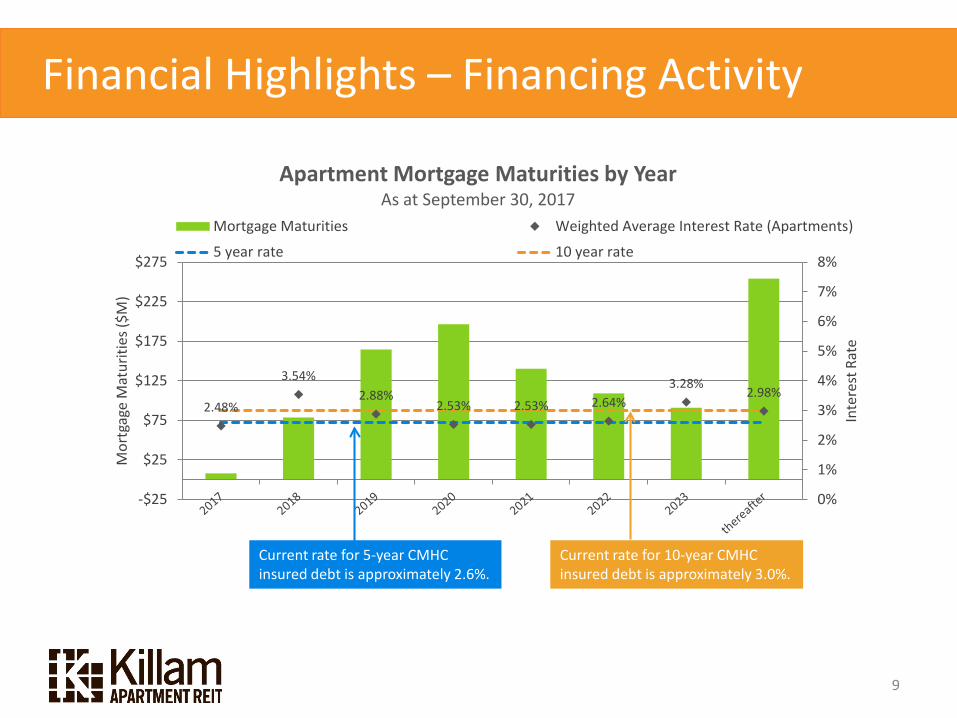
2.48%
3.54%2.88%
2.53% 2.53% 2.64%3.28%
2.98%
0%
1%
2%
3%
4%
5%
6%
7%
8%
-$25
$25
$75
$125
$175
$225
$275
Inte
rest
Rat
e
Mor
tgag
e M
atur
ities
($M
)
Apartment Mortgage Maturities by YearAs at September 30, 2017
Mortgage Maturities Weighted Average Interest Rate (Apartments)
5 year rate 10 year rate
9
Current rate for 5-year CMHC insured debt is approximately 2.6%.
Current rate for 10-year CMHC insured debt is approximately 3.0%.
Financial Highlights – Financing Activity
Killam Apartment REITKillam’s Strategy for Growth
10
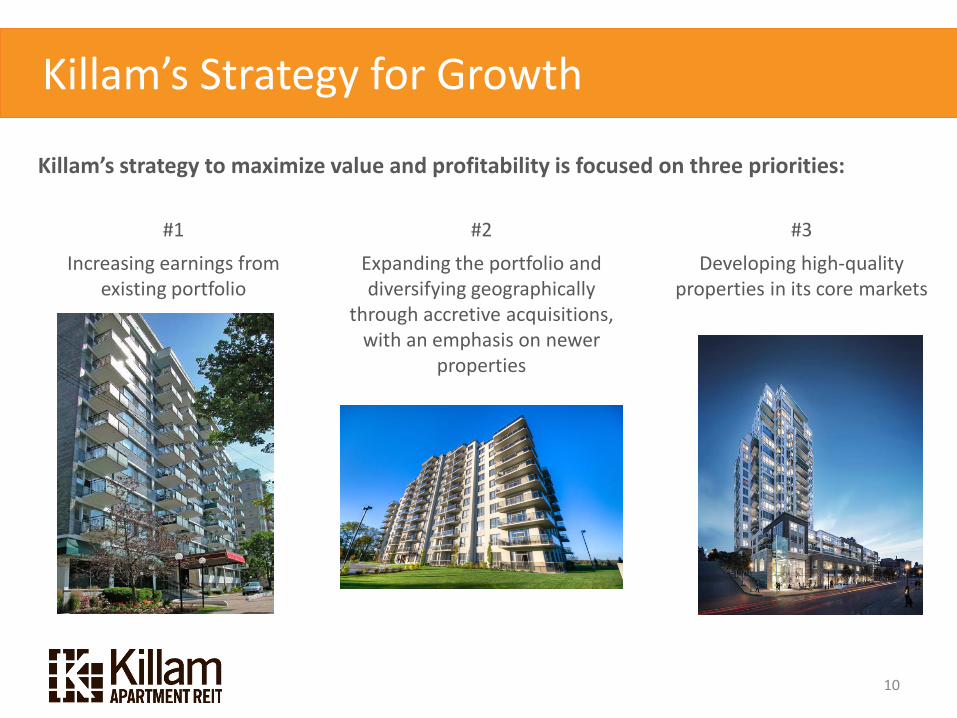
Killam’s strategy to maximize value and profitability is focused on three priorities:
#1Increasing earnings from
existing portfolio
#2Expanding the portfolio and diversifying geographically
through accretive acquisitions, with an emphasis on newer
properties
#3Developing high-quality
properties in its core markets
11
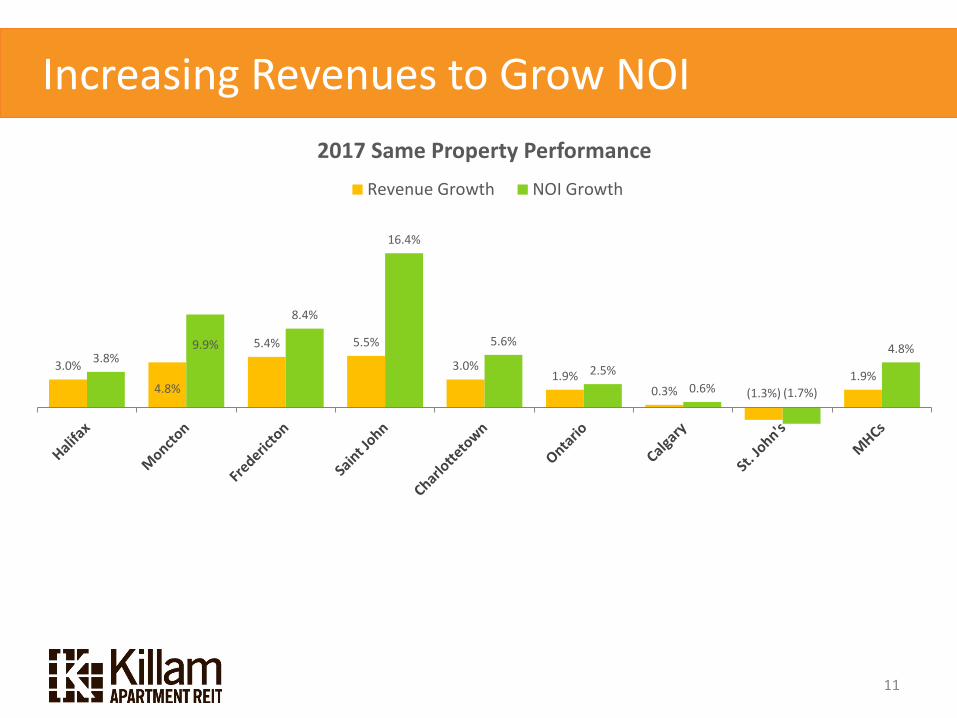
3.0%
4.8%
5.4% 5.5%
3.0%1.9%
0.3% (1.3%)1.9%
3.8%9.9%
8.4%
16.4%
5.6%
2.5%0.6% (1.7%)
4.8%
2017 Same Property PerformanceRevenue Growth NOI Growth
Increasing Revenues to Grow NOI

Killam Apartment REITManaging Expenses to Grow NOI
12
Five Year Plan 2017 – 2021Energy and Water Project Budget and Energy Intensity $/SF
a 30 cent reduction in $/F2 = $4.3M in expenses = 6 cents in FFO/Unit
$1.00
$1.10
$1.20
$1.30
$1.40
$1.50
$0
$750
$1,500
$2,250
$3,000
$3,750
2015 2016 2017 2018 2019 2020 2021
Ener
gy In
tens
ity ($
/SF)
Ener
gy P
roje
ct B
udge
t
Total project Cost (000s) Actual Cost (000s)
Energy Intensity Forecast ($/SF) Actual Energy Intensity ($/SF)
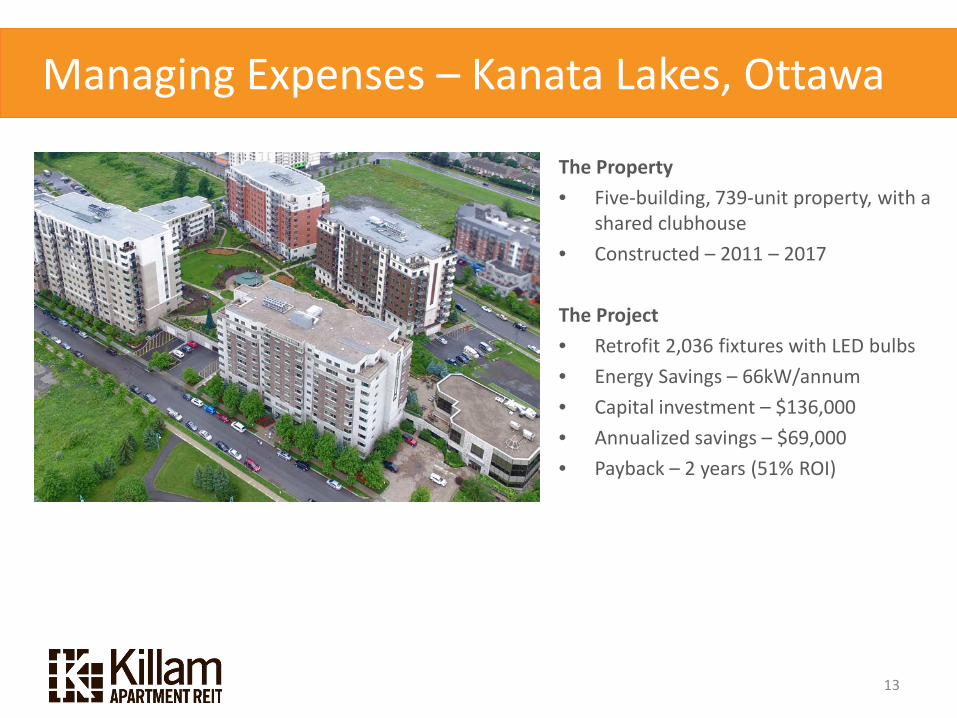
Managing Expenses – Kanata Lakes, Ottawa
13
The Property• Five-building, 739-unit property, with a
shared clubhouse• Constructed – 2011 – 2017
The Project• Retrofit 2,036 fixtures with LED bulbs• Energy Savings – 66kW/annum • Capital investment – $136,000• Annualized savings – $69,000• Payback – 2 years (51% ROI)

Killam Apartment REITRecap of 2017 Acquisitions
14
Property City UnitsSpruce Grove Calgary, AB 66Kanata Lakes Ottawa, Ont 134Innovation Drive Halifax, NS 134Waybury Park and Tisbury Crossing * Edmonton, AB 296
Total Apartment Acquisitions 630Cameron Heights - Development Land Edmonton, AB1459 Hollis Street - Commercial Halifax, NSGloucester - Development Plan Ottawa, OntOther Halifax, NS 5
Total Acquisitions 635
$1.1
$161.1
$178.9
$8.0
$67.5
$4.1
Acquisition Cost ($ millions)
$4.6
$12.8$49.2$31.6
• Killam has acquired ~$180 million of apartments and development sites in 2017
* Killam took possession of a portion of this property in August, investing $28.3 million. The second phase of this transaction ($39.2 million) is scheduled to close December 1, 2017.

The Alexander, Halifax
15
Rental Units: 240 units, 6,500 sf of retail space
Ownership: Killam 50%, Partners 50%
Start Date: Q3-2015
Projected Completion: Podium level completed October 1, 2017, tower completion in Q2-2018
Location: Downtown Halifax across from the waterfront
Cost: $37 million (Killam’s cost) ($295,833/ residential door)
Expected Yield: 5.1%
Expected Value: 4.5% cap rate
Average Unit Size: 740 sf
Average Rent: $1,770 ($2.39/sf)

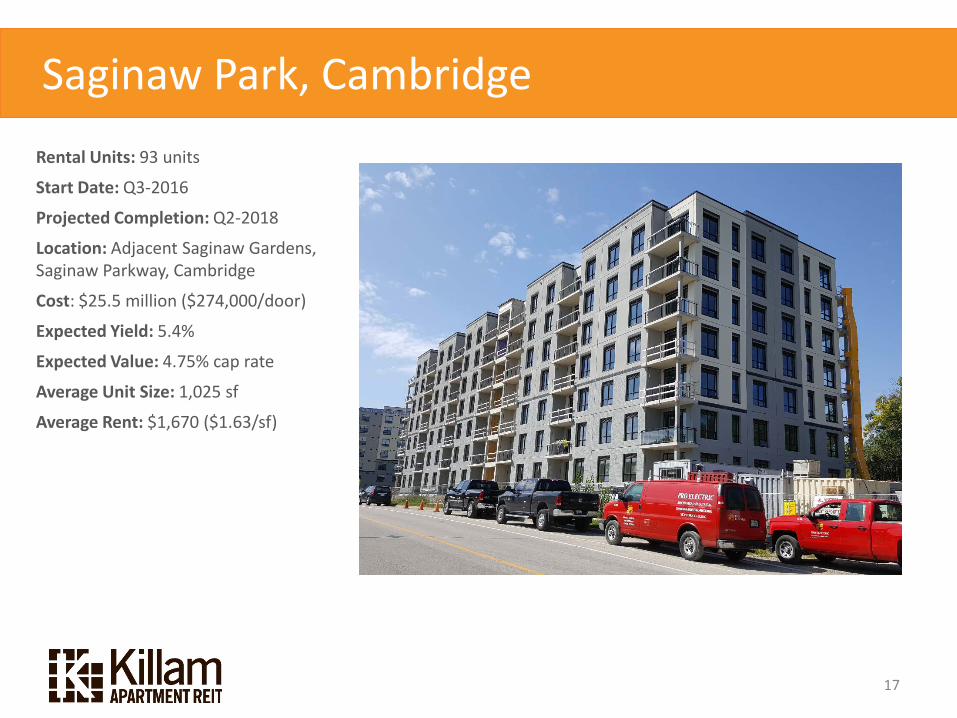
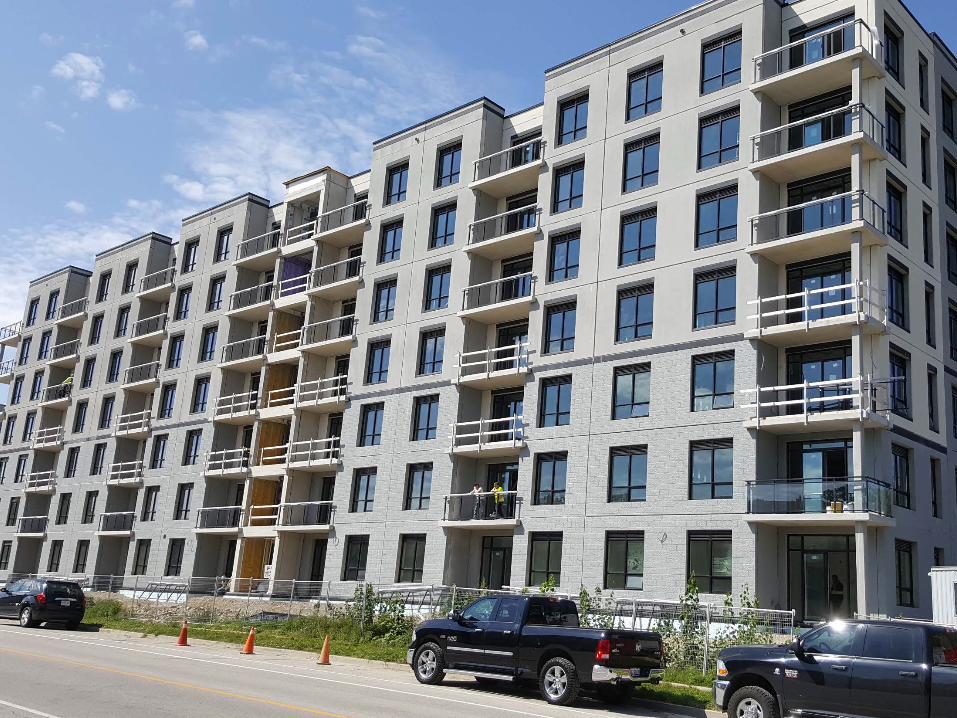
Future DevelopmentsSaginaw 2, Cambridge, ON
Rental Units: 93 units
Start Date: Q3-2016
Projected Completion: Q2-2018
Location: Adjacent Saginaw Gardens, Saginaw Parkway, Cambridge
Cost: $25.5 million ($274,000/door)
Expected Yield: 5.4%
Expected Value: 4.75% cap rate
Average Unit Size: 1,025 sf
Average Rent: $1,670 ($1.63/sf)
Saginaw Park, Cambridge
17
18

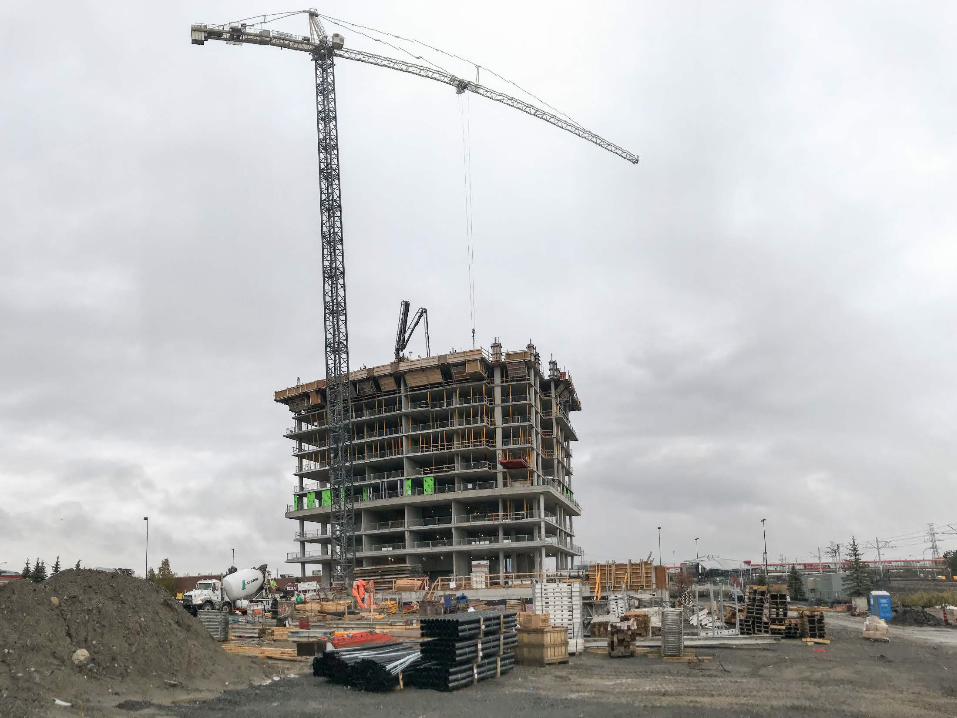
Gloucester City Centre (Phase 1), Ottawa
19
Rental Units: 227 units
Ownership: Killam 50%, RioCan 50%
Start Date: Q2-2017
Projected Completion: mid-2019
Location: Ottawa’s East End, adjacent Ottawa’s Light Rail Transit (LRT) Blair Station.
Cost: $36 million (Killam’s cost) ($327,000/ residential door)
Expected Yield: 5.0%
Expected Value: 4.0% cap rate
Average Unit Size: 789 square feet
Average Rent: $1,870 ($2.39/sf)
20

Development Pipeline
21
Property CityDevelopment Opportunities - 2018Carlton Terrace Halifax, NSSilver Spear* Mississauga, ON
Future Development Opportunities - 2018 and beyondThe Governor (Phase 2 of the Alexander) Halifax, NSCameron Heights Edmonton, ABGrid 5 Land* Calgary, ABTopsail Road St. John's, NLMedical Arts (Spring Garden) Halifax, NSBlock 4 St. John's, NLCarlton Houses Halifax, NSGloucester Phase 2-4 Ottawa, Ont
Total Development Opportunities* Represents Killam's 50% interest in potential development units.
225
Development Potential in
Units
200
104
48
64
309
199
1,489
80
190
70

Carlton Terrace, Halifax
22
Rental Units: 104 units
Ownership: Killam 100%
Start Date: Q2-2018
Projected Completion: mid-2020
Location: Downtown Halifax, NS
Preliminary Budget: $39 million
Expected Yield: 5.4%
Expected Value: 4.5% cap rate

Silver Spear, Mississauga
23
Rental Units: 128 units
Ownership: Killam 50%, Partners 50%
Start Date: Q2-2018
Projected Completion: mid-2020
Location: Mississauga, ON
Preliminary Budget: $39 million
Expected Yield: 5.4%
Expected Value: 4.0% cap rate


