Prepara ba Governu Austrália Departementu Mudansa Klima no Efisiénsia Enérjia Jullu 2012
Katálogu daduskoletanea no rejistu dadusAvaliasaun vulnerabilidade impaktu husi mudansa klima ba bee-rai-okos iha Timor-Leste
Samantha Dawson, Luke Wallace no Baskaran Sundaram
Record 2012/56 | GeoCat 73845
APPLYING GEOSCIENCE TO AUSTRALIA’S MOST IMPORTANT CHALLENGES www.ga.gov.au

Katálogu daduskoletanea no rejistu dadus
Avaliasaun vulnerabilidade impaktu husi mudansa klima ba bee-rai-okos iha Timor-Leste PREPARA BA GOVERNU AUSTRÁLIA DEPARTEMENTU MUDANSA KLIMA NO EFISIÉNSIA ENÉRJIA HUSI GEOSCIENCE AUSTRALIA Jullu 2012 husi Samantha Dawson, Luke Wallace no Baskaran Sundaram

Disclaimer: Relatóriu ne’e prepara ona husi Geoscience Australia ba Governu Austrália, reprezenta-nia Departementu Mudansa Klima no Efisiénsia Enérjia (DCCEE). Apoiu fundu ba prepara relatóriu ne’e fó husi Programa Asisténsia Stratéjia Adaptasaun, ne’ebé implementa husi DCCEE. Relatóriu ne’e inklui hanoin no rekomendasaun husi parte terseiru sira no la nesesariamente refleta hanoin husi Governu Australia, ka indika komitmentu polítika ka kauza asaun partikular ruma. Mezmu iha ona esforsu maka’as atu asegura integridade, prezisaun no konfiabilidade matéria ne’ebé hakerek iha dokumentu ne’e, nein-ida husi Commonwealth nomós Geoscience Australia garantia katak informasaun iha relatóriu ne’e ses husi erru no omisaun. Commonwealth no Geoscience Australia la simu forma liabilidade, tantu kontratuál, ekstrakontratuál ka forma selseluk, ba kontiúdu relatóriu ka konsekuénsia ruma hamosu husi utilizasaun ka konfiansa ruma fó ba ne’e. Matéria iha dokumentu ne’e hanesan informasaun jerál de’it, no iha intendementu katak Governu Austrália la fó akonsellamentu profesionál ba asuntu partikular. Molok atu halo asaun ka desizaun ruma bazeia ba materiá ne’e sani-nain sira tenke hetan konsellu propriu husi profesional independente. Nota Direitu-autor: © Commonwealth husi Austrália 2012 Servisu ne’e hetan lisensa tuir Creative Commons Attribution 3.0 Australia Licence. Atu hetan kopia lisensa ne’e, haré http://creativecommons.org/licenses/by/3.0/au/. Departementu Mudansa Klima no Efisiénsia Enérjia afirma direitu ba hetan rekoiñesimentu hanesan na’in ba direitu kopia husi matéria orijinál liu-hosi maneira tuir-mai:
© Commonwealth Austrália (Departementu Mudansa Klima no Efisiénsia Enérjia) 2012. ISSN 1448-2177 ISBN 978-1-922103-77-2 (PDF, Tetum) ISBN 978-1-922103-78-9 (Print, Tetum) ISBN 978-1-922103-65-9 (PDF, English) ISBN 978-1-922103-66-6 (Print, English) GeoCat # 73845 Bibliographic reference: Dawson, S., Wallace, L., and Sundaram, B., 2012. Katálogu daduskoletanea no rejistu dadus Timor-Leste - Avaliasaun vulnerabilidade impaktu husi mudansa klima ba bee-rai-okos iha Timor-Leste. Record 2012/56. Geoscience Australia: Canberra.
Katálogu daduskoletanea no rejistu dadus
Contents Dataset no Rejistu Dadus......................................................................................................................1
DOKUMENTaSAUN DADUS ........................................................................................................1 Metadata........................................................................................................................................1 Arkivu Readme .............................................................................................................................2
KAPTUTA DADUS .........................................................................................................................2 Administrasaun no Infra-Estrutura................................................................................................3 Klima ............................................................................................................................................3 Observasaun Rai no Imajinariu.....................................................................................................3 Elevasaun ......................................................................................................................................3 Hidrojeolojia no bee-rai-okos .......................................................................................................4 Hídrolójia ......................................................................................................................................4 Jeolojia ..........................................................................................................................................4 Informasaun Rai............................................................................................................................4 Hábitante Natural ..........................................................................................................................4 Mapa Laos-georeferensidu............................................................................................................5 Attachment 1: Data catalogue for data collected in Timor-Leste .................................................6 Attachment 2: ‘Readme’ files for the GA ArcGIS project..........................................................12 Attachment 3: Example of a metadata record from the Timor-Leste project .............................35
III

Katálogu daduskoletanea no rejistu dadus
IV
Katálogu daduskoletanea no rejistu dadus
Dataset no Rejistu Dadus Objetivu husi ‘Projetu Avaliasaun Impaktu husi Mudansa Klima ba Bee-rai-okos iha Timor-Leste’ mak atu harii kapasidade husi ajensia bee Timor-Leste hodi avalia, monitoriza no jere rekursu bee-rai-okos iha mudansa klima ida. Projetu ne’e inisiativu ida husi Governu Australia liu husi Programa Asistensia Estratejía Adaptasaun Pasifiku. Programa ne’e jere husi Departementu Mudansa Klima no Efisiensia Enerjia Governu Australia (DCCEE) no hanesan parte ida husi Inisiativu Adaptasaun Mudansa Klima Internasionál. Relatoriu ne’e aprezenta dataset ne’ebé rekolla ona ba projetu, metadata foun ba dataset hirak ne’e no prosesu manutensaun ba dataset refere iha futuru. Prosesu halibur no interpretasaun dataset nasionál ne’ebé dadaun ne’e eziste esensiál tebes ba avaliasaun no kompriendesaun kona-ba sistema bee-rai-okos iha Timor-Leste. Dataset ne’ebé halibur iha Timor-Leste mai husi departementu governu lubun ida. Seksaun Sistema Informasaun Jeografia Rai no Agríkola (ALGIS) husi Diresaun Nasionál Polítika no Planeamentu, Ministeriu Agrikultura no Peskás iha dadus barak ne’ebé pertinente ba projetu ida ne’e. Dataset tomak ne’ebé rekolla importante no relevante; oinsamós, dadus ne’e barak liu mai husi projetu oioin rai-liur iha pasadu no laiha katalógu dadus ne’ebé aprezenta husi departementu balun, nein metadata ruma ne’ebé aneksa ba dataset refere hodi identifika dadus saida deit ka arkivu ‘readme’ iha folder projetu ruma. Informasaun ida ne’e presiza kria husi Geoscience Australia molok dadus ne’e bele uza iha maneira efetivu ida (Figura 1) – katalógu arkivu dadus, ‘readme’ no ezemplu metadata aneksu. Dadus limitadu tebes, inklui informasaun bee-rai-okos, no iha dadus ne’e kualidade dadus ne’ebé disponivel menus ka kiik los. Primeiru, dadus ne’ebé disponivel iha Timor-Leste limitadu tamba istoria politiku: 1) dadus ne’ebé limitadu disponivel husi tempu Portugues; 2) dadus hotu ne’ebé rekolla durante períodu tempu governu Indonesia la-disponivel ba governu Timor-Leste; no 3) dadus ne’ebé rekolla hafoin independensia iha 1999, iha proporsaun bo’ot ne’ebé lakon durante krizi 2006. Dadus ne’ebé mak hela, barak esporádiku no nia funsaun fraku tebes tamba menus metadata ka informasaun ruma kona-ba oinsa halo no/ka rekolla dadus ne’e. Ezemplu, mezmu menus prosesu monitoriza bee-rai-okos ne’ebé halao ona iha Timor-Leste, iha relatóriu husi Banku Dezenvovimentu Aziatiku, ne’ebé publika iha tinan 2004 koalia kona-ba rekursu bee iha Timor-Leste, inklui bee-rai-okos. Mezmu kopia husi relatoriu ne’e ita bele hetan, dadus antesendentes tomak, numeru, ekuasaun no mapa-sira ne’ebé iha relatóriu refere lakon hotu durante krizi 2006. Hanesan mos, kuaze dataset rekolladu la-kompletu no ida ne’e kria problema balun wainhira dezeña metodolojía ida hodi investiga bee-rai-okos. DOKUMENTASAUN DADUS Metadata Metadata esensiálmente mak ‘dadus ba dadus’; nia halibur informasaun hanesan saida mak dataset, dadus ne’e halo horbainhira no nia objetivu saida, se mak nia autór, bainhira mak presiza hodi aktualiza dadus refere, data aktualizasaun ikus, eskálaun, ezatidaun, projeksaun jeografia, formatu arkivu no informasaun nesesaria sira seluk. Iha ArcGIS shapefiles hotu no rasters automatikamente jeneralizadu seksaun metadata hodi aneksa iha neba, ne’ebé ita bele hetan no aktualiza iha ArcCatalog. Importansia mak metadata labele deklara liu, partikularmente wainhira konsidera uza dadus refere ba ezistensia husi projetu ida. Ba user GIS ida, metadata mak pontu primeiru ba referensia hodi avalia karik dataset ne’e benefisia duni, karik informasaun ne’ebé eziste iha neba no nia nivel ezatidaun aseitavel, se mak nia autór no dadus ne’e atributu ba se, aktuálmente dadus ne’e bele uza ka lae, ka karik uza limitadu liu no karik informasaun ne’e aktuálizadu ona ka karik sei presiza rekolla dadus foun. Ne’eduni, karik dadus refere sei sérve no uza hafoin inisiu projetu remata, esensiál tebes katak parte balun husi seksaun metadata iha arkivu ArcGIS kompleta ona.
1

Katálogu daduskoletanea no rejistu dadus
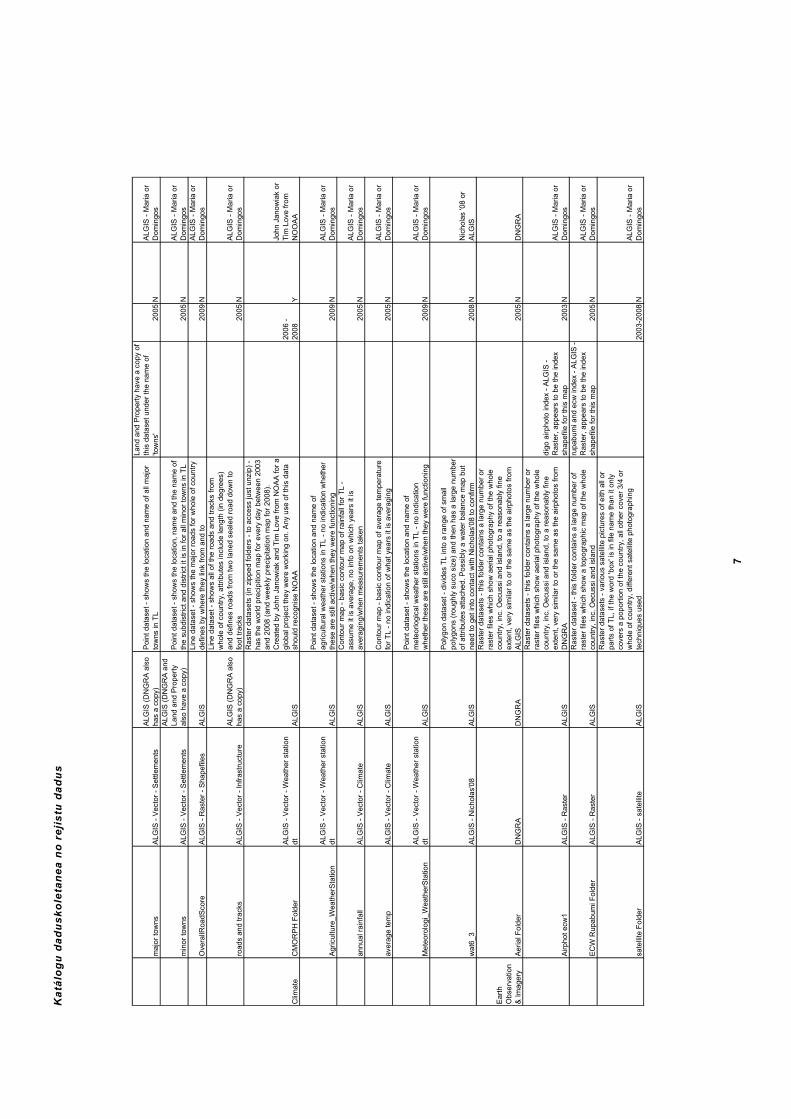
Husi shapefiles no rasters ne’ebé rekolla laiha ida mak iha informasaun iha seksaun metadata no ita la-bele buka hatene ka verifika dadus ne’e halo horbaihira, se mak halo, nia eskálaun saida no saida mak nia objetivu orijinadu wainhira halo dadus ne’e. Ba projetu ne’e molok análiza dadus, presiza ta’u hamutuk katálogu dadus ida no metadata ba kada arkivu verifikadu no dokumentadu. Servisu hirak ne’e han tempu no iha ejizensia kona-ba atensaun ba detalla ho nivel ida ne’ebé ás. Esensiálmente, nia presiza ezaminasaun no peskizasaun ba kada espasiál dataset hamutuk 69 ne’ebé rekolla durante projetu, dezigna dadus hirak ne’e iha pozisaun lojíku ida iha katálogu dadus no hatama metadata relevante ruma ne’ebé bele hetan ka kompriende husi ezaminasaun ida husi arkivu. Aleinde numeru kuantidade detalla kona-ba dadus ne’ebé ita la-hatene, barak hetan iha dataset, iha sirkuntánsia balun, servisu rua dadaun ne’e posivel kompleta ona ho padraun ida ne’ebé ás tebes. Tenki toma nota katak metadata no katálogu dadus ne’e barak liu mak mai husi asumsaun katak ita bele foti husi ezaminasaun dadus. Ida ne’e halakon duvida ba iha atributu balun ne’ebé hatama ba iha katálogu dadus no metadata, oinsamós ida ne’e hanesan esforsu diak ida ne’ebé posivel dadaun ne’e. Arkivu Readme Arkivu ‘readme’ mos iha komunidade GIS rekoñese hanesan metodu di’ak ida ba gravasaun arkivu no metodu GIS ne’ebe uza iha projetu ida. Esensiálmente arkivu ‘readme’ mak textu arkivu ida ne’ebé mak hetan iha kada folder/kategoria área iha projetu GIS ida. Jerálmente arkivu hirak ne’e kontein sumáriu kona-ba saida mak kontein iha folder no nia objetivu ba projetu, no bele mos fornese deskripsoens ba kada arkivu, dadus ne’e mai husi ne’ebé no etapa espesífiku ne’ebé uza hodi jeneraliza dadus. Ida ne’e sérve ba projetu nia vida no nia pasada, partikularmente wainhira administrador GIS rekorda ka grava metodu ne’ebé uza. Iha razoens multíplu ba ida ne’e maibe ida importante liu mak karik arkivu ruma ka nia folder tomak, korrompe ona, folder ka arkivu refere bele harii fila-fali uza informasaun iha arkivu ‘readme’. Ba projetu nia durasaun, wainhira iha metodu iha arkivu ‘readme’ signifika katak kualker ema ruma ne’ebé uza dadus ne’e fasil atu tuir no halo nia etapa ne’ebé foti hodi produz projetu nia outputs. Ida ne’e ajuda tebes hodi kompriende projetu tomak, aplika metodu ne’e ba projetu seluk ne’ebé hanesan no avalia nia kualidade no nia sérve husi projetu pasada ba projetu dadaun ne’e. Ho arkivu ‘readme’ ne’ebé kompletu hadia uzu ho diak no la-susar atu uza arkivu GIS iha projetu ida. Ba kada kategoria ne’ebé uza iha projetu, ne’ebé diskuti ona iha leten no sira seluk ne’ebé dezenvolve espesífiku ba projetu, arkivu ‘readme’ kria ona, inklui sumáriu husi folder, deskripsoens arkivu no esplisitu, metodu etapa ba etapa ba oinsa kria hodi halo dadus ruma. Katálogu dadus, seksaun metadata no arkivu ‘readme’ kompletadu ona ba projetu. Katálogu dadus (aneksa1) kompleta ona ba dadus tomak ne’ebé rekolla iha nasaun. Iha arkivu ne’ebé sérve hamutuk 69 mak ezaminadu no avaliadu. Arkivu ‘readme’ (aneksa 2) mak aktualizadu ba folder hotu, ba hirak ne’ebé deskreve ona iha leten nomós folder foun sira ne’ebé kria ona hanesan parte ida husi projetu. Ida ne’e inklui detalla metodolojia kona-ba dataset ne’ebé kria ona. Seksaun metadata kompleta ona ba projetu tomak iha Janeiru 2011 no inklui arkivu rekolladu no arkivu hirak ne’ebé produz husi projetu, ho total liu husi arkivu 100. Kada seksaun metadata nia naruk mak entre pajína 3 no 5 (haré aneksa 3 ba ezemplu husi seksaun metadata). Metodu ne’ebé uza hodi atinji ne’e aprezentadu iha Figura 1 iha karaik ne’e. KAPTUTA DADUS Maski problema oioin asosiadu ho koleksaun dadus, dadus sufisiente rekolla ona, ne’eduni projetu bele hakat ka lao ba oin. Dadus kategorizadu no dokumentadu iha katálogu dadus ida, ne’ebé mak esensiálmente lista dadus ida (ka arkivu) ne’ebé kontein informasaun hanesan naran arkivu, nia fatin, sumáriu deskripsaun dadus, nivel ezatidaun, eskálaun no dadus refere uza ba projetu saida. Katálogu
2
Katálogu daduskoletanea no rejistu dadus
dadus ida ne’e sei sai hanesan arkivu referensia ida no permite ema hotu ho lais no fasil atu buka no tau dadus ne’ebé mak relevante ba sira. Detalla husi dataset oioin ne’ebé rekolla durante Primeira Faze husi Projetu mak aprezenta iha Aneksa 1 no nia sumariu informativu mak dezeña iha karaik ne’e, separadu ba nia kategoria respetiva iha katálogu dadus Administrasaun no Infra-Estrutura Dataset ida ne’e mak kompletu. Iha dadus kona-ba estrada bo’ot, estrada ki’ik no tracks, sidade bo’ot no ki’ik no iha shapefiles balun ne’ebé fo detalla ba baliza administrasionál (fronteira nasionál, distritus, sub distritus no sst), maski laiha dadus kadastrais no iha dataset balun ne’ebé iha problema intermus hanaran no defini areas. Iha mos dataset ida ne’ebé parese relasiona ho óspital no jestaun kliniku no rekursu, maibe tamba naran husi arkivu hirak ne’e partikularmente laiha signifikasaun no laiha metadata, difisil atu garante. Klima Dadus klimatíku mak esporádiku no rekolladu deit durante kurtu prazu. Iha dadus klima balun ne’ebé foin lalais ne’e Diresaun Nasionál Rekursu Bee rekolla, maibe dadus ida ne’e rai iha formatu ida ne’ebé la-asesivel husi GA software. Iha dadus CMORPH/NOAA, ne’ebé iha mapa raster kona-ba presipitasaun lor-loron husi 2003-2008 ba mundiál iha eskálaun graus 0.25. Dadus ida ne’e sérve, maski iha eskálaun Timor-Leste, nia sei sai groseiru no tempu hodi prosesu dadus ida ne’e sei labele sukat. Ministériu Agrikultura no Peskás Timor-Leste iha Seksaun Agro-Meteorolojia ida ne’ebé husi 2004 to’o 2009, grava temperatura lor-loron minimu, masimu no meiu, rai-manas relativu minimu, masimu, no meiu, velosidade anin no evapotranspirasaun iha fatin 12 iha nasaun tomak. Ida ne’e sei sai dataset ne’ebé iha valór maibe nia gravasaun esporádiku liu, ho fulan balun ne’ebé nia loron laiha, sira seluk so grava deit loron ida ka rua no seluk fali iha fulan balun ne’ebé sein iha gravasaun uníku ida. Nomos, fatin ne’ebé halo monitoriza la korektu kuaze kazu tolu, iha mos duvida kona-ba kualidade husi dadus sira seluk. Iha shapefiles ba taxa udan anuál no temperatura ne’ebé mak ho mapa groseiru, oinsamós tamba menus metadata, ita lahatene mapa hirak ne’e halo horbaihira, tinan saida, no montante hirak, media hirak mak muda ona hafoin sira halo. Dataset seluk ne’ebé potensialmente sérve mak mapa polygon ne’ebé, husi ezaminasaun tabela atributu, dalaruma divizaun kona-ba oinsa bee ne’e uza iha nasaun tomak. Tamba laiha metadata no laiha informasaun deskriptivu ne’ebé sérve iha naran dataset ka atributu, dadus hirak ne’e labele uza ba projetu ida ne’e. Observasaun Rai no Imajinariu Iha imajen remota ne’eé bo’ot iha kategoria ida ne’e. Ne’e inklui fotografia husi ár ba nasaun tomak, mapa topografia ba nasaun tomak, espasu ne’ebé hatudu ksolok husi nasaun, imajen satelit ne’ebé kobre fatin tolu husi nasaun no imajen LANDSAT ne’ebé hatudu parte leste husi Dili. Imajen balun ne’e potensiamente sérve, maibe dala ida tan laiha informasaun kona-ba imajen hirak ne’e hasai horbaihira, husi se no nia objetivu saida. Tamba análiza imajen remota mak ámbitu husi projetu ida ne’e, dataset ida ne’e uza limitadu iha ne’e. Elevasaun Iha montante razoavel ba uza dadus rekolladu ba kategoria ida ne’e maibe sein iha metadata, laiha ezatidaun no fonte. Dadus rekolladu inklui liña contour, lina bathymetric, elevasaun raster (SRTM 3-second DEM –padraun dataset ne’ebé ita bele laran metin) ba nasaun tomak no área sira ne’ebé haleu, polygon shapefiles hafahe elevasaun no slope ba iha nivel ás, mediu no ki’ik, raster husi área erodible no elevasaun raster separadu no laiha informasaun kona-ba nia fonte. Husi ne’e SRTM 3-second DEM (Digital Elevation Model) mak sérve liu tamba dataset SRTM uza iha mundiál, ita hatene nia fonte nune’e ita bele laran metin ba dataset ida ne’e.
3
Katálogu daduskoletanea no rejistu dadus
Hidrojeolojia no bee-rai-okos Laiha dataset rekolladu ba kategoria ida ne’e, maski iha fiar katak iha servisu balun ne’ebé halao ona durante tempu Indonesia. Relatóriu Banku Dezenvolvimentu Aziatiku kona-ba rekursu bee kompleta ona iha tinan 2004, oinsamós nia antesedentes dadus tomak no mapa husi projetu ne’e lakon. Uluk liu husi servisu projetu ida ne’e laiha mapa hidrojeolojia no, mezmu iha koñesimentu balun kona-ba yielding aquifers ne’ebé ás, distribuisaun no kompriendesaun ba dadus ne’e limitadu maski uzu iha nivel ás no dependensia ba rekursu hirak iha Timor-Leste. Hídrolójia Iha dadus GIS ituan ne’ebé disponivel ba kategoria ida ne’e. Maski dadaun ne’e governu Norwegia servisu hamutuk ho Diresaun Jestaun Rekursu Bee Timor-Leste kona-ba jestaun no rekursu bee, projetu ida ne’e la uza GIS no laiha dadus GIS ne’ebé disponivel. Dadus rekolladu inklui seamask (polygon hafahe area husi tasi), polygons ba orgaun bee, watersheds no mota braiding (kuaze mota boot iha Timor-Leste tama iha kategoria mota braiding) no dataset polyline hatudu mota kiik-sira. Jeolojia Iha montante dadus razoavel ne’ebé disponivel ba kategoria ida ne’e, ne’ebé mak sorte tamba menus dadus bee-rai-okos signifika katak presiza laran metin ba dadus jeolojia. Maski, sei menus nafatin metadata, signifika katak ida ne’e difisil hodi buka hatene dadus hirak ne’e mai husi ne’ebé, tenki atributu ba see no nia grau konfidensia iha ne’ebé. Primeiru, iha mapa ‘ESCAP’, ne’ebé publika husi UN. Mapa ida ne’e eziste hanesan imajen laos-dijitál tamba nia scan husi kopia ne’ebé ema imprime husi departementu jeolojia Timor-Leste iha polygon shapefile ho titulu ‘jeolojia’ ne’ebé rai iha departementu balun. Maski nia groseiru, mapa ida ne’e iha detalla balun ba tabela atributu no bele uza, mezmu fonte husi dadus ita lahatene. Mapa ida ne’e hatudu versaun dijitál ida husi mapa ESCAP, tamba polygons kuaze hanesan, maski nia lejenda uza sistema klasifikasaun ne’ebé diferente. Polygon shapefile jeolojia sira seluk rekolla ona. Nia laiha informasaun kona-ba se mak kria dadus ne’e ka nia fonte informasaun mak se, maibe nia nivel detalla diak liu kompara ho mapa jeolojia sira seluk. Tabela atributu mos deskriptivu liu. Iha fiar katak mapa ne’e barak liu bazeia ba servisu husi Prof. Audley-Charles no Tobing, ho parte norte husi mapa ne’e Berry mak halo. Lahatene se mak kompila ka tau hamutuk nia versaun dijitál husi mapa ida ne’e ka kombinadu husi fontes oioin, bainhira mak halo no nia objetivu saida. Informasaun Rai Iha dadus ne’ebé razoavel ba kategoria ida ne’e. Arkivu tomak iha polygon dataset, esklui mapa raster ne’ebé hasai área husi erodibility ne’ebé ás halao husi Nicholas iha tinan 2008. Husi polygon dataset iha arkivu hasai área fertilidade ne’ebé ás, arkivu ne’ebé hatudu rai ne’ebé dadaun ne’e uza ka rai ne’ebe potensiadu uza iha futuru, arkivu ne’ebé define kobre rai, ida hatudu área ne’ebé iha natar, seluk fali hafahe slopes ba iha S, F ka M (ita asume ida ne’e signifika Steep, Flat ka Medium) no ida hatudu rai metan, suborders no klasifikasaun ne’ebé diak. Dataset balun labele deciphered tamba sira nia orijin ka objetivu. Maski dataset hirak ne’e balun importante hodi ajuda hasai no deskreve informasaun antesedentes, nia nivel sérve tun wainhira menus metadata no informasaun kona-ba dataset ne’e halo tamba saida ka halo iha ne’ebé no atu uza ba saida. Hábitante Natural Iha dataset ne’ebé ituan los iha kategoria ida ne’e, parese dadus hirak ne’ebe kria wainhira dezeña jardin nasionál, identifika área envairumentál signifikansia. Maski dala ida tan ho problema metadata, iha mós asuntu hanesan naran arkivu ambiguu ne’ebé halo nia potensia no objetivu uza difisil atu determina. Primeira dataset hanaran “BVA” no nia parese hatudu área protejidu ka área ne’ebé potensiálmente bele proteje/importansia envairumentál ne’ebé ás. Segundu dataset, hanaran “ESM”, hafahe nasaun ba área ne’ebé ás, medium no sensibilidade kiik, no ita asume ida ne’e signifika sensibilidade envairumentál maibe ida ne’e la reál. Arkivu terseira, hanaran BirdArea
4
Katálogu daduskoletanea no rejistu dadus
5
importante, asume hasai área ne’ebé ho importansia ás ka montante tipu birdlife ne’ebé hetan iha neba. Arkivu rua ne’ebé ikus mak “Landcover”, hasai uza rai iha nasaun tomak, no “Timor Coastal Marine Habitats Nth”, ne’ebé hafahe kosta norte no area liña kosta ba iha habitante marina, ezemplu, rai-henek tasi, ai-tasi no korál Mapa Laos-georeferensidu Ami identifika imajen balun ne’ebé bele hatudu iha ArcMap maibe seidauk georeferensiadu (fó koordinat hodi sira bele hatudu iha arkivu ArcGIS sira seluk) ita haré sira hanesan mapa ne’ebé scan ne’ebé seidauk georeferenced. Importante liu husi ida ne’e mak mapa jeolojia ESCAP ne’ebé scan durante tempu koleksaun husi Geoscience Australia iha projetu dadaun ne’e husi departementu jeolojia no halo ona georeferenced. Mapa sira seluk ne’ebé laos pertinente ba projetu ne’e inklui: area-sira agrikulturál mos hatudu fatin sampling husi survey halao iha tinan 2008; zona agro-klimatiku; udan anuál (ne’ebé hanesan ho arkivu GIS ne’ebé deskreve iha leten); bathymetry saida mak hatudu iha southern coastline; mapa ida hanaran forest_status ne’ebé hasai área settlements, ne’ebé ai-laran iha no uza ba saida; soil taxonomy; subdistritu no mapa ida hanaran ‘Copy of steve_dunn’, maibe titulu ‘The Proposed Refrigerator (cold chain) Lokasaun husi Sub Distritu’ ne’ebé hatudu fatin baziku ho Pontus identifikadu balun. Mapa ikus ida ne’e ilustra tamba sa mak hanaran, metadata no katálogu dadus importante hotu – sein buat hirak ne’e, mapa ida ne’e lakon nia uzu no ida sei labele esplika tamba sa mak hasai mapa ne’e.

Ka
tálo
gu
da
du
sk
ole
tan
ea
no
re
jis
tu d
ad
us
Att
ac
hm
en
t 1
: D
ata
ca
talo
gu
e f
or
da
ta c
oll
ec
ted
in
Tim
or-
Le
ste
C
ateg
ory
Sp
atia
l Dat
aset
Nam
eL
oca
tio
n in
dep
artm
ent
fold
ers
Dep
artm
ent/
Bra
nch
/C
ust
od
ian
Dat
aset
det
ails
Du
plic
ate
dat
aset
s (u
nd
er
dif
fere
nt
nam
e)
Yea
r L
ast
Mo
dif
ied
/p
oss
ibly
cr
eate
d
Met
adat
a Y
/N
(pri
or
to
rece
ivin
g)
Co
nta
ct
Adm
in &
In
fras
truc
ture
adm
in_d
istr
ict
ALG
IS -
Vec
tor
- A
dmin
istr
ativ
eA
LGIS
Pol
ygon
dat
aset
- s
how
s th
e di
stric
ts o
f TL
by n
ame
2006
NA
LGIS
- M
aria
or
Dom
ingo
s
adm
in_j
aco
ALG
IS -
Vec
tor
- A
dmin
istr
ativ
eA
LGIS
Pol
ygon
dat
aset
- s
how
s th
e su
cos
by s
uco
nam
e,
subd
istr
ict,
dist
rict a
nd h
as a
rea
of s
uco
in h
ecta
res
2006
NA
LGIS
- M
aria
or
Dom
ingo
s
adm
in_s
ubdi
stric
tA
LGIS
- V
ecto
r -
Adm
inis
trat
ive
ALG
IS
Pol
ygon
dat
aset
- s
how
s th
e su
bdis
tric
ts b
y na
me
- di
ffere
nt to
the
othe
r su
bdis
tric
t dat
aset
, no
way
of t
ellin
g w
hich
is c
orre
ct o
ne a
t the
mom
ent
Dat
aset
cal
led
adm
in_s
ubdi
stric
t_C
lip s
eem
s to
be
exa
ctly
the
sam
e bu
t cre
ated
in
2009
2006
NA
LGIS
- M
aria
or
Dom
ingo
s
adm
in_s
ucos
ALG
IS -
Vec
tor
- A
dmin
istr
ativ
eA
LGIS
Pol
ygon
dat
aset
- s
how
s th
e su
cos
by s
uco
nam
e,
subd
istr
ict,
dist
rict a
nd h
as a
rea
of s
uco
in h
ecta
res
DN
GR
A h
as a
cop
y bu
t und
er th
e na
me
'adm
in'
2009
NA
LGIS
- M
aria
or
Dom
ingo
s
coas
tline
and
nat
iona
l bou
ndar
yA
LGIS
- V
ecto
r -
Adm
inis
trat
ive
ALG
IS (
DN
GR
A a
lso
has
a co
py)
Pol
ygon
dat
aset
- s
how
s th
e fo
ur p
olyg
ons/
isla
nds/
area
s of
the
TL
natio
nal b
ound
ary,
no
nam
es b
ut d
oes
have
ar
ea in
hec
tare
s, s
q ki
lom
eter
s an
d pe
rimet
er (
not s
ure
wha
t in)
2005
NA
LGIS
- M
aria
or
Dom
ingo
s
oecu
sse
ALG
IS -
Vec
tor
- A
dmin
istr
ativ
eA
LGIS
Pol
ygon
dat
aset
- s
how
s th
e su
cos
of O
ecus
si b
y na
me,
su
bdis
tric
t, di
stric
t and
are
a in
hec
tare
s20
06N
ALG
IS -
Mar
ia o
r D
omin
gos
oecu
sse_
ocap
ALG
IS -
Vec
tor
- A
dmin
istr
ativ
eA
LGIS
Pol
ygon
dat
aset
- s
how
s th
e su
cos
of O
ecus
si b
y na
me,
su
bdis
tric
t, di
stric
t and
are
a in
hec
tare
s bu
t has
less
suc
os
than
the
oecu
sse
data
set (
abov
e)20
06N
ALG
IS -
Mar
ia o
r D
omin
gos
old
suco
s 20
01A
LGIS
- V
ecto
r -
Adm
inis
trat
ive
ALG
IS
Pol
ygon
dat
aset
- s
how
s th
e su
cos
as th
ey e
xist
ed in
20
01 b
y su
co n
ame,
sub
dist
rict,
dist
rict a
nd h
as a
rea
of
suco
s in
deg
rees
and
hec
tare
s20
06N
ALG
IS -
Mar
ia o
r D
omin
gos
regi
ons
ALG
IS -
Vec
tor
- A
dmin
istr
ativ
eA
LGIS
Pol
ygon
dat
aset
- s
how
s th
e re
gion
s of
TL
and
they
are
nu
mbe
red
- no
t nam
ed20
05N
ALG
IS -
Mar
ia o
r D
omin
gos
subd
istr
ict_
no e
rror
ALG
IS -
Vec
tor
- A
dmin
istr
ativ
eA
LGIS
Pol
ygon
dat
aset
- s
how
s th
e su
bdis
tric
ts b
y na
me
but w
ith
som
e di
ffere
nces
to th
e ot
her
subd
istr
ict d
atas
et -
no
way
of
telli
ng w
hich
is c
orre
ct o
ne a
t the
mom
ent
2008
NA
LGIS
- M
aria
or
Dom
ingo
s
surr
ound
ings
ALG
IS -
Vec
tor
- A
dmin
istr
ativ
eA
LGIS
(D
NG
RA
als
o ha
s a
copy
)P
olyg
on d
atas
et -
sho
ws
TL
and
the
surr
ound
ing
isla
nds
by n
ame
and
area
in h
ecta
res
2006
NA
LGIS
- M
aria
or
Dom
ingo
s
2002
scho
ols
ALG
IS -
Vec
tor
- In
fras
truc
ture
ALG
IS (
DN
GR
A a
lso
has
a co
py)
Poi
nt d
atas
et -
sho
ws
the
scho
ol lo
catio
ns, n
ames
and
ty
pes
2005
NA
LGIS
- M
aria
or
Dom
ingo
s
chc
new
ALG
IS -
Vec
tor
- In
fras
truc
ture
-
Hea
lth F
acili
ties
- C
HC
New
ALG
IS
Poi
nt d
atas
et -
CH
C s
tand
s fo
r C
omm
unity
Hel
ath
Cen
tre
whi
ch a
re n
ot th
e sa
me
as h
ospi
tals
, attr
ibut
e ta
ble
is v
ery
deta
iled
inc
staf
f num
bers
, mor
bidi
ty r
ates
, etc
2005
NA
LGIS
- M
aria
or
Dom
ingo
s
ham
lets
ALG
IS -
Vec
tor
- S
ettle
men
ts
ALG
IS (
DN
GR
A a
nd
Land
and
Pro
pert
y al
so h
ave
a co
py)
Poi
nt d
atas
et -
sho
ws
the
loac
atio
n an
d na
me
of h
amle
ts
acro
ss T
L20
05N
ALG
IS -
Mar
ia o
r D
omin
gos
hous
ehlo
ld_p
oint
s200
4A
LGIS
- V
ecto
r -
Set
tlem
ents
ALG
ISP
oint
dat
aset
- s
how
s th
e lo
catio
ns o
f hou
ses
and
num
ber
of p
eopl
e in
eac
h, p
roba
bly
from
200
4 ce
nsus
2006
NA
LGIS
- M
aria
or
Dom
ingo
s
hp a
nd m
o ne
ww
ALG
IS -
Vec
tor
- In
fras
truc
ture
-
Hea
lth F
acili
ties
- H
P&
MC
ALG
IS
Poi
nt d
atas
et -
not
sur
e w
hat H
p &
MC
sta
nd fo
r bu
t ap
pear
s to
be
rang
e or
may
ble
all o
f TL
heal
th fa
cilit
ies,
at
trib
ute
tabl
e is
det
aile
d, in
c ow
ner,
whe
ther
CH
C
cert
ified
(w
heth
er th
ere
is a
Com
mun
ity H
ealth
Cen
tre
ther
e), e
tc20
05N
ALG
IS -
Mar
ia o
r D
omin
gos
hpt a
nd c
l fix
ALG
IS -
Vec
tor
- In
fras
truc
ture
-
Hea
lth F
acili
ties
- H
PT
&C
LA
LGIS
Poi
nt d
atas
et -
not
sur
e w
hat H
PT
and
CL
stan
d fo
r bu
t ap
pear
s to
be
a ra
nge
or m
aybe
all
of T
L he
alth
faci
litie
s,
attr
ibut
e ta
ble
is d
etai
led
inc
nam
e, o
wne
r, e
quip
men
t (eg
x-
ray
faci
litie
s, e
tc20
05N
ALG
IS -
Mar
ia o
r D
omin
gos
6
Ka
tálo
gu
da
du
sk
ole
tan
ea
no
re
jis
tu d
ad
us
maj
or to
wns
ALG
IS -
Vec
tor
- S
ettle
men
tsA
LGIS
(D
NG
RA
als
o ha
s a
copy
)P
oint
dat
aset
- s
how
s th
e lo
catio
n an
d na
me
of a
ll m
ajor
to
wns
in T
L
Land
and
Pro
pert
y ha
ve a
cop
y of
th
is d
atas
et u
nder
the
nam
e of
'to
wns
'20
05N
ALG
IS -
Mar
ia o
r D
omin
gos
min
or to
wns
ALG
IS -
Vec
tor
- S
ettle
men
ts
ALG
IS (
DN
GR
A a
nd
Land
and
Pro
pert
y al
so h
ave
a co
py)
Poi
nt d
atas
et -
sho
ws
the
loca
tion,
nam
e an
d th
e na
me
of
the
subd
istr
ict a
nd d
istr
ict i
t is
in fo
r al
l min
or to
wns
in T
L20
05N
ALG
IS -
Mar
ia o
r D
omin
gos
Ove
rallR
oadS
core
ALG
IS -
Ras
ter
- S
hape
files
ALG
ISLi
ne d
atas
et -
sho
ws
the
maj
or r
oads
for
who
le o
f cou
ntry
de
fines
by
whe
re th
ey li
nk fr
om a
nd to
2009
NA
LGIS
- M
aria
or
Dom
ingo
s
road
s an
d tr
acks
ALG
IS -
Vec
tor
- In
fras
truc
ture
ALG
IS (
DN
GR
A a
lso
has
a co
py)
Line
dat
aset
- s
how
s al
l of t
he r
oads
and
trac
ks fr
om
who
le o
f cou
ntry
, attr
ibut
es in
clud
e le
ngth
(in
deg
rees
) an
d de
fines
roa
ds fr
om tw
o la
ned
seal
ed r
oad
dow
n to
fo
ot tr
acks
2005
NA
LGIS
- M
aria
or
Dom
ingo
s
Clim
ate
CM
OR
PH
Fol
der
ALG
IS -
Vec
tor
- W
eath
er s
tatio
n dt
ALG
IS
Ras
ter
data
sets
(in
zip
ped
fold
ers
- to
acc
ess
just
unz
ip)
- ha
s th
e w
orld
pre
cipi
tion
map
for
ever
y da
y be
twee
n 20
03
and
2008
(an
d w
eekl
y pr
ecip
itatio
n m
ap fo
r 20
08).
C
reat
ed b
y Jo
hn J
anow
iak
and
Tim
Lov
e fr
om N
OA
A fo
r a
glob
al p
roje
ct th
ey w
ere
wor
king
on.
Any
use
of t
his
data
sh
ould
rec
ogni
se N
OA
A20
06 -
20
08Y
John
Jan
owia
k or
T
im L
ove
from
N
OO
AA
Agr
icul
ture
_Wea
ther
Sta
tion
ALG
IS -
Vec
tor
- W
eath
er s
tatio
n dt
ALG
IS
Poi
nt d
atas
et -
sho
ws
the
loca
tion
and
nam
e of
ag
ricul
tura
l wea
ther
sta
tions
in T
L -
no in
dica
tion
whe
ther
th
ese
are
still
act
ive/
whe
n th
ey w
ere
func
tioni
ng20
09N
ALG
IS -
Mar
ia o
r D
omin
gos
annu
al r
ainf
all
ALG
IS -
Vec
tor
- C
limat
eA
LGIS
Con
tour
map
- b
asic
con
tour
map
of r
ainf
all f
or T
L -
assu
me
it is
ave
rage
, no
info
on
whi
ch y
ears
it is
av
erag
ing/
whe
n m
easu
rem
ents
take
n20
05N
ALG
IS -
Mar
ia o
r D
omin
gos
aver
age
tem
pA
LGIS
- V
ecto
r -
Clim
ate
ALG
ISC
onto
ur m
ap -
bas
ic c
onto
ur m
ap o
f ave
rage
tem
pera
ture
fo
r T
L -
no in
dica
tion
of w
hat y
ears
it is
ave
ragi
ng20
05N
ALG
IS -
Mar
ia o
r D
omin
gos
Met
eoro
logi
_Wea
ther
Sta
tion
ALG
IS -
Vec
tor
- W
eath
er s
tatio
n dt
ALG
IS
Poi
nt d
atas
et -
sho
ws
the
loca
tion
and
nam
e of
m
eteo
rlogi
cal w
eath
er s
tatio
ns in
TL
- no
indi
catio
n w
heth
er th
ese
are
still
act
ive/
whe
n th
ey w
ere
func
tioni
ng20
09N
ALG
IS -
Mar
ia o
r D
omin
gos
wat
6_3
ALG
IS -
Nic
hola
s'08
ALG
IS
Pol
ygon
dat
aset
- d
ivid
es T
L in
to a
ran
ge o
f sm
all
poly
gons
(ro
ughl
y su
co s
ize)
and
then
has
a la
rge
num
ber
of a
ttrib
utes
atta
ched
. Pos
sibl
y a
wat
er b
alan
ce m
ap b
ut
need
to g
et in
to c
onta
ct w
ith N
icho
las'
08 to
con
firm
2008
NN
icho
las
'08
or
ALG
IS
Ear
th
Obs
erva
tion
& Im
ager
yA
eria
l Fol
der
DN
GR
AD
NG
RA
Ras
ter
data
sets
- th
is fo
lder
con
tain
s a
larg
e nu
mbe
r or
ra
ster
file
s w
hich
sho
w a
eria
l pho
togr
aphy
of t
he w
hole
co
untr
y, in
c. O
ecus
si a
nd is
land
, to
a re
ason
ably
fine
ex
tent
, ver
y si
mila
r to
or
the
sam
e as
the
airp
hoto
s fr
om
ALG
IS20
05N
DN
GR
A
Airp
hot e
cw1
ALG
IS -
Ras
ter
ALG
IS
Ras
ter
data
sets
- th
is fo
lder
con
tain
s a
larg
e nu
mbe
r or
ra
ster
file
s w
hich
sho
w a
eria
l pho
togr
aphy
of t
he w
hole
co
untr
y, in
c. O
ecus
si a
nd is
land
, to
a re
ason
ably
fine
ex
tent
, ver
y si
mila
r to
or
the
sam
e as
the
airp
hoto
s fr
om
DN
GR
A
digo
airp
hoto
inde
x -
ALG
IS -
R
aste
r, a
ppea
rs to
be
the
inde
x sh
apef
ile fo
r th
is m
ap20
03N
ALG
IS -
Mar
ia o
r D
omin
gos
EC
W R
upab
umi F
olde
rA
LGIS
- R
aste
rA
LGIS
Ras
ter
data
set -
this
fold
er c
onta
ins
a la
rge
num
ber
of
rast
er fi
les
whi
ch s
how
a to
pogr
aphi
c m
ap o
f the
who
le
coun
try,
inc.
Oec
ussi
and
isla
nd
rupa
bum
i and
ecw
inde
x -
ALG
IS -
R
aste
r, a
ppea
rs to
be
the
inde
x sh
apef
ile fo
r th
is m
ap20
05N
ALG
IS -
Mar
ia o
r D
omin
gos
sate
llite
Fol
der
ALG
IS -
sat
ellit
eA
LGIS
Ras
ter
data
sets
- v
ario
us s
atel
lite
pict
ures
of e
ith a
ll or
pa
rts
of T
L, if
the
wor
d 'b
ox' i
s in
file
nam
e th
an it
onl
y co
vers
a p
opor
tion
of th
e co
untr
y, a
ll ot
her
cove
r 3/
4 or
w
hole
of c
ount
ry, d
iffer
ent s
atel
lite
phot
ogra
phin
g te
chni
ques
use
d20
03-2
008
NA
LGIS
- M
aria
or
Dom
ingo
s
7

Ka
tálo
gu
da
du
sk
ole
tan
ea
no
re
jis
tu d
ad
us
geor
ef s
pace
shu
ttle
shad
ed
relie
fA
LGIS
- R
aste
r -
Spa
ce S
huttl
eA
LGIS
(D
NG
RA
als
o ha
s a
copy
)R
aste
r da
tase
t - r
elie
f pic
ture
of w
hole
cou
ntry
(no
val
ues
atta
ched
)20
05N
ALG
IS -
Mar
ia o
r D
omin
gos
LAN
DS
AT
_742
mos
aic
Fol
der
ALG
ISA
LGIS
Ras
ter
data
set -
land
sat r
aste
r to
a fa
irly
coar
se r
esol
utio
n -
show
s th
e co
untr
y to
the
Eas
t of D
ili b
ut n
o fu
rthe
r w
est
than
the
wes
tern
out
skirt
s of
Dili
. Als
o sh
ows
land
sat f
or
regi
on to
the
Eas
t of m
ainl
and
Tim
or in
clud
ing
PN
G a
nd
isla
nds
furt
her
east
than
PN
G20
02N
ALG
IS -
Mar
ia o
r D
omin
gos
Ele
vatio
n10
0 m
cou
ntou
rsA
LGIS
- V
ecto
r -
Ele
vatio
nA
LGIS
(D
NG
RA
als
o ha
s a
copy
)C
onto
ur d
atas
et -
con
tour
map
of e
leva
tion
in 1
00m
hie
ght
inte
rval
s fo
r w
hole
cou
ntry
2005
NA
LGIS
- M
aria
or
Dom
ingo
s
bath
_tim
orA
LGIS
- V
ecto
r -
TL
ALG
IS
Con
tour
dat
aset
- c
onto
ur m
ap o
f bat
hym
etric
s ar
ound
w
hole
of T
L an
d re
gion
, con
tour
s ar
e at
dep
th (
m)
inte
rval
s of
0, 1
00, 2
00, 5
00, 1
000
and
then
eve
ry 5
00m
to
4500
2008
NA
LGIS
- M
aria
or
Dom
ingo
s
Bat
hym
etry
_San
dwel
lA
LGIS
- S
RT
MA
LGIS
Ras
ter
Dat
aset
- b
athy
met
ric m
ap o
f who
le w
orld
2008
-200
9N
ALG
IS -
Mar
ia o
r D
omin
gos
elev
atio
nA
LGIS
- V
ecto
r -
Ele
vatio
nA
LGIS
(D
NG
RA
als
o ha
s a
copy
)
Pol
ygon
dat
aset
- p
olyg
on m
ap w
hich
div
ides
ele
vatio
n in
ot 7
cat
egor
ies
- as
sum
ing
low
es to
hig
htes
but
no
info
rmat
ion
on s
ize
of c
ateg
orie
s/di
visi
on o
f hei
ghts
2005
NA
LGIS
- M
aria
or
Dom
ingo
s
erod
ible
2A
LGIS
- N
icho
las'
08A
LGIS
Pol
ygon
dat
aset
- c
ount
ry d
ivid
ed in
to tw
o ty
pes
of
poly
gon;
hgi
h er
odib
ility
and
no
data
, no
info
on
how
this
w
as m
ade
or u
sing
wha
t dat
aset
s20
08N
ALG
IS -
Mar
ia o
r D
omin
gos
slop
esA
LGIS
- V
ecto
r -
Ele
vatio
nA
LGIS
Pol
ygon
dat
aset
- m
ap o
f who
le c
ount
ry, d
ivid
es a
reas
in
to a
slo
pe fo
S, F
or
M (
assu
min
g st
eep,
flat
or
med
ium
) po
lygo
ns a
re la
rge
and
coar
se20
05N
ALG
IS -
Mar
ia o
r D
omin
gos
SR
TM
_Ele
vatio
nA
LGIS
- S
RT
MA
LGIS
Ras
ter
data
set -
srt
m e
leva
tion
rast
er fo
r w
hole
cou
ntry
2008
NA
LGIS
- M
aria
or
Dom
ingo
s
timor
2A
LGIS
- N
icho
las'
08A
LGIS
Ras
ter
data
set -
ras
ter
elev
atio
n da
tase
t for
the
who
le o
f co
untr
y, n
ot s
ure
of s
ourc
e/ac
cura
cy to
a fa
irly
fine
reso
lutio
n20
08N
ALG
IS -
Mar
ia o
r D
omin
gos
Hyd
rolo
gybr
aidi
ng r
iver
beds
ALG
IS -
Vec
tor
- hy
drol
ogy
ALG
IS (
DN
GR
A a
lso
has
a co
py)
Pol
ygon
dat
aset
- p
olgy
ons
of r
iver
bed
of b
raid
ed r
iver
s fo
r w
hole
of c
ount
ry -
alm
ost a
ll m
ajor
riv
ers
in T
L ar
e br
aide
d riv
ers
- no
riv
er n
ames
atta
ched
2005
NA
LGIS
- M
aria
or
Dom
ingo
s
river
sA
LGIS
- V
ecto
r -
hydr
olog
yA
LGIS
(D
NG
RA
als
o ha
s a
copy
)
Line
dat
aset
- s
how
s riv
er c
ours
es fo
r w
hole
of c
ount
ry,
alm
ost a
ll of
thes
e riv
ers
feed
into
the
brai
ded
river
s, n
o riv
er n
ames
atta
ched
2005
NA
LGIS
- M
aria
or
Dom
ingo
s
seam
ask
ALG
IS -
Vec
tor
- hy
drol
ogy
ALG
ISP
olyg
on d
atas
et -
one
pol
ygon
out
linin
g se
a ar
eas
for
who
le o
f cou
ntry
/reg
ion
2005
NA
LGIS
- M
aria
or
Dom
ingo
s
wat
erbo
dies
ALG
IS -
Vec
tor
- hy
drol
ogy
ALG
IS (
DN
GR
A a
lso
has
a co
py)
Pol
gyon
dat
aset
- p
olyg
ons
of th
e w
ater
bodi
es (
ther
e ar
e no
t man
y w
ater
bod
ies
in T
L) n
o fe
atur
es n
amed
2005
NA
LGIS
- M
aria
or
Dom
ingo
s
wat
ersh
eds
ALG
IS -
Vec
tor
- hy
drol
ogy
ALG
IS
Pol
ygon
dat
aset
- p
olyg
ons
of th
w w
ters
heds
in T
L, c
over
s w
hole
of c
ount
ry, a
ttrib
utes
incl
ude
catc
hmen
t nam
e, s
ize
in h
ecta
res
and
clas
s (e
g sm
all c
atch
men
t, a
ggre
gate
ca
tchm
ent,
etc.
2005
NA
LGIS
- M
aria
or
Dom
ingo
s
Inte
rpre
tive
Geo
logy
AO
Min
ing
and
Nat
ural
Res
ourc
esM
inin
g an
d N
atur
al
Res
ourc
es
UN
DIG
ITIS
ED
MA
P th
is m
ap is
ess
entia
lly a
sca
nned
im
age
of a
har
d co
py m
ap th
at b
elon
gs to
the
Dep
artm
ent
of M
inin
g an
d N
atur
al R
esou
rce,
it is
a m
ore
deta
iled
map
th
an th
e ot
her
geol
ogy
map
for
the
who
le o
f cou
ntry
and
al
so h
as c
ross
sec
tions
of t
he g
eolo
gy fo
r so
me
area
s. It
is
a c
ombi
natio
n of
thre
e m
aps
that
wer
e m
ade
in th
e 19
90s.
The
re m
ay h
ave
been
an
outs
ide
grou
p m
akin
g a
digi
tised
cop
y bu
t uns
ure
if th
ey h
ave
succ
eede
d19
94-1
996
NM
inin
g an
d N
atur
al
Res
ourc
es
8

Ka
tálo
gu
da
du
sk
ole
tan
ea
no
re
jis
tu d
ad
us
ET
Geo
lv10
LLD
NG
RA
- ti
mor
aer
ial-t
opo
- ge
olog
yD
NG
RA
Pol
ygon
map
- m
ost d
etai
led
geol
ogy
map
ava
ilabl
e,
wou
ld s
eem
to b
e a
com
bina
tion
of th
ree
othe
r ge
olog
y m
aps:
Aud
ley-
Cha
rles,
Ber
ry a
nd T
obin
g pl
us s
ome
othe
r fie
ld o
bser
vatio
ns. H
as a
fine
det
ail a
nd m
ore
accu
rate
cl
assi
ficat
ions
, attr
ibut
es in
clud
e G
eolg
oy u
nit,
age,
gro
up,
form
atio
n, li
thol
ogy
and
geol
cod
es, w
hich
is s
imila
r to
ot
hers
but
this
has
man
y m
ore,
and
mor
e de
scrip
tive
clas
ses,
incl
udin
g di
vidi
ng th
e re
cent
allu
vial
into
allu
viam
, be
ach
sand
s, fl
ood
plai
n, la
cust
rine
and
river
terr
ace
2003
ND
NG
RA
geol
ogy
ALG
IS -
Vec
tor
- E
arth
Sci
ence
sA
LGIS
Pol
ygon
map
- g
eolo
gy m
ap o
f the
are
a (p
ossi
bly
Aud
ley-
Cha
rles)
to a
rea
sona
ble
leve
l of d
etai
l. A
ttrib
utes
incl
ude
form
atio
n na
me,
age
, fac
ies,
ltho
logy
, thi
ckne
ss, f
ossi
ls
and
othe
r re
mar
ks
geol
ogy
- bo
th A
LGIS
- R
aste
r -
Sha
pefil
es (
calle
d G
eoF
orm
atio
n)
and
Land
and
Pro
pert
y (s
ame
nam
e) h
ave
copi
es o
f thi
s ge
olog
y m
ap -
sam
e m
ap w
ith s
ame
attr
ibut
es20
05N
ALG
IS -
Mar
ia o
r D
omin
gos
Geo
Sta
bilit
lyZ
one
ALG
IS -
Ras
ter
- S
hape
files
ALG
IS
Pol
ygon
map
- s
ame
poly
gons
as
the
geol
ogy/
Geo
For
mat
ion
map
but
the
attr
ibut
es a
re b
ased
on
the
'sta
bilit
y' o
f pol
ygon
- p
roba
bly
mad
e to
feed
into
th
e la
ndsl
ide
map
cre
ated
by
Nic
hola
s '0
820
09N
ALG
IS -
Mar
ia o
r D
omin
gos
soils
ALG
IS -
Vec
tor
- E
arth
Sci
ence
sA
LGIS
Pol
ygon
map
- b
asic
soi
l map
cov
ers
who
le c
ount
ry to
a
reas
onab
le d
etai
l, di
vide
s so
ils in
to 'g
reat
soil'
eg
Cal
cius
tolls
, 'su
bord
er' e
g U
stol
lsan
d 'o
rder
s' e
g M
ollis
ols
2005
NA
LGIS
- M
aria
or
Dom
ingo
s
Land
In
form
atio
nhi
gh_f
ertil
ityA
LGIS
- N
icho
las'
08A
LGIS
Pol
ygon
map
- a
num
ber
of p
olyg
ons
cove
ring
som
e of
th
e ar
ea fo
r on
ly m
ainl
and
TL,
pol
ygon
s sh
ow a
reas
of
high
fert
ility
with
low
to m
ediu
m s
ensi
tivity
and
giv
es o
ther
de
tails
on
thes
e ar
eas
like
soil
type
, are
a, e
tc. p
resu
mab
le
mad
e by
Nic
hola
s '0
820
08N
ALG
IS -
Mar
ia o
r D
omin
gos
land
_pla
n_D
istr
ict
ALG
IS -
Nic
hola
s'08
ALG
IS
Pol
ygon
map
- d
ivid
es m
ainl
and
TL
into
pol
ygon
s w
hich
de
fine
the
land
man
agem
ent p
ract
ices
for
that
are
a (e
g.
Mai
ntai
n as
fore
st -
com
mun
ity fo
rest
or
conv
ert t
o ag
rofr
estr
y, a
gric
ultu
re o
nly
on te
rrac
es o
r im
prov
e w
ater
su
bbpl
y an
d es
tabl
ish
as p
erm
anen
t agr
icul
ture
. It i
s be
lieve
d th
at th
is is
the
final
out
put o
f the
Nic
hola
s '0
8 pr
ojec
t as
othe
r of
his
out
puts
map
s se
em to
be
inco
rpor
ated
into
the
attr
ibut
e ta
ble,
eg.
ero
dibi
lity,
wat
er
type
, lan
dcov
er, l
andu
se, r
ainf
all a
mou
nts
with
in
wat
ersh
eds,
etc
2008
NA
LGIS
- M
aria
or
Dom
ingo
s
Land
cove
rA
LGIS
- R
aste
r -
Sha
pefil
es (
also
in
ALG
IS -
Vec
tor
- La
nd c
over
)A
LGIS
Pol
ygon
map
- d
ivid
es w
hole
cou
ntry
into
pol
ygon
s ba
sed
on la
ndus
e, s
how
s w
hat l
and
is b
eing
use
d fo
r eg
fore
st,
agric
ultu
re, u
rban
, etc
and
agr
icul
ture
sub
divi
ded
into
ty
pes
eg. T
ypes
of c
omm
erci
al p
rodu
ce g
row
n an
d th
en
ther
e ar
e va
rious
obs
erva
tions
and
rem
arks
on
vario
us
aspe
cts
2005
NA
LGIS
- M
aria
or
Dom
ingo
s
rice
field
sA
LGIS
- V
ecto
r -
Land
cov
erA
LGIS
(D
NG
RA
als
o ha
s a
copy
)
Pol
ygon
map
- p
olyg
ons
cove
r va
rious
are
as fo
r w
hole
of
coun
try
whe
re r
ice
is g
row
n, d
iffer
entia
tes
betw
een
rain
fed
and
irrig
ated
ric
e fie
lds/
area
s20
05N
ALG
IS -
Mar
ia o
r D
omin
gos
9

Ka
tálo
gu
da
du
sk
ole
tan
ea
no
re
jis
tu d
ad
us
wa
t6_
3A
LG
IS -
Nic
hol
as'
08
AL
GIS
Pol
ygo
n m
ap -
div
ide
ds w
ho
le o
f cou
ntr
y in
to p
oly
go
nst
o a
fa
irly
de
taile
d le
vel,
the
attr
ibut
e ta
ble
wo
uld
ap
pe
ar
to
hav
e a
lot o
f im
po
rtan
t in
form
atio
n b
ut t
he
title
s a
re to
o
am
big
uo
s to
be
un
de
rsto
od
. At b
est
gu
ess
th
is is
a w
ate
r b
ala
nce
ma
p th
at w
as
use
d a
s o
ne
of t
he
inp
uts
to th
e
lan
d m
ana
ge
me
nt m
ap
tha
t Nic
ho
las
'08
cre
ate
d a
nd it
w
as
use
d to
asc
erta
in a
vaila
ble
am
oun
ts o
f wat
er
in a
ny
giv
en
are
a2
00
8N
AL
GIS
- M
ari
a o
r D
om
ingo
s
lum
_w
AL
GIS
- N
ich
ola
s'0
8A
LG
IS
Pol
ygo
n m
ap -
div
ide
s m
ain
lan
d T
L in
to p
olyg
on
s w
hic
h d
ivid
e in
to a
rea
s of
Agr
icu
lture
, Ag
rofo
rest
ry/g
razi
ng,
For
est/A
gro
fore
stry
and
no
da
ta (
for
are
as
ou
tsid
e
ma
inla
nd
TL
)2
00
8N
AL
GIS
- M
ari
a o
r D
om
ingo
s
Nat
ura
l H
abita
tB
VA
AL
GIS
- R
ast
er -
Sh
ape
file
sA
LG
IS
Pol
ygo
n m
ap -
po
lyg
ons
cov
er
vari
ou
s a
rea
s o
f co
unt
ry,
uns
ure
of
exac
t me
anin
g b
ut s
eem
s to
be
eith
er
pro
tect
ed
a
reas
or
po
ten
tial p
rote
cte
d a
rea
s o
r a
reas
of h
igh
b
iod
iver
sity
20
09
NA
LG
IS -
Ma
ria
or
Do
min
gos
ES
MA
LG
IS -
Ra
ster
- S
hap
efil
es
AL
GIS
Poy
gon
ma
p -
div
ide
s th
e w
hole
co
unt
ry in
to lo
w, m
edi
um
, h
igh
an
d v
ery
hig
h se
nsiti
vity
are
as,
no
oth
er
info
rma
tion
b
ut a
ssu
me
se
nsi
tivity
re
fers
to
the
like
lines
s of
da
mag
e to
th
at a
rea
du
e to
ch
an
ges
in la
nd
ma
nag
em
en
t, us
e, e
tc.
20
09
NA
LG
IS -
Ma
ria
or
Do
min
gos
Impo
rta
ntB
ird
Are
aA
LG
IS -
Ra
ster
- S
hap
erf
iles
AL
GIS
Poy
gon
ma
p -
po
lygo
ns
cove
r va
riou
s ar
eas
of c
ou
ntr
y, in
a
ttrib
ute
tabl
e e
ach
of t
he
se a
reas
is n
ame
d a
nd
jud
gin
g
from
title
of d
ata
set s
ho
ws
are
as
wh
ich
are
of i
mp
orta
nce
to
bird
life
in te
rms
of e
ithe
r th
e n
um
be
r of
sp
eci
es
or th
e st
atu
s o
f spe
cies
(ie
if e
nde
mic
/en
da
nge
red
bir
d s
pe
cie
s a
re fo
und
the
re)
fou
nd
the
re2
00
9N
AL
GIS
- M
ari
a o
r D
om
ingo
s
Tim
or_
Coa
stal
_M
ari
ne_
Hab
itats
_Nth
ALG
IS -
T
imo
r_C
oa
sta
l_M
arin
e_
Ha
bita
ts_
Nth
AL
GIS
Pol
ygo
n m
ap -
po
lyg
ons
cov
er
a s
hort
dis
tan
ce in
lan
d a
nd
o
ffsho
r fo
r th
e e
ntir
e n
ort
her
n co
ast o
f m
ain
land
TL.
Are
as
are
div
ide
d in
to la
nd
typ
e/m
ari
ne h
abita
ts, e
g. S
an
d
bea
ch, m
an
gro
ve fo
rest
s, d
ryla
nd
fore
sts,
sea
gra
ss
fore
sts,
de
ep
wa
ter
are
as w
ith c
oral
in s
ha
llow
are
as,
etc
20
09
NA
LG
IS -
Ma
ria
or
Do
min
gos
Non
-dig
itise
d
map
saf
p s
am
ple
su
rve
y 2
007
AL
GIS
A
LG
ISB
asic
land
use
ma
p th
at w
as
use
d to
sh
ow
site
s th
at w
ere
se
lect
ed
for
a su
rve
y -
un
sure
of s
urv
ey
typ
e o
r pu
rpo
se2
00
7N
AL
GIS
- M
ari
a o
r D
om
ingo
s
agro
clim
atic
_zo
nes
edi
t2A
LG
IS
AL
GIS
Div
ide
s co
un
try
into
tw
elv
e ca
teg
orie
s ba
sed
on
co
mb
ina
tion
s o
f hig
hla
nd
, slo
pe
s a
nd
low
land
with
low
, m
od
era
te, h
igh
and
hig
he
st r
ain
fall
20
07
NA
LG
IS -
Ma
ria
or
Do
min
gos
ann
ua
l_ra
infa
llA
LG
IS
AL
GIS
Bas
ic c
on
tou
r ra
infa
ll m
ap, s
am
e c
onto
urs
as
the
AL
GIS
a
nnu
al r
ain
fall
sha
pe
file
, ne
ithe
r gi
ve a
n in
dic
tion
of t
he
ran
ge o
f ye
ars
this
sh
ap
efil
e is
ave
rage
d fr
om2
00
2N
AL
GIS
- M
ari
a o
r D
om
ingo
s
bath
yme
tric
AL
GIS
A
LG
ISC
on
tou
r m
ap
of b
ath
yme
tric
de
pth
s fo
r so
me
of t
he s
outh
co
ast
20
02
NA
LG
IS -
Ma
ria
or
Do
min
gos
cop
y o
f ste
ve_
dun
nA
LG
IS
AL
GIS
Titl
ed
'Th
e P
rop
ose
d R
efr
ige
rato
r (c
old
ch
ain
) Lo
catio
ns
by
Su
b D
istr
ict'
basi
c to
po
gra
phic
ma
p w
ith m
ajo
r to
wn
s,
roa
ds a
nd d
istr
icts
with
a fe
w p
oin
ts id
en
tifie
d w
hic
h,
pre
sum
ably
, are
the
pro
pro
sed
refr
ige
rato
r lo
catio
ns
20
05
NA
LG
IS -
Ma
ria
or
Do
min
gos
10
Ka
tálo
gu
da
du
sk
ole
tan
ea
no
re
jis
tu d
ad
us
11
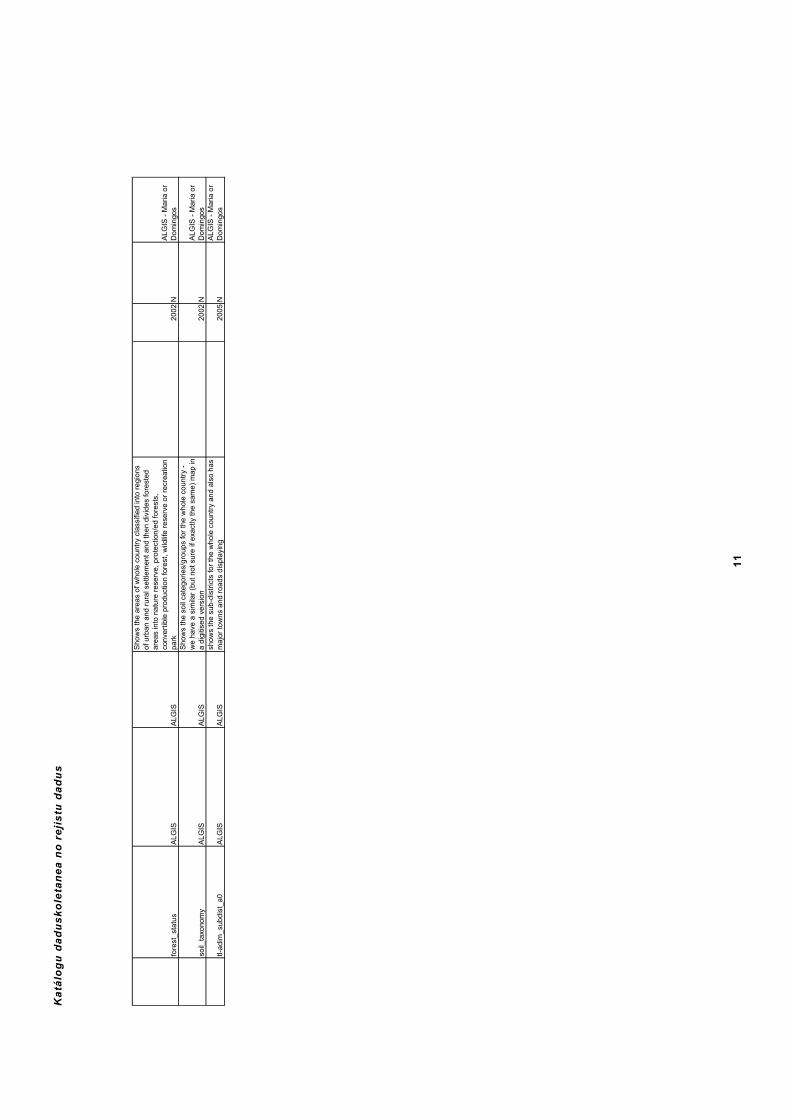
fore
st_
stat
us
AL
GIS
A
LG
IS
Sho
ws
the
are
as o
f wh
ole
cou
ntr
y cl
ass
ifie
d in
to r
eg
ion
s o
f urb
an a
nd r
ura
l se
ttle
men
t an
d th
en
div
ide
s fo
rest
ed
a
reas
into
na
ture
re
serv
e, p
rote
ctio
n/e
d fo
rest
s,
con
vert
ible
pro
du
ctio
n fo
rest
, wild
life
re
serv
e o
r re
crea
tion
p
ark
20
02
NA
LD
om
soil_
taxo
nom
yA
LG
IS
AL
GIS
Sho
ws
the
soi
l ca
teg
ori
es/g
roup
s fo
r th
e w
ho
le c
ou
ntr
y -
we
ha
ve a
sim
ilar
(bu
t not
sur
e if
exa
ctly
the
sa
me
) m
ap
in
a d
igiti
sed
ve
rsio
n2
00
2N
AL
Do
m
tl-a
dim
_su
bd
ist_
a0
AL
GIS
A
LG
ISsh
ow
s th
e s
ub-d
istr
icts
for
the
wh
ole
cou
ntr
y an
d a
lso
ha
s m
ajo
r to
wn
s a
nd
ro
ad
s d
isp
layi
ng
20
05
NA
LD
omG
IS -
Ma
ria
or
ingo
s
GIS
- M
ari
a o
r in
gos
GIS
- M
ari
a o
r in
gos

Katálogu daduskoletanea no rejistu dadus
Attachment 2: ‘Readme’ files for the GA ArcGIS project Files are arranged by alphabetical order of the file they are describing: These are the ‘readme’ files for the entire project as of January 2011. They were made at the beginning of the project and regularly updated. README for ‘admin&infra’ This folder contains all of the administrative files for the GA TL project running from June 2010 to Dec 2011 The files in this folder are either sourced from the TL government, various stakeholders or are outputs of the project. If outputs are present in this folder the methodology for creating them is also here. The names and sources/methodology for creation are as follows: OverallRoadScore ALGIS - Raster - Shapefiles, map of major roads for country admin_districts folder ALGIS - Vector - Administrative (DNGRA also has copy of some of these), admin and manage boundaries for country, e.g. districts, subdistricts, sucoscountry national boundary, etc. all polygons and a made map which is the boundary map for mainland Timor-Leste chc new ALGIS - Vector - Infrastructure - Health Facilities - CHC New, point data set, not sure what chc stands for but assuming list of new and/or existing hospitals, attribute table very detailed, includes. number of staff, specialities, morbidity numbers and reasons, issues for the hospital, etc. hp and mo neww ALGIS - Vector - Infrastructure - Health Facilities - HP&MC, point data set, not sure what hp and mo neww stands for but assuming it’s a kind of health facility, attributes include name, district, owner and whether chc certified hpt and cl fix ALGIS - Vector - Infrastructure - Health Facilities - HPT&CL, point data set, not sure what hpt and cl fix stands for but assuming it’s a kind of health facility, attributes include name, owner, staffing numbers and types and hospital equipment (eg. x-ray capabilities) 2002schools ALGIS - Vector - Infrastructure (DNGRA also has copy), point data set, lists schools, names and types roads and tracks ALGIS - Vector - Infrastructure (DNGRA also has copy), line data set, shows all roads for TL - descriptions range from two lane sealed road down to foot tracks hamlets ALGIS - Vector - Settlements (DNGRA & Property and Justice also has copy), point data set, shows the place and name of hamlets across TL househlold_points2004
12

Katálogu daduskoletanea no rejistu dadus
ALGIS - Vector - Settlements, point data set presumably from the 2004 census, shows the locations of all the houses in TL and the number of people in each house major towns ALGIS - Vector - Settlements (DNGRA & Property and Justice also has copy), point data set, shows the place and name of all of the major towns in TL minor towns ALGIS - Vector - Settlements (DNGRA & Property and Justice also has copy), point data set, shows the place, name (names the subdistrict and district as well) of all of the minor towns in TL PPJ_Atlas folder Stats, THIS FOLDER CONTAINS NO GIS DATASETS, this folder has copies of the 2004 population census reports, but none of the gis datasets produced from the 2004 census. Statistics would prefer if we didn't use any of the 2004 data as they have just completed a more comprehensive 2010 census in July, the results of which we should be able to have access to by January or February 2011.
README for ‘climate’ This folder contains all of the climate files for the GA TL project running from June 2010 to Dec 2011 The files in this folder are either sourced from the TL government, various stakeholders or are outputs of the project. If outputs are present in this folder the methodology for creating them is also here. The names and sources/methodology for creation are as follows: wat6_3 From ALGIS - Nicholas'08, looks like some kind of water balance/run off polygon area need to check with Luke, may be useful for recharge. annual rainfall ALGIS - Vector - Climate, basic rainfall contour map for whole of country - fairly large contours average temp ALGIS - Vector - Climate, basic temperature contour map for whole of country, again fairly large contours CMORPH folder ALGIS - Vector - Weather station dt, has raster maps of world precipitation for every data from 2003 to 2008 - the folder with the separate 2008 data also has averaged weekly world precipitation maps. These maps were created by John Janowiak and Tim Love of NOAA but unsure for what purpose. The files are all in zipped folders - to access, unzip and import into ArcMap (or other program that can read GRID format) Agriculture_WeatherStation Meteorologic_WeatherStation
13
Katálogu daduskoletanea no rejistu dadus
(both) ALGIS - Vector - Weather station dt - WeatherStation, both are point data sets that show the location and name of various weather stations - no indication when this map was from or if they are still active. 100908 HYDATA DNGRA, WILL NEED HYDATA PROGRAM TO ACCESS, shows river and rain gauge data that Norwegians have collected Rainfall Data DNGRA, EXCEL SPREADSHEETS, contains files on weather stations around country - each file shows every, or most, days of the month recording temp, precip, humidity, evaporation, etc. Years range from 2004 - 2009 BUT not all years/months are recorded at every station, some only have one or two years rain_temp Polygon Shapefile. Compiled/made by Samantha Dawson in December 2010 as part of the groundwater recharge site identification study. Map is based on both the annual rainfall and annual temperature maps. It is a combination of these two maps divided into each of the separate areas of temperature range and rainfall range. To produce this map the following method was used: First the average temperature shapefile was copied and split so that there were 5 separate shapefiles depicting each of the 5 temperature ranges - make a copy of the original shapefile, rename it to the temperature range for that shapefile, then in ArcMap Open Attribute table (right click on shapefile name > select 'Open Attribute Table') Then in attribute table - select 'Options' button > select 'Select by Attributes In the window that opens double click on the title of the attribute that you are interested in (e.g. temperature range) Then click the '=' sign once Click the 'Get Unique Values' button then double click on the particular attribute that you want in the new file Then click 'Apply' This will select all of those attributes in the Attribute Table Then Select the 'Options' button > select 'Switch Selection' This will select everything but the attributes you are interested in Then go to the Editor Toolbar (to add to ArcMap go to View > toolbars > select 'Editor') and select 'Start Editing' Right click on the left hand column of the attribute table on any of the selected rows, then click 'Delete selected' This will delete everything except the ones you are interested in Go back to Editor Toolbar - select 'Save Edits' > select 'Stop Editing' The shapefile will now only show the polygons that you are interested in (e.g. only the temperatures for that range) Repeat this procedure for each of the 5 ranges. Then, using each of the 5 temperature shapefiles in turn, clip the annual_rainfall shapefile - by clipping the annual rainfall file by each of the temperature ranges the areas are being divided up by rainfall range and temperature range. To clip the rainfall file the following steps were used: In the toolbox (if not displayed then press the little red box in the options at the top of ArcMap or ArcCatalog) Select Analysis Tools Select Extract Select Clip In the window that opens in the Input Features put what you want clipped, in this case the annual_rainfall
14

Katálogu daduskoletanea no rejistu dadus
In the Clip Features put what you are clipping by, in this each of the temperature range shapefiles (note: you can only do one of these shapefiles at a time) In the Output Feature Class, type a name of the new file (in this case probably use a combination of rain and the temperature range This procedure should produce 5 new shapefiles, each of which contain the annual_rainfall polygons that are within a certain temperature range. Then for each of the polygons depicting a rainfall range within a certain temperature range, the temperature range needs to be added to the polygon. To achieve this use the following steps for each of these 5 shapefiles: In the attribute table use the 'Options' menu, then select 'Add Field' Then in the window that appear give a name for the new attribute (in this case 'temp.' or similar) Note: keep the title of the fields the same for all 5 shapefiles In type select 'Text' Leave the default of others (if longer may need to increase length) Click 'OK' Then start and Edit session (Editor toolbar - Editor menu > select 'Start Editing' Then in the attribute table right click on the heading of the field that was just made Select 'Field Calculator' In the window that appears, down the bottom in the box that is titled '(name of field) =' write the temperature range with inverted commas on each side (e.g. "25 - 27") Once this is completed for each of the 5 shapefiles, you can merge the 5 shapefiles into one which will have one field/column in the attribute table which is rainfall range and another which is temperature range To merge the shapefiles use the following method: In the Toolbox: Data Management Tools > General > Merge In the window that appears - in the 'Input Datasets' select the 5 shapefiles (will have to select one at a time) Then give a name for the Output Dataset give a name for the file (e.g. rain_temp) In the Field Map section will be several field names but there should be only one for rainfall range and one for temperature range (if you have not used the same names to as titles in the attribute fields this will not be the case and you will have to go back and change them) Once this is done select 'OK' This output from this merge will be a map that is a combination of the rainfall and temperature maps.
README for ‘earth_obs_img’ This folder contains all of the earth observatory image files for the GA TL project running from June 2010 to Dec 2011 The files in this folder are either sourced from the TL government, various stakeholders or are outputs of the project. If outputs are present in this folder the methodology for creating them is also here. The names and sources/methodology for creation are as follows: Airphoto ecw1 folder ALGIS - Raster, airphotos of the whole country (inc. Oecussi and island) to a reasonably fine scale digo airphoto index ALGIS - Raster, index for the airphoto folder
15

Katálogu daduskoletanea no rejistu dadus
ECW Rupabumi folder ALGIS - Raster, topographic map of the whole country (inc Oecussi and island) rupabumi and ecw index ALGIS - Raster, index for the ECW Rupabumi folder georef space shuttle shaded relief ALGIS - Raster - Space Shuttle (DNGRA also have copy), greyscale relief picture of whole country (no heights attached) satellite folder ALGIS - satellite, various satellite rasters of either all or parts TL. If 'box' in title only covers a small proportion of the country, others cover whole or 3/4 of country. Aerial folder DNGRA, airphotos of whole of country (inc. Oecussi and island) to a reasonably fine scale - seem to be the same or similar to airphotos from ALGIS LANDSAT_742mosaic folder ALGIS, Raster dataset - landsat raster to a fairly coarse resolution - shows the country to the East of Dili but no further west than the western outskirts of Dili. Also shows landsat for region to the East of mainland Timor including PNG and islands further east than PNG
README for ‘elevation’ This folder contains all of the elevation files for the GA TL project running from June 2010 to Dec 2011 The files in this folder are either sourced from the TL government, various stakeholders or are outputs of the project. If outputs are present in this folder the methodology for creating them is also here. The names and sources/methodology for creation are as follows: erodible2 From ALGIS - Nicholas'08 folder, country divided into two types polygon; high erodibility and no data - could be used to identify areas of high run-off timor2 From ALGIS - Nicholas'08 folder - elevation raster, not sure of source Bathymetry_Sandwell ALGIS - SRTM, Bathymetric raster map of the world, inc TL SRTM_Elevation ALGIS - SRTM, elevation raster of whole country - probably best one to use slopes ALGIS - Vector - Elevation, polygon map of whole country divides areas into a slope of S, F or M (assuming steep, flat or medium) polygons are large and coarse elevation ALGIS - Vector - Elevation (DNGRA also has copy), polygon map which divides elevation into 7 categories (presumably lowest to highest but no info on size of categories/division of heights)
16
Katálogu daduskoletanea no rejistu dadus
100m contours ALGIS - Vector - Elevation (DNGRA also has copy), contour map of elevation in 100m height intervals (whole country) bath_timor ALGIS - Vector - TL, contour map of bathymetry around whole of TL and region. Contours are at depth intervals of (m) 0, 100, 200, 500, 1000 and then every 500m to 4500 extract_srtm2 This raster is based on the SRTM_ Elevation.tif file. It contains the same information except it is clipped to the Timor-Leste mainland border (using the clip tool - Analysis Tools > Extract > Clip) and a file with the boundary to clip it. It is also in an ESRI grid format instead of .tif MRVBF folder This folder contains the extract_srtm2 (the SRTM_Elevation file but clipped to Timor Leste and in an ESRI grid) and the results (and ArcInfo tools) from a MrVBF script (Valley Bottom Flatness). This data will be used in the recharge analysis to help identify areas where there is high run off, or pooling that would be conducive to recharge. There are a number of rasters produced from MrVBF, which there is not room to go into here, however if you consult the literature (John Gallant, CSIRO) then it will be able to give more information.
README for ‘hydrogeology’ This folder contains all of the hydrogeology files for the GA TL project running from June 2010 to Dec 2011 The files in this folder are the main outputs for the project. For more information on the project please see the fact sheet/reports in the Reports folder The names and sources/methodology for creation are as follows: hydgeo_1: This is the first attempt at a hydrogeology map for East Timor. It uses the ETGeol10LL as a basis. From this, Dr. Luke Wallace assigned each of the types of geologic units in the attribute table an aquifer type (karst, sedimentary or fractured rock), a potential yield (high or low) and then gave a general rock type description. These three attributes were then input into the hydgeo_1 attribute table using these steps in ArcMap: In the editor toolbar click the drop down menu than start editing (select correct file) Open the attribute table (right click on file name) Use an SQL query (click options then 'select by attributes') then use this tool to select all of a particular geol unit (e.g. "GEOL_UNIT" = 'Edl' use the buttons and the 'get unique values' to select units) Then use the field calculator (right click on column you want to add attributes to, select Field Calculator) to insert the attributes you want (e.g. in the 'aquifer' column to insert 'fractured rock' into all of the Pzlc Geol_Units). In the field calculator select Type: String then in the equation area write the words you want inserted into the column in quotation marks e.g. "fractured rock". Make sure the 'Calculate selected records only' is selected. Then click 'OK'. When you are finished inserting attributes into the table make sure you go back to the editor toolbar and using the dropdown menu select 'save edits' and then 'stop editing'.
17

Katálogu daduskoletanea no rejistu dadus
hydgeo_clip1: This is the hydrogeology map except it has been 'clipped' to delete West Timor from the map (which was classified as 'NA') so that this hydrogeology map only shows the East Timor mainland. This was achieved using a shapefile that was the administrational boundary of East Timor and the Clip Tool as below: In the Arc Toolbox select Analysis Tools > Extract > Clip. When the window opens use the drop down arrow or folder to select the hydgeo_1 map in the 'Input Features' box, then the same process to select the admin boundary in the 'Clip Features' box and then rename the file in the 'Output Feature Class' box to desired name (note: do not use the same name as any of the input files and try to keep at 10 letters or less). Click 'OK'. hydgeo_2: This is a revised version of the hydgeo_1. In this shapefile some of the original added attributes were changed and some new attributes were added. For example, the karst aquifers were changed to Fractured Rock, high yield aquifers and further attributes, such as amount descriptions, map symbol, lithology new, etc. these were added under instruction from Dr. Wallace who assigned these new attributes in an excel spreadsheet. The process was the same as for hydgeo_1 hydgeo_2_Dis This shapefile is the same as the hydgeo_2 shapefile except it has been processed using the following tool. Data Management Tools > Generalization > Dissolve using the input and output files were given names and then the fields to dissolve selected were aquifer_type pot_vol (potential volume). This tool then takes all polygons that have the same characteristics in those two fields and dissolves/takes away the lines between them. This means that when this map is displayed it can be done with boundaries around the edge that don't interfere with the internal polygon making the map clearer and more readily understandable. hydgeo_2_ras Raster Map. Based on the hydgeo_2 map, this is a raster of a field that was created that combined Aquifer with Potential Volume (add a field to the attribute table outside of an edit session then in an edit session use the field calculator to make the new column equal the sum of the two previous columns). It was created to input the hydrogeology map into 3D format in ArcScene. It was created using the convert features to raster in the spatial analyst toolbar (in the toolbar). To get this toolbar go to View > Toolbars > (tick) Spatial Analyst. When the toolbar appears click on the drop down menu > Convert > Features to raster. In the box that pops up select the input shapefiles/features and the Field (attribute column) that you want the raster to be based on (note: none of the other fields will be in the output) leave the Output cell size as default and change Output raster to the required name. This raster can then be added to an Arcscene map and use a DEM (such as SRTM) as the input base heights. hydgeo_2_lith.lyr Layer file based on hydgeo_2. Layer files are used to hold the colours/patterns of a shapefile that you have designated in ArcMap. In this case each of the lithologies (e.g. sedimentary, conglomerate, karst, etc) of the hydgeo shapefile were displayed in patterns according to the UN International Standards. These patterns overlay the hydgeo aquifer map. To save a shapefile to a layer file in ArcMap, first make sure the colours that you are displaying the shapefile in are correct. Then right click on the shapefile, select 'Save as Layer File', designate name (if different from default), select save. A layer file only holds the display properties for that shapefile. It is not a shapefile in itself and does not store the locations/shapes. It references back to the original file for its information - the original file MUST stay in exactly the same folder or be moved in conjunction with the layer file or the layer file WILL NOT WORK.
18
Katálogu daduskoletanea no rejistu dadus
If a layer file is not working you may need to re-set where the polygon is - follow the prompts and select the correct file. Layer files can also be used to colour other shapefiles the same way as the layer file. For example, if a shapefile has some of the same attributes as the layer file based shapefile has, you can use these attributes to display in the correct colours, rather than going back to the beginning and re-colouring all the attributes by hand. hydgeo_2a.lyr Layer file based on hydgeo_2. Layer file holding the correct colours to display the aquifers of Timor-Leste. For example - high sedimentary = dark blue, low sedimentary = light blue. Made using process descirbed in hydgeo_2_lith.lyr aq_pot_ras Raster map. Based on the aquifer potentiality map. Aquifer potentiality map is essentially hydgeo map but coloured light blue and dark blue. Light blue represents rocks that are aquifers but with low prospectivity, dark blue represents rocks that are aquifers with a high prospectivity. This was made into 3d using the same methods as the hydgeo_2_ras. It was made so that the raster produced could be used in ArcScene to display these polygons in 3d - draped over topography. ETGeol_attributes_TL_Hydgeo_LW ( ,2,3) These are the excel spreadsheets (updated in consecutive numbers) that have the information on how the geology was interpreted into geology for the standard map and into hydrogeology. The plain cells are the original information from ETGeol files, the cells coloured yellow are the information used in the geology file and the blue cells are the interpretation into hydrogeology files Fissured Polygon shapefile. Shows the Fissured rock aquifers (previously called karst aquifers) for the mainland of Timor-Leste only (not including SE corner). Based on the hydgeol_4 map (most up to date as 12/01/11) uses the SQL and editing tools to delete the other polygons from the original shapefile. Instructions as follows: In ArcCatalog make a copy of the base shapefile and rename the copy to desired name (e.g. Fissured) Add new shapefile to ArcMap Open Attribute table (right click on shapefile name > select 'Open Attribute Table') Then in attribute table - select 'Options' button > select 'Select by Attributes In the window that opens double click on the title of the attribute that you are interested in Then click the '=' sign once Click the 'Get Unique Values' button then double click on the particular attribute that you want in the new file Then click 'Apply' This will select all of those attributes in the Attribute Table Then Select the 'Options' button > select 'Switch Selection' This will select everything but the attributes you are interested in Then go to the Editor Toolbar (to add to ArcMap go to View > toolbars > select 'Editor') and select 'Start Editing' Right click on the left hand column of the attribute table on any of the selected rows, then click 'Delete selected' This will delete everything except the ones you are interested in Go back to Editor Toolbar - select 'Save Edits' > select 'Stop Editing' The shapefile will now only show the polygons that you are interested in (e.g. only fissured aquifers) Fissured_Oec_Ata3 Polygon shapefile. Shows the fissured rock (karst) aquifers of Oecussi and Atauro only. Made by the same process as Fissured.
19

Katálogu daduskoletanea no rejistu dadus
Based on the hydgeo for Oecussi and Atauro, which was based on the geology for each island (see geology folder). Fissured_whole2 Polygon shapefile. Shows the fissured rock aquifers (previously called karst aquifers) for whole of Timor-Leste, including Atauro and Oecussi and SE corner. Based on the Fissured and Fissured_Oec_Ata3 shapefiles (see above for shapefiles and how they were made). Made by merging the two shapefiles it was based on using following steps: In ArcMap open/show the toolbox Data Management Tools > General > Merge In the window that opens select the two shapefiles you wish to merge Give a name for the output dataset Set other options as required (rest were default for this shapefile) Select 'OK' hydgeo_3 (shape and layer files) Polygon shapefile and layer file based on this with aquifer colours. This shapefile is the progressed version 3 hydrogeology map from hydgeo_2. It is a hydrogeology map, based on the files and using the same processes as the hydgeo 2. As understanding of the Timor-Leste system and the manner in which the maps were going to be presented, the files were updated. Older files are kept so that they can be used a s a reference in the future. Please refer to hydgeo_2 for the steps involved in updating the hydrogeology maps as they are similar for hydgeo_3. hydgeo_3_Dis Polygon shapefile. Based on hydgeo_3 (version 3 of the hydrogeology map). This map shows the aquifer types but with the interior boundaries dissolved, making only one polygon for each of the aquifer types. The process to make this file was the same used for hydgeo_2_Dis. Please refer back to this file for the method used. hydgeo_3_ras Raster file. Based on hydgeo_3_Dis (version 3 of hydrogeology map). This map is the hydgeo_3_Dis shapefile but in a raster format. It was put in this format so that it could be displayed in ArcScene, draped over the topography. For methods on how this was made please refer back to the hydgeo_2_ras details. hydgeo_4 (shapefile and layer file) Polygon shapefile and layer file based on this with aquifer colours. This shapefile is the progressed version 4 of the hydrogeology map. Based on hydgeo_3 but with changes made as understanding and knowledge increased. As well as changes to the attribute table and categorisation of the data there were two other major changes in this file: first there was the inclusion of Atauro, Oecussi and the SE corner - done by merging the new hydgeo with the files using the 'merge' tool as follows: In ArcMap open/show the toolbox Data Management Tools > General > Merge In the window that opens select the shapefiles you wish to merge Give a name for the output dataset Set other options as required (rest were default for this shapefile) Select 'OK' The other major change was dividing sedimentary aquifers that were connected that should not have been. For example, some of the polygons that showed a high yielding, large sedimentary aquifer also had bits of the polygon that went higher up into the river valleys, meaning that some parts of the same polygon should be classed as high yielding sedimentary and others as low yielding sedimentary. To correct this based on a visual (over computer using ArcMap and
20

Katálogu daduskoletanea no rejistu dadus
ArcScene) assessment of the parts of each polygon, taking into account width, predicted depth, steepness of slope, etc, the polygons were edited to divide them into the separate aquifer types, where necessary. For this editing the following steps were used: Editor Toolbar - drop down menu Select 'Start Editing' Select 'Snapping' In box that opens up, for the shapefile that you are working on, tick 'vertex' and 'edge' and 'end' - this means that if the mouse is near a vertex, edge or end of the shapefile you have selected it will automatically go to that point, this helps to ensure that the shapefile is correctly made and the polygons match exactly, it reduces human error significantly and reduces time spent editing. In the 'Target:' window make sure the file you wish to edit is selected Then use the select tool (arrow/mouse shape next to the Editor drop down menu) Select the particular polygon you wish to edit - the edges will turn bright blue In the 'Task:' window, under 'Modify Tasks', select 'Cut Polygon Features' - this will divide the polygon into two along the desired line exactly - with no gaps between the polygon - it is the quickest, most effective way to do this and produces the best results Then select the pencil tool (next to the select tool) When the mouse is on the map now it will look like a cross-hairs with a circle Starting at one edge of the polygon (the tool should snap to it), draw a line across where you want the polygon to be split (Note: you do not have to trace the outside edge of the polygon, just draw a line where you want the split) When you have got to the end of the line you want the split to go along, double click on the opposite edge of the polygon - this will place the final vertex and finish the drawing. The polygon will then split into two As both polygons are selected you can go in to the attribute table of the shapefile and make changes to it as necessary (e.g. change the 'high potential yield' attribute for the desired polygon to 'low potential yield'. When finished use the Editor toolbar to select 'Save Edits' and then 'Stop Editing' It is recommended that when making many edits to save the edits regularly in case of problems/system crash The above steps are how the polygons in the hydrogeology map were edited. hydgeo_4_dis Polygon shapefile. Based on hydgeo_4 (4th version of the hydrogeology map) this essentially the same polygon dataset but with all of the internal boundaries of the aquifer types dissolved. See hydgeo_2_dis for further details and methods hydgeo_4_lith.lyr Layer file. Based on hydgeo_4 lithologies. This layer file holds the patterns for the lithologies of hydgeo_4 in the international standard format (changed a little from version 3). For details and methods on how this was made see hydgeo_2_lith.lyr hydgeo_4_ras2 Raster file. Based on hydgeo_4_dis it is these polygon but in a raster format so that they can be displayed in ArcScene draped over topography. For details and methods see hydgeo_2_ras hydgeo_clip1 Polygon shapefile. Based on the hydgeo 4 but also includes the SE corner of mainland Timor-Leste, which was not in hydgeo_3 due to lack of data. Made so that the hydrogeology of the SE corner could be added (merged with) the hydgeo_4 map. Made using the admin dataset of the mainland hydgeo_SEcorner Polygon shapefile. Based on the geology of the SE corner, which was taken from the same map as the Oecussi geology map, shows the hydrogeology of the SE corner that was later merged with the
21
Katálogu daduskoletanea no rejistu dadus
hydgeo_4 shapefile so that the whole of the country was covered in the hydrogeology map. This geology file was not based on the ETgeol but another geology shapefile - see the geology_SEcorner shapefile for more details. Intergran Polygon shapefile. Shows the Intergranular aquifers (previously called sedimentary or alluvial) for mainland Timor-Leste only (not including SE corner). Based on the hydgeol_4 map (most up to date as 12/01/11) uses the SQL and editing tools to delete the other polygons from the original shapefile. Details and methods/instructions are the same as were used in the Fissured shapefile Intergran_Oec_Ata3 Polygon shapefile. Shows the intergranular aquifers (previously called sedimentary or alluvial) of Oecussi and Atauro only. Made by the same process as Fissured. Based on the hydgeo for Oecussi and Atauro, which was based on the geology for each island (see geology folder). Intergran_whole2 Polygon shapefile. Shows the intergranular aquifers (previously called sedimentary or alluvial) for whole of Timor-Leste, including Atauro and Oecussi and SE corner. Based on the Intergran and Intergran_Oec_Ata3 shapefiles (see above for shapefiles and how they were made). Made by merging the two shapefiles it was based on using following steps: In ArcMap open/show the toolbox Data Management Tools > General > Merge In the window that opens select the two shapefiles you wish to merge Give a name for the output dataset Set other options as required (rest were default for this shapefile) Select 'OK' Local_aquifer Polygon shapefile. Shows the localised aquifers (previously called fractured rock) for mainland Timor-Leste only (not including SE corner). Based on the hydgeol_4 map (most up to date as 12/01/11) uses the SQL and editing tools to delete the other polygons from the original shapefile. Details and methods/instructions are the same as were used in the Fissured shapefile Local_aquifer_Oec_Ata3 Polygon shapefile. Shows the localised aquifers (previously called fractured rock) of Oecussi and Atauro only. Made by the same process as Fissured. Based on the hydgeo for Oecussi and Atauro, which was based on the geology for each island (see geology folder). Local_aquifer_whole2 Polygon shapefile. Shows the localised aquifers (previously called fractured rock) for whole of Timor-Leste, including Atauro and Oecussi and SE corner. Based on the Local_aquifer and Local_aquifer_Oec_Ata3 shapefiles (see above for shapefiles and how they were made). Made by merging the two shapefiles it was based on using following steps: In ArcMap open/show the toolbox Data Management Tools > General > Merge In the window that opens select the two shapefiles you wish to merge Give a name for the output dataset Set other options as required (rest were default for this shapefile) Select 'OK'
22

Katálogu daduskoletanea no rejistu dadus
Local_confin Polygon shapefile. Shows the localised confining layers/rock (previously called fractured rock) for mainland Timor-Leste only (not including SE corner). Based on the hydgeol_4 map (most up to date as 12/01/11) uses the SQL and editing tools to delete the other polygons from the original shapefile. Details and methods/instructions are the same as were used in the Fissured shapefile Local_confin_Oec_Ata3 Polygon shapefile. Shows the localised confining layers(previously called fractured rock) of Oecussi and Atauro only. Made by the same process as Fissured. Based on the hydgeo for Oecussi and Atauro, which was based on the geology for each island (see geology folder). Local_confin_whole2 Polygon shapefile. Shows the localised confining layers (previously called fractured rock) for whole of Timor-Leste, including Atauro and Oecussi and SE corner. Based on the Local_confin, Local_confin_Oec_Ata3 and hydgeo_SEcorner shapefiles (see above for shapefiles and how they were made). The hydgeo_SEcorner only had this type of aquifer/confining layer so this was the only time it was used in the merge. Made by merging the two shapefiles it was based on using following steps: In ArcMap open/show the toolbox Data Management Tools > General > Merge In the window that opens select the two shapefiles you wish to merge Give a name for the output dataset Set other options as required (rest were default for this shapefile) Select 'OK'
README for ‘hydrology’ This folder contains all of the hydrology files for the GA TL project running from June 2010 to Dec 2011 The files in this folder are either sourced from the TL government, various stakeholders or are outputs of the project. If outputs are present in this folder the methodology for creating them is also here. The names and sources/methodology for creation are as follows: braiding riverbeds ALGIS - Vector - hydrology (DNGRA also has copy), polygons (maybe need to see if a line version is required) of braided river beds (almost all major rivers in TL are braided rivers) - no rivers named rivers ALGIS - Vector - hydrology (DNGRA also has copy), lines of rivers, almost all feed into the braided river beds - no rivers named seamask ALGIS - Vector - hydrology, one polygon outlining sea areas for whole of country/region
23

Katálogu daduskoletanea no rejistu dadus
waterbodies ALGIS - Vector - hydrology (DNGRA also has copy), polygons of the waterbodies (there are few water bodies in TL) no waterbodies named watersheds ALGIS - Vector - hydrology, polygons of the watersheds in TL - covers whole of country, attributes include catchment name, size in hectares and class (eg small catchment, aggregate catchment)
README for ‘interperative_geology’ This folder contains all of the interpretive geology/geology files for the GA TL project running from June 2010 to Dec 2011 The files in this folder are either sourced from the TL government, various stakeholders or are outputs of the project. If outputs are present in this folder the methodology for creating them is also here. The names and sources/methodology for creation are as follows: GeoFormation: ALGIS - Raster - Shapefiles, basic geology map, reasonable detail, several copies GeoStabilityZone: ALGIS - Raster - Shapefiles, same polygons as basic geology map but description based on 'stability' of polygon - probably made to feed into the landslide map geology ALGIS - Vector - Earth Sciences (Property and Justice also gave a copy) basic polygon geology map - descriptions on formation name, age, facies, lithology, thickness, fossils remarks and map symbols. Believed to based on the ESCAP maps as the polygons roughly match up and those geological units without information (e.g. have a map symbol but that map symbol is not in the key of the ESCAP map) are the same for both maps soils ALGIS - Vector - Earth Sciences, basic polygon soil map - divides soils into 'greatsoil' eg Calciustolls, 'suborder' eg Ustolls and 'orders' eg Mollisols ETGeolv10LL DNGRA - timor aerial-topo, best geology (polygon) map available, would seem to be a combination of four other geology maps; Audley-Charles, Berry, Tobing and MTA (not sure where MTA comes from yet - paper's from others all in references folder). It has much finer detail than other geology map, and what would seem to be much more accurate classifications and polygons. Attributes include Geol unit, age, group, formation, lithology and geol codes - which is similar to others but this has many more, and more descriptive classes, including dividing the recent alluvial into alluvium, beach sands, flood plain, lacustrine and river terrace. Believed to be a combination of mainly Audley-Charles work for the majority of the area, Berry's work for the northern metamorphosed areas and Tobings updates to Audley-Charles work. Possibly compiled by Tobing or another of his colleagues during Indonesian times.
24

Katálogu daduskoletanea no rejistu dadus
ETGeol_clip This is the ET geology map except it has been 'clipped' to delete West Timor from the map (which was classified as 'NA') so that this hydrogeology map only shows the East Timor mainland. This was achieved using a shapefile that was the administrational boundary of East Timor and the Clip Tool as below: In the Arc Toolbox select Analysis Tools > Extract > Clip. When the window opens use the drop down arrow or folder to select the hydgeo_1 map in the 'Input Features' box, then the same process to select the admin boundary in the 'Clip Features' box and then rename the file in the 'Output Feature Class' box to desired name (note: do not use the same name as any of the input files and try to keep at 10 letters or less). Click 'OK'. ETGeo_stcol This is the ET geology map except that it has been put into international/Australian colours (or as close as it was possible to get to them. To do this, Dr. Wallace analysed the data and assigned map symbols, further geology descriptions. These were then added to the attribute table using the 'Add Field' tool and then in an edit session using SQL queries to select relevant files and then the field calculator to insert the new attributes. The map symbols were then used as the display category and each map symbol was given a colour based on the Australian and international standards as advised by Alan Whittaker. To find the exact colours used please refer to the excel spreadsheet in this file. They are in RGB base. ET_Geol_ras Raster Map. Based on the EtGeo_stcol map this is a raster of the Map Symbols column. It was created to input the geology map into an 3D format in ArcScene. It was created using the convert features to raster in the spatial analyst toolbar (in the toolbar). To get this toolbar go to View > Toolbars > (tick) Spatial Analyst. When the toolbar appears click on the drop down menu > Convert > Features to raster. In the box that pops up select the input shapefiles/features and the Field (attribute column) that you want the raster to be based on (note: none of the other fields will be in the output), leave the Output cell size as default and change Output raster to the required name. This raster can then be added to an Arcscene map and use a DEM (such as SRTM) as the input base heights. A0 Nat_Res, THIS MAP IS NOT DIGITISED, this is the map from Natural Resources where only hard copies exist.DSmeone from Perth (one person from a Uni and another from a company) took pictures of it and were going to try and digitise it (visited Natural Resources in Feb/March) but haven't heard back from them. Need to chase up to see if they were successful ETGeo_stcol##.lyr (1a,2,2a,2b,3) Layer files based on ETGeo_stcol. These are layer files which house the different versions and colourings for the geology map of Timor-Leste. These maps are layer files, which means they do not hold any polygon data or information in the shapefile, they only hold the display properties (e.g. how it was displayed and what colours were used) of the ETGeo_stcol map. They refer back to the original file in order to display. If the original base file is removed the layer files will need to be redirected to refer back to it. The numbers in the title refer to the different versions of the map as colours, map symbols and understanding of the geology increased. The higher the number the more up to date the version is. The colours used in the layer file are also stored in RGB and shadeset numbers in the excel spreadsheet in this file. They are based on both the Australian and international
25
Katálogu daduskoletanea no rejistu dadus
standards and were developed in consultation with Alan Whittaker, who was part of the team that made the Australian geology map. To make a layer file display the base file in ArcMap > adjust the display setting and colours to where desired > right click on the title of the shapefile in the left hand box listing the files > click on 'Save as Layer File' > give a name to the new file (or leave as default) > click 'Save'. This will create the new layer file. You can also, in the Properties, display window, use layer files to apply this symbology/display settings to other shapefiles with some of the same attributes (e.g. if you had a shapefile of West Timor geology and the rock types/map symbols used corresponded with those in Timor-Leste you could use these ETGeo_stcol layer files to display all of the rock types in the same colours so that the two different maps would match in display properties. ETGeol_attributes_standard_colour.xlsx Excel spreadsheet. This spreadsheet houses the attribute table from the original ETGeolv10LL file plus the coloured columns which are the interpretations, colours, changes made and the same for the extra units of the Atauro and Oecussi maps. The interpretations were made by Dr. Luke Wallace as part of this project and included assigning map symbols. The colours are in line with Australian and international standards, they are stored here as RGB and GA Shadeset values. If the layer files are lost or corrupted this file can be used to source the correct colours for the map. The cells with a yellow background refer to geology and those with a blue background refer to hydrogeology interpretations. The cells with no background are from the original attribute table. Of the geology interpretation cells (yellow) the ones titled R, G, B and HP refer to the colours used in the layer files. Those called Solo R, Solo G, Solo B and Solo HP refer to a map where only some of the geology was displayed (to be specific the intergranular aquifer geology map), as the original colours given to these geology types was very light they needed to be darkened slightly, just for this one map, so that they would be visible on a white background map (GA standard for maps is a white background). This spreadsheet is the most up to date version as of January 2011. geo_who2_ras ( ,2,3) Raster files. These maps are based on the map symbols of the ETGeo_stcol most up to date shapefile. The numbers represent the detail in the map/cell size. The higher the number the more detailed the map and the smaller the cell size is. This was to find the best balance between computing time and display quality. Rasters of these shapefiles were made so that they could be displayed in ArcScene in a 3d Format and draped over the topography. The process for making these maps is as follows: It was created using the convert features to raster in the spatial analyst toolbar (in the toolbar). To get this toolbar go to View > Toolbars > (tick) Spatial Analyst. When the toolbar appears click on the drop down menu > Convert > Features to raster. In the box that pops up select the input shapefiles/features and the Field (attribute column) that you want the raster to be based on (note: none of the other fields will be in the output). In these versions the first file was with the output size left as the default and this cell size was then decreased with successive rasters. note: the colours of the shapefile do not get carried across to a raster and applying the layer file does not work so the colours need to be reassigned. geology_Atauro Polygon shapefile. This geology map is based on the geology map in the Atauro folder (see below for details). It is essentially a copy of this map but it has extra attributes added for the new map symbols (to match in with the ETGeo_stcol mainland map and, for new geological units, to match in with Australian and International standards) and for more information on how the geology was interpreted plus the hydrogeology information assigned to the various geological units. This map then provided the base for the input in the geology_whole2 map and the hydgeo_atauro (see hydrogeology file). The assigned attributes were based on the interpretations listed in the EtGeol_attributes_standard_colour.xlsx.
26

Katálogu daduskoletanea no rejistu dadus
To insert this information into the attribute table a similar method was used as for the ETGeo_stcol map: To do this Dr. Wallace analysed the data and assigned map symbols and further geology descriptions. These were then added to the attribute table using the 'Add Field' tool and then in an edit session using SQL queries to select relevant files and then the field calculator to insert the new attributes. The map symbols were then used as the display category and each map symbol was given a colour based on the Australian and international standards as advised by Alan Whittaker. This geology map is for Atauro only but was used to merge with the other geology maps to make the whole of country geology map geology_Oecussi Polygon shapefile. Based on the geology shapefile (not sure of source of geolgoy shapefile). This shapefile was used as the ETGeolv10LL did not cover this area. This file was clipped from the geology shapefile using the Oecussi border polygon in the admin&infra folder (In the toolbox - Analysis tool > Extract > Clip). And then, similar to the ETGeo_stcol, the geological map units were assigned a new map symbol, differently formatted geology information and hydrogeological information. Note: some the geological units in this map did not have any information apart from age - these are the sections that are marked as 'Unknown's in the map - this is because it is believed that this map is based on the ESCAP map - which has some areas where the geological units are not defined. This is the most up-to-date version of geology for Oecussi that was possible to use. This shapefile was also used for the hydrogeology geology_SEcorner Polygon shapefile. The ETGeolv10LL (based on work done by Audley Charles and others) does not cover the SE corner of Timor-Leste (a roughly triangular shape 13km by 15km) Therefore this area also used the geology shapefile as a source of geology. To make it was a similar process to the geology _Oecussi and the same issues apply: Based on the geology shapefile (not sure of source of geology shapefile). This shapefile was used as the ETGeolv10LL did not cover this area. This file was clipped from the geology shapefile using the Oecussi border polygon in the admin&infra folder (In the toolbox - Analysis tool > Extract > Clip). And then, similar to the ETGeo_stcol, the geological map units were assigned a new map symbol, differently formatted geology information and hydrogeological information. Note: some the geological units in this map did not have any information apart from age - these are the sections that are marked as 'Unknown's in the map - this is because it is believed that this map is based on the ESCAP map - which has some areas where the geological units are not defined. This is the most up-to-date version of geology for SE corner that was possible to use. This shapefile was also used for the hydrogeology. geology_SEcornerMapSymbol Polygon shapefile. Based on geology_SEcorner this is essnetially the same map except that the attribute table only contains the original and the new map symbols. This was created so that it could be easily merged with the other geology maps to make the whole of country map. geology_whole2 Polygon shapefile. Based on ETGeo_stcol, geology_Atauro, goelogy_Oecussi and geology_SEcorner, this is a merged copy of all of those files. The only attributes it contains are the assigned map symbols and in the case of the Atauro, Oecussi and SEcorner there are the map symbols from the original files. These were included so that they are noted and where there are unknowns they can be easily differentiated from each other. In order to merge shapefiles the following steps were taken: In the toolbox - Data Management Tools > General > Merge then select all of the data sets you want to include give the output dataset a name (or leave as the default)
27

Katálogu daduskoletanea no rejistu dadus
In the 'Field Map' box all of the attribute column titles will appear - select only those attributes you want merged (note - if there are columns of attributes in different shapefiles that need to be in the same column in the new shapefile then they will need to have the same name - either that or use the 'Field Calculator' to merge the two columns into a new third one once the new shapefile is made - but designating the same name from the beginning is easier to process and less complex and confusing later. Then select 'OK' In this case the output was a geology map that covers the whole of Timor-Leste, including Atauro, Oecussi, SEcorner. This map also uses a consistent map symbol labelling (designated by the project). It is therefore used in the output of a new geology map for Timor-Leste. Maps previous to this are difficult to obtain, do not cover the whole area and in the case of GIS do not have metadata so no background information can be ascertained. geology_whole2_fissured Polygon shapefile. Based on the geology_whole2 shapefile, this map only has the geology for the areas that have been designated as being fissured aquifers (previously called karst). This shapefile was made for a map in the hydrogeology report to demonstrate the geological characteristics of the karst aquifers. This map was made by taking the geology_whole2 and then clipping it using the fissuerd_whole2 (see hydrogeology folder) as a the clip polygon. Then all that was left were only those areas that were designated as fissured aquifers. To use the clip tool: In the toolbox - Analysis Tools > Extract > Clip In the window that opens select the file you want clipped (geology_whole2), then the clip features (fissured_whole2) then give an output name or leave default. For this project rest was left in default but can be adjusted as necessary. geology_whole2_intergran Polygon shapefile. Based on the geology_whole2 shapefile, this map only has the geology for the areas that have been designated as being intergranular aquifers (previously called sedimentary). This shapefile was made for a map in the hydrogeology report - to demonstrate the geological characteristics of the karst aquifers. This map was made by taking the geology_whole2 and then clipping it using the Intergran_whole2 (see hydrogeology folder) as the clip polygon. Then all that was left were only those areas that were designated as intergranular aquifers. To use the clip tool: In the toolbox - Analysis Tools > Extract > Clip In the window that opens select the file you want clipped (geology_whole2), then the clip features (intergran_whole2) then give an output name or leave default. For this project rest was left in default but can be adjusted as necessary. geology_whole2_LocAquif Polygon shapefile. Based on the geology_whole2 shapefile, this map only has the geology for the areas that have been designated as being localised aquifers (previously called fractured rock, high yield). This shapefile was made for a map in the hydrogeology report to demonstrate the geological characteristics of the karst aquifers. This map was made by taking the geology_whole2 and then clipping it using the Local_aquifer_whole2 (see hydrogeology folder) as the clip polygon. Then all that was left were only those areas that were designated as localised aquifers. To use the clip tool: In the toolbox - Analysis Tools > Extract > Clip In the window that opens select the file you want clipped (geology_whole2), then the clip features (local_aquifer_whole2) then give an output name or leave default. For this project, therest was left in default but can be adjusted as necessary.
28

Katálogu daduskoletanea no rejistu dadus
geology_whole2_LocConfin Polygon shapefile. Based on the geology_whole2 shapefile, this map only has the geology for the areas that have been designated as being localised aquifers (previously called fractured rock, low yield). This shapefile was made for a map in the hydrogeology report to demonstrate the geological characteristics of the karst aquifers. This map was made by taking the geology_whole2 and then clipping it using the Local_confin_whole2 (see hydrogeology folder) as the clip polygon. Then all that was left were only those areas that were designated as localised aquifers. To use the clip tool: In the toolbox - Analysis Tools > Extract > Clip In the window that opens, select the file you want clipped (geology_whole2), then the clip features (local_confin_whole2) then give an output name or leave default. For this project, the rest was left in default but can be adjusted as necessary. ATAURO FOLDER: This folder contains all of the data given to the GA project team by Kim Ely who did research on the geology of the island under Mike Saniford of University of Melbourne. It was sent to GA on the 7th Dec 2010. The most recent version of that map was at that time being prepared for publication in the journal of Earth sciences and it was based on work carried out from 2005 onwards (we believe). These files are for the map produced for this work and as there was no metadata attached to them are listed to the best of our current knowledge. data1 Folder This folder contains two other folders which contain three ArcMap files and one .pdf file, all of which are maps of Atauro geology. The ArcMap files source the shapefiles in the Atauro folder - if these maps are to be used they must be kept with the source data. Although when the data is transferred from computer to computer, ArcMap will have to be directed to the location on the new computer. Alt_strong Polygon shapefile and layer file. Sourced from Kim Ely, December 2010. Shows areas on Atauro of strong alteration. Alteration is a geological process that happens when the rock is underground, usually along fractures in a weathering-like way. For more information ask geologist. Polygon shapefile stores the areas and layer file stores the display properties chosen by Kim Ely for the map she was making. The files need to be kept together for the layer file to work. Alt_weak Polygon shapefile and layer file. Sourced from Kim Ely, December 2010. Shows areas on Atauro of weak alteration. Alteration is a geological process that happens when the rock is underground, usually along fractures in a weathering-like way. For more information ask geologist. Polygon shapefile stores the areas and layer file stores the display properties chosen by Kim Ely for the map she was making. The files need to be kept together for the layer file to work. Atauro_samples database (.dbf) and layer file. Presumably holds information on where samples were taken from when field work was being conducted on Atauro. Assuming Kim or one of her teams holds more info on the samples. Not necessary to find out more information on them for this project. If need more information in future contact Kim Ely or Mike Saniford. Database in windows explorer operates similar to, and can be viewed by, excel. In ArcGIS it is used as a reference table, similar to an attribute table but does not have shapefiles with it. Used to store large quantities of info and reference and/or cross reference different shapefiles. Layer file like others described here.
29

Katálogu daduskoletanea no rejistu dadus
Atauro_towns Point shapefile and layer file. Sourced from Kim Ely, December 2010. Depicts the points of the towns on Atauro. Attribute table has names of towns. Point shapefiles houses locations and layer files houses the display properties selected by Kim Ely for map she was producing. be_manas Point shapefile and layer file. Sourced from Kim Ely, December 2010. Shows four points, no information in attribute table. After cross-referencing with the text on the map produced shows points where hot springs occur on Atauro. Unsure if be_manas is Tetun or Tetun derived word for hot springs. Point shapefiles houses locations and layer files houses the display properties selected by Kim Ely for map she was producing. Bedding Line shapefile. Sourced from Kim Ely, December 2010. Line shapes on Atauro that indicate the direction of bedding of rocks in some areas of Atauro. Used in map that was produced. Attribute table states whether the bedding is a strike, dip or flow direction. Line shapefile houses location and layer file houses the display properties selected by Kim Ely for the map she was producing. Faults Line shapefile and layer file. Sourced from Kim Ely, December 2010. Shows lines where faulting occurs on Atauro. This is needed on geology maps. Digitised during 2005 field trip. In attribute table there are two columns, one title 'sense' under this the polylines are either 'normal' or blank, the other column is titled 'confidence' in this the majority is blank but one polyline has 'inferred' written in. Line shapefile houses location and layer file houses the display properties selected by Kim Ely for the map she was producing. Lithology Layer file. Sourced from Kim Ely, December 2010. Based on the Pleistocene sediments-merge shapefile - see below. Houses the display properties for this shapefile. Used in the map produced by Kim Ely Pleistocene sediments-merge Polygon shapefile. Sourced from Kim Ely, December 2010. Polygons depicting the geology of Atauro as used for the map Kim Ely was producing. Has the geology for the entire island and attribute table only has one column - the map symbols that were used for this map. For more information on what the map symbols mean refer back to the final maps that were produced in the data1 folder (particularly the .pdf file). In the legend for this there is more information on each of the map symbols and what rock type they are referring back to. topo_features Point shapefile and layer file sourced from Kim Ely, December 2010. Shows three points depicting the mountains/ highest points of Atauro. Attribute table holds the names for the mountains. Point shapefile houses locations and layer file houses display properties as used in the map produced.
README for ‘land_info’ This folder contains all of the land information files for the GA TL project running from June 2010 to Dec 2011
30
Katálogu daduskoletanea no rejistu dadus
The files in this folder are either sourced from the TL government, various stakeholders or are outputs of the project. If outputs are present in this folder the methodology for creating them is also here. The names and sources/methodology for creation are as follows: erodible2 From ALGIS - Nicholas'08 folder, country divided into two types polygon; high erodibility and no data - could be used to identify areas of high run-off high_fertility From ALGIS - Nicholas'08 folder, has a number of polygons showing areas of high fertility land_plan_District From ALGIS - Nicholas'08 folder, divides country into a range of polygons identifying both current uses and potential/planned future uses wat6_3 From ALGIS - Nicholas'08 folder - need to check meaning with Luke Landcover ALGIS - Raster - Shapefiles, country divided into polygons based on land use, shows what land is being used for (eg. forest, agriculture, etc) and agriculture subdivided into types and then there are obs and comments on some of the land types soils ALGIS - Vector - Earth Sciences, basic polygon soil map - divides soils into 'greatsoil' eg Calciustolls, 'suborder' eg Ustolls and 'orders' eg Mollisols slopes ALGIS - Vector - Elevation, polygon map of whole country divides areas into a slope of S, F or M (assuming steep, flat or medium) polygons are large and coarse rice fields ALGIS - Vector - Land Cover (DNGRA also has copy), polygon map showing various areas where rice is grown in TL, divides between rainfed and irrigated rice - may be useful for calculating consumption/knowing irrigation areas landcoverCopy ALGIS - Vector - Land cover, exactly the same as other landcover map; country divided into polygons based on land use, shows what land is being used for (eg. forest, agriculture, etc) and agriculture subdivided into types and then there are obs and comments on some of the land types lum_w ALGIS - Nicholas '08, Polygon map - divides mainland TL into polygons which divide into areas of Agriculture, Agroforestry/grazing, Forest/Agroforestry and no data (for areas outside mainland TL)
31

Katálogu daduskoletanea no rejistu dadus
README for ‘natural_habitat’ This folder contains all of the natural habitat files for the GA TL project running from June 2010 to Dec 2011 The files in this folder are either sourced from the TL government, various stakeholders or are outputs of the project. If outputs are present in this folder the methodology for creating them is also here. The names and sources/methodology for creation are as follows: BVA ALGIS - Raster - Shapefiles, seems to be either protected areas or potential protected areas/high biodiversity ESM ALGIS - Raster - Shapefiles, division of country into very high, high, med & low sensitivity (no other info) ImportantBirdArea ALGIS - Raster - Shapefiles, polygons of areas which are of high importance to birdlife Landcover ALGIS - Raster - Shapefiles, country divided into polygons based on land use, good detail on landuse, particularly agricultural sub-divisions Timor_Coastal_Marine_Habitats_Nth ALGIS - Timor_Coastal_Marine_Habitats_Nth, North coastline (and just off coastline) divided into marine habitats e.g. sand beach, mangrove forest, etc.
README for ‘non_dig_maps’ This folder contains all of the non digitised map files (rasters or jpegs of maps that only hard copies exist of also not geo-referenced) for the GA TL project running from June 2010 to Dec 2011 The files in this folder are either sourced from the TL government, various stakeholders or are outputs of the project. If outputs are present in this folder the methodology for creating them is also here. The names and sources/methodology for creation are as follows: ALGIS folder - The maps in this folder are all from ALGIS. There were no other metadata attached to these maps. Names are generally self explanatory (Copy on end is brought across from a sub-folder - need to check whether exact copy or not): afp sample survey 2007 - basic agricultural map agroclimatic_zones edit2 - divided based on lowland, slope, highland and low, mod high rainfall annual_rainfall - basic contour rainfall map - same as shapefile from ALGIS (see climate folder)
32

Katálogu daduskoletanea no rejistu dadus
bathymetric - only some of coastline bathymetric contours Copy of steve_dunn - called 'The Proposed Refrigerator (cold chain) Locations by Sub District' basic map with major towns, roads and districts with a few points identified forest_status - shows areas of settlement and where forest is nature reserve, protection forest, convertible production forest, wildlife reserve or recreation park soil_taxonomy - shows soil categories/groups for whole of country - have similar digitised version tl_admin_subdist_a0 - shows sub-districts, major towns and roads A0 Nat_Res, THIS MAP IS NOT DIGITISED, this is the map from Natural Resources where only hard copies exist.DSmeone from Perth (one person from a Uni and another from a company) took pictures of it and were going to try and digitise it (visited Natural Resources in Feb/March) but haven't heard back from them. Need to chase up to see if they were successful
README for ‘recharge’ This folder contains all of the recharge files for the GA TL project running from June 2010 to Dec 2011 The files in this folder are either sourced from the TL government, various stakeholders or are outputs of the project. If outputs are present in this folder the methodology for creating them is also here. The names and sources/methodology for creation are as follows: Water_balance_method Folder: This folder was created because using the water balance equation was one of the methods used in attempting to find recharge. This equation is as follows: D = P - RO - ET - deltaW where: D = Deep drainage/recharge P = Precipitation RO = Run Off ET = Evapotranspiration delatW = change in water soil storage For this equation we used the annual rainfall map from ALGIS, the ADB water report for Run Off and to get ET we used the Blanley-Criddle method using the ALGIS meteorological data to source the average temperature info. The following method was used: We based the test runs on the surface water catchments used in the Run Off report as there was no other way to apply the run off numbers. Made a copy of the surface water catchments shapefile from ALGIS and then deleting all other polygons except for the catchment we were working on to get boundary. Used this and the clip tool (Analysis Tools > Extract > Clip) to clip the rainfall shapefile to the catchment size. First the clipped file needed to be reprojected into a mercator format. Then in the new clipped file,in the attribute table added a new field called area (Options > add field).
33
Katálogu daduskoletanea no rejistu dadus
Then in an edit session right click on the area field and click calculate geometry. In property select area and then select area and then in the units option select Square meters. In an excel table (see the ones in the Laclo and Loes test runs) use the areas and the median for that rainfall range (in meters) times together to calculate annual rainfall in m3 (m2 for area and m deep for rainfall). Then the ADB run off report was used to find the annual run off for that catchment (in MCM - million cubic meters). This then gave the P-RO by minus the RO number from the P number calculated. To find ET the Blanley-Criddle method was used. The equation is as follows: ET = k * p * (0.46 * Ta + 8.13) where: k = plant consumptive coefficient - a number between 0.5 (orange trees) to 1.2 (dense natural vegetation) and represents the plant use of water, we used a k of 0.85 and then 0.65 p = percentage of daylight hours - in this case it was assumed there were 12 hour days as it is close to the equator so therefore the equation was p=(12*30)*100/(12*365) - although the 30 may change depending on how many days there were in that month 0.46 and 8.13 are constants Ta = average temperature - sourced from the ALGIS meteorological data This equation was first calculated in months averaged across the years we had data for and then these results were added together to give the annual ET in mm. This was then divided by 1000 to give the number in m and then multiplied by the area to give the annual ET in m3 which could then be put into the equation. deltaW was not used in this instance as we were attempting to find out the annual average and it was not an event analysis. Each of these numbers to put into the water balance equation were calculated in an excel spreadsheet and then the number was added under a field in the attribute table of the Run Off/boundary shapefiles. Then the a field titled recharge was added to the attribute table and (in an edit session) right click on the title of this field and then use the field calculator to produce the recharge figure. The numbers produced from this procedure mostly gave a negative number namely due to the large ET because the calculation for ET produces potential ET which is not the same as actual ET which we do not have the means/data to calculate
README for ‘working’ This folder contains all of the working files for the GA TL project running from June 2010 to Dec 2011 The files in this folder are the currently being worked on. For more information please see source files or ask Sam or Luke
34

Katálogu daduskoletanea no rejistu dadus
Attachment 3: Example of a metadata record from the Timor-Leste project This is an example of a metadata record that is attached to an ArcGIS file. This example is from one file, in this case the first draft of the hydrogeology map (made by the project). Metadata records have been completed for both the collected files and the files produced by the project, in total over 100 files. (note: some of the unknowns are due to the original data not having metadata, ideally when the data is first created this information would be filled out and could then be used for datasets produced from this)
ISO and ESRI Metadata:
Resource Information
Spatial Representation Information
Reference System Information
Data Quality Information
Distribution Information
Metadata Information
Metadata elements shown with blue text are defined in the International Organization for Standardization's
(ISO) document 19115 Geographic Information - Metadata. Elements shown with green text are defined by
ESRI and will be documented as extentions to the ISO 19115. Elements shown with a green asterisk (*) will be
automatically updated by ArcCatalog.
Resource Information:
Title: hydgeo_1 Alternate title(s): hydgeo_1.shp
Abstract: Polygon map - This is the first attempt at a hydrogeology map for East Timor. It uses the ETGeol10LL as a basis. From this Dr. Luke Wallace assigned each of the types of geologic units in the attribute table an aquifer type (karst, sedimentary or fractured rock), a potential yield (high or low) and then gave a general rock type description. These three attributes were then input into the hydgeo_1 attribute table using the steps in ArcMap as set out in the readme.txt in this folder.
35

Katálogu daduskoletanea no rejistu dadus
This map was made by Samantha Dawson in October 2010 as part of the East Timor groundwater project at GA. Please see groundwater group for any queries or questions Creation Date: 2010-10 Revision Date: 2010-10 *Presentation format: digital map
Custodian Organisation: External Agency/Company Contact's position: various
Contact information: Phone: Voice: see Metadata Contact Fax: see Metadata Contact Address: Delivery point: see Metadata Contact City: see Metadata Contact Administrative area: see Metadata Contact Postal code: see Metadata Contact Country: see Metadata Contact e-mail address: see Metadata Contact Online resource: Online Location: see Metadata Contact
Back to Top Themes or categories of the resource: inland waters
Theme keywords: Keywords: GEOSCIENCES-Geology, BOUNDARIES-Biophysical, GEOSCIENCES-Hydrogeology, WATER-Groundwater, WATER-Supply
Thesaurus name: Title: ANZLIC Search Words
Revision Date: 2008-05-15 Edition: Version 2.1 Edition date: 2008-05-15
*Dataset language: English
Update Status: onGoing
Resource constraints: Access constraints:
This dataset essentially belongs to the Timor Leste government, it was made by the GA Groundwater Group as part of a groundwater mapping project in 2010/11. It was made using data sourced from the Timor Leste government and will be given back to them along with the other project outputs. Although there were no restrictions given by the Timor Leste government on the use of their data or the datasets produced from this project the Timor
36

Katálogu daduskoletanea no rejistu dadus
Leste government and Geoscience Australia should be recognised appropriately when using this map. For permission to use this map please contact Geoscience Australia.
Limitations of use:
This map is based on another map/s and/or data that was sourced from the Timor Leste government. For all of the original data there was no metadata or other information attached therefore it's fitness for use outside the 2010/11 Timor Leste groundwater mapping project by GA is questionable. We are uncertain as to data quality, resolution, creation date or methods. Therefore the use of this map in other project is not advisable unless no other alternative data can be used and the limitations/error factor of this data should be recognised.
*Spatial representation type: vector
Spatial resolution: Dataset's scale: Scale denominator: unsure
Resource's bounding rectangle: *Extent type: Full extent in decimal degrees *Extent contains the resource: Yes *West longitude: 123.268126 *East longitude: 127.343306 *North latitude: -8.322121 *South latitude: -10.371934
Dataset point of contact: Organisation: Geoscience Australia - Groundwater Group, GEMD Contact's position: Divisional Information Manager - GEMD
Contact information: Phone: Voice: 1800 800 173 Fax: (02) 6249 9999 Address: Delivery point: GPO Box 378 City: Canberra Administrative area: ACT Postal code: 2601 Country: Australia e-mail address: [email protected] Online resource: Online Location: http://www.ga.gov.au/sales
Back to Top
Spatial Representation - Vector:
*Level of topology for this dataset: geometry only Geometric objects:
37

Katálogu daduskoletanea no rejistu dadus
*Name: hydgeo_1 *Object type: complexes *Object count: 1922
Back to Top
Reference System Information:
Reference system identifier: *Value: GCS_WGS_1984
Back to Top
Data Quality Information:
Lineage: Polygon map - This is the first attempt at a hydrogeology map for East Timor. It uses the ETGeol10LL as a basis. From this Dr. Luke Wallace assigned each of the types of geologic units in the attribute table an aquifer type (karst, sedimentary or fractured rock), a potential yield (high or low) and then gave a general rock type description. These three attributes were then input into the hydgeo_1 attribute table using the steps in ArcMap as set out in the readme.txt in this folder. This map was made by Samantha Dawson in October 2010 as part of the East Timor groundwater project at GA. Please see groundwater group for any queries or questions. As this is the beginning of the project there will be modifications to this map in the near future. We are unable to say at the moment how often the dataset will be updated post-project.
Source data acknowledgements: Data quality report - Absolute positional accuracy:
Unable to ascertain
Data quality report - Attribute accuracy:
Unable to ascertain
Data quality report - Conceptual consistency:
Unable to ascertain
Data quality report - Completeness:
Unable to ascertain
Back to Top
38

Katálogu daduskoletanea no rejistu dadus
Distribution Information:
Distributor's name: Geoscience Australia Contact's position: Sales Office
Contact information: Phone: Voice: +61 2 6249 9966 Fax: +61 2 6249 9960 Address: Delivery point: GPO Box 378 City: Canberra Administrative area: ACT Postal code: 2601 Country: Australia e-mail address: [email protected] Online resource: Online Location: http://www.ga.gov.au/sales/
Distribution format: Format name: ArcGIS layer file
Transfer options: *Transfer size: 20.745
*Online Location: file://\\Nas2\gemd\water\Projects\East_Timor_groundwater\Data\GIS_working\hydrogeology\hydgeo_1.shp Available As: Departmental Data
Back to Top
Metadata Information
*Metadata language: English *Metadata character set: utf8 - 8 bit UCS Transfer Format
Last update: 2010-10-15
Metadata contact: Organisation: Geoscience Australia - Groundwater Group, GEMD Contact's position: Divisional Information Manager - GEMD
Contact information: Phone: Voice: 1800 800 173 Fax: (02) 6249 9999 Address: Delivery point: GPO Box 378 City: Canberra
39
Katálogu daduskoletanea no rejistu dadus
40
Administrative area: ACT Postal code: 2601 Country: Australia e-mail address: [email protected] Online resource: Online Location: http://www.ga.gov.au/sales
*Scope of the data described by the metadata: dataset *Scope name: dataset
Name of the metadata standard used: ANZLIC Metadata Profile Version of the metadata standard: 1.1
Metadata identifier: 6BF06A72-12CE-473D-A431-6C7ADBB3B821
Back to Top


![Untitled-1 [arkajainuniversity.ac.in] · 1 day ago · no_i. program b.opto b.tech-cse ba-eco ba-eng ba-eng ba-eng ba-fd ba-fd ba-jmc ba-jmc bba bba bba enrollment number aju/180873](https://cdn.vdocuments.us/doc/165x107/5fa3d6ad3d265943075a4ee9/untitled-1-1-day-ago-noi-program-bopto-btech-cse-ba-eco-ba-eng-ba-eng.jpg)


