KaBOOM!Using Asset-Based CommunityUsing Asset Based Community Development to Build Playspaces and Promote Play
April 2010Kiva R Wilson MEdKiva R. Wilson, [email protected](202) 464 6167
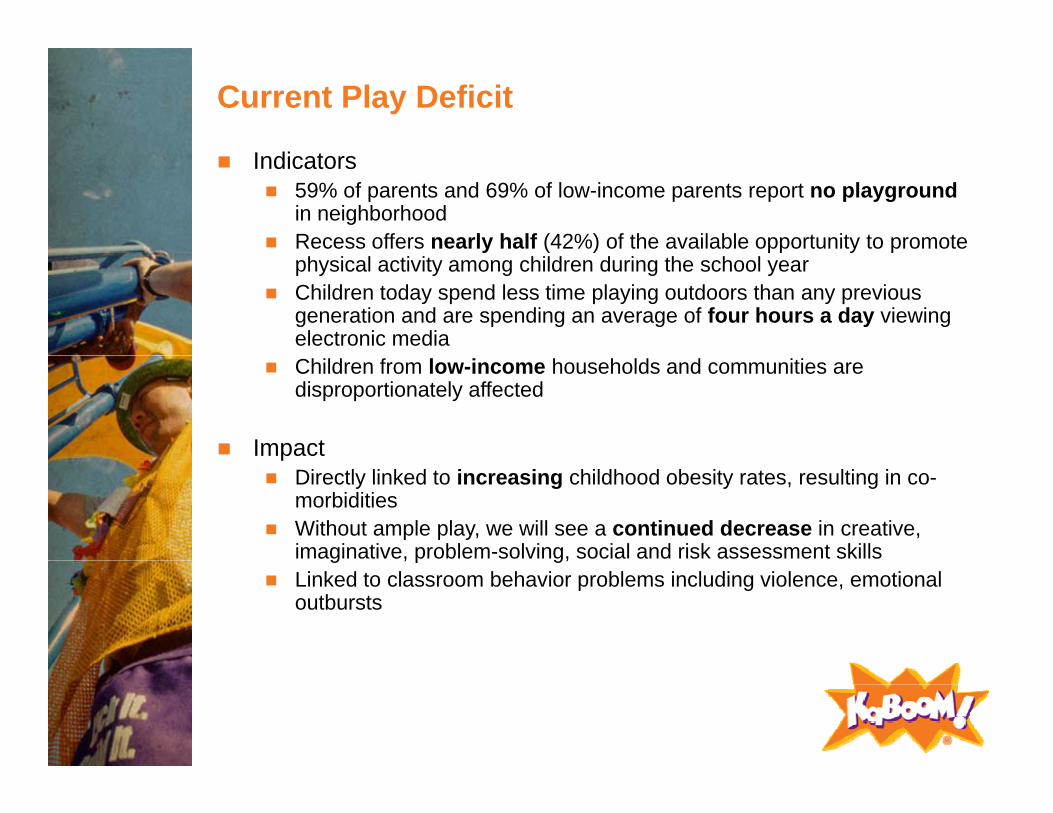
Current Play Deficit
Indicators59% of parents and 69% of low-income parents report no playgroundin neighborhood Recess offers nearly half (42%) of the available opportunity to promote y ( ) yphysical activity among children during the school yearChildren today spend less time playing outdoors than any previous generation and are spending an average of four hours a day viewing electronic mediaChildren from low-income households and communities are disproportionately affected
ImpactpDirectly linked to increasing childhood obesity rates, resulting in co-morbiditiesWithout ample play, we will see a continued decrease in creative, imaginative, problem-solving, social and risk assessment skillsg , p g,Linked to classroom behavior problems including violence, emotional outbursts
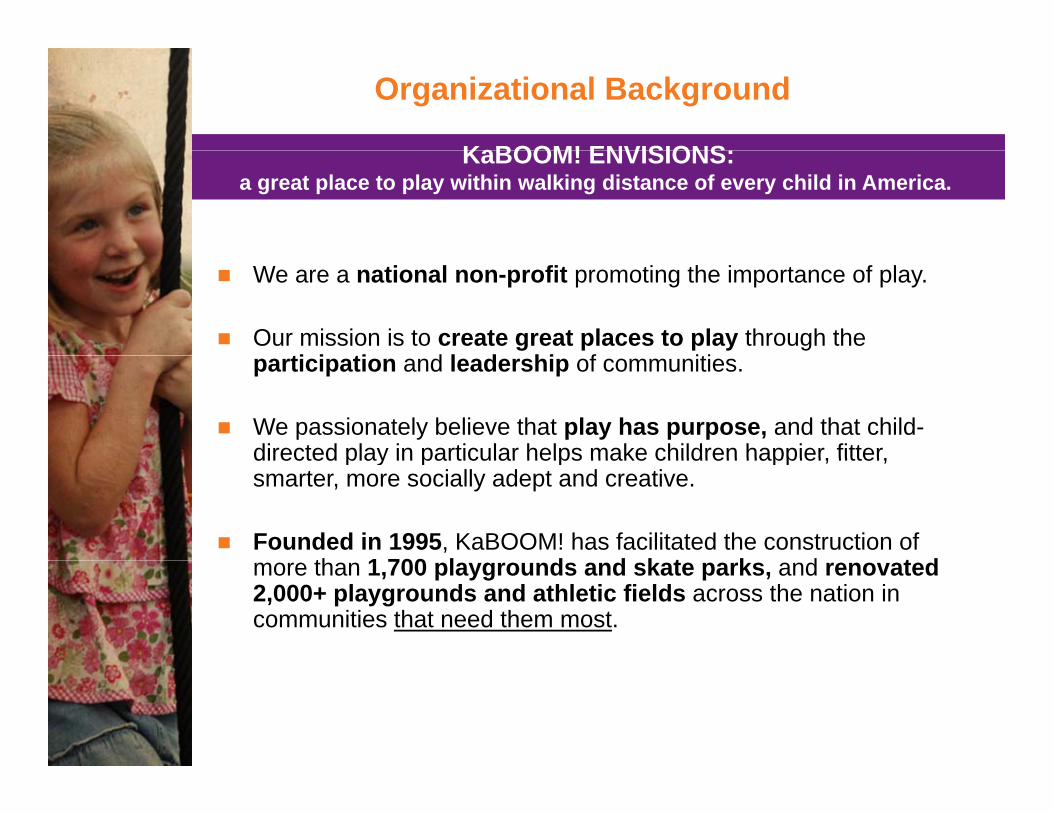
Organizational Background
KaBOOM! ENVISIONS:KaBOOM! ENVISIONS:a great place to play within walking distance of every child in America.
We are a national non-profit promoting the importance of play.
Our mission is to create great places to play through the ti i ti d l d hi f itiparticipation and leadership of communities.
We passionately believe that play has purpose, and that child-directed play in particular helps make children happier fitterdirected play in particular helps make children happier, fitter, smarter, more socially adept and creative.
Founded in 1995, KaBOOM! has facilitated the construction of th 1 700 l d d k t k d t dmore than 1,700 playgrounds and skate parks, and renovated
2,000+ playgrounds and athletic fields across the nation in communities that need them most.
Learning Objectives:ea g Object esExplain KaBOOM! Community-build model for engaging communities in playground building.Demonstrate how community-based build model canDemonstrate how community-based build model can increase opportunities for physical activity through playground building.
Presentation OutlineIntroduce KaBOOM!Introduce KaBOOM!Discuss the KaBOOM! Community-build model and its impact on communitiesSh h K BOOM! i i i i “M A ti ” b dShow how KaBOOM! is inspiring “Mass Action” beyond our KaBOOM!-led playground buildsIntroduce the Play Matters report
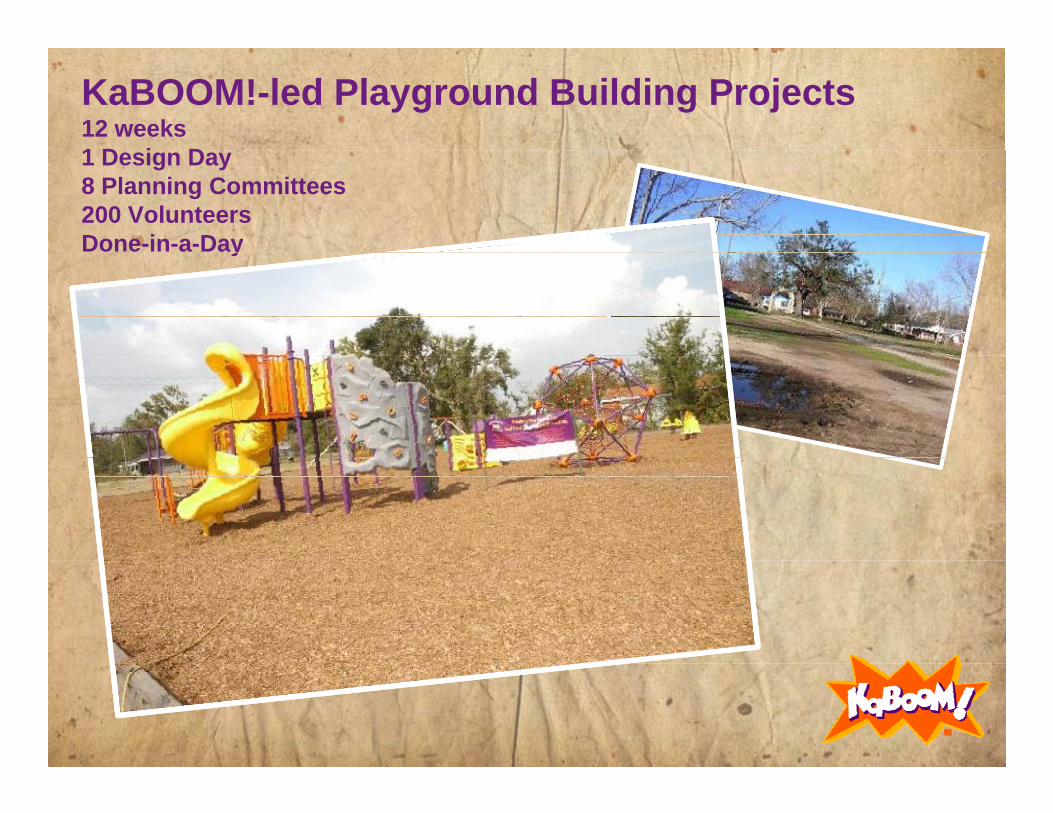
KaBOOM!-led Playground Building Projects12 weeks1 D i D1 Design Day8 Planning Committees 200 VolunteersDone-in-a-Dayy
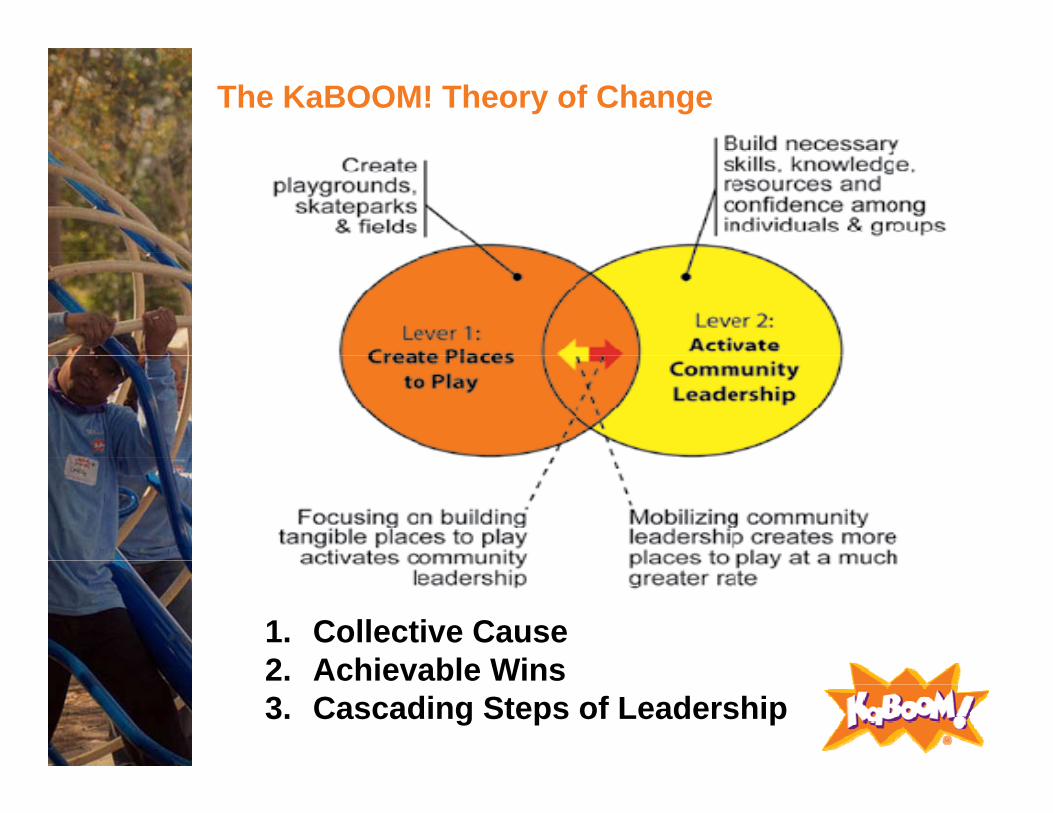
The KaBOOM! Theory of Change
1. Collective Cause2 A hi bl Wi2. Achievable Wins3. Cascading Steps of Leadership
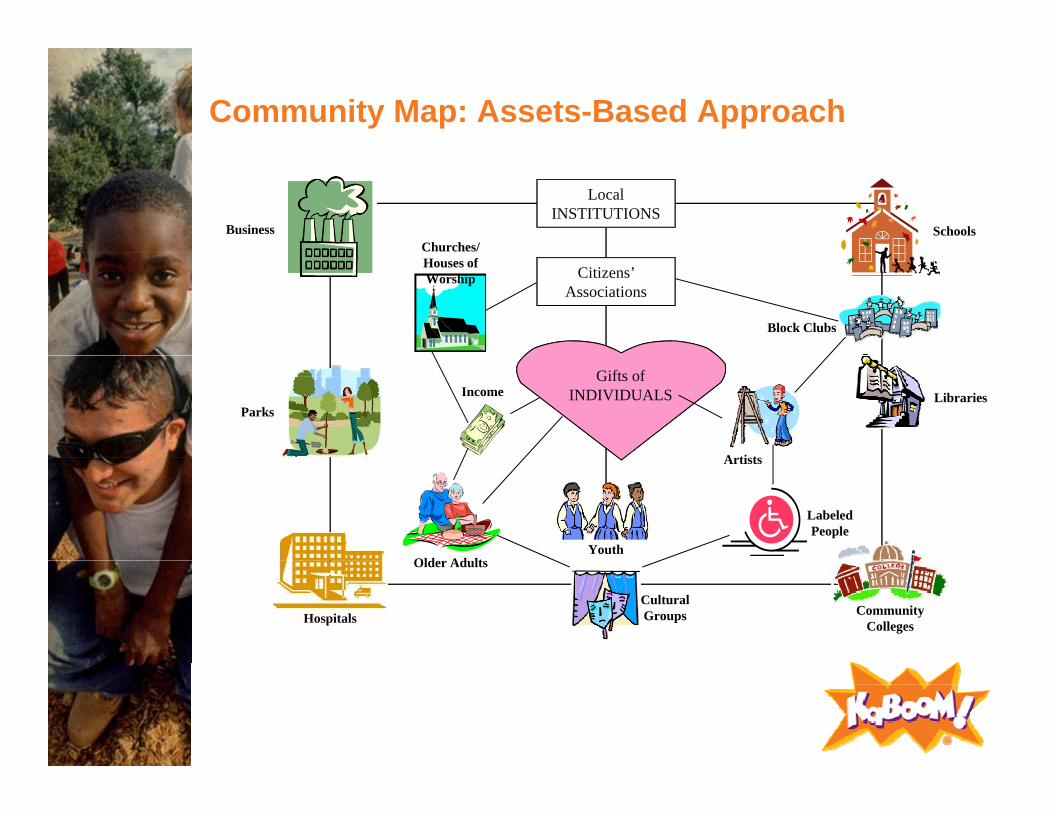
Community Map: Assets-Based Approach
Local INSTITUTIONS
SchoolsBusinessChurches/
Citizens’ Associations
Block Clubs
Houses of Worship
Gifts of INDIVIDUALS
Artists
LibrariesIncomeParks
Youth
Labeled People
Artists
Old Ad lt
Cultural Groups Community
Colleges
Older Adults
Hospitals
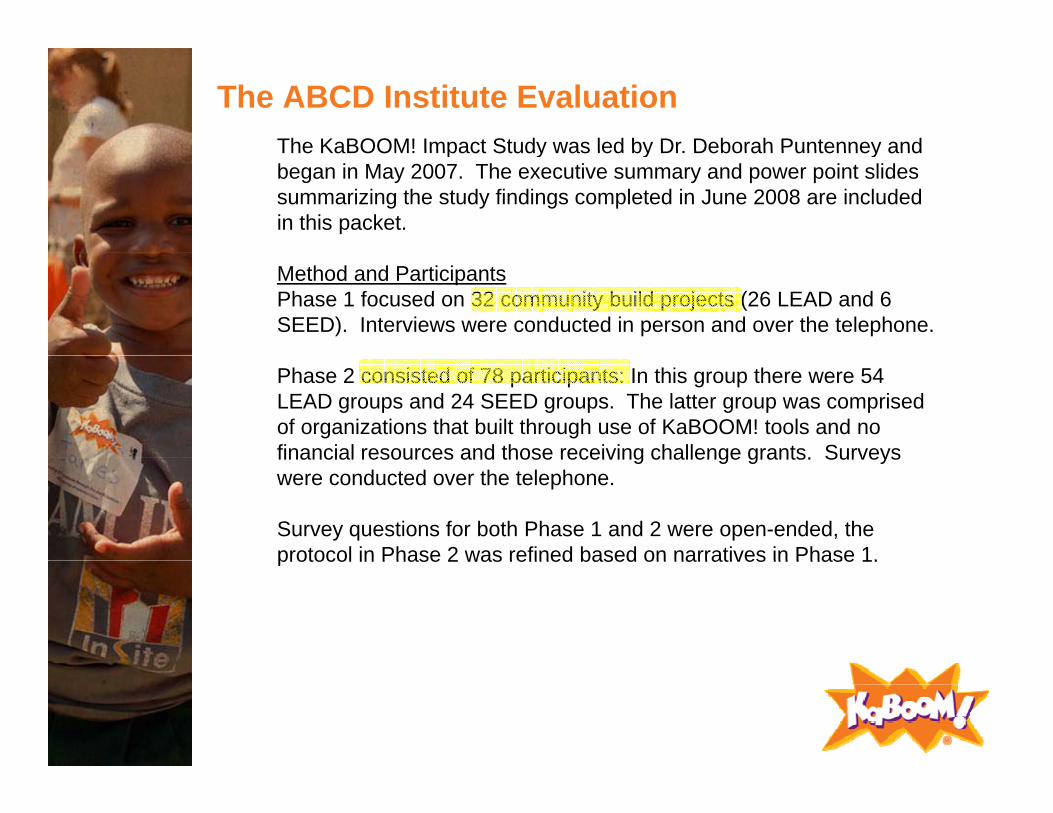
The ABCD Institute EvaluationThe KaBOOM! Impact Study was led by Dr Deborah Puntenney andThe KaBOOM! Impact Study was led by Dr. Deborah Puntenney and began in May 2007. The executive summary and power point slides summarizing the study findings completed in June 2008 are included in this packet.
Method and ParticipantsPhase 1 focused on 32 community build projects (26 LEAD and 6 SEED). Interviews were conducted in person and over the telephone.
Phase 2 consisted of 78 participants: In this group there were 54 LEAD groups and 24 SEED groups. The latter group was comprised of organizations that built through use of KaBOOM! tools and no financial resources and those receiving challenge grants. Surveysfinancial resources and those receiving challenge grants. Surveys were conducted over the telephone.
Survey questions for both Phase 1 and 2 were open-ended, the protocol in Phase 2 was refined based on narratives in Phase 1.protocol in Phase 2 was refined based on narratives in Phase 1.
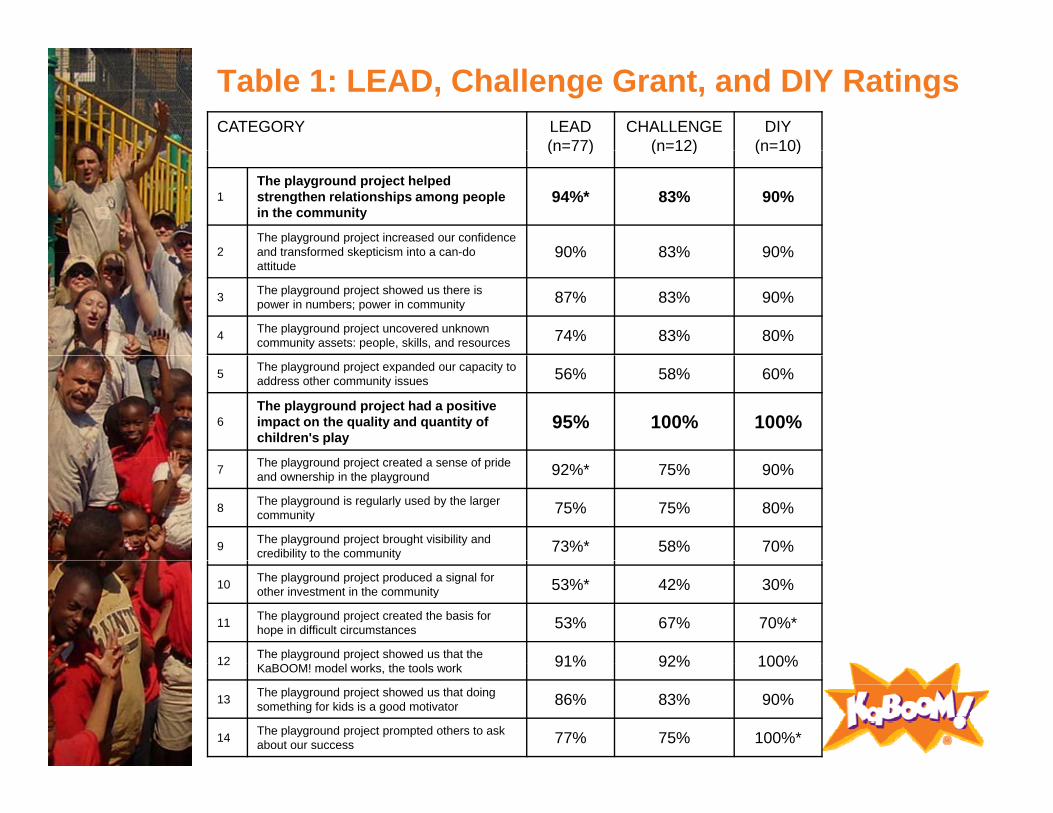
Table 1: LEAD, Challenge Grant, and DIY RatingsCATEGORY LEAD
(n=77)CHALLENGE
(n=12)DIY
(n=10)(n 77) (n 12) (n 10)
1The playground project helped strengthen relationships among people in the community
94%* 83% 90%
2The playground project increased our confidence and transformed skepticism into a can-do 90% 83% 90%2 and transformed skepticism into a can-do attitude
90% 83% 90%
3 The playground project showed us there is power in numbers; power in community 87% 83% 90%
4 The playground project uncovered unknown community assets: people, skills, and resources 74% 83% 80%
5 The playground project expanded our capacity to address other community issues 56% 58% 60%
6The playground project had a positive impact on the quality and quantity of children's play
95% 100% 100%
Th l d j d f id7 The playground project created a sense of pride and ownership in the playground 92%* 75% 90%
8 The playground is regularly used by the larger community 75% 75% 80%
9 The playground project brought visibility and credibility to the community 73%* 58% 70%
10 The playground project produced a signal for other investment in the community 53%* 42% 30%
11 The playground project created the basis for hope in difficult circumstances 53% 67% 70%*
12 The playground project showed us that the 91% 92% 100%12 KaBOOM! model works, the tools work 91% 92% 100%
13 The playground project showed us that doing something for kids is a good motivator 86% 83% 90%
14 The playground project prompted others to ask about our success 77% 75% 100%*
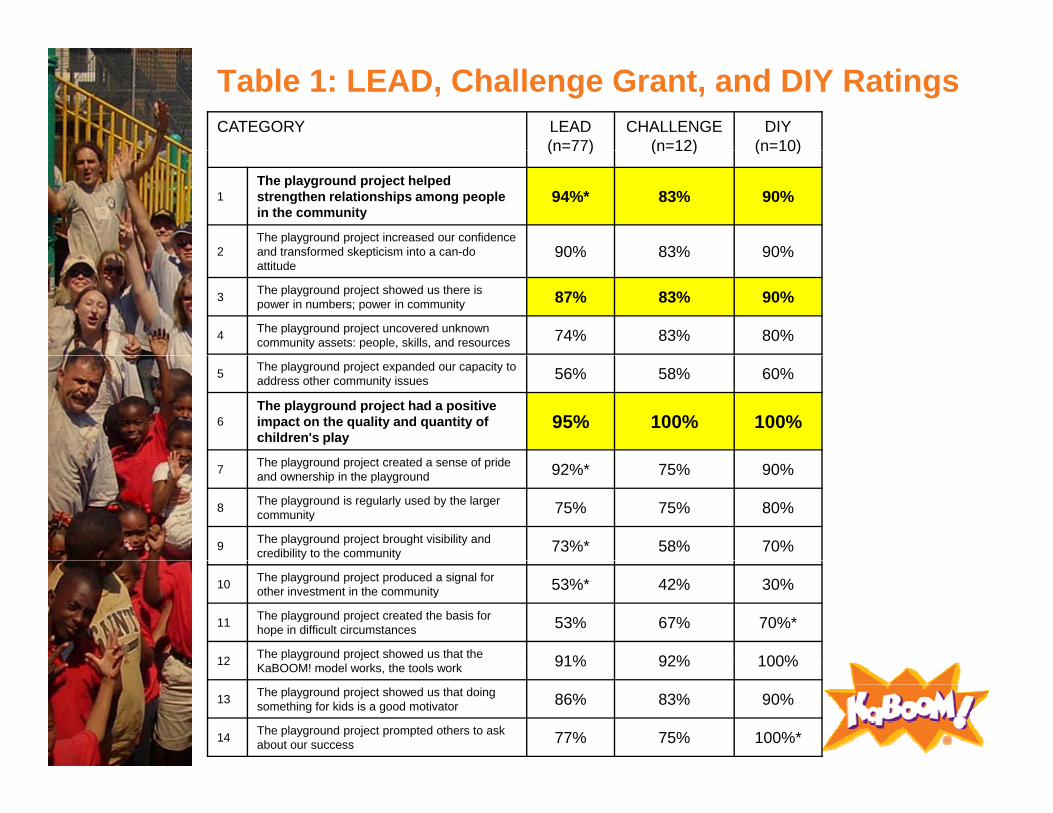
Table 1: LEAD, Challenge Grant, and DIY RatingsCATEGORY LEAD
(n=77)CHALLENGE
(n=12)DIY
(n=10)(n 77) (n 12) (n 10)
1The playground project helped strengthen relationships among people in the community
94%* 83% 90%
2The playground project increased our confidence and transformed skepticism into a can-do 90% 83% 90%2 and transformed skepticism into a can-do attitude
90% 83% 90%
3 The playground project showed us there is power in numbers; power in community 87% 83% 90%
4 The playground project uncovered unknown community assets: people, skills, and resources 74% 83% 80%
5 The playground project expanded our capacity to address other community issues 56% 58% 60%
6The playground project had a positive impact on the quality and quantity of children's play
95% 100% 100%
Th l d j t t d f id7 The playground project created a sense of pride and ownership in the playground 92%* 75% 90%
8 The playground is regularly used by the larger community 75% 75% 80%
9 The playground project brought visibility and credibility to the community 73%* 58% 70%
10 The playground project produced a signal for other investment in the community 53%* 42% 30%
11 The playground project created the basis for hope in difficult circumstances 53% 67% 70%*
12 The playground project showed us that the 91% 92% 100%12 KaBOOM! model works, the tools work 91% 92% 100%
13 The playground project showed us that doing something for kids is a good motivator 86% 83% 90%
14 The playground project prompted others to ask about our success 77% 75% 100%*
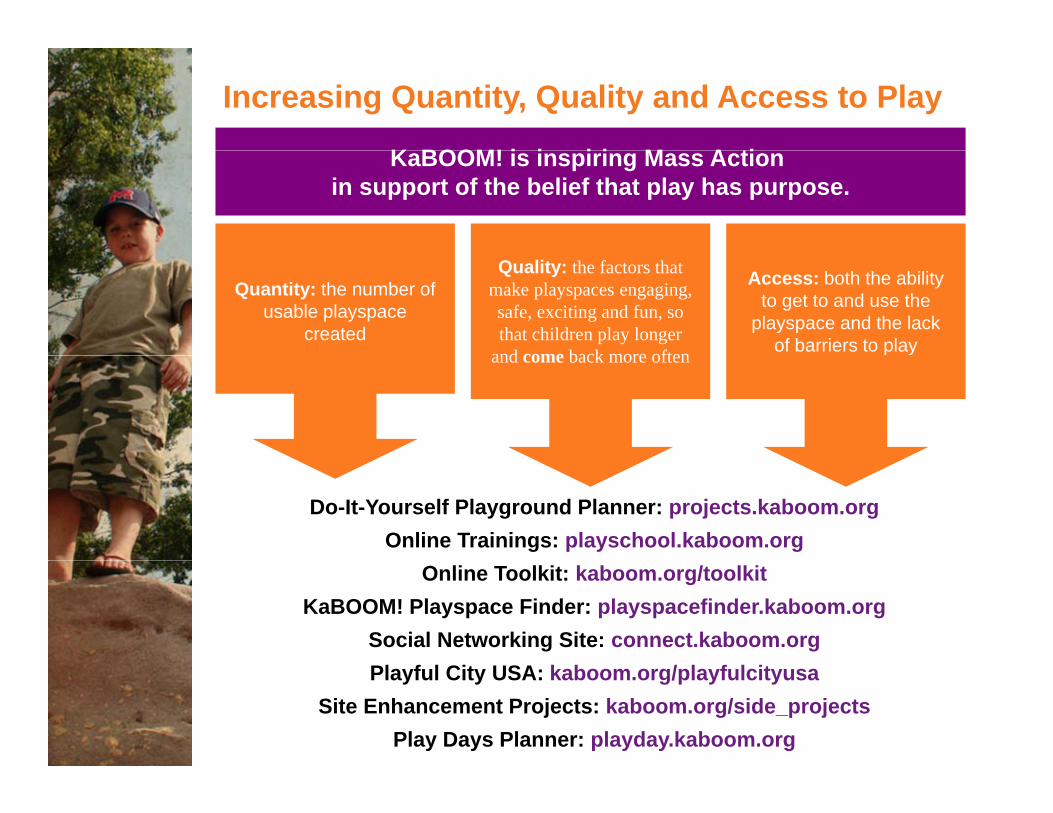
Increasing Quantity, Quality and Access to Play
K BOOM! i i i i M A tiKaBOOM! is inspiring Mass Action in support of the belief that play has purpose.
Access: both the ability to get to and use the
playspace and the lack of barriers to play
Quality: the factors that make playspaces engaging, safe, exciting and fun, so that children play longer
and come back more often
Quantity: the number of usable playspace
createdand come back more often
Do-It-Yourself Playground Planner: projects.kaboom.orgOnline Trainings: playschool.kaboom.org
Online Toolkit: kaboom.org/toolkitKaBOOM! Playspace Finder: playspacefinder.kaboom.org
Social Networking Site: connect.kaboom.orgPlayful City USA: kaboom.org/playfulcityusa
Site Enhancement Projects: kaboom.org/side_projectsPlay Days Planner: playday.kaboom.org

Increasing Quantity, Quality and Access to Play
Do-It-Yourself Playground Planner: projects.kaboom.org
O li T i i l h l k bOnline Trainings: playschool.kaboom.orgOnline Toolkit: kaboom.org/toolkit
K BOOM! Pl Fi dKaBOOM! Playspace Finder:playspacefinder.kaboom.org
Social Networking Site: connect kaboom orgSocial Networking Site: connect.kaboom.orgPlayful City USA: kaboom.org/playfulcityusa
Site Enhancement Projects:Site Enhancement Projects: kaboom.org/side_projects
Play Days Planner: playday.kaboom.org
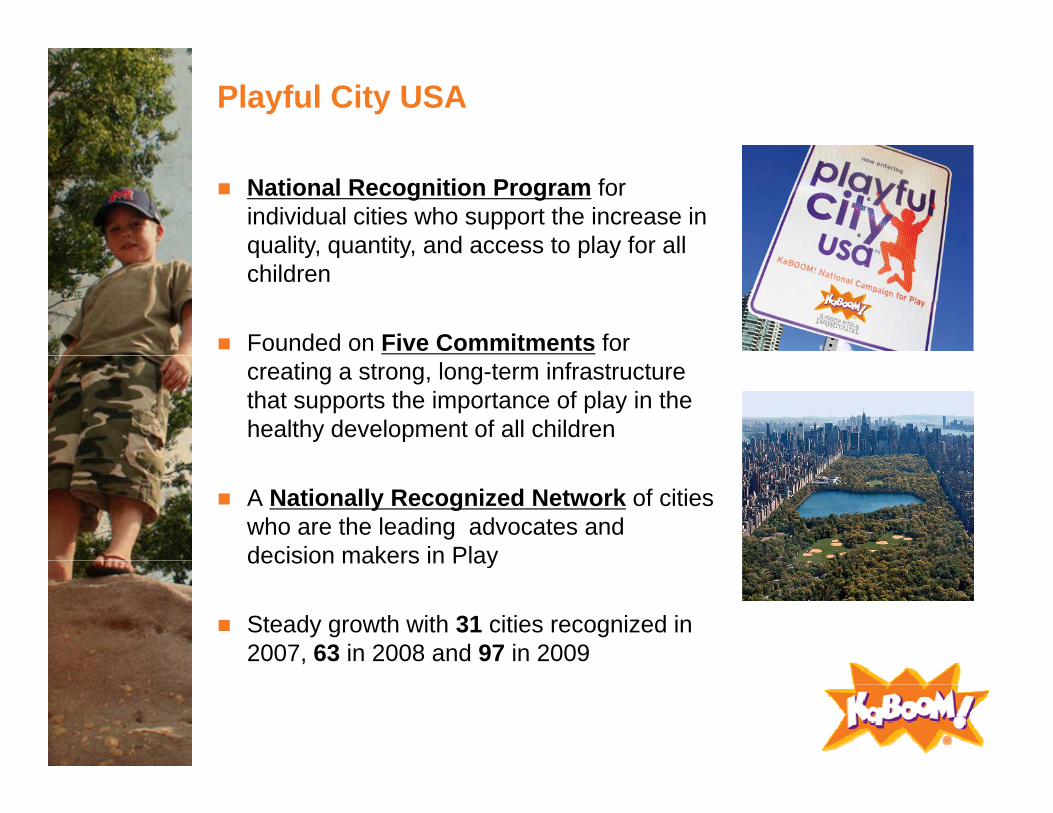
Playful City USA
National Recognition Program for individual cities who support the increase in quality, quantity, and access to play for allquality, quantity, and access to play for all children
Founded on Five Commitments for creating a strong, long-term infrastructure that supports the importance of play in the healthy development of all children
A Nationally Recognized Network of cities who are the leading advocates and decision makers in Playdecision makers in Play
Steady growth with 31 cities recognized in 2007, 63 in 2008 and 97 in 2009,
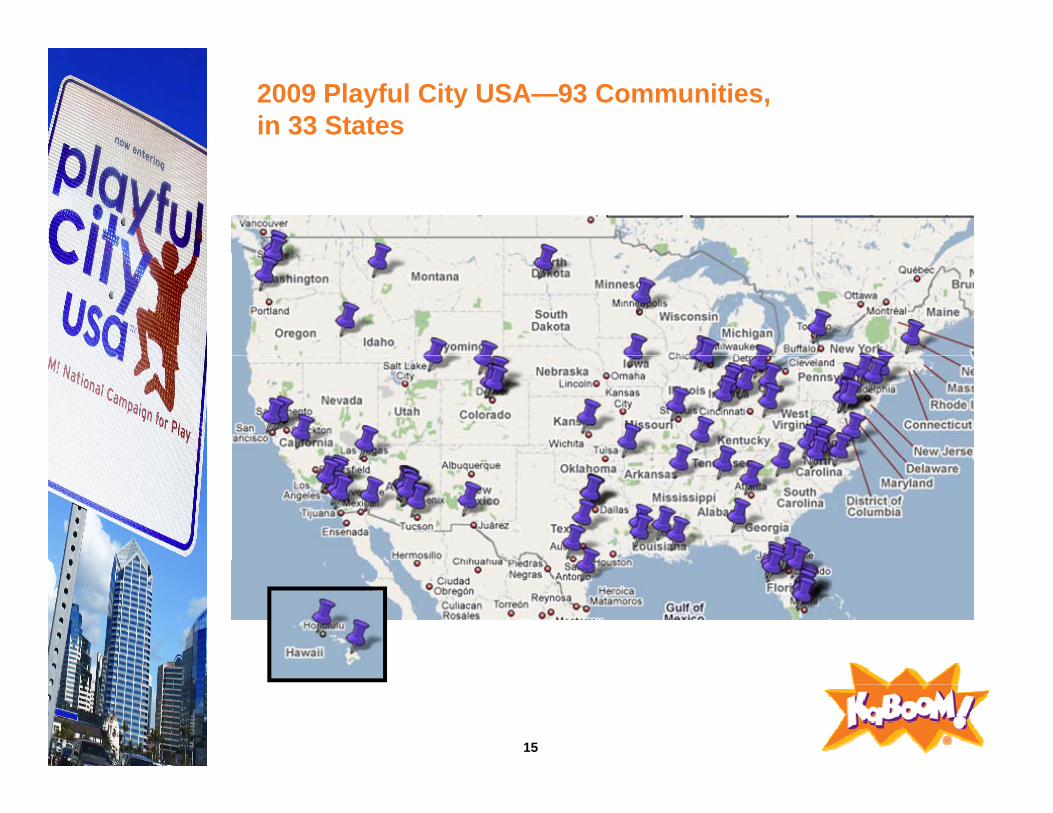
2009 Playful City USA—93 Communities, in 33 States
15
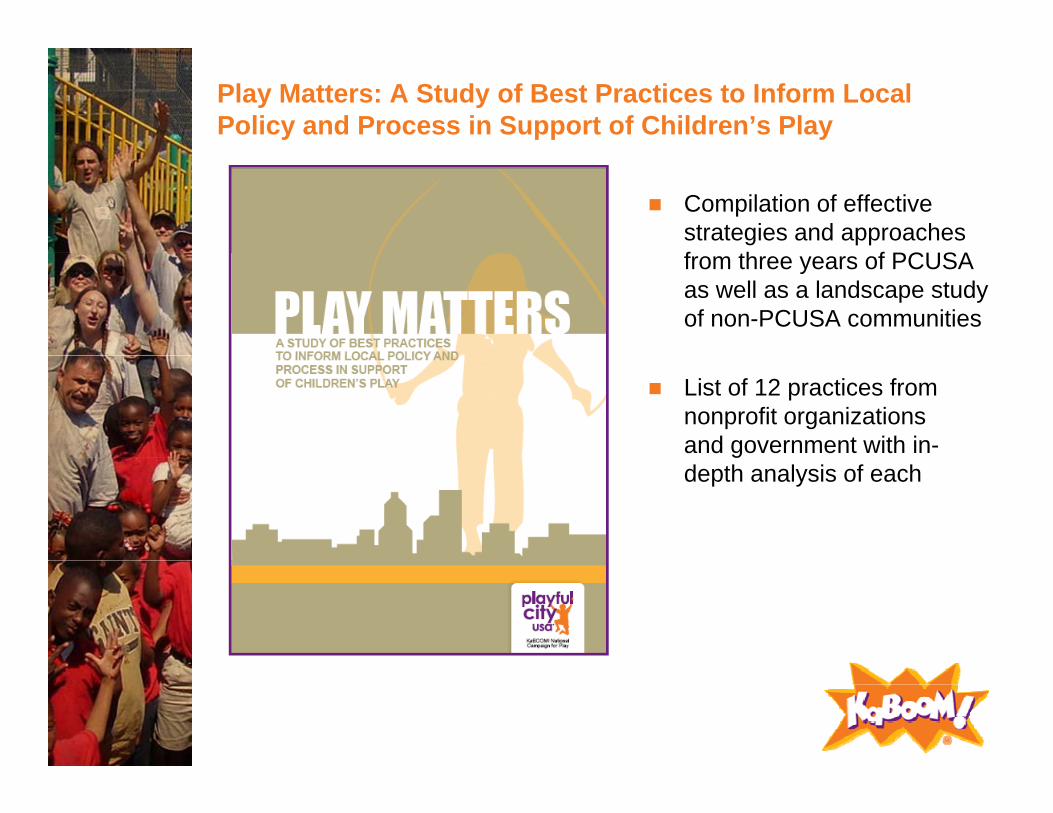
Play Matters: A Study of Best Practices to Inform Local Policy and Process in Support of Children’s Play
Compilation of effective strategies and approaches f th f PCUSAfrom three years of PCUSA as well as a landscape study of non-PCUSA communities
List of 12 practices from nonprofit organizations and government with in-depth analysis of each