1 Appendix 4D
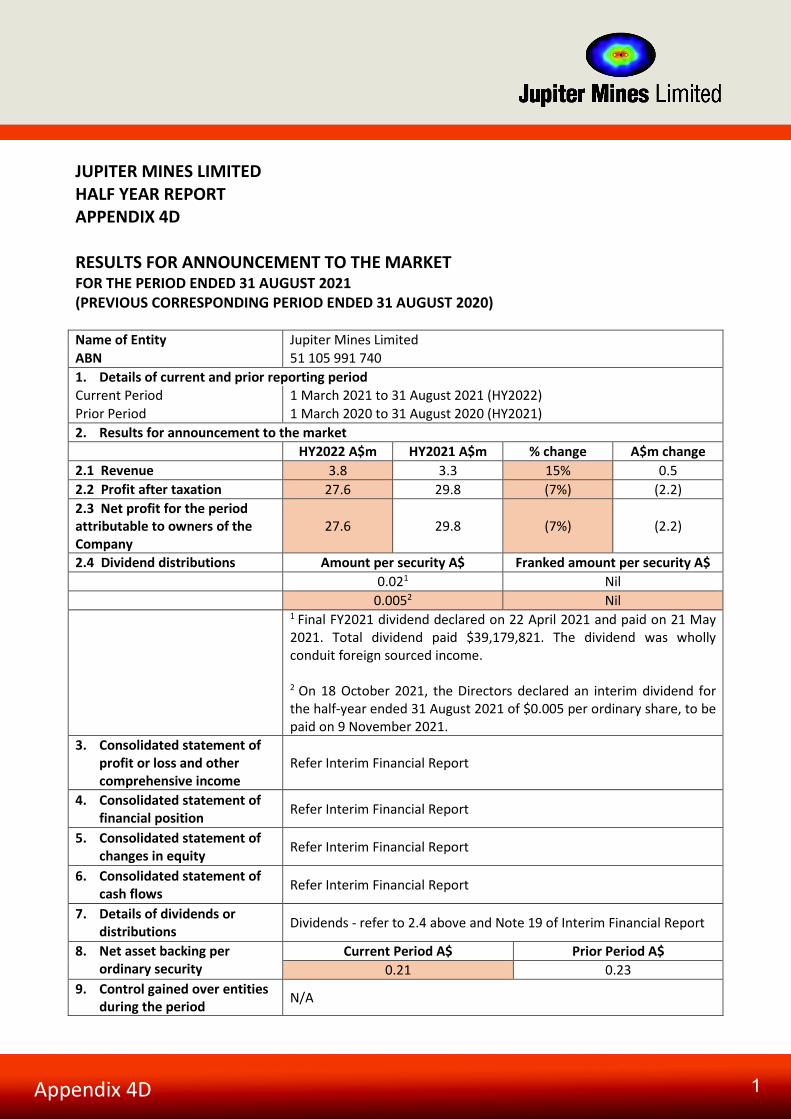
JUPITER MINES LIMITED HALF YEAR REPORT APPENDIX 4D RESULTS FOR ANNOUNCEMENT TO THE MARKET FOR THE PERIOD ENDED 31 AUGUST 2021 (PREVIOUS CORRESPONDING PERIOD ENDED 31 AUGUST 2020) Name of Entity Jupiter Mines Limited ABN 51 105 991 740 1. Details of current and prior reporting period Current Period 1 March 2021 to 31 August 2021 (HY2022) Prior Period 1 March 2020 to 31 August 2020 (HY2021) 2. Results for announcement to the market
HY2022 A$m HY2021 A$m % change A$m change 2.1 Revenue 3.8 3.3 15% 0.5 2.2 Profit after taxation 27.6 29.8 (7%) (2.2) 2.3 Net profit for the period attributable to owners of the Company
27.6 29.8 (7%) (2.2)
2.4 Dividend distributions Amount per security A$ Franked amount per security A$ 0.021 Nil 0.0052 Nil 1 Final FY2021 dividend declared on 22 April 2021 and paid on 21 May
2021. Total dividend paid $39,179,821. The dividend was wholly conduit foreign sourced income. 2 On 18 October 2021, the Directors declared an interim dividend for the half-year ended 31 August 2021 of $0.005 per ordinary share, to be paid on 9 November 2021.
3. Consolidated statement of profit or loss and other comprehensive income
Refer Interim Financial Report
4. Consolidated statement of financial position Refer Interim Financial Report
5. Consolidated statement of changes in equity Refer Interim Financial Report
6. Consolidated statement of cash flows Refer Interim Financial Report
7. Details of dividends or distributions Dividends - refer to 2.4 above and Note 19 of Interim Financial Report
8. Net asset backing per ordinary security
Current Period A$ Prior Period A$ 0.21 0.23
9. Control gained over entities during the period N/A
2 Appendix 4D
10. Details of associate and joint venture entities Refer Note 9 of Interim Financial Report
11. Other significant information See Notes to Interim Financial Report
12. Accounting Standards used by foreign entities International Financial Reporting Standards
13. Commentary on the result for the period See Review of Operations of Interim Financial Report
14. Status of audit or review The accounts have been reviewed.
15. Dispute or qualification – accounts not yet audited N/A
16. Qualifications of audit/review N/A
1 Interim Financial Report
JUPITER MINES LIMITED
ABN 51 105 991 740 AND ITS CONTROLLED ENTITIES
INTERIM FINANCIAL REPORT FOR THE HALF-YEAR ENDED
31 AUGUST 2021
2 Interim Financial Report
CONTENTS
PAGE(S)
Directors’ Report 3-8
Auditor’s Independence Declaration 9
Consolidated Statement of Profit or Loss and Other Comprehensive Income 10
Consolidated Statement of Financial Position 11
Consolidated Statement of Changes in Equity 12
Consolidated Statement of Cash Flows 13
Notes to the Financial Statements 14-23
Directors’ Declaration 24
Independent Auditor’s Review Report 25-26

DIRECTORS’ REPORT
3 Interim Financial Report
The Directors submit the financial report of Jupiter Mines Limited (“Jupiter” or the “Company”) and its controlled entities (“the Group”) for the half-year ended 31 August 2021 (“HY2022”).
Directors’ Details The following persons were Directors of the Company who held office during or since the end of the half-year:
Brian Gilbertson Independent Non-Executive Director and Chairman Paul Murray Independent Non-Executive Director (resigned 30 July 2021) Andrew Bell Independent Non-Executive Director (resigned 30 July 2021) Yeongjin Heo Non-Executive Director Priyank Thapliyal Executive Director Hans Mende Non-Executive Director Brian Beem Non-Executive Director; alternate to Hans Mende Peter North Non-Executive Director (appointed 30 July 2021) Scott Winter Independent Non-Executive Director (appointed 30 July 2021)
Directors were in office since the start of the period unless otherwise stated.
Principal Activities During the half-year period, the principal activities of Jupiter have been its investment in Tshipi é Ntle Manganese Mining Pty Limited (“Tshipi”) in South Africa and the sale of manganese ore.
Dividends Dividends declared and/or paid during the half-year period were as follows:
Dividend per share
Unfranked $ Total
2021 Final Dividend – paid 21 May 2021 $0.02 100% 39,179,821
2022 Interim Dividend – declared 18 October 2021; to be paid 9 November 2021
$0.005 100% 9,794,955
On 18 October 2021, the Directors declared an interim dividend for the half-year ended 31 August 2021 of $0.005 per ordinary share, to be paid on 9 November 2021. Both dividends above are wholly conduit foreign income.
DIRECTORS’ REPORT
4 Interim Financial Report
REVIEW OF OPERATIONS AND RESULTS
Jupiter recorded a consolidated result for the half-year of $27,564,278 profit after tax (HY2021: profit of $29,793,400 after tax), including a share of net profit from its investment in Tshipi of $15,694,246 (HY2021: $36,061,378). During the half year period, Jupiter divested its Central Yilgarn Iron Project assets into wholly owned subsidiary, Juno Minerals Limited (Juno) and completed a demerger of Juno via an in-specie distribution of its shareholding in Juno to Jupiter Shareholders. Jupiter has recognised a profit on the demerger of $12,624,292. Jupiter also provided $5,000,000 in seed capital funds to Juno.
TSHIPI BORWA MANGANESE MINE
The Tshipi Borwa Manganese Mine is a long-life, open pit manganese mine with an integrated ore processing plant located in the Kalahari Manganese Fields in the Northern Cape Province of South Africa.
For the half-year period ended 31 August 2021, Tshipi recorded a net profit after tax of ZAR345 million ($31.5 million) (HY2021: ZAR841 million; $72.3 million) and declared a total of ZAR88 million ($8.0 million) in dividends to its shareholders (HY2021: ZAR330 million; $28.4 million), declared and paid subsequent to half year end. Tshipi’s net profit was lower than previous half year mainly due to sustained depressed manganese prices and significant increases to logistics and shipping costs not borne by the end customer. Tshipi has retained cash for its working capital and remaining FY2022 capital expenditure.
Summary of operating and financial information for Tshipi Borwa Manganese Mine Unit HY2022 HY2021 FY2021
Mined volume Bcm 7,897,583 5,775,773 12,014,820 Production Tonnes 1,995,367 1,535,238 3,352,146 Sales Tonnes 1,653,981 1,219,840 3,417,585 Average cost of production FOB, ZAR per dmtu 32.51 36.02 33.80 Average CIF price achieved (high grade lumpy)*
CIF, USD per dmtu 4.61 4.58 4.19
* Average CIF price achieved relates to high grade lumpy product only (Tshipi’s main product). Total tonnes sold include a mix of high grade, low grade, lumpy and fines product which attract a discount to the CIF price above.
The cost of production remained steady throughout the period, averaging ZAR32.51 (USD$2.25) per dmtu (FOB) (HY2021: ZAR36.02; USD$2.12).
Mining continued to face challenges, remaining behind plan for the quarter due to excavator breakdowns, inclement weather and operator issues. In August, first ore was exposed in the Barrier Pillar on the Mamatwan side, with Tshipi’s first ore expected to be mined during September. Production however remained ahead of plan for the quarter and year, not compromising the logistics plan. Additional high grade ore was produced to meet the plan.
DIRECTORS’ REPORT
5 Interim Financial Report
Tshipi has moved almost 1.8 million tonnes through on-land logistics during the first half of FY2022, and volumes are ahead of its six month target. Tshipi’s rail throughput was however affected by several disruptions on the Port Elizabeth and Saldanha Bay corridors during June and July. Tshipi activated additional road capacity to make up some of the shortfall. In August the rail volumes increased as normal capacity on the corridors were restored. Overall shipping volumes were 8,000 tonnes behind target for the year to date.
Safety, Environmental and Social Report
Health and Safety
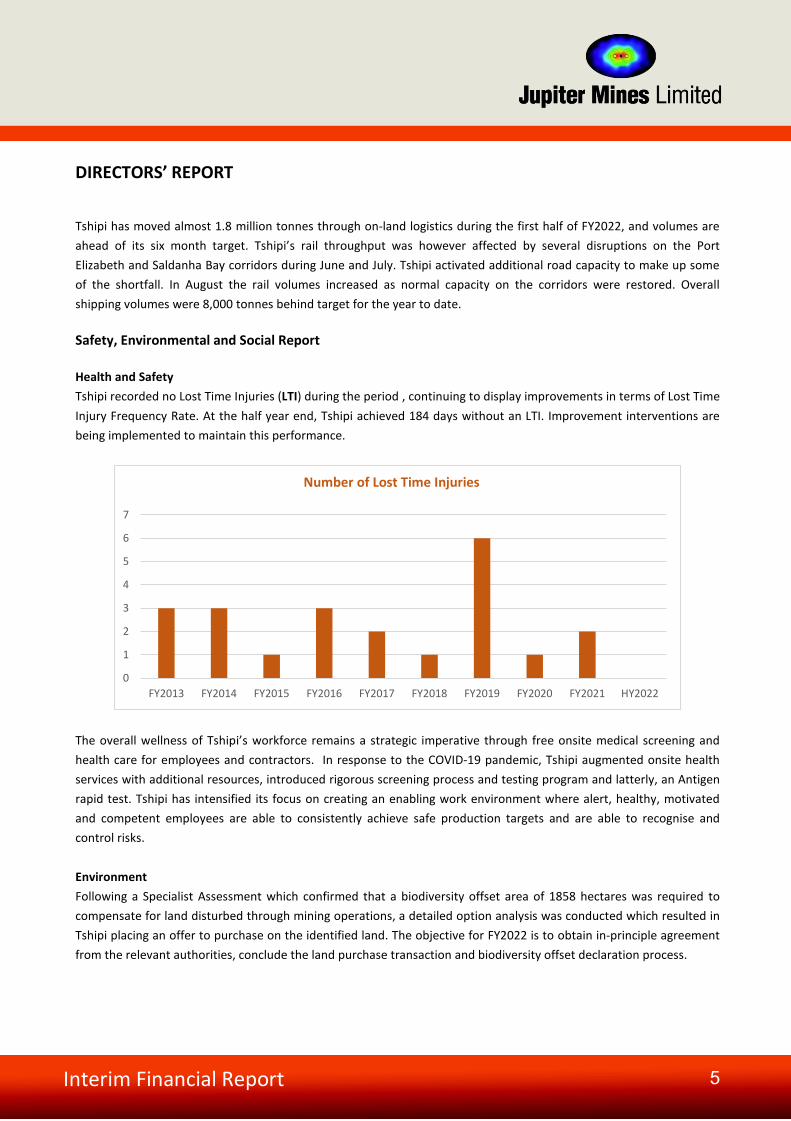
Tshipi recorded no Lost Time Injuries (LTI) during the period , continuing to display improvements in terms of Lost Time Injury Frequency Rate. At the half year end, Tshipi achieved 184 days without an LTI. Improvement interventions are being implemented to maintain this performance.
The overall wellness of Tshipi’s workforce remains a strategic imperative through free onsite medical screening and health care for employees and contractors. In response to the COVID-19 pandemic, Tshipi augmented onsite health services with additional resources, introduced rigorous screening process and testing program and latterly, an Antigen rapid test. Tshipi has intensified its focus on creating an enabling work environment where alert, healthy, motivated and competent employees are able to consistently achieve safe production targets and are able to recognise and control risks. Environment Following a Specialist Assessment which confirmed that a biodiversity offset area of 1858 hectares was required to compensate for land disturbed through mining operations, a detailed option analysis was conducted which resulted in Tshipi placing an offer to purchase on the identified land. The objective for FY2022 is to obtain in-principle agreement from the relevant authorities, conclude the land purchase transaction and biodiversity offset declaration process.
0
1
2
3
4
5
6
7
FY2013 FY2014 FY2015 FY2016 FY2017 FY2018 FY2019 FY2020 FY2021 HY2022
Number of Lost Time Injuries
DIRECTORS’ REPORT
6 Interim Financial Report
Ownership and Management Control Tshipi has continued to drive transformation in the mining sector by extending meaningful participation, economic interest and voting rights to black people and designated groups in terms of Broad-based Black Economic Empowerment. Tshipi is 44.49% owned and managed by black people. In support of government national objectives, Tshipi’s workforce has about 90% historically disadvantaged people. Whilst Tshipi continues to promote diversity, inclusion and economic representation in its workforce there is still a need to improve the representation of women at various levels of the company. Training and Development Through its Human Resource Development Plan, Tshipi remains committed to eradicating high unemployment, inequality and poverty in the Northern Cape province through learnerships, internships and apprenticeships for local unemployed people and its own employees. Enterprise and Supplier Development With procurement a pivotal element in achieving its transformation objectives, Tshipi has extended participation to majority Black-owned businesses in the Northern Cape on significant procurement opportunities. Tshipi continues to implement Enterprise and Supplier Development programmes dedicated to Small Medium Enterprises (SME) which provide technical and support services. The aim of these programmes is to establish these SMEs as competitive and sustainable in various industries, as well as Tshipi’s own value chain. Tshipi has set up an in-house SME business fund to assist SME growth. Socio-Economic and Local Economic Development Tshipi’s Social and Labour Plan (SLP) remains entrenched in community development and a shared value approach to advance communities out of unemployment, inequality and poverty. Tshipi continues to uplift its host community by implementing Economic Development projects as a catalyst for economic development. The school infrastructure projects represent a comprehensive and integrated upliftment programme for host communities.
DIRECTORS’ REPORT
7 Interim Financial Report
Tshipi Financial Summary A summary of the Statement of Profit or Loss and Other Comprehensive Income and Statement of Financial Position of Tshipi for the half-year periods are presented below on a 100% basis:
STATEMENT OF PROFIT OR LOSS
AND OTHER COMPREHENSIVE INCOME
HY2022 (ZAR’000)
HY2021 (ZAR’000)
Sales 3,619,651 3,067,839 Cost of sales (3,015,244) (1,866,166) Gross profit 604,407 1,201,673 Other income 2,474 1,977 Administrative expenses (7,087) (6,783) Impairment of property, plant & equipment/loss on derecognition 1,529 (6,741) Other operating expenses (9,300) (12,144) Net finance income (25,184) 118,365 Royalties (85,151) (127,948) Taxation (137,341) (327,809) Net profit after tax 344,347 840,590
STATEMENT OF FINANCIAL POSITION
Cash and cash equivalents 977,607 1,238,711 Trade and other receivables 896,800 888,905
Other current assets 736,108 857,408
Property, plant & equipment 2,566,234 2,341,242
Other non-current assets 225,460 214,216
Total assets 5,402,209 5,540,482 Trade and other payables 639,971 557,944
Tax payable 33,491 -
Other current liabilities 150,327 82,158
Deferred tax 697,780 643,462
Other non-current liabilities 140,753 53,570
Total liabilities 1,662,322 1,337,134
Net assets 3,739,887 4,203,348
Share capital and share premium 321,359 321,359 Retained earnings 3,301,567 3,765,028
Contributed assets reserve 116,961 116,961
Total equity 3,739,887 4,203,348
Note: the summary Statement of Profit or Loss and other Comprehensive Income and Statement of Financial Position were not subject to audit review, however KPMG South Africa have concluded a half-year review on Tshipi’s trial balance and management accounts.
DIRECTORS’ REPORT
8 Interim Financial Report
MARKETING Jupiter’s manganese marketing branch in South Africa sold a total of 841,254 dmt (HY2021: 559,843 dmt), resulting in marketing fee income of ZAR41.1 million ($3.7 million) (HY2021: ZAR38.5 million; $3.3 million) and a net profit after tax of ZAR27.3 million ($2.5 million) (HY2021: ZAR27.5 million; $2.4 million).
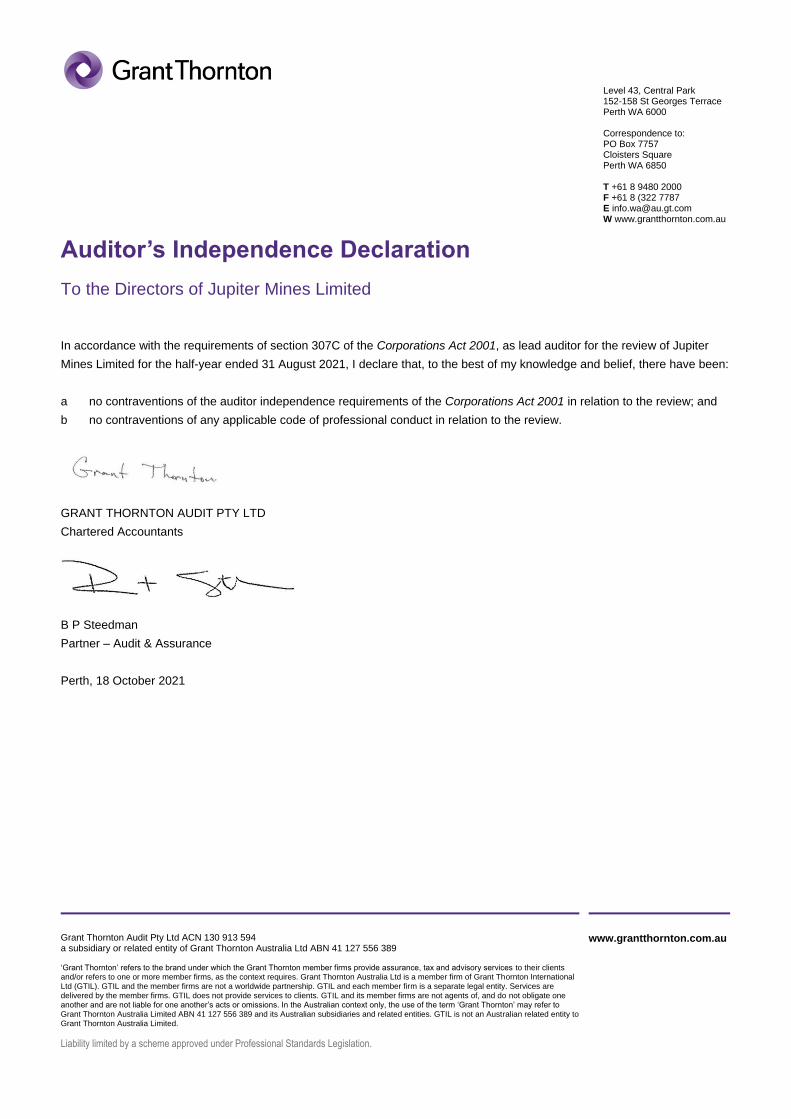
AUDITOR’S INDEPENDENCE DECLARATION The lead auditor’s independence declaration under Section 307C of the Corporations Act 2001 is set out on the following page for the half-year ended 31 August 2021.
This report is signed in accordance with a resolution of the Board of Directors.
Priyank Thapliyal Director and Chief Executive Officer
Dated this 18th day of October 2021
Grant Thornton Audit Pty Ltd ACN 130 913 594 a subsidiary or related entity of Grant Thornton Australia Ltd ABN 41 127 556 389 ‘Grant Thornton’ refers to the brand under which the Grant Thornton member firms provide assurance, tax and advisory services to their clients and/or refers to one or more member firms, as the context requires. Grant Thornton Australia Ltd is a member firm of Grant Thornton International Ltd (GTIL). GTIL and the member firms are not a worldwide partnership. GTIL and each member firm is a separate legal entity. Services are delivered by the member firms. GTIL does not provide services to clients. GTIL and its member firms are not agents of, and do not obligate one another and are not liable for one another’s acts or omissions. In the Australian context only, the use of the term ‘Grant Thornton’ may refer to Grant Thornton Australia Limited ABN 41 127 556 389 and its Australian subsidiaries and related entities. GTIL is not an Australian related entity to Grant Thornton Australia Limited.
Liability limited by a scheme approved under Professional Standards Legislation.
www.grantthornton.com.au
Level 43, Central Park 152-158 St Georges Terrace Perth WA 6000 Correspondence to: PO Box 7757 Cloisters Square Perth WA 6850 T +61 8 9480 2000 F +61 8 (322 7787 E [email protected] W www.grantthornton.com.au
Auditor’s Independence Declaration
To the Directors of Jupiter Mines Limited
In accordance with the requirements of section 307C of the Corporations Act 2001, as lead auditor for the review of Jupiter
Mines Limited for the half-year ended 31 August 2021, I declare that, to the best of my knowledge and belief, there have been:
a no contraventions of the auditor independence requirements of the Corporations Act 2001 in relation to the review; and
b no contraventions of any applicable code of professional conduct in relation to the review.
GRANT THORNTON AUDIT PTY LTD
Chartered Accountants
B P Steedman
Partner – Audit & Assurance
Perth, 18 October 2021
Interim Financial Report 10
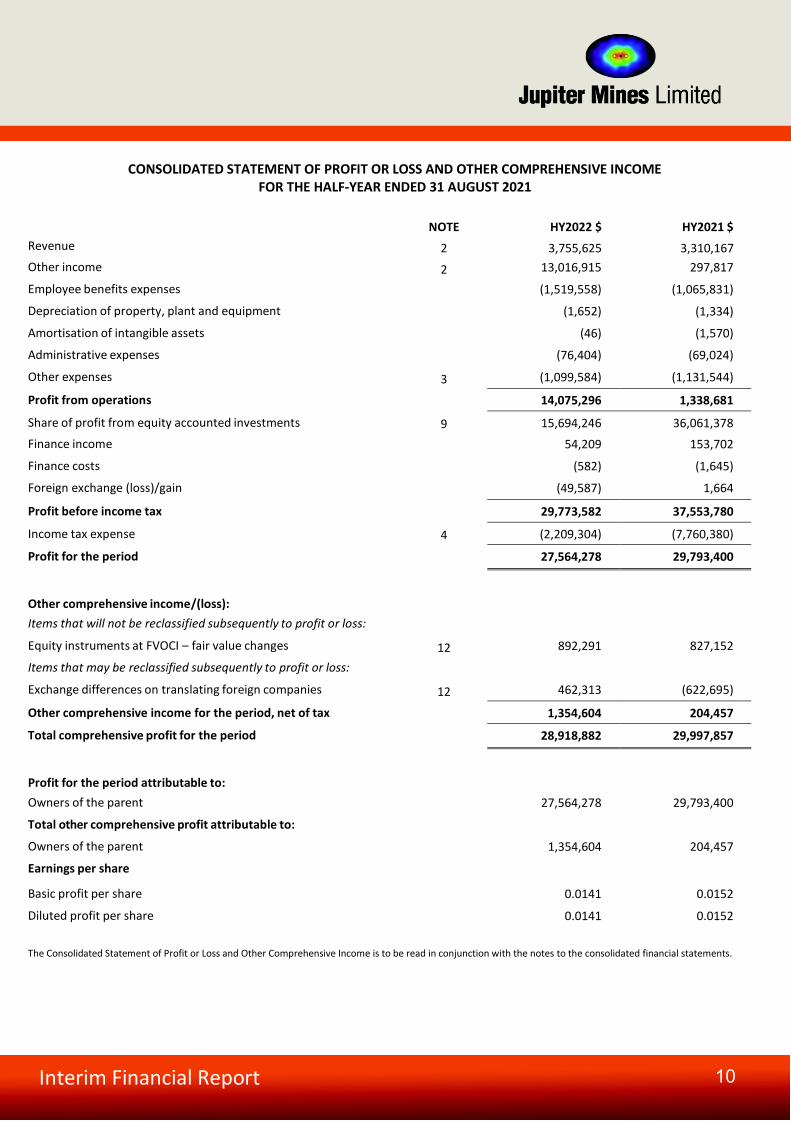
CONSOLIDATED STATEMENT OF PROFIT OR LOSS AND OTHER COMPREHENSIVE INCOME
FOR THE HALF-YEAR ENDED 31 AUGUST 2021
NOTE
HY2022 $
HY2021 $ Revenue 2 3,755,625 3,310,167
Other income 2 13,016,915 297,817
Employee benefits expenses (1,519,558) (1,065,831)
Depreciation of property, plant and equipment (1,652) (1,334)
Amortisation of intangible assets (46) (1,570)
Administrative expenses (76,404) (69,024)
Other expenses 3 (1,099,584) (1,131,544)
Profit from operations 14,075,296 1,338,681
Share of profit from equity accounted investments 9 15,694,246 36,061,378 Finance income 54,209 153,702
Finance costs (582) (1,645)
Foreign exchange (loss)/gain (49,587) 1,664
Profit before income tax 29,773,582 37,553,780 Income tax expense 4 (2,209,304) (7,760,380)
Profit for the period
27,564,278 29,793,400
Other comprehensive income/(loss):
Items that will not be reclassified subsequently to profit or loss:
Equity instruments at FVOCI – fair value changes
Items that may be reclassified subsequently to profit or loss: 12 892,291 827,152
Exchange differences on translating foreign companies 12 462,313 (622,695)
Other comprehensive income for the period, net of tax 1,354,604 204,457
Total comprehensive profit for the period 28,918,882 29,997,857
Profit for the period attributable to:
Owners of the parent 27,564,278 29,793,400 Total other comprehensive profit attributable to:
Owners of the parent 1,354,604 204,457
Earnings per share
Basic profit per share 0.0141 0.0152
Diluted profit per share 0.0141 0.0152
The Consolidated Statement of Profit or Loss and Other Comprehensive Income is to be read in conjunction with the notes to the consolidated financial statements.
Interim Financial Report 11
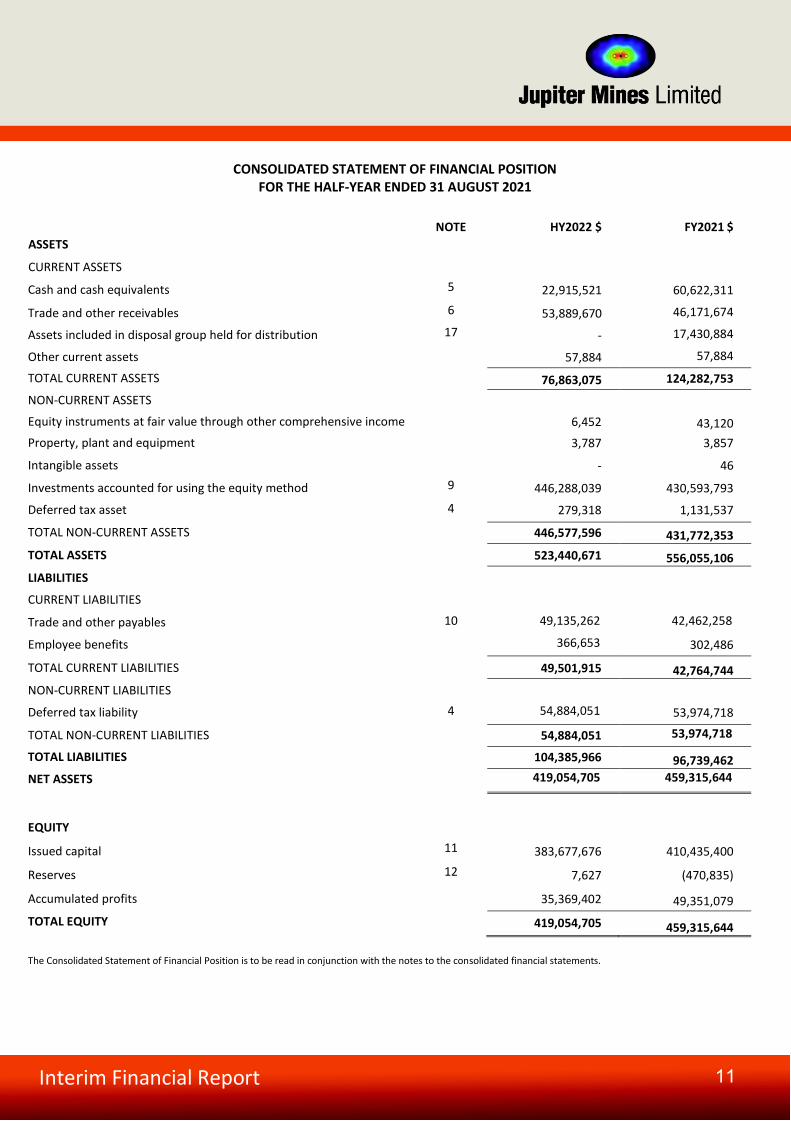
CONSOLIDATED STATEMENT OF FINANCIAL POSITION
FOR THE HALF-YEAR ENDED 31 AUGUST 2021
NOTE
HY2022 $
FY2021 $ ASSETS
CURRENT ASSETS
Cash and cash equivalents 5 22,915,521 60,622,311
Trade and other receivables 6 53,889,670 46,171,674
Assets included in disposal group held for distribution 17 - 17,430,884
Other current assets 57,884 57,884
TOTAL CURRENT ASSETS 76,863,075 124,282,753
NON-CURRENT ASSETS
Equity instruments at fair value through other comprehensive income 6,452 43,120 Property, plant and equipment 3,787 3,857
Intangible assets - 46
Investments accounted for using the equity method 9 446,288,039 430,593,793
Deferred tax asset 4 279,318 1,131,537
TOTAL NON-CURRENT ASSETS 446,577,596 431,772,353 TOTAL ASSETS 523,440,671 556,055,106 LIABILITIES
CURRENT LIABILITIES
Trade and other payables 10 49,135,262 42,462,258
Employee benefits 366,653 302,486
TOTAL CURRENT LIABILITIES 49,501,915 42,764,744 NON-CURRENT LIABILITIES
Deferred tax liability 4 54,884,051 53,974,718
TOTAL NON-CURRENT LIABILITIES 54,884,051 53,974,718
TOTAL LIABILITIES 104,385,966 96,739,462 NET ASSETS 419,054,705 459,315,644
EQUITY
Issued capital 11 383,677,676 410,435,400
Reserves 12 7,627 (470,835)
Accumulated profits 35,369,402 49,351,079 TOTAL EQUITY 419,054,705 459,315,644 The Consolidated Statement of Financial Position is to be read in conjunction with the notes to the consolidated financial statements.
Interim Financial Report 12
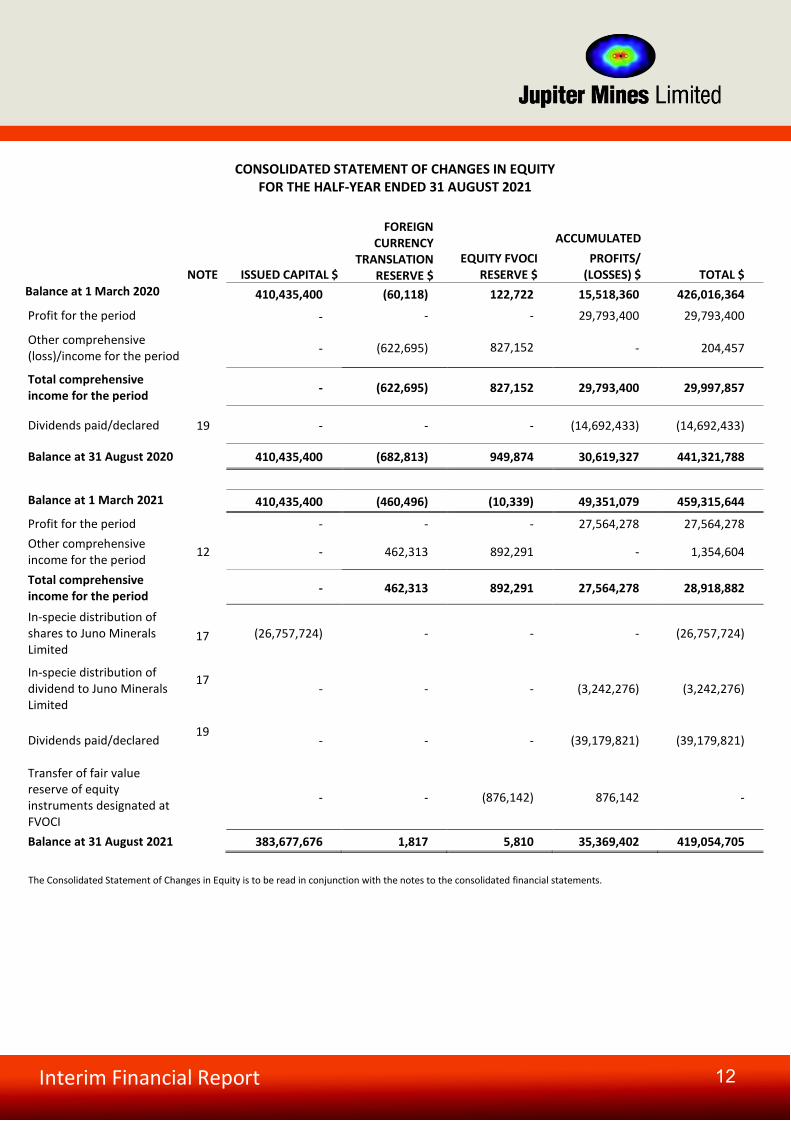
CONSOLIDATED STATEMENT OF CHANGES IN EQUITY
FOR THE HALF-YEAR ENDED 31 AUGUST 2021
NOTE ISSUED CAPITAL $
FOREIGN CURRENCY
TRANSLATION RESERVE $
EQUITY FVOCI RESERVE $
ACCUMULATED PROFITS/
(LOSSES) $ TOTAL $ Balance at 1 March 2020
410,435,400 (60,118) 122,722 15,518,360 426,016,364
Profit for the period - - - 29,793,400 29,793,400
Other comprehensive (loss)/income for the period
- (622,695) 827,152 - 204,457
Total comprehensive income for the period - (622,695) 827,152 29,793,400 29,997,857
Dividends paid/declared 19 - - - (14,692,433) (14,692,433)
Balance at 31 August 2020 410,435,400 (682,813) 949,874 30,619,327 441,321,788
Balance at 1 March 2021
410,435,400 (460,496) (10,339) 49,351,079 459,315,644
Profit for the period - - - 27,564,278 27,564,278 Other comprehensive income for the period 12 - 462,313 892,291 - 1,354,604
Total comprehensive income for the period
- 462,313 892,291 27,564,278 28,918,882
In-specie distribution of shares to Juno Minerals Limited
17 (26,757,724) - - - (26,757,724)
In-specie distribution of dividend to Juno Minerals Limited
17 - - - (3,242,276) (3,242,276)
Dividends paid/declared 19
- - - (39,179,821) (39,179,821)
Transfer of fair value reserve of equity instruments designated at FVOCI
- - (876,142) 876,142 -
Balance at 31 August 2021 383,677,676 1,817 5,810 35,369,402 419,054,705
The Consolidated Statement of Changes in Equity is to be read in conjunction with the notes to the consolidated financial statements.
Interim Financial Report 13
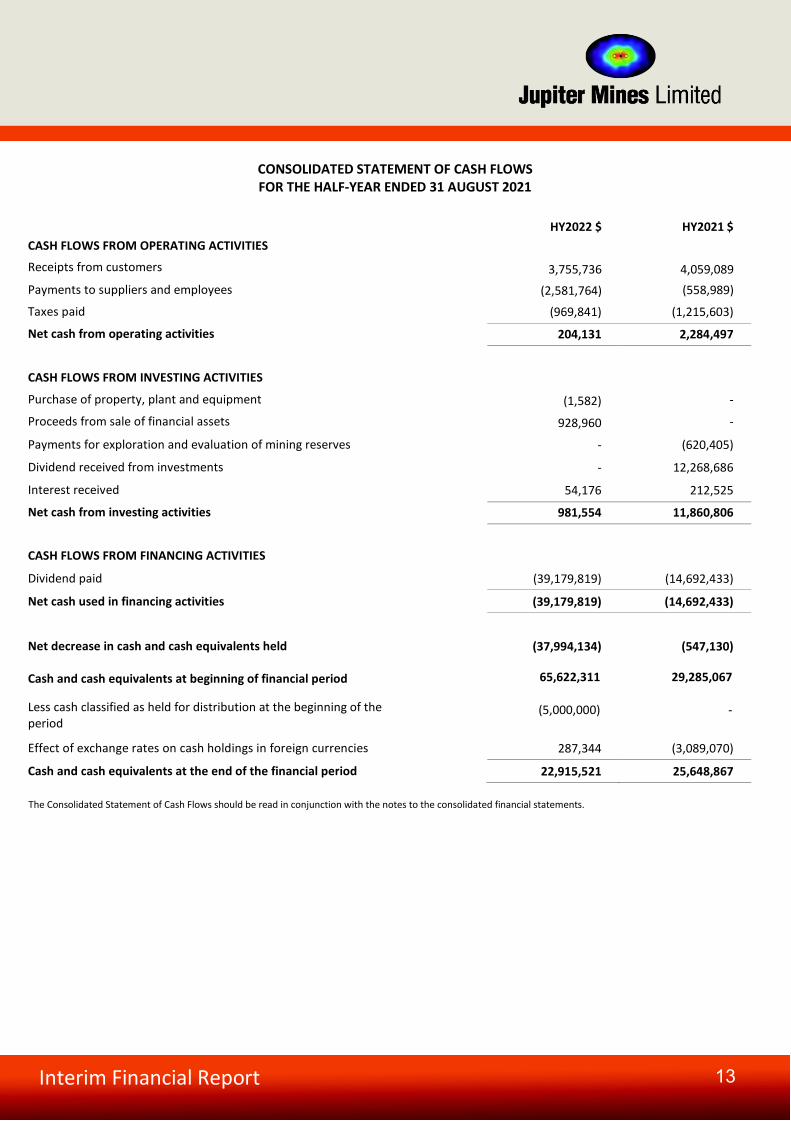
CONSOLIDATED STATEMENT OF CASH FLOWS FOR THE HALF-YEAR ENDED 31 AUGUST 2021
HY2022 $
HY2021 $ CASH FLOWS FROM OPERATING ACTIVITIES
Receipts from customers 3,755,736 4,059,089 Payments to suppliers and employees (2,581,764) (558,989)
Taxes paid (969,841) (1,215,603) Net cash from operating activities 204,131 2,284,497
CASH FLOWS FROM INVESTING ACTIVITIES
Purchase of property, plant and equipment (1,582) -
Proceeds from sale of financial assets 928,960 -
Payments for exploration and evaluation of mining reserves - (620,405) Dividend received from investments - 12,268,686 Interest received 54,176 212,525 Net cash from investing activities 981,554 11,860,806
CASH FLOWS FROM FINANCING ACTIVITIES
Dividend paid (39,179,819) (14,692,433) Net cash used in financing activities (39,179,819) (14,692,433)
Net decrease in cash and cash equivalents held (37,994,134) (547,130)
Cash and cash equivalents at beginning of financial period 65,622,311 29,285,067
Less cash classified as held for distribution at the beginning of the period
(5,000,000) -
Effect of exchange rates on cash holdings in foreign currencies 287,344 (3,089,070)
Cash and cash equivalents at the end of the financial period 22,915,521 25,648,867
The Consolidated Statement of Cash Flows should be read in conjunction with the notes to the consolidated financial statements.
Interim Financial Report 14
NOTES TO THE CONSOLIDATED FINANCIAL STATEMENTS FOR THE HALF-YEAR ENDED 31 AUGUST 2021
NOTE 1: SUMMARY OF SIGNIFICANT ACCOUNTING POLICIES These consolidated financial statements and notes represent those of Jupiter Mines Limited (“Jupiter”) and its Controlled Entities (the “Consolidated Group” or “Group”).
BASIS OF PREPARATION These general purpose financial statements for the interim half-year reporting period ended 31 August 2021 have been prepared in accordance with requirements of the Corporations Act 2001 and Australian Accounting Standards including AASB 134: Interim Financial Reporting. Compliance with Australian Accounting Standards ensures that the financial statements and notes also comply with International Financial Reporting Standards. This group is a for -profit entity for the financial reporting purposes under Australian Accounting Standards.
The half-year financial report does not include all notes of the type normally included within the annual financial report and therefore cannot be expected to provide as full an understanding of the financial performance, financial position and financing and investing activities of the consolidated entity as the full financial report. It is therefore recommended that these financial statements be read in conjunction with the annual financial statements of the Group for the year ended 28 February 2021, together with any public announcements made during the half-year.
ADOPTION OF NEW ACCOUNTING STANDARDS The accounting policies adopted in the preparation of the interim financial statements are consistent with those applied in the preparation of the Group’s annual financial statements for the year ended 28 February 2021. The Company has not early adopted any standard, interpretation or amendment that has been issued but is not yet effective. SIGNIFICANT ACCOUNTING POLICIES The Interim Financial Statements have been prepared in accordance with the accounting policies adopted in the Group’s most recent annual financial statements for the year ended 28 February 2021.
CRITICAL ACCOUNTING ESTIMATES AND JUDGEMENTS When preparing the Interim Financial Statements, management undertakes a number of judgements, estimates and assumptions about recognition and measurement of assets, liabilities, income and expenses. The actual results may differ from the judgements, estimates and assumptions made by management, and will seldom equal the estimated results. The judgements, estimates and assumptions applied in the Interim Financial Statements, including the key sources of estimation uncertainty, were the same as those applied in the Group’s last annual financial statements for the year ended 28 February 2021. The only exceptions are the estimate of income tax liabilities which is determined in the Interim Financial Statements using the estimated average annual effective income tax rate applied to the pre-tax income of the interim period.
Interim Financial Report 15
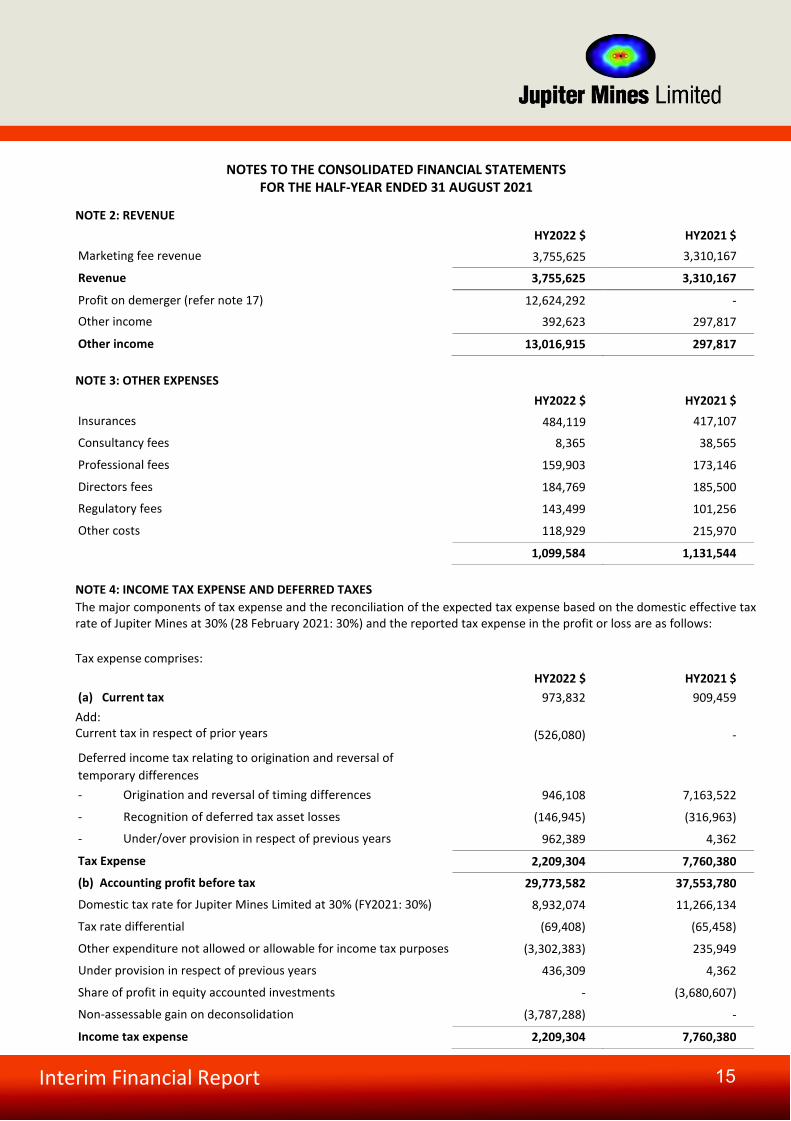
NOTES TO THE CONSOLIDATED FINANCIAL STATEMENTS FOR THE HALF-YEAR ENDED 31 AUGUST 2021
NOTE 2: REVENUE HY2022 $
HY2021 $
Marketing fee revenue 3,755,625 3,310,167
Revenue 3,755,625 3,310,167
Profit on demerger (refer note 17) 12,624,292 - Other income 392,623 297,817
Other income 13,016,915 297,817
NOTE 3: OTHER EXPENSES HY2022 $
HY2021 $
Insurances 484,119 417,107
Consultancy fees 8,365 38,565
Professional fees 159,903 173,146
Directors fees 184,769 185,500
Regulatory fees 143,499 101,256
Other costs 118,929 215,970
1,099,584 1,131,544 NOTE 4: INCOME TAX EXPENSE AND DEFERRED TAXES The major components of tax expense and the reconciliation of the expected tax expense based on the domestic effective tax rate of Jupiter Mines at 30% (28 February 2021: 30%) and the reported tax expense in the profit or loss are as follows: Tax expense comprises: HY2022 $
HY2021 $
(a) Current tax 973,832 909,459 Add:
Current tax in respect of prior years (526,080) - Deferred income tax relating to origination and reversal of
temporary differences
- Origination and reversal of timing differences 946,108 7,163,522
- Recognition of deferred tax asset losses (146,945) (316,963)
- Under/over provision in respect of previous years 962,389 4,362
Tax Expense 2,209,304 7,760,380 (b) Accounting profit before tax 29,773,582 37,553,780 Domestic tax rate for Jupiter Mines Limited at 30% (FY2021: 30%) 8,932,074 11,266,134 Tax rate differential (69,408) (65,458) Other expenditure not allowed or allowable for income tax purposes (3,302,383) 235,949
Under provision in respect of previous years 436,309 4,362 Share of profit in equity accounted investments - (3,680,607) Non-assessable gain on deconsolidation (3,787,288) -
Income tax expense 2,209,304 7,760,380
Interim Financial Report 16
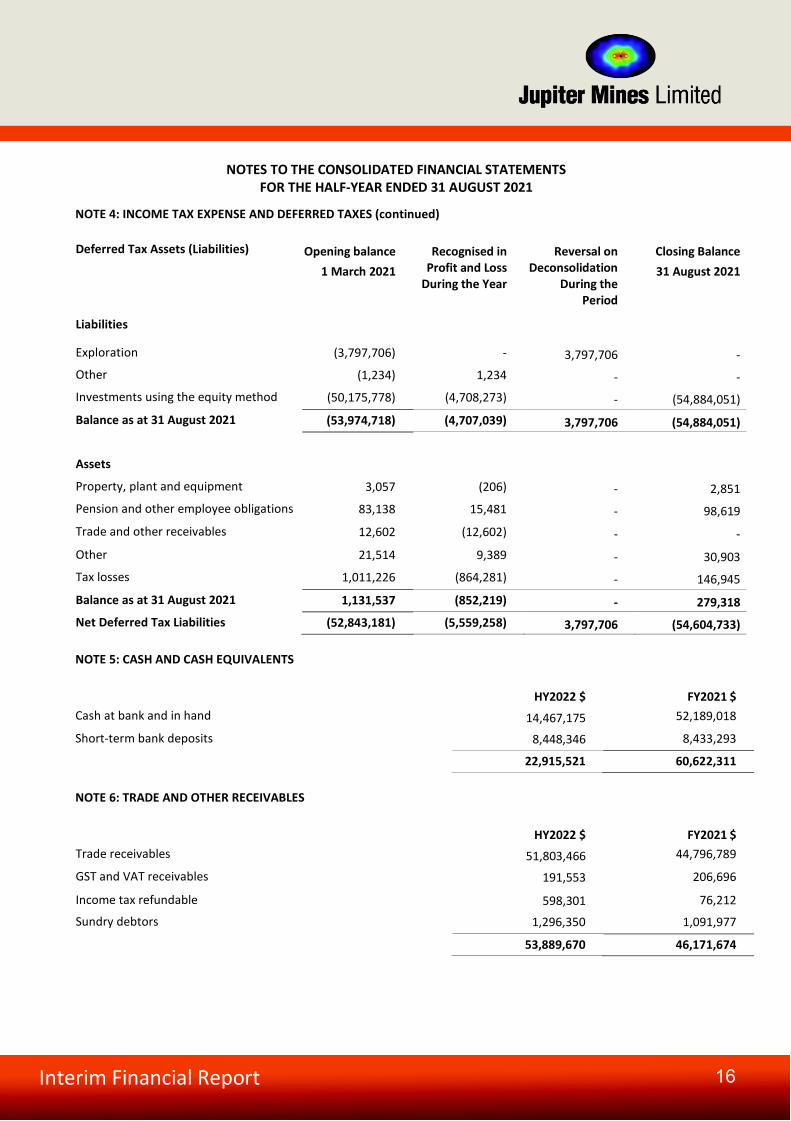
NOTES TO THE CONSOLIDATED FINANCIAL STATEMENTS FOR THE HALF-YEAR ENDED 31 AUGUST 2021
NOTE 4: INCOME TAX EXPENSE AND DEFERRED TAXES (continued) Deferred Tax Assets (Liabilities) Opening balance
1 March 2021 Recognised in
Profit and Loss During the Year
Reversal on Deconsolidation
During the Period
Closing Balance 31 August 2021
Liabilities
Exploration (3,797,706) - 3,797,706 - Other (1,234) 1,234 - - Investments using the equity method (50,175,778) (4,708,273) - (54,884,051) Balance as at 31 August 2021 (53,974,718) (4,707,039) 3,797,706 (54,884,051) Assets Property, plant and equipment 3,057 (206) - 2,851 Pension and other employee obligations 83,138 15,481 - 98,619 Trade and other receivables 12,602 (12,602) - - Other 21,514 9,389 - 30,903 Tax losses 1,011,226 (864,281) - 146,945 Balance as at 31 August 2021 1,131,537 (852,219) - 279,318 Net Deferred Tax Liabilities (52,843,181) (5,559,258) 3,797,706 (54,604,733) NOTE 5: CASH AND CASH EQUIVALENTS HY2022 $
FY2021 $
Cash at bank and in hand 14,467,175 52,189,018
Short-term bank deposits 8,448,346 8,433,293
22,915,521 60,622,311 NOTE 6: TRADE AND OTHER RECEIVABLES HY2022 $
FY2021 $
Trade receivables 51,803,466 44,796,789
GST and VAT receivables 191,553 206,696
Income tax refundable 598,301 76,212
Sundry debtors 1,296,350 1,091,977
53,889,670 46,171,674
Interim Financial Report 17
NOTES TO THE CONSOLIDATED FINANCIAL STATEMENTS FOR THE HALF-YEAR ENDED 31 AUGUST 2021
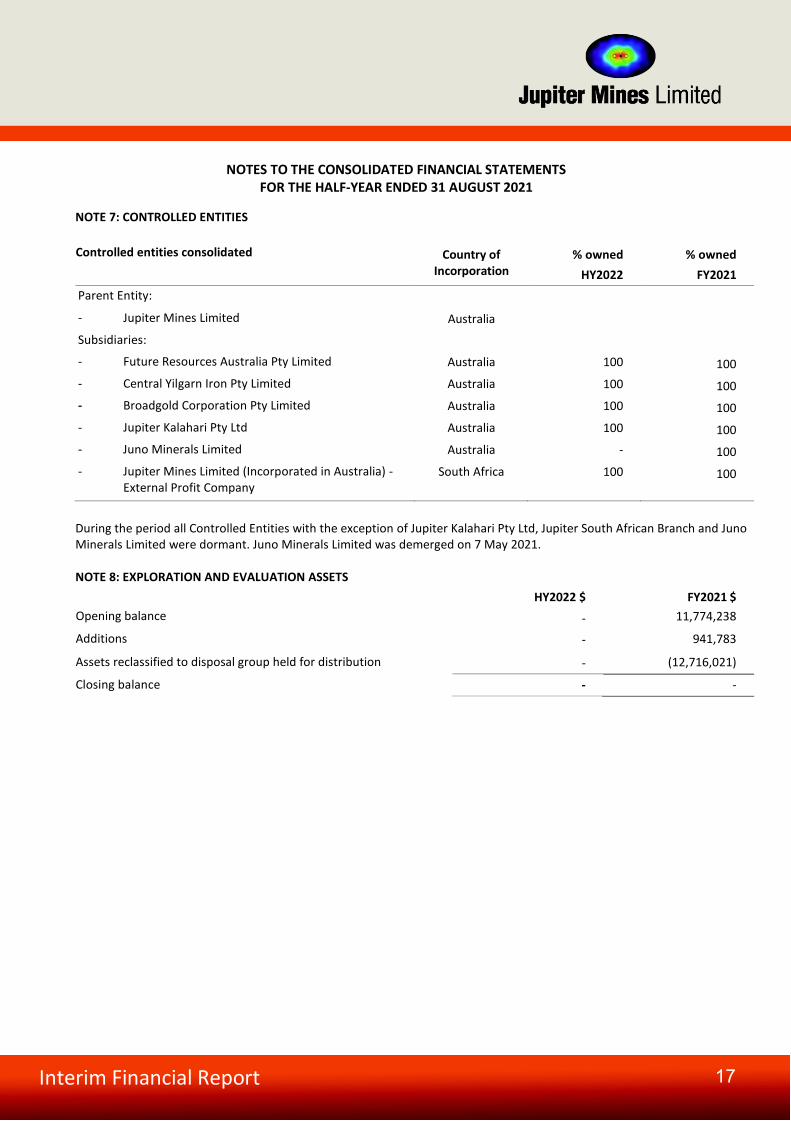
NOTE 7: CONTROLLED ENTITIES Controlled entities consolidated Country of
Incorporation % owned
HY2022 % owned
FY2021 Parent Entity: - Jupiter Mines Limited Australia Subsidiaries: - Future Resources Australia Pty Limited Australia 100 100 - Central Yilgarn Iron Pty Limited Australia 100 100 - Broadgold Corporation Pty Limited Australia 100 100 - Jupiter Kalahari Pty Ltd Australia 100 100 - Juno Minerals Limited Australia - 100 - Jupiter Mines Limited (Incorporated in Australia) - External Profit Company
South Africa 100 100
During the period all Controlled Entities with the exception of Jupiter Kalahari Pty Ltd, Jupiter South African Branch and Juno Minerals Limited were dormant. Juno Minerals Limited was demerged on 7 May 2021.
NOTE 8: EXPLORATION AND EVALUATION ASSETS HY2022 $
FY2021 $
Opening balance - 11,774,238
Additions - 941,783
Assets reclassified to disposal group held for distribution - (12,716,021)
Closing balance - -

Interim Financial Report 18
NOTES TO THE CONSOLIDATED FINANCIAL STATEMENTS FOR THE HALF-YEAR ENDED 31 AUGUST 2021
NOTE 9: INVESTMENTS USING THE EQUITY METHOD The sole Joint Venture of the Group as at 31 August 2021, in which in the opinion of the Directors, are material to the Group, is set out below. The entity listed below has share capital consisting solely of ordinary shares, which is held directly by the Group. The country of incorporation or registration is also their principal place of business, and the proportion of the Group’s ownership interest is the same as the proportion of voting rights held. This entity is held through a fully controlled entity, Jupiter Kalahari Pty Ltd.
Name of Entity Country of Incorporation
% held HY2022
% held FY2021
Nature of Relationship
Measurement Method
Tshipi é Ntle Manganese Mining Proprietary Limited
South Africa 49.9 49.9 Joint Venture Equity Method
Summarised Financial Information HY2022 $
FY2021 $ Tshipi é Ntle Manganese Mining Proprietary Limited
Opening carrying value of joint venture 430,593,793 437,601,406
Share of profit using the equity method 15,694,246 62,937,155
Dividend paid - (69,944,768)
446,288,039 430,593,793 NOTE 10: TRADE AND OTHER PAYABLES
HY2022 $
FY2021 $
Trade payables 48,595,738 41,679,440
Sundry payables and accrued expenses 539,524 782,818
49,135,262 42,462,258 NOTE 11: SHARE CAPITAL
Paid up capital: HY2022 $
FY2021 $
Ordinary shares at the beginning of the reporting period 410,435,400 410,435,400 7 May 2021: In-specie distribution of Juno Minerals Limited shares to Jupiter Mines Limited Shareholders
(26,757,724) -
At reporting date 383,677,676 410,435,400
HY2022
Number of Shares
FY2021 Number of Shares
Ordinary shares at the beginning of the reporting period 1,958,991,033 1,958,991,033
At reporting date 1,958,991,033 1,958,991,033

Interim Financial Report 19
NOTES TO THE CONSOLIDATED FINANCIAL STATEMENTS FOR THE HALF-YEAR ENDED 31 AUGUST 2021
NOTE 12: RESERVES HY2022 $
FY2021 $
Equity FVOCI reserve
Balance at the beginning of the financial year (10,339) 122,722 Revaluation 16,149 (133,061)
Balance at the end of the half year 5,810 (10,339)
Foreign currency translation reserve Balance at the beginning of the financial year (460,496) (60,118) Revaluation 462,313 (400,378)
Balance at the end of the half year 1,817 (460,496)
At reporting date 7,627 (470,835) The Equity FVOCI reserve records amounts relating to the revaluation of equity instruments in listed entities not held for trading. The foreign currency translation reserve relates to the differences arising from the revaluation of the Jupiter South African Branch financial statements from South African Rand to Australian Dollars. NOTE 13: SEGMENT REPORTING
The Group operates in the mining industry. The Group has identified its operating segments based on internal reports that are reviewed and used by the chief operating decision makers (the Board of Directors and key management) in assessing performance and determining the allocation of resources. The Group’s segments are structured primarily on the basis of its exploration and production interests. These are considered to be the producing Tshipi mine (manganese) which is located in South Africa, and Jupiter’s South African branch which carries the sale of Jupiter’s share of manganese ore. Up until the assets were demerged, the Group also identified the Central Yilgarn Iron Exploration Project (Iron Ore), as a segment. These assets were distributed to Juno Minerals Limited during the period via an in-specie distribution. Information is not readily available for allocating the remaining items of revenue, expenses, assets and liabilities, or these items are not considered part of the core operations of any segment. Any transactions between reportable segments have been offset for these purposes. During the half-year period, there have been no changes from prior periods in the measurement methods used to determine operating segments and reported segment profit or loss.
Interim Financial Report 20
NOTES TO THE CONSOLIDATED FINANCIAL STATEMENTS FOR THE HALF-YEAR ENDED 31 AUGUST 2021
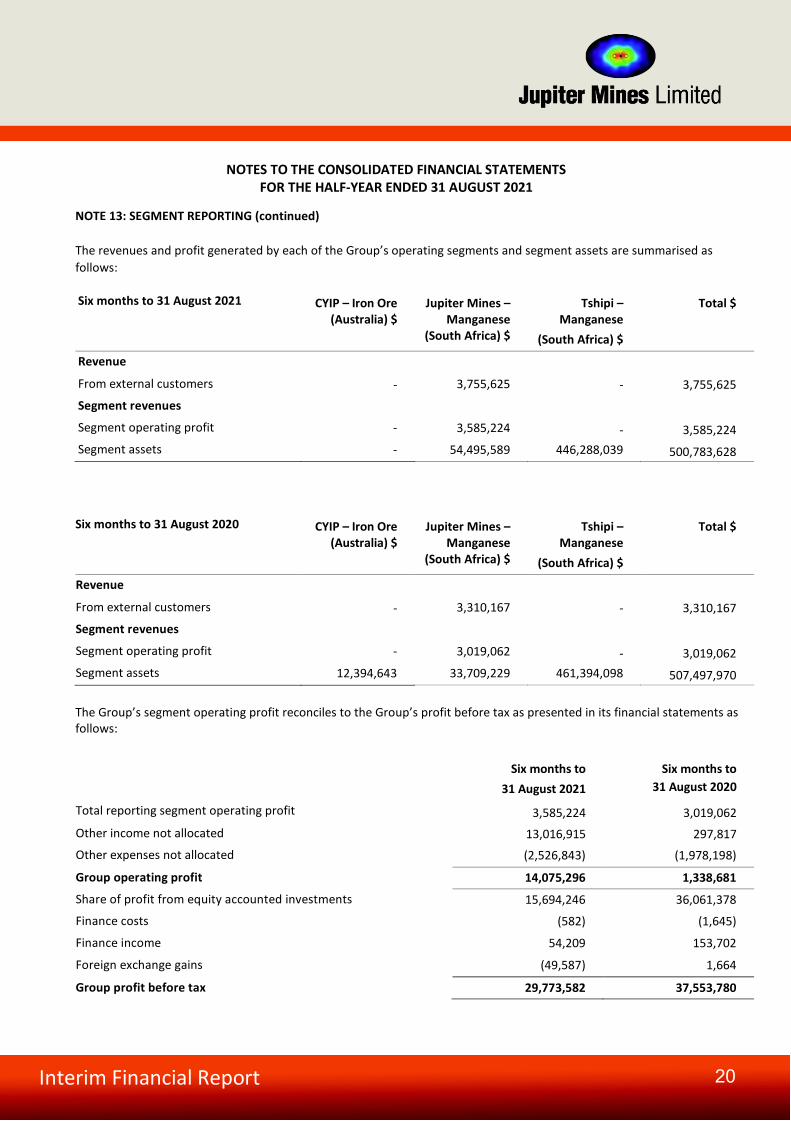
NOTE 13: SEGMENT REPORTING (continued) The revenues and profit generated by each of the Group’s operating segments and segment assets are summarised as follows:
Six months to 31 August 2021 CYIP – Iron Ore
(Australia) $ Jupiter Mines –
Manganese (South Africa) $
Tshipi – Manganese
(South Africa) $
Total $
Revenue From external customers - 3,755,625 - 3,755,625 Segment revenues Segment operating profit - 3,585,224 - 3,585,224 Segment assets - 54,495,589 446,288,039 500,783,628
Six months to 31 August 2020 CYIP – Iron Ore
(Australia) $ Jupiter Mines –
Manganese (South Africa) $
Tshipi – Manganese
(South Africa) $
Total $
Revenue From external customers - 3,310,167
- 3,310,167
Segment revenues Segment operating profit - 3,019,062
- 3,019,062
Segment assets 12,394,643
33,709,229
461,394,098
507,497,970
The Group’s segment operating profit reconciles to the Group’s profit before tax as presented in its financial statements as follows:
Six months to
31 August 2021 Six months to
31 August 2020
Total reporting segment operating profit 3,585,224 3,019,062 Other income not allocated 13,016,915 297,817 Other expenses not allocated (2,526,843) (1,978,198) Group operating profit 14,075,296 1,338,681 Share of profit from equity accounted investments 15,694,246 36,061,378 Finance costs (582) (1,645) Finance income 54,209 153,702 Foreign exchange gains (49,587) 1,664 Group profit before tax 29,773,582 37,553,780
Interim Financial Report 21
NOTES TO THE CONSOLIDATED FINANCIAL STATEMENTS FOR THE HALF-YEAR ENDED 31 AUGUST 2021
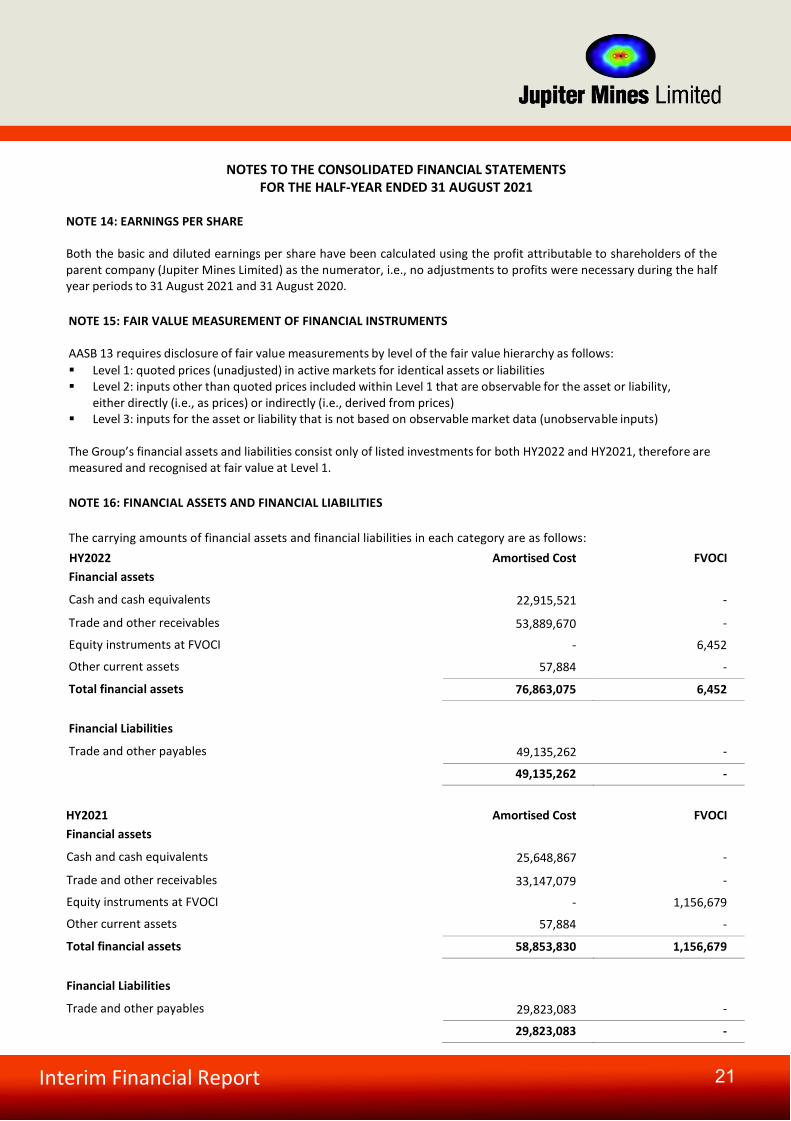
NOTE 14: EARNINGS PER SHARE Both the basic and diluted earnings per share have been calculated using the profit attributable to shareholders of the parent company (Jupiter Mines Limited) as the numerator, i.e., no adjustments to profits were necessary during the half year periods to 31 August 2021 and 31 August 2020. NOTE 15: FAIR VALUE MEASUREMENT OF FINANCIAL INSTRUMENTS
AASB 13 requires disclosure of fair value measurements by level of the fair value hierarchy as follows: Level 1: quoted prices (unadjusted) in active markets for identical assets or liabilities Level 2: inputs other than quoted prices included within Level 1 that are observable for the asset or liability,
either directly (i.e., as prices) or indirectly (i.e., derived from prices) Level 3: inputs for the asset or liability that is not based on observable market data (unobservable inputs)
The Group’s financial assets and liabilities consist only of listed investments for both HY2022 and HY2021, therefore are measured and recognised at fair value at Level 1. NOTE 16: FINANCIAL ASSETS AND FINANCIAL LIABILITIES The carrying amounts of financial assets and financial liabilities in each category are as follows: HY2022
Amortised Cost
FVOCI Financial assets
Cash and cash equivalents 22,915,521 -
Trade and other receivables 53,889,670 -
Equity instruments at FVOCI - 6,452
Other current assets 57,884 -
Total financial assets 76,863,075 6,452
Financial Liabilities
Trade and other payables 49,135,262 -
49,135,262 -
HY2021
Amortised Cost
FVOCI Financial assets
Cash and cash equivalents 25,648,867 -
Trade and other receivables 33,147,079
-
Equity instruments at FVOCI - 1,156,679
Other current assets 57,884 -
Total financial assets 58,853,830
1,156,679
Financial Liabilities
Trade and other payables 29,823,083
-
29,823,083
-
Interim Financial Report 22
NOTES TO THE CONSOLIDATED FINANCIAL STATEMENTS FOR THE HALF-YEAR ENDED 31 AUGUST 2021
NOTE 16: FINANCIAL ASSETS AND FINANCIAL LIABILITIES (continued)
FY2021
Amortised Cost FVOCI Financial assets
Cash and cash equivalents 60,622,311 -
Trade and other receivables 46,171,674 -
Equity instruments at FVOCI - 43,120
Other current assets 57,884 -
Total financial assets 106,851,869 43,120
Financial Liabilities
Trade and other payables 42,462,258 -
42,462,258 -
NOTE 17: DISCONTINUED OPERATIONS
(a) Demerger – Juno Minerals Limited
During the financial year, Jupiter Mines announced the demerger and initial public offering of its Central Yilgarn Iron Ore assets through the newly created company, Juno Minerals Limited. Consequently, assets and liabilities allocable to the assets were classified as a disposal group. Revenue and expenses, gains and losses relating to the discontinuation of this subgroup have been eliminated from profit or loss from the Group’s continuing operations and are shown as a single line item in the statement of profit or loss.
The group recognised a net accounting profit on demerger as follows:August 2021 $
Fair value of Juno Minerals Limited demerger (i) 30,000,000 Carrying value of net assets of Juno Minerals Limited (17,375,708) Pre-tax profit on demerger 12,624,292
(i) The fair value of the assets included in the demerger was based on management’s assessment of the fair value ofthe Central Yilgarn Iron Project and peer group analysis, and the seed capital funding provided to Juno. Thedemerger distribution is accounted for as a reduction in equity split between share capital $26,757,724 anddemerger reserve of $3,242,276. The difference between the fair value of the distribution and the capitalreduction amount is the demerger dividend.
b) Discontinued operations – Juno Minerals Limited
Financial Performance Information: August 2021
$ August 2020
$ Gain on demerger 12,624,292 - Total other income 12,624,292 -
Profit for the year from discontinued operations 12,624,292 -
Interim Financial Report 23
NOTES TO THE CONSOLIDATED FINANCIAL STATEMENTS FOR THE HALF-YEAR ENDED 31 AUGUST 2021
NOTE 17: DISCONTINUED OPERATIONS (continued)
Carrying amounts of assets and liabilities in this disposal group:
August 2021 $
February 2021 $
Non-current assets Exploration and evaluation assets - 12,716,021Current assets Cash - 5,000,000Other - (285,137) Assets classified as held for distribution - 17,430,884
The major classes of assets and liabilities of Juno Minerals Limited classified as held for distribution to the owners as at 28 February 2021 were demerged from the consolidated group on 7 May 2021, thus nil balances for the current period.
NOTE 18: CONTINGENT LIABILITIES
There has been no material change in contingent liabilities since the end of the last annual reporting period.
NOTE 19: DIVIDENDS
On 18 October 2021, the Directors declared an interim dividend for the half-year ended 31 August 2021 of $0.005 per ordinary share, to be paid on 9 November 2021.
Dividend per share Unfranked $ Total 2021 Final Dividend – paid 21 May 2021 $0.02 100% 39,179,821 2022 Interim Dividend – declared 18 October 2021 $0.005 100% 9,794,955
NOTE 20: SUBSEQUENT EVENTS
On 18 October 2021, the Directors declared an interim dividend for the half-year ended 31 August 2021 of $0.005 per ordinary share, to be paid on 9 November 2021.

Interim Financial Report 24
DIRECTORS’ DECLARATION
In the opinion of the Directors of Jupiter Mines Limited:
(a) The consolidated financial statements and notes of Jupiter Mines Limited are in accordance with the CorporationsAct 2001, including:
i. Giving a true and fair view of its financial position as at 31 August 2021 and of its performance for thehalf-year ended on that date; and
ii. Complying with Accounting Standard AASB 134 Interim Financial Reporting; and
(b) There are reasonable grounds to believe that the Company will be able to pay its debts as and when they becomedue and payable.
Signed in accordance with a resolution of the Directors.
Priyank Thapliyal Director Dated this 18th day of October 2021
Grant Thornton Audit Pty Ltd ACN 130 913 594 a subsidiary or related entity of Grant Thornton Australia Ltd ABN 41 127 556 389
‘Grant Thornton’ refers to the brand under which the Grant Thornton member firms provide assurance, tax and advisory services to their clients and/or refers to one or more member firms, as the context requires. Grant Thornton Australia Ltd is a member firm of Grant Thornton International Ltd (GTIL). GTIL and the member firms are not a worldwide partnership. GTIL and each member firm is a separate legal entity. Services are delivered by the member firms. GTIL does not provide services to clients. GTIL and its member firms are not agents of, and do not obligate one another and are not liable for one another’s acts or omissions. In the Australian context only, the use of the term ‘Grant Thornton’ may refer to
Grant Thornton Australia Limited ABN 41 127 556 389 and its Australian subsidiaries and related entities. GTIL is not an Australian related entity to Grant Thornton Australia Limited.
Liability limited by a scheme approved under Professional Standards Legislation.
www.grantthornton.com.au
Level 43, Central Park 152-158 St Georges Terrace PERTH WA 6000
Correspondence to: PO Box 7757 Cloisters Square Perth WA 6850
T +61 8 9480 2000 F +61 8 9322 7787 E [email protected] W www.grantthornton.com.au
Independent Auditor’s Report
To the Members of Jupiter Mines Limited
Report on the review of the half year financial report
Conclusion
We have reviewed the accompanying half year financial report of Jupiter Mines Limited (the Company) and its subsidiaries
(the Group), which comprises the consolidated condensed statement of financial position as at 31 August 2021, and the
consolidated condensed statement of profit or loss and other comprehensive income, consolidated condensed statement of
changes in equity and consolidated condensed statement of cash flows for the half year ended on that date, a description of
accounting policies, other selected explanatory notes, and the directors’ declaration.
Based on our review, which is not an audit, nothing has come to our attention that causes us to believe that the half year
financial report of Jupiter Mines Limited does not give a true and fair view of the financial position of the Group as at
31 August 2021, and of its financial performance and its cash flows for the half year ended on that date, in accordance with
the Corporations Act 2001, including complying with Accounting Standard AASB 134 Interim Financial Reporting.
Basis for Conclusion
We conducted our review in accordance with ASRE 2410 Review of Financial Report Performance by the Independent
Auditor of the Entity. Our responsibilities are further described in the Auditor’s Responsibilities for the Review of the Financial
Report section of our report. We are independent of the Company in accordance with the auditor independence requirements
of the Corporations Act 2001 and the ethical requirements of the Accounting Professional and Ethical Standards Board’s
APES 110 Code of Ethics for Professional Accountants (including Independence Standards) (the Code) that are relevant to
audit of the annual financial report in Australia. We have also fulfilled our other ethical responsibilities in accordance with the
Code. We confirm that the independence declaration required by the Corporations Act 2001 which has been given to the
directors of the Company, would be in the same terms if given to the directors as at the time of this auditor’s review report.
Directors’ responsibility for the half year financial report
The Directors of the Company are responsible for the preparation of the half year financial report that gives a true and fair view
in accordance with Australian Accounting Standards and the Corporations Act 2001 and for such internal control as the
Directors determine is necessary to enable the preparation of the half year financial report that gives a true and fair view and is
free from material misstatement, whether due to fraud or error.
Auditor’s responsibility
Our responsibility is to express a conclusion on the half year financial report based on our review. We conducted our review in
accordance with Auditing Standard on Review Engagements ASRE 2410 Review of a Financial Report Performed by the
Independent Auditor of the Entity, in order to state whether, on the basis of the procedures described, we have become aware
of any matter that makes us believe that the half year financial report is not in accordance with the Corporations Act 2001
including giving a true and fair view of the Group’s financial position as at 31 August 2021 and its performance for the half year
ended on that date, and complying with Accounting Standard AASB 134 Interim Financial Reporting and the Corporations
Regulations 2001. As the auditor of Jupiter Mines Limited, ASRE 2410 requires that we comply with the ethical requirements
relevant to the audit of the annual financial report.
A review of a half year financial report consists of making enquiries, primarily of persons responsible for financial and
accounting matters, and applying analytical and other review procedures. A review is substantially less in scope than an audit
conducted in accordance with Australian Auditing Standards and consequently does not enable us to obtain assurance that we
would become aware of all significant matters that might be identified in an audit. Accordingly, we do not express an audit
opinion.
Independence
In conducting our review, we have complied with the independence requirements of the Corporations Act 2001.
GRANT THORNTON AUDIT PTY LTD
Chartered Accountants
B P Steedman
Partner – Audit & Assurance
Perth, 18 October 2021


