Download - June 17, 2015 CRWD Board Packet

Our Mission is to protect, manage and improve the water resources of Capitol Region Watershed District
Regular Meeting of Capitol Region Watershed District (CRWD) Board Of Managers, for Wednesday, June 17,
2015 6:00 p.m. at the office of CRWD, 1410 Energy Park Drive, Suite 4, St. Paul, Minnesota.
REGULAR MEETING AGENDA
I. Call to Order of Regular Meeting (President Joe Collins)
A) Attendance
B) Review, Amendments and Approval of the Agenda
II. Public Comment – For Items not on the Agenda (Please observe a limit of three minutes per person.)
III. Permit Applications and Program Updates (Permit Process: 1) Staff Review/Recommendation, 2) Applicant Response, 3) Public Comment, and 4) Board Discussion
and Action.)
A) Permit # 15-008 Victoria Street Roseville - Wetland Permit (Kelley)
B) Permit # 15-025 Stewart Street (Kelley)
C) Permit # 08-021 St Paul College – Permit Closeout (Hosch)
IV. Special Reports A) MS4 Permit Annual Report and Public Meeting, Anna Eleria
B) 2014 Stormwater Monitoring Report, Britta Suppes
V. Action Items
A) AR: Approve Minutes of the June 3, 2015 Regular Meeting (Sylvander)
B) AR: Approve May 2015 Accounts Payables/Receivables (Sylvander)
C) AR: Approve Joint Powers Agreement with MPCA for Exfiltration Monitoring (Zwonitzer)
VI. Unfinished Business
A) Ford Site Update (Fossum)
B) Drainage Assistance Guidelines (Eleria)
VII. General Information
A) Summer Event Schedule
VIII. Next Meetings
A) Wednesday, June 10, 2015 CAC Tour
B) Wednesday, July 8, 2015 Board Meeting
IX. Adjournment
W:\04 Board of Managers\Agendas\2015\June 17, 2015 Agenda Regular Mtg.docx
Materials Enclosed
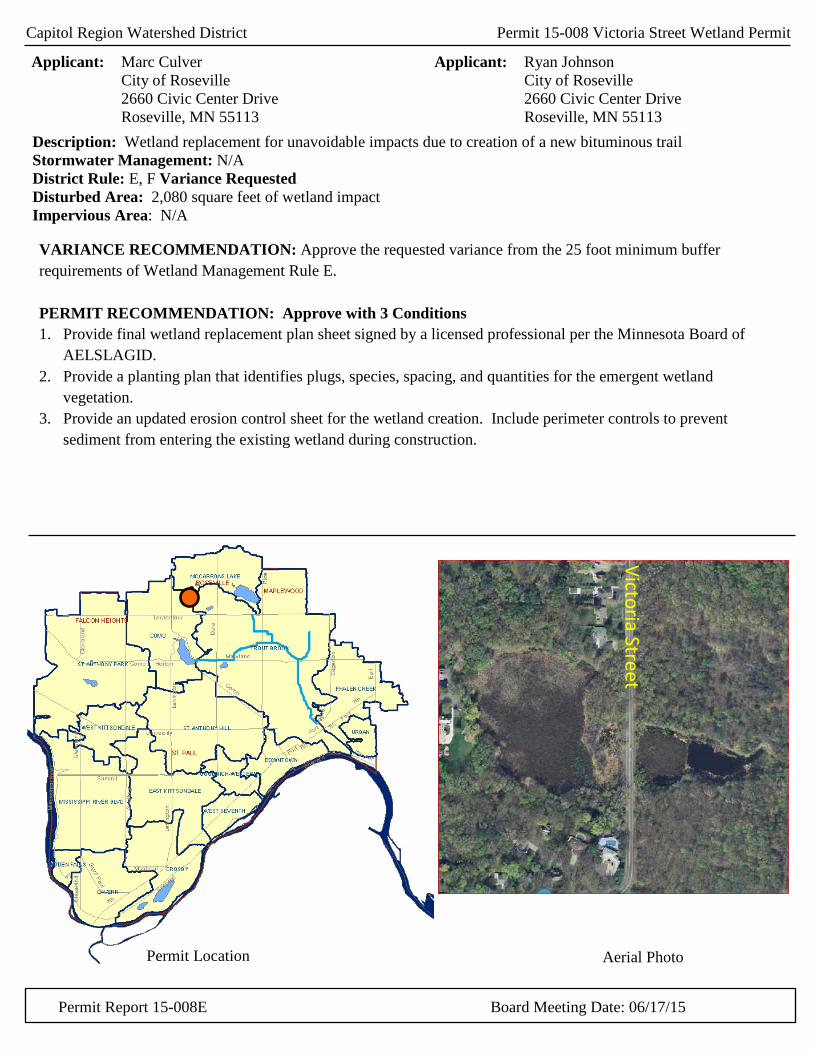
Capitol Region Watershed District Permit 15-008 Victoria Street Wetland Permit
Permit Report 15-008E Board Meeting Date: 06/17/15
Applicant: Marc Culver City of Roseville 2660 Civic Center Drive Roseville, MN 55113
VARIANCE RECOMMENDATION: Approve the requested variance from the 25 foot minimum buffer requirements of Wetland Management Rule E. PERMIT RECOMMENDATION: Approve with 3 Conditions 1. Provide final wetland replacement plan sheet signed by a licensed professional per the Minnesota Board of
AELSLAGID. 2. Provide a planting plan that identifies plugs, species, spacing, and quantities for the emergent wetland
vegetation. 3. Provide an updated erosion control sheet for the wetland creation. Include perimeter controls to prevent
sediment from entering the existing wetland during construction.
Applicant: Ryan Johnson City of Roseville
2660 Civic Center Drive Roseville, MN 55113
Description: Wetland replacement for unavoidable impacts due to creation of a new bituminous trail Stormwater Management: N/A District Rule: E, F Variance Requested Disturbed Area: 2,080 square feet of wetland impact Impervious Area: N/A
Permit Location
Aerial Photo
Victoria Street
Capitol Region Watershed District Permit Report
CRWD Permit #: 15-008 Review date: June 11, 2015 Project Name: Victoria Street Reconstruction Applicant: Marc Culver City of Roseville 2660 Civic Center Drive Roseville, MN 55113 651-792-7042 [email protected] Purpose: Wetland replacement for unavoidable impacts due to creation of a
new bituminous trail Location: Alameda Pond at Victoria Street between Roselawn and CR B Applicable Rules: E and F VARIANCE RECOMMENDATION: Approve the requested variance from the 25 foot minimum buffer requirements of Wetland Management Rule E. PERMIT RECOMMENDATION: Approve with 3 Conditions EXHIBITS:
1. Construction Plans, by City of Roseville, dated 3/6/15, recd. 4/6/15. 2. MN Joint Application form dated 5/7/15, recd. 5/15/15. 3. Joint Application Attachment D Packet, not dated, recd. 5/15/15. 4. Victoria Wetland Land Acquisition Potential Path, by City of Roseville, not dated,
recd. 5/7/15 HISTORY & CONSIDERATIONS: Permit 15-008 Victoria Street Roseville was issued on April 21, 2015. That permit did not include an approved replacement plan or allow for impacts to the wetlands on site. RULE C: STORMWATER MANAGEMENT
W:\07 Programs\Permitting\2015\15-008 Victoria Street Roseville\WCA\15-008 Victoria Street wetland review.doc Page 1 of 3

Standards Proposed discharge rates for the 2-, 10-, and 100-year events shall not exceed
existing rates. Developments and redevelopments must reduce runoff volumes in the amount
equivalent to an inch of runoff from the impervious areas of the site. Stormwater must be pretreated before discharging to infiltration areas to
maintain the long-term viability of the infiltration area. Developments and redevelopments must incorporate effective non-point
source pollution reduction BMPs to achieve 90% total suspended solid removal.
Findings N/A
RULE D: FLOOD CONTROL
Standards Compensatory storage shall be provided for fill placed within the 100-year
floodplain. All habitable buildings, roads, and parking structures on or adjacent to a
project site shall comply with District freeboard requirements. Findings
N/A RULE E: WETLAND MANAGEMENT Standard
Wetlands shall not be drained, filled (wholly or in part), excavated, or have sustaining hydrology impacted such that there will be a decrease in the inherent (existing) functions and values of the wetland.
A minimum buffer of 25 feet of permanent nonimpacted vegetative ground cover abutting and surrounding a wetland is required.
Findings 1. The project intersects a wetland that is approximately 8.7 acres. 2. Wetland boundaries have been delineated and approved by CRWD staff and
WCA. 3. Approximately 2,080 square feet of wetland impact are proposed from the
addition of a continuous trail from Larpenteur to County Road B. 4. WCA sequencing has been adequately addressed by attempting to avoid and
minimize the impacts. Alternatives considered but determined infeasible include realignment, pedestrian crossings, boardwalks, decreasing road setbacks, and increasing bank slopes.
5. Impact mitigation is proposed by creating a 6,098 sf wetland in upland adjacent to the wetland across Victoria Street.
W:\07 Programs\Permitting\2015\15-008 Victoria Street Roseville\WCA\15-008 Victoria Street wetland review.doc Page 2 of 3

6. The City of Roseville is purchasing the privately owned parcel to the south of the existing wetland in order to construct the replacement wetland. CRWD provided a grant to purchase and protect the wooded buffer.
7. A minimum buffer of 25 feet is not provided. A variance has been requested based on the following findings:
a. A 25 foot buffer currently does not exist due to wetlands directly adjacent to the road embankment on both sides.
b. Providing a 25 foot buffer would require additional wetland fill. c. The stormwater runoff from the new trail will be directed away from
the wetland and to curb and gutter through a stable piped conveyance. RULE F: EROSION AND SEDIMENT CONTROL
Standards A plan shall demonstrate that appropriate erosion and sediment control
measures protect downstream water bodies from the effects of a land-disturbing activity.
Erosion Control Plans must adhere to the MPCA Protecting Water Quality in Urban Areas Manual.
Findings 1. The existing west wetland is not protected from sediment deposition.
Additional BMPs are needed. RULE G: ILLICIT DISCHARGE AND CONNECTION
Standard Stormwater management and utility plans shall indicate all existing and
proposed connections from developed and undeveloped lands for all water that drains to the District MS4.
Findings
N/A VARIANCE RECOMMENDATION: Approve the requested variance from the 25 foot minimum buffer requirements of Wetland Management Rule E. RECOMMENDATION: Approve with 3 Conditions Conditions:
1. Provide final wetland replacement plans signed by a licensed professional per the Minnesota Board of AELSLAGID.
2. Provide a planting plan that identifies plugs, species, spacing, and quantities for the emergent wetland vegetation.
3. Provide an updated erosion control sheet for the wetland creation. Include perimeter controls to prevent sediment from entering the existing wetland during construction.
W:\07 Programs\Permitting\2015\15-008 Victoria Street Roseville\WCA\15-008 Victoria Street wetland review.doc Page 3 of 3

URBAN SECTION RECONSTRUCTIONWETLAND IMPACTS
15 30 60
Figure 1

SHEET NO.
FIE
LD B
OO
K:
Plo
t Dat
e: 0
4/07
/201
5D
raw
ing
nam
e: R
:\Pub
licW
orks
\CA
D\P
roje
cts\
2015
\15-
02_2
015_
PM
P_R
econ
stru
ctio
n\D
raw
ings
\27-
Vic
tST_
C50
1.dw
gX
refs
:, X
-SIT
E-E
XS
T, R
SV
L22-
bdr,
X-S
ITE
-NE
W, X
-SIT
E-S
UR
F
DE
SC
RIP
TIO
N O
F R
EV
ISIO
NS
DA
TEN
O.
BY
LIC
. NO
.D
ATE
CH
EC
KE
D
DE
SIG
NE
DD
RA
WN
CIT
Y P
RO
J. N
O.
SA
P N
O.
SHEET NO. OF SHEETS
EN
GIN
EE
RIN
G
DE
PA
RTM
EN
T
I HE
RE
BY
CE
RTI
FY T
HA
T TH
IS P
LAN
WA
S P
RE
PA
RE
DB
Y M
E O
R U
ND
ER
MY
DIR
EC
T S
UP
ER
VIS
ION
AN
D T
HA
TI A
M A
DU
LY L
ICE
NS
ED
UN
DE
R T
HE
LA
WS
OF
THE
STA
TE O
F M
INN
ES
OTA
.E
R T
HE
LA
WS
OF
THE
STA
TE O
F M
INN
ES
O
2015
PM
P R
EC
ON
STR
UC
TIO
NV
ICTO
RIA
STR
EE
T
4200
2D
ATE
DR
T/M
JCD
RT
MJC
15-0
216
0-25
1-00
3 06
2-65
2-02
1
LAR
PE
NTE
UR
AV
E. T
O C
OU
NTY
RO
AD
BV
ICTO
RIA
ST.
RE
CO
NS
TRU
CTI
ON
71
PR
OFE
SS
ION
AL
EN
GIN
EE
RP
RO
FES
SIO
NA
L E
NG
INE
ER
CIT
Y E
NG
INE
ER
CIT
YE
NG
INE
ER
27
14/
7/15
DR
TA
DD
EN
DU
M #
2
STO
RM
SE
WE
R
950
940
975
970
965
960
955
945
ROSELAWN AVE./VICTORIA ST. STORM SEWER15 30 60
950
980
975
970
965
960
955
945
NOTES:1. CONTRACTOR IS RESPONSIBLE FOR HAVING UTILITIES LOCATED IN THE FIELD.2. SIGN RELOCATIONS (REMOVAL, PROTECTION AND REINSTALLATION) IS INCIDENTAL UNLESS OTHERWISE NOTED.3. SEE TABULATION A FOR WORK PERFORMED ON ALL UTILITY STRUCTURES WITHIN CONSTRUCTION LIMITS4. INSULATE ALL EXISTING WATER SERVICES AT ALL STORM SEWER CROSSINGS. SEE INSULATION DETAIL.
Access/Parking
Future Trail on top of berm

Path
Wetland Edge
Wetland Edge
Approximate Mitigation Area
Access/Parking
Prepared by:Engineering Department ´
0 40 80 Feet
Victoria Street Mill & Overlawyand Pathway Improvements
Wetland Mitigation Area and Future Path Layout (DRAFT)2011 Aerial
May 07, 2015 mapdoc: Victoria Wetland Land Acquisition Potential Path.mxdmap: Victoria Wetland Land Acquisition Potent ial Path.pdf
1975 Victoria StreetLegend
Wetland Replacement
Wetland Boundary
Parcels_Detai l

Capitol Region Watershed District Permit 15-025 Stewart Street Extension
STAFF RECOMMENDATION: Approve with 3 Conditions: 1. Provide plans signed by a professional engineer per the Minnesota Board of AELSLAGID. 2. Provide a copy of the NPDES permit. 3. Provide a landscaping plan that includes plugs for vegetation establishment on the basin bottom.
Permit Report 15-025 Board Meeting Date: 06/17/2015
Applicant: Diane Nordquist St. Paul Planning and Economic Development 25 W Fourth Street, Suite 1300 CHA St Paul, MN 55102
Consultant: Eric Klingbeil TKDA, Inc
444 Cedar Street, Suite 1500 St. Paul, MN 55101-2140
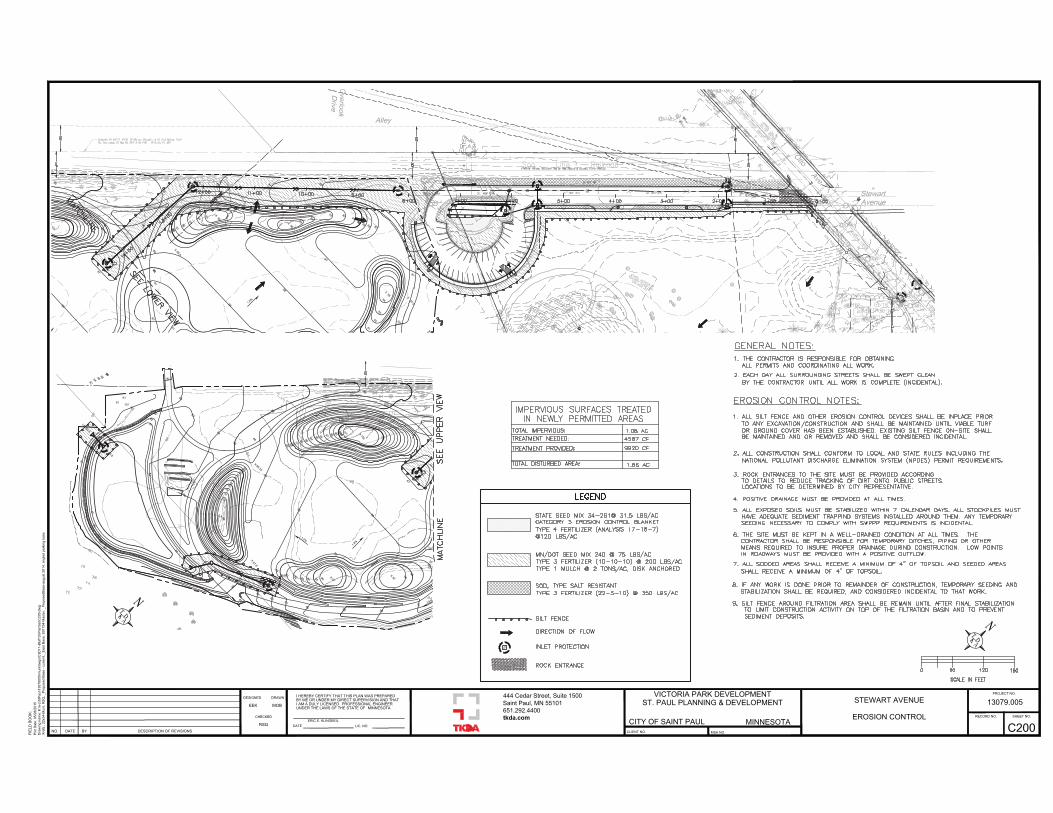
Description: Construction of a new parking lot and street extension into Victoria Park Stormwater Management: Applicant proposes one surface filtration basin. District Rule: —C D F Disturbed Area: 1.86 Acres Impervious Area: 1.08 Acres
Permit Location
Aerial Photo
Otto

Capitol Region Watershed District Permit Report
CRWD Permit #: 15-025 Review date: June 9, 2015 Project Name: Stewart Street Applicant: Diane Nordquist
Saint Paul Planning and Economic Development 25 West Fourth Street Saint Paul, MN 55101 651-266-6640 [email protected]
Purpose: Construction of a cul-de-sac road, a filtration basin, and storm
sewer. Location: West of the intersection of Otto Avenue and Stewart Avenue Applicable Rules: C, D, and F Recommendation: Approve with 3 Conditions EXHIBITS:
1. Drainage Area Map, by TKDA, dated 5/15/15, recd. 5/28/15. 2. Atlas 14 storm duration frequencies, by NOAA, dated 6/18/14, recd. 5/4/15. 3. HydroCAD Report, by TKDA, dated 5/15/15, recd. 5/28/15. 4. Drain Tile Calculation, by TKDA, not dated, recd. 5/4/15. 5. Drainage Report, by TKDA, dated 8/9/12, recd. 5/4/15. 6. Stormwater Memorandum, by TKDA, dated 5/15/15, recd. 5/28/15. 7. Response to Comments, by TKDA, dated 5/28/15, recd. 5/28/15. 8. Project Plans (sheets C000, C001, C100-C102, C200, C201, C300, C400, C500,
C501-C503, C600-C602, E100, E101), by TKDA, dated 5/28/15, recd. 5/28/15. HISTORY & CONSIDERATIONS: Work was previously approved on this site under permits 11-023 and 14-022. A private project adjacent to the site is being reviewed under permit 15-026. RULE C: STORMWATER MANAGEMENT
W:\07 Programs\Permitting\2015\15-025 Stewart Street Extension\15-025 Stewart Street_Review_02.doc Page 1 of 4

Standards Proposed discharge rates for the 2-, 10-, and 100-year events shall not exceed
existing rates. Developments and redevelopments must reduce runoff volumes in the amount
equivalent to an inch of runoff from the impervious areas of the site. Stormwater must be pretreated before discharging to infiltration areas to
maintain the long-term viability of the infiltration area. Developments and redevelopments must incorporate effective non-point
source pollution reduction BMPs to achieve 90% total suspended solid removal.
Findings 1. A hydrograph method based on sound hydrologic theory is used to analyze
runoff for the design or analysis of flows and water levels. 2. Runoff rates for the proposed activity do not exceed existing runoff rates for
the 2-, 10-, and 100-year critical storm events. Stormwater leaving the project area is discharged into a well-defined receiving channel or pipe and routed to a public drainage system.
3. Stormwater runoff volume retention is not achieved onsite in the amount equivalent to the runoff generated from one inch of rainfall over the impervious surfaces of the development.
a. The amount of proposed impervious onsite is 47,045 square feet. b. Volume retention calculation :
47,045 sf X 0.9 inches X (1/12 foot/inch) =3,528 cf Volume
Retention Required (cu. ft.)
BMP 1 inch Runoff (cu. ft.)
2 inch Runoff Max
(cu. ft.)
Volume below outlet
(cu. ft.)
3,528 None. Filtration is proposed.
c. Filtration is proposed due to high bedrock: d. 70% credit Filtration calculation:
3,528 cf X 1.3 credit factor = 4,587 cf Filtration Volume Required (cu. ft.)
BMP 1 inch
Runoff (cu. ft.)
2 inch Runoff
Max (cu. ft.)
Volume below outlet
(cu. ft.)
4,587 Filtration basin 2,737 5,474 cf 13,161
Total Volume Credit 5,474 cf
e. Banking of excess volume retention is not proposed. f. Filtration volume and facility size has been calculated using the
appropriate hydrological soil group classification and design infiltration rate.
W:\07 Programs\Permitting\2015\15-025 Stewart Street Extension\15-025 Stewart Street_Review_02.doc Page 2 of 4

g. The filtration area is capable of filtering the required volume within 48 hours.
h. Stormwater runoff is pretreated to remove solids before discharging to infiltration areas.
4. Alternative compliance sequencing has been requested. 5. Best management practices do not achieve 90% total suspended solids
removal from the runoff generated by the new street on an annual basis. However, additional off-site treatment was directed to the oversized filtration basin to north of the railroad that offset the drainage leaving the site untreated
6. The City of St. Paul has a standing Memorandum of Understanding for maintenance with CRWD. Adequate maintenance access is provided for the surface systems.
RULE D: FLOOD CONTROL Standards Compensatory storage shall be provided for fill placed within the 100-year
floodplain. All habitable buildings, roads, and parking structures on or adjacent to a
project site shall comply with District freeboard requirements. Findings 1. There is no floodplain on the property according to FEMA. 2. It is not known if all habitable buildings, roads, and parking structures on or
adjacent to the project site comply with CRWD freeboard requirements. However, adequate conveyance of stormwater has been provided to prevent flooding.
RULE E: WETLAND MANAGEMENT Standard
Wetlands shall not be drained, filled (wholly or in part), excavated, or have sustaining hydrology impacted such that there will be a decrease in the inherent (existing) functions and values of the wetland.
A minimum buffer of 25 feet of permanent nonimpacted vegetative ground cover abutting and surrounding a wetland is required.
Findings 1. There are no known wetlands located on the property.
RULE F: EROSION AND SEDIMENT CONTROL
Standards A plan shall demonstrate that appropriate erosion and sediment control
measures protect downstream water bodies from the effects of a land-disturbing activity.
Erosion Control Plans must adhere to the MPCA Protecting Water Quality in Urban Areas Manual.
W:\07 Programs\Permitting\2015\15-025 Stewart Street Extension\15-025 Stewart Street_Review_02.doc Page 3 of 4

Findings 1. Erosion and sediment control measures are consistent with best management
practices, as demonstrated in the MPCA manual Protecting Water Quality in Urban Areas.
2. Adjacent properties are protected from sediment transport/deposition. 3. Wetlands, waterbodies and water conveyance systems are protected from
erosion/sediment transport/deposition. 4. Project site is greater than 1 acre; an NPDES permit is required. A SWPPP has
been submitted and satisfies NPDES requirements. RULE G: ILLICIT DISCHARGE AND CONNECTION
Standard Stormwater management and utility plans shall indicate all existing and
proposed connections from developed and undeveloped lands for all water that drains to the District MS4.
Findings 1. New direct connections or replacement of existing connections are not
proposed. 2. Prohibited discharges are not proposed.
Recommendation: Approve with 3 Conditions Conditions:
1. Provide plans signed by a professional engineer per the Minnesota Board of AELSLAGID.
2. Provide a copy of the NPDES permit. 3. Provide a landscaping plan that includes plugs for vegetation establishment on the
basin bottom.
W:\07 Programs\Permitting\2015\15-025 Stewart Street Extension\15-025 Stewart Street_Review_02.doc Page 4 of 4
DESCRIPTION OF REVISIONS
FIE
LD B
OO
K:
DATENO. BYLIC. NO.
UNDER THE LAWS OF THE STATE OF
BY ME OR UNDER MY DIRECT SUPERVISION AND THATI HEREBY CERTIFY THAT THIS PLAN WAS PREPARED
DATE
CHECKED
DESIGNED DRAWN
I AM A DULY LICENSED
CLIENT NO. MSA NO.
RECORD NO.
PROJECT NO.
Plo
t Dat
e: 0
5/28
/201
5D
raw
ing
nam
e: K
:\n-z
\StP
aul\1
3079
005\
mun
i\dw
gs\C
3D11
-Blu
ff S
t\Pla
nSet
\C20
0.dw
gX
refs
:, 22
x34-
Mun
i, R
SQ
, _P
ropo
sed
Bas
e - c
urre
nt, _
Exi
st B
ase,
S01
794-
Mas
ter,
_Pro
pose
dBas
e-au
gust
201
4, a
ngle
d pa
rkin
g ba
se
SHEET NO.
444 Cedar Street, Suite 1500Saint Paul, MN 55101651.292.4400tkda.com
13079.005VICTORIA PARK DEVELOPMENT
ST. PAUL PLANNING & DEVELOPMENT
CITY OF SAINT PAUL MINNESOTAERIC E. KLINGBEIL
EEK MOB
RSQ
MINNESOTAPROFESSIONAL ENGINEER
C200
STEWART AVENUE
EROSION CONTROL

Our Mission is to protect, manage and improve the water resources of Capitol Region Watershed District.
DATE: June 9, 2015
TO: CRWD Board of Managers
FROM: Elizabeth Hosch, BMP Inspector
RE: Permit Closeout
Background
Construction activity is complete for permit 08-021, St. Paul College.
Issues
Final inspection has been conducted to confirm construction of a new entry drive, functionality of an
underground infiltration stormwater treatment system, and final stabilization.
No surety was retained for the project.
Action Requested
Approve Certificate of Completion for permit #08-021, St. Paul College.
cc: Jim Mogen, Ramsey Country Attorney’s Office
W:\07 Programs\Permitting\Board Memos\2015-6-17 Permit Closeout Board Memo.docx
June 17, 2015
III. Permit Applications
(B.) Permit Close Out
(Hosch)

Our Mission is to protect, manage and improve the water resources of Capitol Region Watershed District.
DATE: June 11, 2015 TO: CRWD Board of Managers FROM: Anna Eleria, Water Resource Project Manager RE: Approve MS4 Annual Report for 2014
Background
As a regulated operator of a small municipal separate storm sewer system (MS4), CRWD is required to prepare and submit an annual report of activities and accomplishments associated with its stormwater pollution prevention program (SWPPP) by June 30th to MN Pollution Control Agency (MPCA). CRWD must solicit public comment on the MS4 annual report and hold an annual public meeting to present the SWPPP activities and accomplishments made in the previous year.
Issues
At the June 3, 2015 meeting, the Board authorized a public comment period for CRWD’s 2014 stormwater management activities and accomplishments, which are summarized in the enclosed draft MS4 annual report form and in CRWD’s draft 2014 annual report. The public comment period ends on June 28th. Announcements of the public comment period and public meeting were published in the Saint Paul Pioneer Press and CRWD’s website. The draft 2014 annual reports are available on CRWD’s website.
The June 17th Board meeting serves as CRWD’s annual public meeting. CRWD staff will give a brief presentation of CRWD’s stormwater management accomplishments and accept comments from the public. Any comments received at the meeting or in writing will be considered and if appropriate, incorporated into the annual report.
Action Requested
Approve CRWD’s MS4 Annual Report for 2014 and authorize the Administrator to submit the report to Minnesota Pollution Control Agency.
enc: Draft CRWD MS4 Annual Report for 2014 (hard copies available at the meeting upon request)
W:\06 Projects\Trout Brook Interceptor\NPDES MS4 Permit\Board Memos\BM MS4 Annual Report Public Meeting 06-17-15.docx
June 17, 2015 Board Meeting IV. Special Report – A) CRWD
MS4 Annual Report for 2014 and Public Meeting (Eleria)


DATE: June 11, 2015 TO: CRWD Board of Managers FROM: Britta Suppes, Monitoring Coordinator RE: Accept 2014 Stormwater Monitoring Report Background Since 2005, CRWD has been collecting and analyzing water quality data through the District Monitoring Program. During the 2014 monitoring period (January-December), stormwater monitoring sites located throughout seven of the sixteen major subwatersheds were monitored for flow and water quality. Water quality samples were analyzed for a variety of parameters including nutrients, solids, metals, bacteria, and chloride. Conclusions and recommendations from 2014 will help guide monitoring performed in 2015. Issues Staff have analyzed the 2014 monitoring data and have completed a draft stormwater report. Staff will review and request acceptance of the 2014 Stormwater Monitoring Report at this Board meeting. The report will be reviewed with the Managers highlighting key findings from the monitoring efforts. The report is lengthy and staff would suggest Managers focus their review on sections 1 (Executive Summary), 2 (Introduction), 4 (Climatological Summary), 5 (2014 CRWD Water Quality Results Summary), and 13 (Conclusions & Recommendations). If you would like a paper copy of the draft report please contact Michelle at the office. Requested Action Accept 2014 Stormwater Monitoring Report. enc: Draft 2014 Stormwater Monitoring Report (hard copies available at the meeting upon request) W:\07 Programs\Monitoring & Data Acquisition\2014 Monitoring\2014 Annual Report\Brd Memo_Strmwtr Report 6-11-15.docx
June 17, 2013 Board Meeting
IV. Special Report—2014 Stormwater Monitoring Report
(Suppes)
Our Mission is to protect, manage and improve the water resources of Capitol Region Watershed District

2014 Stormwater Monitoring Report
JUNE 11, 2015
Prepared By: CAPITOL REGION WATERSHED DISTRICT


TABLE OF CONTENTS
Acronyms ........................................................................................................................................ i
Definitions ..................................................................................................................................... iii
List of Figures ................................................................................................................................ v
List of Tables ................................................................................................................................ xi
1. Executive Summary ........................................................................................................... 1
2. Introduction ........................................................................................................................ 5
3. Methods............................................................................................................................... 9
4. 2014 Climatological Summary ......................................................................................... 23
5. 2014 CRWD Water Quality Results Summary ................................................................ 33
6. Como Subwatershed Results............................................................................................. 61
7. Hidden Falls Subwatershed Results .................................................................................. 95
8. East Kittsondale Subwatershed Results .......................................................................... 107
9. McCarrons Subwatershed Results .................................................................................. 125
10. Phalen Creek Subwatershed Results ............................................................................... 145
11. St. Anthony Park Subwatershed Results ......................................................................... 163
12. Trout Brook Subwatershed Results ............................................................................... 195
13. Conclusions & Recommendations .................................................................................. 243
14. References ....................................................................................................................... 247
Appendix A: Metals Standards Based on Hardness ................................................................... 251
Appendix B: Miscellaneous Reference Tables ........................................................................... 255
Appendix C: Average Monthly Concentrations by Site ............................................................. 259
Appendix D: Analysis of Nutrient Loading & Performance of the Villa Park Wetland ............ 263


2014 CRWD Stormwater Monitoring Report i
ACRONYMS AND ABBREVIATIONS
ac Acre
AHUG Arlington Hamline Underground Infiltration Facility
BMP Best Management Practice
cBOD 5-day Carbonaceous Biochemical Oxygen Demand
Cd Cadmium
cf Cubic feet
cfs Cubic feet per second
cfu Colony forming unit
Chl-a Chlorophyll-a
Cl- Chloride
Cr Chromium
CRWD Capitol Region Watershed District
CS
Cu
Chronic standard
Copper
DO Dissolved Oxygen
E. coli Escherichia coli
EK
EMC
EPA
East Kittsondale
Event Mean Concentration
Environmental Protection Agency
ft Foot
GP
ha
Gottfried’s Pit
Hectare
Hg
FWA
Mercury
Flow-Weighted Average
IBI Index of Biological Integrity
IDDE Illicit Discharge Detection and Elimination
in Inch
kg Kilogram
L Liter
lb Pound
m Meter
MCES
MCWG
Metropolitan Council Environmental Services
Minnesota Climatological Working Group
mg Milligram
mL Milliliter
MnDOT Minnesota Department of Transportation
MPCA Minnesota Pollution Control Agency
MPN Most probable number
MS4 Municipal Separate Storm Sewer System

2014 CRWD Stormwater Monitoring Report ii
MSP Minneapolis-St. Paul International Airport
NA
NCHF
Not Available
North Central Hardwood Forest
NH3 Ammonia
Ni Nickel
NO2 Nitrite
NO3 Nitrate
NOAA National Oceanic and Atmospheric Administration
NWS
NSQD
Ortho-P
National Weather Service
National Stormwater Quality Database
Orthophosphate
Pb Lead
PC
PCBs
PFOS
Phalen Creek
Polychlorinated biphenyls
perfluorooctane sulfonate
QAPP Quality Assurance Program Plan
RCD Ramsey Conservation District
RCPW Ramsey County Public Works
S Second
SAP
TB
TB-EB
St. Anthony Park
Trout Brook
Trout Brook East Branch
TBI
TBO
TB-WB
Trout Brook Storm Sewer Interceptor
Trout Brook Outlet
Trout Brook West Branch
TDS Total Dissolved Solids
TKN Total Kjeldahl Nitrogen
TMDL
TN
TP
Total Maximum Daily Load
Total Nitrogen
Total Phosphorus
TSS Total Suspended Solids
UMN
VPO
VSS
University of Minnesota-St. Paul Campus
Villa Park Outlet
Volatile Suspended Solids
Zn Zinc
2014 CRWD Stormwater Monitoring Report iii
DEFINITIONS
Acute exposure – in water quality standards, the maximum concentration of a chemical to which
an organism may be exposed for a short time period without experiencing adverse effects.
Baseflow – the sustained non-storm event flow in a channel or pipe dominated by subsurface
flows (i.e. groundwater) that is usually at a relatively constant, slow velocity.
Best Management Practice – technique, measure, or structural control that is used for a given
set of conditions to manage the quantity and improve the quality of stormwater runoff in the
most cost effective manner.
Bioaccumulation – the accumulation of a toxic substance within an organism, occurring when
the substance is absorbed faster than it is lost or expelled. This can lead to chronic poisoning,
even if concentrations in the environment are relatively low.
Chronic exposure – in water quality standards, the maximum concentration of a chemical to
which an organism may be exposed for an extended period of time without experiencing adverse
effects.
Composite sample – a water sample that is made up of several samples taken at spaced
intervals.
Contaminants of emerging concern – substances that have been released to, found in, or have
potential to enter waters; and present a known or perceived threat to human or environmental
health, have new or changing exposure information, or have limited information on the effects of
exposure. These often occur at low concentrations and may include pharmaceuticals, pesticides,
and personal care products, among others.
Designated use – the water quality standards regulation requires that States and authorized
Indian Tribes specify appropriate water uses to be achieved and protected. Appropriate uses are
identified by taking into consideration the use and value of the water body for public water
supply, for protection of fish, shellfish, and wildlife, and for recreational, agricultural, industrial,
and navigational purposes.
Discharge – volumetric rate of flow in pipe or stream, expressed as a volume per unit time, most
commonly cubic feet per second (cfs).
Eutrophic – a water body with high nutrient concentrations and primary biological productivity.
Eutrophic lakes have murky water and an extensive macrophyte population. Algal blooms are
common.
Flow-weighted concentration – the total pollutant load divided by total flow, often expressed as
mg/L.

2014 CRWD Stormwater Monitoring Report iv
Grab sample – a water sample that is obtained by taking a single sample.
Hardness – the concentration of calcium and magnesium salts (e.g. calcium carbonate,
magnesium carbonate) in a water sample.
Illicit Discharge – any discharge to the municipal separate storm sewer system that is not
composed entirely of stormwater, except for discharges allowed under a NPDES permit or water
used for firefighting operations (EPA).
Impaired Waters – waters that are not meeting their designated uses because of excess
pollutants violating water quality standards.
Impervious surface – a surface covered by materials that are impenetrable by water. These are
primarily artificial structures, such as pavements and rooftops.
Load – the total amount of pollutant, often expressed in lbs or kg.
Normalized Pollutant Yield – this normalized yield accounts for temporal and spatial
precipitation differences by dividing the pollutant yield by the number of inches of water runoff
(water yield) in a subwatershed over a given period of time. It is expressed as pounds per acre
per inch of runoff.
Stormflow – water flowing through the pipe during storm events resulting from precipitation.
Storm flow usually occurs for a short amount of time, and has a high velocity.
Stormwater – water that becomes runoff during a precipitation event.
Subwatershed – a delineated area of land within a larger watershed where surface waters and
runoff drain to a single point before ultimately discharging from the encompassing watershed.
Total Maximum Daily Load – the maximum amount of a substance that can be received by a
water body while still meeting water quality standards. This may also refer to the allocation of
acceptable portions of this load to different sources.
Turbidity – a measure of the relative clarity of a liquid. Turbidity measurements can provide a
simple indicator of potential pollution in a sample. Turbid water will appear cloudy or hazy.
Watershed – a delineated area of land where surface waters and runoff drain to a single point at
a lower elevation.
Yield – the amount of pollutant produced per land area, often expressed as lbs/acre or kg/ha.

2014 CRWD Stormwater Monitoring Report 1
1 EXECUTIVE SUMMARY
1.1 CAPITOL REGION WATERSHED DISTRICT
The watershed boundaries of the Capitol Region Watershed District (CRWD) are located entirely
in Ramsey County, Minnesota. It is a small urban watershed nested in the Upper Mississippi
River basin with all runoff from the watershed eventually discharging to the Mississippi River
along a 13-mile reach in St. Paul, Minnesota through 42 storm tunnel outfall pipes. All surface
water and stormwater runoff in the watershed is managed by CRWD, a special purpose unit of
government founded in 1998 with the goal of managing, protecting, and improving all water
resources within the watershed boundaries. CRWD contains portions of five cities, including:
Falcon Heights, Lauderdale, Maplewood, Roseville, and Saint Paul. CRWD is highly developed
and urbanized with a population of 245,000 and 42%+ impervious surfaces.
1.2 PURPOSE OF REPORT
A goal of CRWD is to understand and address the presence of stormwater pollutants and their
impacts on water quality within the District in order to better protect and manage local water
resources. Therefore, CRWD established a monitoring program in 2004 to: (1) identify water
quality problem areas; (2) quantify subwatershed runoff pollutant loadings; (3) evaluate the
effectiveness of stormwater best management practices (BMPs); (4) provide data for the
calibration of hydrologic, hydraulic, and water quality models; and (5) promote understanding of
District water resources and water quality. To achieve these objectives, CRWD collects
continuous flow data and stormwater quality data from major subwatersheds, lakes, ponds, and
stormwater BMPs.
This annual report presents the stormwater quality and quantity data collected during the 2014
monitoring year (January 2014 to December 2014) and provides analysis of results for all
monitored subwatersheds. In addition, historical water quality and quantity data from previous
monitoring years (2005-2013) are reported for comparison to the 2014 data. The purpose of this
report is to use the data to characterize overall watershed health and water quality trends over
time, which in turn will inform management decisions for continued improvement of District
water resources. Previous annual stormwater monitoring reports (2005-2013) are available on the
CRWD website (www.capitolregionwd.org).
1.3 STORMWATER MONITORING METHODS
Within CRWD, there are sixteen major subwatersheds, seven of which are currently monitored
for water quantity and quality (Como, East Kittsondale, Hidden Falls, McCarrons, Phalen Creek,
St. Anthony Park, and Trout Brook). Within the seven monitored subwatersheds, CRWD
collected water quality and/or quantity data at eighteen monitoring sites in 2014, including:

2014 CRWD Stormwater Monitoring Report 2
twelve “full water quality” stations with automated samplers and water level and velocity
sensors; three “flow-only” stations with water level and velocity sensors; and four water level
sites. In addition, six precipitation gauges collected rainfall data across the watershed.
Samples were collected during baseflow, stormflow, and snowmelt periods and were analyzed to
determine pollutant concentrations for a suite of water quality parameters including nutrients,
sediment, metals, and bacteria. At each monitoring site, the flow data and pollutant
concentrations data were used to calculate total annual pollutant loads and yields from each
subwatershed.
1.4 2014 MONITORING RESULTS & CONCLUSIONS
The total amount of precipitation for the 2014 calendar year was 35.66 inches, which was 5.05
inches greater than the National Weather Service (NWS) 30-year normal. April, May, and June
2014 were the wettest months, comprising 57% of the total annual precipitation. The wet spring
months generated the majority of stormflow and pollutant loading from all CRWD
subwatersheds. The months of July through October 2014 were unseasonably dry, which resulted
in reduced pollutant loading during this period.
In 2014, the Trout Brook subwatershed exported the greatest amount of water (666,381,676 cf)
because it has the largest drainage area in CRWD (5,028 acres). The 2014 water yields for all
monitored subwatersheds were greater than the historical averages of previous monitoring years
(2005-2013), largely due to an above average annual precipitation year. Phalen Creek recorded
the highest annual water yield (145,979 cf/ac) in comparison to all other continuously monitored
stations in 2014.
In 2014, all monitored subwatersheds exceeded their historical average (2010-2013) total
suspended solids (TSS) yield (lbs/acre), except for Trout Brook-West Branch and Villa Park. At
most stations, TSS yields were likely greater than historical averages in 2014 because of the
above average precipitation that occurred; TSS loading is primarily driven by stormwater runoff.
East Kittsondale produced the highest total annual TSS yields on a per acre basis in 2014 (711
lbs/ac). Trout Brook Outlet had the largest total annual TSS load (2,364,568 lbs) in 2014, of
which 78% of the total load was transported by stormflow.
The 2014 total annual total phosphorus (TP) yields (lbs/acre) generally increased at all sites in
comparison to historical averages (2010-2013). East Kittsondale produced the highest total
annual TP yield (1.37 lb/ac). Como 3 (0.14 lbs/ac) and Sarita (0.16 lbs/ac) had the lowest annual
TP yields of all subwatershed in 2014. Overall, in 2014 Trout Brook Outlet produced the largest
total annual TP load (5,564 lbs). TP loading in 2014 primarily occurred during storm events at all
continuously monitored stations, even though baseflow accounted for the majority of the total
discharge.
In 2014, snowmelt made up a larger portion of discharge, TSS load, and TP load due to a deep
snowpack during the 2013-2014 winter (76.2 inches; 21.8 inches above normal). Also, colder

2014 CRWD Stormwater Monitoring Report 3
than normal winter temperatures that extended through late March 2014 resulted in a gradual
late-season melt of the snowpack.
For metals, the 2014 average stormflow toxicity of lead exceeded the Minnesota Pollution
Control Agency (MPCA) toxicity standards at all stations, except Villa Park. Yearly copper
toxicity was also exceeded from most monitored subwatersheds in 2014, except St. Anthony
Park, Trout Brook (East Branch, West Branch, and Outlet) and Villa Park. Average stormflow
toxicity of zinc exceeded the MPCA toxicity standard at Hidden Falls, Como 3, and Como 7. For
all sites, average concentrations of cadmium, chromium, and nickel for all flow types (base,
snowmelt, storm, and yearly) did not exceed the MPCA toxicity standards in 2014 (except yearly
cadmium at Hidden Falls).
Bacteria levels during 2014 snowmelt and storm events frequently exceeded the MPCA surface
water maximum numeric standard of 1,260 cfu/100 mL at most monitoring stations. The highest
bacteria count observed was at Hidden Falls in October 2014 with 71,700 cfu/100 mL. Baseflow
bacteria samples typically did not exceed the MPCA surface water maximum numeric standard
in 2014, though bacteria counts above the standard were observed at Hidden Falls, East
Kittsondale, Trout Brook-East Branch, and Trout Brook-West Branch during some baseflow
periods.
CRWD stormwater concentrations and yields were compared to local surface waters for points of
comparison, though it is acknowledged that water flowing in natural stream channels has a
different composition than stormwater. Results showed CRWD stormwater runoff to be
significantly more concentrated in pollutants than the Mississippi River at Lamberts Landing in
Saint Paul in 2014. Also, when compared to other Twin Cities metro-area tributaries (Bassett
Creek, Battle Creek, Fish Creek, and Minnehaha Creek), CRWD subwatersheds generally
produced significantly greater TP and TSS yields in 2014.
The 2014 median stormwater concentrations for nutrients, solids, metals, and bacteria were
compared to other urbanized areas in the United States using data reported in the National
Stormwater Quality Database (NSQD). When comparing to NSQD’s mixed residential land use
category, most CRWD monitored subwatersheds exceeded median stormwater concentrations for
TSS and E. coli.
1.5 2014 RECOMMENDATIONS
Based on the results and findings of the 2014 Stormwater Monitoring Report, CRWD has several
goals and recommendations for 2015 to continue improving the monitoring program and the
water quantity and quality dataset. Specifically, CRWD aims to complete the following in 2015:
CRWD will further explore and implement the many functions of the newly acquired
monitoring database software (Kisters WISKI) in order to improve efficiency, data
organization, data access, data analysis, and automation of data QA/QC.

2014 CRWD Stormwater Monitoring Report 4
CRWD will consider analyzing water quality samples for additional parameters not
currently analyzed, such as: bacteria/microbial source tracking, oil/grease, trash, PAHs,
contaminants of emerging concern.
CRWD will consider expanding remote data access capabilities to other baseline
monitoring station in the District, such as East Kittsondale, Phalen Creek, or St Anthony
Park.
CRWD will develop and implement a CRWD Monitoring Quality Assurance Program
Plan (QAPP) in 2015 to ensure data quality.
CRWD will seek to enhance partnerships with the City of Saint Paul, Ramsey County,
other local urban watershed districts, and research groups (e.g. University of Minnesota)
to broaden our understanding of urban hydrology and pollutant loading.
CRWD will document illicit discharges throughout the watershed and work with District
municipalities to eliminate other potential sources of pollution.

2014 CRWD Stormwater Monitoring Report 5
2 INTRODUCTION
2.1 CRWD BACKGROUND
The watershed boundaries of the Capitol Region Watershed District (CRWD) are located entirely
in Ramsey County, Minnesota. It is a small urban watershed nested in the Upper Mississippi
River basin with all runoff from the watershed eventually discharging to the Mississippi River
along a 13-mile reach in St. Paul, Minnesota through 42 storm tunnel outfall pipes. All surface
water and stormwater runoff in the watershed is managed by CRWD, a special purpose unit of
government founded in 1998 with the goal of managing, protecting, and improving all water
resources within the watershed. CRWD contains portions of five cities, including: Falcon
Heights, Lauderdale, Maplewood, Roseville, and Saint Paul (Figure 2-1). CRWD is highly
developed and urbanized with a population of 245,000 and 42%+ impervious surfaces. Land use
in CRWD is primarily residential and commercial with areas of industrial use and parkland.
2.2 CRWD WATER QUALITY CONCERNS
Over time, urban development and anthropogenic activity in the watershed have significantly
impacted the water quality of the Mississippi River and CRWD lakes, ponds, wetlands, and
streams. The expansion of impervious surfaces (streets, sidewalks, parking lots, roofs) through
development has increased stormwater runoff from the landscape, which carries polluted water
to local water bodies, subsequently declining water quality. Additionally, higher volumes of
runoff causes increased storm peak flows, greater potential for local flooding, decreased
groundwater recharge, and the compromising of biological habitat in water bodies. Stormwater
runoff from impervious surfaces can carry nutrients, sediment, fertilizers, pesticides, bacteria,
heavy metals, and other contaminants of concern, which is why it is the most significant source
of pollution to CRWD water resources. In CRWD, all stormwater runoff within the watershed
boundaries is collected and conveyed through an extensive network of underground storm sewer
pipes that eventually drain to the Mississippi River.
Both historical and current water quality data of CRWD lakes, ponds, and the Mississippi River
indicate that these water bodies are impaired for various pollutants including nutrients, bacteria,
and turbidity and are not meeting the standards for their designated uses of fishing, aquatic
habitat, and recreation. The Mississippi River and Como Lake are listed on the Minnesota
Pollution Control Agency’s (MPCA) 2012 303(d) list of impaired waters (MPCA, 2012a).
Impaired waters require a total maximum daily load (TMDL) study for pollutants of concern
including nutrients, turbidity, metals, bacteria, and chloride.
The nutrient of primary concern in CRWD is phosphorus. Phosphorus is the biological nutrient
which limits the growth of algae in most freshwater ecosystems and is often found in high
concentrations in stormwater. Phosphorus is naturally present in all water bodies, but in high
concentrations can cause the overgrowth of algae and aquatic plants in freshwater lakes and
rivers. This can reduce dissolved oxygen and increase turbidity of the water column. Common

2014 CRWD Stormwater Monitoring Report 6
sources of phosphorous include fertilizers, leaves and grass clippings, pet and wildlife waste,
atmospheric deposition, septic and sanitary seepage, and wastewater treatment plant discharges.
Sediment is another major constituent of stormwater runoff. Excessive amounts of sediment
reduces water clarity, buries benthic aquatic habitat, and damages fish gills. The reduction or
removal of sediment from stormwater is essential because other pollutants, such as phosphorus,
adhere to sediment particles and are transported in suspension. Sediment originates from erosion
of soil particles from construction sites, lawns, stream banks, and lake shores as well as sand
application to roadways and parking lots for traction in the winter.
Heavy metals, such as lead and copper, are also pollutants of concern in CRWD because they
can be toxic in high concentrations. Also, heavy metals can bioaccumulate in organisms, which
is of concern to wildlife and humans. Potential sources of metals from road surface runoff
include roofs, auto exhaust, tire wear, brakes, and some winter de-icing agents.
Pathogens, which include bacteria and viruses, also contribute to the water quality degradation of
CRWD water resources. They impact recreation and pose potential health risks to humans.
Sources of pathogens include illicit sanitary connections to storm drains and animal waste.
Chloride in water bodies is a contaminant of growing concern for CRWD. High concentrations
of chloride can harm fish and plant life by creating a saline environment. Also, once in dissolved
form, chloride cannot be removed from a water body. Chloride is primarily sourced from road
salt application for de-icing in the winter months.
7.3 CRWD MONITORING GOALS
CRWD was formed to understand and address these water quality impacts and to better protect
and manage local water resources. In 2004, CRWD established a monitoring program to assess
water quality and quantity of various District subwatersheds and stormwater best management
practices (BMPs). Prior to the CRWD monitoring program, limited data was available on
stormwater quantity and quality in the watershed. The objectives of the program are to identify
water quality problem areas, quantify subwatershed runoff pollutant loadings, evaluate the
effectiveness of BMPs, provide data for the calibration of hydrologic, hydraulic, and water
quality models, and promote understanding of District water resources and water quality.
CRWD collects water quality and continuous flow data from major subwatersheds, stormwater
ponds, lakes, and stormwater BMPs. There are sixteen major subwatersheds in CRWD and
monitoring is conducted in seven major subwatersheds (Figure 2-1), including: Como, East
Kittsondale, Hidden Falls, McCarrons, Phalen Creek, St. Anthony Park, and Trout Brook. Five
of the major subwatershed sites monitored by CRWD directly outlet to the Mississippi River.
The 2014 CRWD Stormwater Monitoring Report presents results of annual stormwater quantity
and quality data for major CRWD subwatersheds and stormwater ponds. Previous annual
monitoring reports (2005-2013) are available on the CRWD website (www.capitolregionwd.org).
Results and analysis of CRWD lakes and stormwater BMPs are discussed in separate reports
(CRWD, 2015; CRWD, 2012), which are also available on the CRWD website.

2014 CRWD Stormwater Monitoring Report 7
Figure 2-1: Capitol Region Watershed District in Ramsey County, Minnesota.

2014 CRWD Stormwater Monitoring Report 8

2014 CRWD Stormwater Monitoring Report 9
3 METHODS
3.1 MONITORING LOCATIONS
In 2014, CRWD collected water quality and quantity data at eighteen monitoring sites in the
District: twelve full water quality stations, two flow-only stations, and five level logger sites
(Figure 3-1). Additionally, six precipitation gauges collected rainfall data across the watershed.
At each full water quality station, both water quality and quantity data were collected. The
twelve full water quality stations, their locations, and a description of each are detailed in Figure
3-1 and Table 3-1.
Table 3-1: CRWD 2014 full water quality monitoring site list.
Site Name Description
1 East Kittsondale East Kittsondale subwatershed
2 Hidden Falls Hidden Falls subwatershed
3 Phalen Creek Phalen Creek subwatershed
4 St. Anthony Park St. Anthony Park subwatershed
5 Trout Brook-East Branch East Branch of the Trout Brook Storm Sewer Interceptor
6 Trout Brook-West Branch West Branch of the Trout Brook Storm Sewer Interceptor
7 Trout Brook Outlet Outlet of the Trout Brook Storm Sewer Interceptor
8 Villa Park Outlet Lower portion of the Lake McCarrons subwatershed - Villa Park Wetland outlet
9 Como 3 Como 3 subwatershed
10 Como 7 Subsection of Como 7 subwatershed
11 Como Golf Course Pond Subsection of Como 7 subwatershed
12 Sarita Upper portion of St. Anthony Park subwatershed – Sarita Wetland outlet
From Table 3-1, five of the full water quality stations (1, 2, 3, 6, and 11) are positioned at or near
the outlets of subwatersheds which drain directly to the Mississippi River. The remaining seven
full water quality stations are located within five minor subwatersheds which do not drain
directly to the Mississippi River, but are still ultimately connected through downstream
subwatersheds.
Two flow-only stations are operated at the outlets of Como Lake and Lake McCarrons to
determine the total amount of discharge from the lakes into the Trout Brook Storm Sewer
Interceptor. Water level monitoring stations are operated at four storm ponds in the Trout Brook
subwatershed and the data is used to calibrate and update models for the Trout Brook Storm
Sewer Interceptor. The storm ponds monitored are Arlington-Jackson, Sims-Agate,
Westminster-Mississippi, and Willow Reserve (Figure 3-1).
2014 CRWD Stormwater Monitoring Report 10
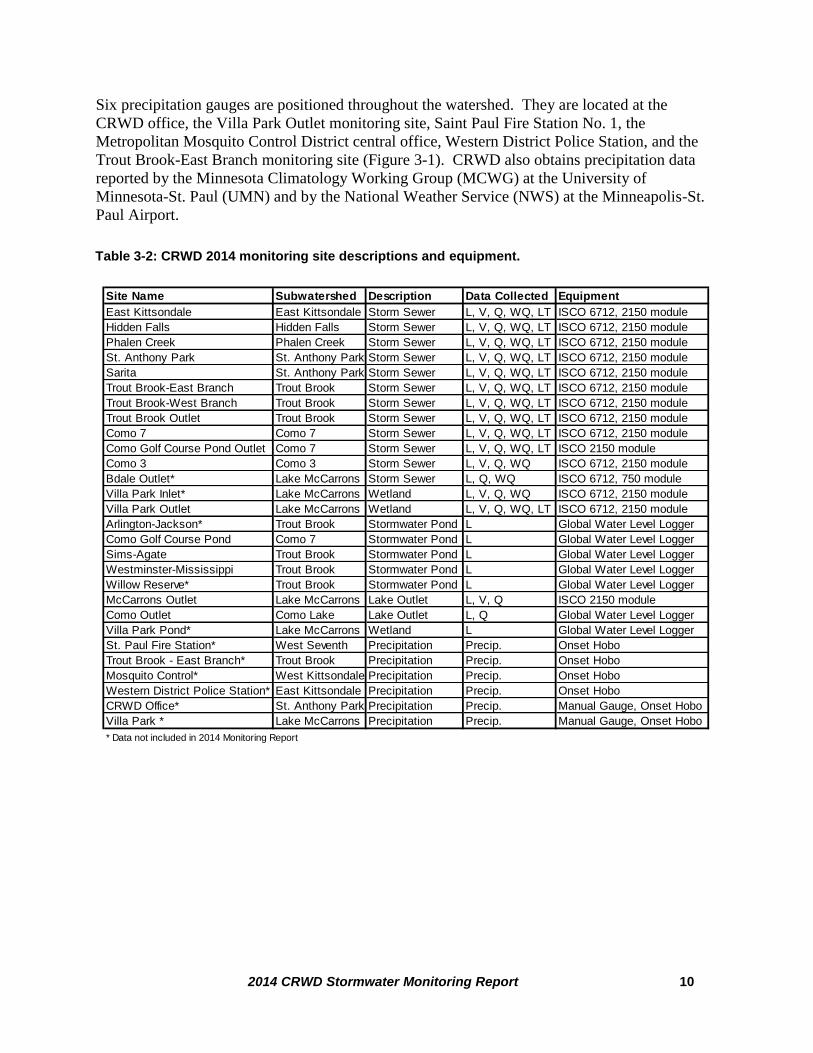
Six precipitation gauges are positioned throughout the watershed. They are located at the
CRWD office, the Villa Park Outlet monitoring site, Saint Paul Fire Station No. 1, the
Metropolitan Mosquito Control District central office, Western District Police Station, and the
Trout Brook-East Branch monitoring site (Figure 3-1). CRWD also obtains precipitation data
reported by the Minnesota Climatology Working Group (MCWG) at the University of
Minnesota-St. Paul (UMN) and by the National Weather Service (NWS) at the Minneapolis-St.
Paul Airport.
Table 3-2: CRWD 2014 monitoring site descriptions and equipment.
Site Name Subwatershed Description Data Collected Equipment
East Kittsondale East Kittsondale Storm Sewer L, V, Q, WQ, LT ISCO 6712, 2150 module
Hidden Falls Hidden Falls Storm Sewer L, V, Q, WQ, LT ISCO 6712, 2150 module
Phalen Creek Phalen Creek Storm Sewer L, V, Q, WQ, LT ISCO 6712, 2150 module
St. Anthony Park St. Anthony Park Storm Sewer L, V, Q, WQ, LT ISCO 6712, 2150 module
Sarita St. Anthony Park Storm Sewer L, V, Q, WQ, LT ISCO 6712, 2150 module
Trout Brook-East Branch Trout Brook Storm Sewer L, V, Q, WQ, LT ISCO 6712, 2150 module
Trout Brook-West Branch Trout Brook Storm Sewer L, V, Q, WQ, LT ISCO 6712, 2150 module
Trout Brook Outlet Trout Brook Storm Sewer L, V, Q, WQ, LT ISCO 6712, 2150 module
Como 7 Como 7 Storm Sewer L, V, Q, WQ, LT ISCO 6712, 2150 module
Como Golf Course Pond Outlet Como 7 Storm Sewer L, V, Q, WQ, LT ISCO 2150 module
Como 3 Como 3 Storm Sewer L, V, Q, WQ ISCO 6712, 2150 module
Bdale Outlet* Lake McCarrons Storm Sewer L, Q, WQ ISCO 6712, 750 module
Villa Park Inlet* Lake McCarrons Wetland L, V, Q, WQ ISCO 6712, 2150 module
Villa Park Outlet Lake McCarrons Wetland L, V, Q, WQ, LT ISCO 6712, 2150 module
Arlington-Jackson* Trout Brook Stormwater Pond L Global Water Level Logger
Como Golf Course Pond Como 7 Stormwater Pond L Global Water Level Logger
Sims-Agate Trout Brook Stormwater Pond L Global Water Level Logger
Westminster-Mississippi Trout Brook Stormwater Pond L Global Water Level Logger
Willow Reserve* Trout Brook Stormwater Pond L Global Water Level Logger
McCarrons Outlet Lake McCarrons Lake Outlet L, V, Q ISCO 2150 module
Como Outlet Como Lake Lake Outlet L, Q Global Water Level Logger
Villa Park Pond* Lake McCarrons Wetland L Global Water Level Logger
St. Paul Fire Station* West Seventh Precipitation Precip. Onset Hobo
Trout Brook - East Branch* Trout Brook Precipitation Precip. Onset Hobo
Mosquito Control* West Kittsondale Precipitation Precip. Onset Hobo
Western District Police Station* East Kittsondale Precipitation Precip. Onset Hobo
CRWD Office* St. Anthony Park Precipitation Precip. Manual Gauge, Onset Hobo
Villa Park * Lake McCarrons Precipitation Precip. Manual Gauge, Onset Hobo
* Data not included in 2014 Monitoring Report

2014 CRWD Stormwater Monitoring Report 11
Figure 3-1: Monitoring locations by station type.

2014 CRWD Stormwater Monitoring Report 12
3.2 MONITORING METHODS AND ANALYSIS
3.2.1 PERIOD OF OPERATION
Six of the full water quality sites (St. Anthony Park, East Kittsondale, Phalen Creek, Trout
Brook-East Branch, Trout Brook-West Branch, and Trout Brook Outlet) were monitored
continuously in 2014 (January 1 through December 31). Each site had a flow logger installed for
the entire calendar year and an automatic sampler installed from April to November. Besides
these six sites, all other full water quality, flow logger, level logger, and precipitation monitoring
sites were generally operational from April to November 2014 (seasonally monitored sites).
Table 3-3 lists the periods of site operation from install to uninstall for 2014.
Table 3-3: Time Periods of site operation for 2014 monitoring stations.
3.2.2 FULL WATER QUALITY STATIONS
East Kittsondale 01/01/2014 00:00 12/31/2014 23:59
Phalen Creek 01/01/2014 00:00 12/31/2014 23:59
St. Anthony Park 01/01/2014 00:00 12/31/2014 23:59
Trout Brook-East Branch 01/01/2014 00:00 12/31/2014 23:59
Trout Brook-West Branch 01/01/2014 00:00 12/31/2014 23:59
Trout Brook Outlet 01/01/2014 00:00 12/31/2014 23:59
Seasonally Monitored Sites
Hidden Falls 04/21/2014 14:15 11/03/2014 15:00
Como 3 04/21/2014 14:30 11/03/2014 09:30
Como 7 04/21/2014 08:44 11/03/2014 09:20
Como Golf Course Pond Outlet 04/18/2014 13:45 10/23/2014 09:10
Sarita 04/21/2014 11:45 11/03/2014 15:45
Villa Park Outlet 04/11/2014 11:15 11/03/2014 10:30
Arlington-Jackson** 05/05/2014 13:24 10/22/2014 09:11
Sims-Agate 05/05/2014 10:08 10/14/2014 18:31
Westminster-Mississippi 05/05/2014 09:16 10/21/2014 14:15
Willow Reserve** 04/15/2014 08:49 10/21/2014 03:13
McCarrons Outlet 04/08/2014 11:00 10/22/2014 10:15
Como Outlet 04/18/2014 10:19 10/23/2014 13:12
* Date/Time indicates period of operation for continuously monitored sites in 2014.
** Equipment malfunction. Data not used for entire 2014 monitoring period.
Continuously Monitored SitesInstall
Date/Time*
Uninstall
Date/Time*

2014 CRWD Stormwater Monitoring Report 13
Full water quality stations in 2014 consisted of an area-velocity sensor and an automated water
sampler. The area-velocity sensors were secured to the base and center of the pipe or channel and
were connected to the automated water sampler housed above ground. Area-velocity sensors
measured and recorded water depth and velocity every 10 or 15 minutes. This data was used to
calculate discharge or volumetric flow of water at the site by relating water depth in the pipe or
channel to area (each pipe or channel has a unique relationship) and multiplying by the velocity
reading.
When the flow of water reached a specified depth or velocity, the sampler engaged to collect
water samples. Generally, samplers were programmed to capture storm events greater than or
equal to the 0.5 inch precipitation event. Two different sampler sizes were used: a compact
sampler and a full-size sampler. A compact sampler can collect up to 48 200 milliliter (mL)
samples (2 per bottle). A full-size sampler can collect 96 200 mL samples (4 per bottle). A
sample was collected after a specified volume of water passed through the site in order to collect
samples over the entire hydrograph. These individual samples were combined and mixed to
produce a single composite sample. This approach provides a better representation of stormwater
quality throughout the entirety of a storm or base flow event as opposed to taking a single grab
sample. To create a composite sample of an event at a given site, the individual sample bottles
were first shaken until the sampled water became homogenous. The sample bottles were then
poured together into a 14-Liter (L) churn sample splitter and thoroughly mixed to create a
homogenous sample. Once mixed, 4 liters of the homogenous sample were distributed to a
sample bottle provided by the Metropolitan Council Environmental Services (MCES)
Laboratory.
Water quality samples were collected during storm events at the ten full water quality sites.
With the exception of Sarita, Como 7, Como 3 and Como Golf Course Pond, monitoring sites
had continuous baseflow during dry weather periods. Composite samples of this dry weather
baseflow were taken at these sites twice a month from April to November and once a month
from December to March.
Bacteria grab samples for Escherichia coli (E. coli) were taken at all full water quality sites
during storm events when runoff was generated. At sites with baseflow, bacteria base grab
samples were collected twice a month during dry weather from March to November and monthly
during the winter. When collected, bacteria grab samples for E. coli were sampled directly into
sterilized containers during storm events and baseflow periods and delivered immediately to the
lab for analyses due to the short sample holding time (6 hours).
Water quality samples were delivered to the Metropolitan Council Environmental Services
(MCES) Laboratory for analysis. The chemical parameters, method of analysis, and holding
times are listed in Table 3-4. If the lab analysis occurred after the holding time of a given
chemical parameter had expired, that chemical parameter was not analyzed.

2014 CRWD Stormwater Monitoring Report 14
3.2.3 FLOW-ONLY AND LEVEL LOGGER STATIONS
The flow-only stations positioned at the outlets of Como Lake and Lake McCarrons use two
different methods to collect and determine discharge data. At the Como Lake outlet, flow is
regulated by a wooden weir in a manhole. A level sensor was placed on the upstream side of the
weir. When the level recorded exceeded the distance between the sensor and the weir, the
structure was discharging. The volume was then calculated based on the dimensions of the weir,
the recorded level, and the periods of recorded outflow. At the Lake McCarrons outlet, an area-
velocity sensor connected to a data logger collected and recorded water depth and velocity every
ten minutes. This data was used to calculate discharge at the site with the known pipe
dimensions.
Level logger stations were operated at four storm ponds within the Trout Brook subwatershed
(Figure 3-1). The data collected at these sites is used to track pond elevation in relation to
precipitation. The data is also used to calibrate the hydrologic and hydraulic model for the Trout
Brook Storm Sewer Interceptor. A pressure transducer was secured at a known depth in the
Table 3-4: Analysis method, reporting limits, and holding times for water chemistry parameters analyzed by Metropolitan Council Environmental Services (MCES).
Parameter Abbreviation Method Reporting Limit Holding Time
Cadmium Cd MET-ICPMSV_5 0.0002 mg/L 180 days
Carbonaceous BOD, 5 day CBOD BOD5_5 0.2 mg/L 48 hours
Chloride Cl CHLORIDE_AA_3 0.5 mg/L 28 days
Chromium Cr MET-ICPMSV_5 0.00008 mg/L 180 days
Copper Cu MET-ICPMSV_5 0.0003 mg/L 180 days
Escherichia Coli E. coli Colilert and Colilert-18 with Quanti-Tray/2000 method N/A 6 hours
Fluoride Fl ANIONS_IC_3 0.02 mg/L 28 days
Hardness Hardness HARD-TITR_3 N/A 28 days
Lead Pb MET-ICPMSV_5 0.0001 mg/L 180 days
Nickel Ni MET-ICPMSV_5 0.0003 mg/L 180 days
Nitrate as N NO3 N-N_AA_4 0.01 mg/L 28 days
Nitrite as N NO2 N-N_AA_4 0.003 mg/L 28 days
Nitrogen, Ammonia NH3 NH3_AA_3 0.005 mg/L 28 days
Nitrogen, Kjeldahl, Total TKN NUT_AA_3 0.03 mg/L 28 days
Orthophosphate as P Ortho-P ORTHO_P_1 0.005 mg/L 48 hours
pH at 25 Degrees C pH pH by electrochemical pH probe N/A N/A
Phosphorus, Dissolved Dissolved P P-AV 0.02 mg/L 28 days
Phosphorus, Total TP NUT_AA_3 0.02 mg/L 28 days
Potassium K MET-ICPMSV_5 .03 mg/L 180 days
Sulfate SO4 SO4-IC 0.15 mg/L 28 days
Surfactants MBAS$ SM 5540 C 0.10 mg/L 48 hours
Total Dissolved Solids TDS TDS180_1 5 mg/L 7 days
Total Suspended Solids TSS TSSVSS_3 N/A 7 days
Volatile Suspended Soilds VSS TSSVSS_3 N/A 7 days
Zinc Zn MET-ICPMSV_5 0.0008 mg/L 180 days

2014 CRWD Stormwater Monitoring Report 15
pond and connected to a data logger which continuously recorded stage every ten minutes. The
logger locations were surveyed relative to a known benchmark in order to convert stage data to a
true elevation.
3.2.4 PRECIPITATION STATIONS
Precipitation was measured using automatic and manual rain gauges (Figure 3-1). The Trout
Brook-East Branch, Saint Paul Fire Station No. 1, Metropolitan Mosquito Control District
central office, Western District Police Station, and Villa Park Outlet precipitation monitoring
sites used automatic tipping bucket rain gauges which record precipitation amounts continuously
during storm events in order to determine rainfall intensity. Manual rain gauges were used at the
CRWD office and Villa Park. The manual rain gauge at the CRWD office was checked and
emptied each workday at 7:30 AM. The manual rain gauge at Villa Park was checked and
emptied after every storm event.
Precipitation data, recorded every 15 minutes at the UMN St. Paul campus, was used to
determine daily, monthly, and annual rainfall amounts for the Capitol Region watershed.
Precipitation data from the NWS at the Minneapolis-St. Paul International Airport was
substituted for any gaps in the UMN data. It is acknowledged that some level of variability exists
spatially and temporally for precipitation events within the District. However, previous
watershed model calibration within the District has shown that the precipitation amount at the
UMN site adequately represents the District as a whole.
3.2.5 MONITORING DATA QUALITY ASSURANCE
Full water quality sites that were installed for the entire year in 2014 collected data for an
average of 356 days. CRWD achieved an average monitoring efficiency of 98% at the
continuously monitored full water quality sites in 2014, meaning that 98% of all potential data
was collected during the calendar year (Appendix B). Missing data accounted for the remaining
2% and was due to equipment failure, power failure, flooding, or vandalism. Monitoring at Villa
Park, Sarita, and Hidden Falls was 100% efficient during the periods they were installed from
April to November 2014. The level logger site at Sims-Agate and the Como Outlet flow-only
site were also 100% efficient. The Westminster-Mississippi level logger and McCarrons Outlet
flow logger were 97% and 95% efficient respectively. Due to equipment malfunction, the entire
2014 record of data for Willow Reserve and Arlington-Jackson was determined to be unusable.
After the 2014 monitoring season was complete, flow data was quality checked and corrected by
removing points with missing data or bad values and interpolating their values between good
data points. If there were extended periods of missing or bad data in which there were no storm
events, an average baseflow level and velocity were calculated and substituted. For storm events
where velocity did not log accurately, but level was still logged, a stage to velocity relationship
was developed using level and velocity data from good periods of stormflow record. The
relationship was then used to calculate an approximation of velocity for those periods of missing
data. If this was not possible, or there were storm events during this time, the data was left as
missing and not factored into discharge calculations.

2014 CRWD Stormwater Monitoring Report 16
The 2014 water quality sample data reported by the MCES lab was also rigorously checked for
quality. The reported sample times and dates were compared with field notes as well as the lab
chain of custody forms. Any abnormally high or low sample values were denoted and cross-
checked with field notes to ensure the parameter value was commensurate with the conditions of
the day in which the sample was taken. Sample concentration results that were outside of the
average range of data were identified as outliers and removed from event load calculations.
3.2.6 TOTAL DISCHARGE AND POLLUTANT LOAD CALCULATIONS
For all full water quality monitoring stations, the stage, velocity, and water quality data collected
were used to calculate total discharge and pollutant loads for total phosphorus (TP) and total
suspended solids (TSS). Discharge and pollutant loads were calculated for each storm,
snowmelt, and illicit discharge event at all stations. For sites with baseflow, monthly TP and TSS
loads were calculated. At the stations monitored continuously, the totals represent annual
discharges and loads. At Como 7, Como 3, Hidden Falls, Sarita, and Villa Park, monitoring
equipment cannot be operated during the winter months because equipment failure or damage
can occur from freezing temperatures and ice. The 2014 reported discharge and loads for these
stations are only representative of April through November.
Total discharge and pollutant loads for the Como 7 Subwatershed include combined data from
the Como 7 monitoring site and the outlet for the Como Golf Course Pond. The outflow from
the pond discharges into a storm sewer just downstream of the Como 7 monitoring station.
Analysis of the combined Como 7 and Como Golf Course Pond site data was done in the same
manner as all other full water quality monitoring stations.
For Villa Park, total discharge and pollutant loads also include any discharge flowing through the
emergency overflow near the outlet of the wetland system. Discharge was quantified by placing
a level logger near the weir outlet structure that recorded the duration of an overflow period.
In 2014, total discharge and pollutant load calculations for all stations were performed in Kisters
WISKI (Version 7.4.1) software (referred to as WISKI from here on). WISKI is a database
software specifically designed for continuous and discrete water quality data. WISKI was
implemented in 2014 by CRWD and will be utilized in to the future for all stormwater data
storage and analysis.
Flow Partitioning and Discharge Calculation
The 2014 final flow data for each station was separated into base, storm, snowmelt, and illicit
discharge. For sites without sustained baseflow, all events corresponding to a precipitation event
were considered storm, snowmelt, or illicit discharge intervals. For sites with year-round
baseflow, separation of event flow and baseflow was necessary. Storm events were identified
using an automated script in WISKI, which took into account the rate of change in the
hydrograph and a threshold above baseflow in the preceding period. Baseflow was considered
continuous (but not constant) during storm events. Baseflow was estimated during a storm event
by interpolating between the discharge at the beginning and end of the storm event interval. The
baseflow amount calculated during the storm event was subtracted from the total storm event
discharge to determine the storm event discharge volume.

2014 CRWD Stormwater Monitoring Report 17
To identify snowmelt events, peaks that occurred during winter and early-spring months were
cross-referenced with snowpack data from the National Weather Service (NWS). A peak was
determined to be a snowmelt interval if a snowpack depth was recorded by the NWS the day of
the peak and no precipitation was recorded. If precipitation occurred on the same day as a peak
and a snowpack depth was recorded, the event was also classified as snowmelt. If precipitation
(including snow) occurred on the same day as a peak, but no snowpack was recorded, the event
was classified as a storm event.
An event was considered a potential illicit discharge if elevated flow was observed in the
discharge data that did not correspond to precipitation, snowmelt, or any other known
climatological or permitted discharging event. Illicit discharge volumes are generally
significantly lower than snowmelt or stormflow and are not identified by the automated script.
As a result, illicit discharge events were manually identified.
The total discharge for each interval was calculated using WISKI to integrate the flow rate data
for baseflow and events. Discharge volumes were summed to calculate a total discharge for the
2014 monitoring period. Discharge subtotals were also calculated by flow type (base, storm,
snowmelt, illicit discharge) for the monitoring period.
The 2014 method of baseflow and event separation is different from methods used in previous
years. The 2014 method was not used to recalculate baseflow and event parameters for
historically collected flow data at all sites. Due to the differing calculation method, 2014 storm,
snowmelt and baseflow loads and discharge volumes cannot be directly compared to previous
years. However, total annual loads and discharges are unaffected by the new methodology.
Event Load Calculation
The TP and TSS concentrations (reported by the MCES lab) were used to calculate TP and TSS
loads for each sampled event. A median historical monthly concentration was applied to events
for which samples were not collected. The median concentration was calculated using the
median of all samples collected for a given monitoring station by month and by event type (i.e.
base, storm, snowmelt, or illicit discharge) for the entire monitoring record. The median
concentration values used for the 2014 load calculations are listed in Appendix C.
TP and TSS loads were calculated for each event using the following equation:
𝐸𝑣𝑒𝑛𝑡 𝑙𝑜𝑎𝑑 (𝑙𝑏𝑠) = 𝐸𝑣𝑒𝑛𝑡 𝐷𝑖𝑠𝑐ℎ𝑎𝑟𝑔𝑒 (𝑐𝑓) ∗ 𝐸𝑀𝐶𝑠(𝑚𝑔/𝐿) ∗ (28.316 𝐿
1 𝑐𝑓) ∗ (
1𝑙𝑏
453,592𝑚𝑔)
The event mean concentration (EMCs) was calculated using the following equation:
𝐸𝑀𝐶𝑠 =[𝐸𝑀𝐶𝑡𝑜𝑡 − (𝐶𝑏 ∗ 𝑓𝑏)]
𝑓𝑠
2014 CRWD Stormwater Monitoring Report 18
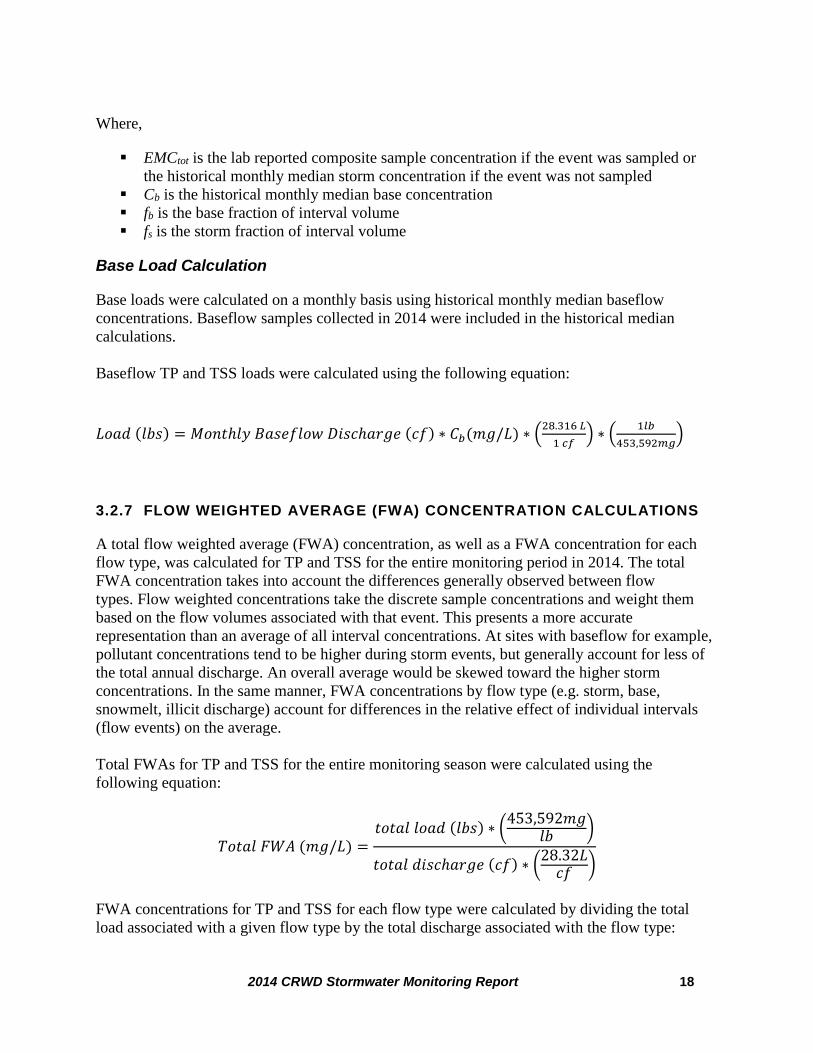
Where,
EMCtot is the lab reported composite sample concentration if the event was sampled or
the historical monthly median storm concentration if the event was not sampled
Cb is the historical monthly median base concentration
fb is the base fraction of interval volume
fs is the storm fraction of interval volume
Base Load Calculation
Base loads were calculated on a monthly basis using historical monthly median baseflow
concentrations. Baseflow samples collected in 2014 were included in the historical median
calculations.
Baseflow TP and TSS loads were calculated using the following equation:
𝐿𝑜𝑎𝑑 (𝑙𝑏𝑠) = 𝑀𝑜𝑛𝑡ℎ𝑙𝑦 𝐵𝑎𝑠𝑒𝑓𝑙𝑜𝑤 𝐷𝑖𝑠𝑐ℎ𝑎𝑟𝑔𝑒 (𝑐𝑓) ∗ 𝐶𝑏(𝑚𝑔/𝐿) ∗ (28.316 𝐿
1 𝑐𝑓) ∗ (
1𝑙𝑏
453,592𝑚𝑔)
3.2.7 FLOW WEIGHTED AVERAGE (FWA) CONCENTRATION CALCULATIONS
A total flow weighted average (FWA) concentration, as well as a FWA concentration for each
flow type, was calculated for TP and TSS for the entire monitoring period in 2014. The total
FWA concentration takes into account the differences generally observed between flow
types. Flow weighted concentrations take the discrete sample concentrations and weight them
based on the flow volumes associated with that event. This presents a more accurate
representation than an average of all interval concentrations. At sites with baseflow for example,
pollutant concentrations tend to be higher during storm events, but generally account for less of
the total annual discharge. An overall average would be skewed toward the higher storm
concentrations. In the same manner, FWA concentrations by flow type (e.g. storm, base,
snowmelt, illicit discharge) account for differences in the relative effect of individual intervals
(flow events) on the average.
Total FWAs for TP and TSS for the entire monitoring season were calculated using the
following equation:
𝑇𝑜𝑡𝑎𝑙 𝐹𝑊𝐴 (𝑚𝑔/𝐿) =𝑡𝑜𝑡𝑎𝑙 𝑙𝑜𝑎𝑑 (𝑙𝑏𝑠) ∗ (
453,592𝑚𝑔𝑙𝑏
)
𝑡𝑜𝑡𝑎𝑙 𝑑𝑖𝑠𝑐ℎ𝑎𝑟𝑔𝑒 (𝑐𝑓) ∗ (28.32𝐿
𝑐𝑓)
FWA concentrations for TP and TSS for each flow type were calculated by dividing the total
load associated with a given flow type by the total discharge associated with the flow type:

2014 CRWD Stormwater Monitoring Report 19
𝐹𝑙𝑜𝑤 𝑇𝑦𝑝𝑒 𝐹𝑊𝐴 (𝑚𝑔/𝐿) =∑𝑒𝑣𝑒𝑛𝑡 𝑙𝑜𝑎𝑑𝑠 (𝑙𝑏𝑠) ∗ (
453,592𝑚𝑔𝑙𝑏
)
𝑠𝑢𝑏𝑡𝑜𝑡𝑎𝑙 𝑑𝑖𝑠𝑐ℎ𝑎𝑟𝑔𝑒 (𝑐𝑓) ∗ (28.32𝐿
𝑐𝑓)
3.2.8 POLLUTANT YIELD
Annual yields for TP and TSS in pounds per acre (lb/ac) were calculated for each monitored
subwatershed in order to normalize pollutant load by subwatershed drainage area size so
comparisons between all CRWD subwatersheds could be made. Annual yields are calculated
using the following equation:
𝑌𝑖𝑒𝑙𝑑 (lbs/ac) =𝑡𝑜𝑡𝑎𝑙 𝑙𝑜𝑎𝑑 (𝑙𝑏𝑠)
𝑑𝑟𝑎𝑖𝑛𝑎𝑔𝑒 𝑎𝑟𝑒𝑎 (𝑎𝑐)
3.2.9 CUMULATIVE LOAD
Cumulative plots for total discharge were developed for each site. Cumulative discharge plots are
useful for showing the rate and temporal distribution of discharge accumulation throughout the
course of the monitoring season. Each point along the curve represents the accumulated
discharge from the beginning of the period up to that point in time.
3.2.10 METAL TOXICITY
The toxicity of a metal is a function of water hardness. For CRWD watersheds, the chronic
toxicity standard is used, as defined in Minnesota Rules 7050.0222 for each of the 6 metals (Cr,
Cd, Cu, Pb, Ni, and Zn). Equations for the chronic standard for each metal in g/L are listed in
Appendix A. Average 2014 metal concentrations from storm flow, baseflow, snowmelt, illicit
discharge, and total flow were compared to the chronic standard.
3.2.11 FEDERAL AND STATE SURFACE WATER QUALITY STANDARDS COMPARISON
Currently, there are no federal or state water quality standards for stormwater. The Minnesota
Pollution Control Agency (MPCA) and the U.S. Environmental Protection Agency (EPA) have
established surface water quality standards for only certain water quality parameters.
Regardless, CRWD’s stormwater flows into the Mississippi River, so it is useful to compare the
stormwater data to surface water quality standards which serve as a benchmark to consider for
each pollutant (Table 3-5).
TP and TSS Standards

2014 CRWD Stormwater Monitoring Report 20
Because the MPCA has not established stormwater standards for TSS and TP, the data was
compared to the TP and TSS values of Lambert’s Landing, a Mississippi River water quality
monitoring station downstream of the Wabasha Bridge in St. Paul at river mile 839.1.
Additionally, the TSS values were compared against the South Metro Mississippi Total
Suspended Solids TMDL, and the TP values were compared against the Lake Pepin Excess
Nutrient TMDL. When comparing CRWD TP and TSS concentrations to water quality
standards, flow-weighted average concentrations were used.
Chronic Metals Standards
State water quality standards for chronic exposure to metals are based on a function of hardness
as outlined in Minnesota Statute 7050.0222 for Class 2B waters (ORS, 2012). Class 2B waters
are waters used for the purpose of aquatic life and recreation that are not protected for drinking
water. These standards are set at the lowest concentration of a chemical for which chronic
exposure will cause harm to aquatic organisms. In order to make comparisons between CRWD
metals data to state standards and other reference locations, calculation of the state standards was
completed.
Bacteria Standard
For E. coli bacteria, the MPCA has set the following two provisions as a standard:
1. With greater than five samples taken in a calendar month (April to November), the E. coli
concentration geometric mean shall be less than 126 cfu/100mL.
2. No more than ten percent of all samples taken during a calendar month (April to
November) shall exceed 1,260 cfu/100mL
CRWD collects a limited number of E. coli samples each month from April to November (two
base samples and occasional storm samples), so the MPCA monitoring requirements of the E.
coli geometric mean standard of 126 cfu/100mL cannot be typically met. Instead, CRWD
compares individual E. coli monitoring results to the maximum value of the standard, 1,260
cfu/100mL. This comparison provides a benchmark only for comparing CRWD bacteria data
and does not imply whether or not the full bacteria standard is being met. The MCES lab
measures E. coli as the most probable number per 100 milliliters of water (mpn/100mL).
Research shows that mpn/100mL is comparable to cfu/100mL (Massa et al., 2001).

2014 CRWD Stormwater Monitoring Report 21
3.2.12 MISSISSIPPI RIVER REFERENCE SITE AND TWIN CITIES METRO-AREA TRIBUTARIES COMPARISONS
In addition to comparing CRWD results to state surface water quality standards, CRWD total TP
and TSS FWA concentrations were compared to the average TP and TSS concentrations of the
Mississippi River at Lambert’s Landing. MCES monitors the Mississippi River at Lambert’s
Landing at river mile 839.1, which is downstream from the Wabasha Street Bridge in St. Paul.
MCES also monitors the mouths of several tributaries in the Minneapolis/St. Paul metropolitan
area, including Bassett Creek, Battle Creek, Fish Creek and Minnehaha Creeks. These are all
open channels that discharge to the Mississippi River. Total TP and TSS yields for CRWD
subwatershed outlet sites (East Kittsondale, Hidden Falls, Phalen Creek, St. Anthony Park, and
Trout Brook Outlet) were compared to the yields of these other metro-area tributaries to
determine the relative impacts to the Mississippi River.
3.2.13 NATIONAL URBAN STORMWATER QUALITY COMPARISONS
Researchers from the University of Alabama and the Center for Watershed Protection have
created an extensive database of stormwater data from urbanized areas by assembling and
evaluating stormwater monitoring data from a representative number of National Pollutant
Discharge Elimination System (NPDES) Municipal Separate Storm Sewer System (MS4) Phase
Table 3-5: Surface water quality standards for Class 2B waters.
Parameter Standarda Units Water Body Source
Cl 230 mg/L Surface Minn. Stat. § 7050.0222
Cd * mg/L Surface Minn. Stat. § 7050.0222
Cr * mg/L Surface Minn. Stat. § 7050.0222
Cu * mg/L Surface Minn. Stat. § 7050.0222
E. coli ≤ 1,260 MPN/100 mL Surface Minn. Stat. § 7050.0222
NH3 40 µg/L Surface Minn. Stat. § 7050.0222
Ni * mg/L Surface Minn. Stat. § 7050.0222
Pb * mg/L Surface Minn. Stat. § 7050.0222
TP 60 µg/L Surface Minn. Stat. § 7050.0222
TSS 30b mg/L Stream Minn. Stat. § 7050.0222
Zn * mg/L Surface Minn. Stat. § 7050.0222
*The standard is dependent upon w ater hardness; See Appendix B
a Standards apply to Class 2B w aters in the North Central Hardw ood Forest ecoregion. Class 2B
w aters are designated for aquatic life and recreational use. All standard concentrations apply to
chronic exposure.b Standard applies to Class 2B w aters in the Central River Nutrient Region. The standard may be
exceeded no more than 10 percent of the time and applies April 1 through September 30.

2014 CRWD Stormwater Monitoring Report 22
I stormwater permit holders. The goals of the National Stormwater Quality Database (NSQD)
are to describe the characteristics of national stormwater quality, to provide guidance for future
sampling needs, and to enhance local stormwater management activities in areas having limited
data.
NSQD (Version 3) includes stormwater quality data from 8,602 storm events from 104
municipalities, including a number in Minnesota (Pitt et al., 2008). The NSQD (Version 3) was
extensively reviewed for quality assurance and control and statistical analyses were performed to
characterize and understand the pollutant data.
Although the NSQD (Version 3) includes only a small set of data from the midwest and
northeast portions of the country, which have similar climatic conditions, it still provides a useful
comparison of how polluted stormwater in CRWD is compared to the rest of the country. The
database includes stormwater quality data for various land use types. The predominant land uses
in CRWD are mixed residential, commercial, and industrial with 42% of the land comprised of
impervious surfaces. CRWD’s stormwater quality data was compared to the NSQD’s mixed
residential land use category, which has a median impervious percentage of 34%. Table 3-6
presents the NSQD median data values for the mixed-residential land use category.
Table 3-6: NSQD stormwater pollutant median concentrations - mixed residential land use
ParameterMedian
Value
Area (acres) 103
% Impervious 34
Precipitation Depth (in.) 0.595
Escherichia coli (mpn/100mL) 1,155
Total Suspended Solids (mg/L) 76
Total Phosphorous (mg/L) 0.31
Ammonia (mg/L) 0.415
Nitrate+Nitrite (mg/L) 0.63
Total Kjeldahl Nitrogen (mg/L) 1.4
Cadmium (mg/L) 0.0008
Chromium (mg/L) 0.007
Copper (mg/L) 0.02
Lead (mg/L) 0.019
Nickel (mg/L) 0.006
Zinc (mg/L) 0.0985

2014 CRWD Stormwater Monitoring Report 23
4 CLIMATOLOGICAL SUMMARY
4.1 PRECIPITATION DATA COLLECTION METHODS
CRWD utilizes climatological data collected by the Minnesota Climatology Working Group
(MCWG) at the University of Minnesota-St. Paul and National Weather Service (NWS) at the
Minneapolis-St. Paul International Airport (MSP) to assist in calculating annual precipitation,
runoff, and loading.
MCWG records precipitation every fifteen minutes from an automatic rain gauge located
approximately two miles west of the CRWD office. The data is reported on a public website
(http://climate.umn.edu/). Rainfall totals (15-minute and daily) were recorded by CRWD from
the MCWG website (MCWG, 2015b). Snow and ice totals were not accurately reported by
MCWG due to equipment limitations, so NWS snow and ice totals were used instead. The
MCWG rain gauge was used as CRWD’s primary precipitation monitoring station for rainfall
because of the gauge’s close proximity to the District.
The NWS weather station at MSP, located approximately ten miles south of the CRWD office,
records many climate variables for each day, including: maximum, minimum, and average
temperature; rainfall; snowfall and snow water equivalent; and depth of snowpack. Data is
reported on a public website (http://www.weather.gov/mpx/mspclimate). If a snow or ice event
occurred, the NWS daily precipitation totals were utilized by CRWD since their measurement
equipment more accurately measures snow-water and ice-water equivalents than the MCWG
gauge.
4.2 2014 PRECIPITATION RESULTS
Table 4-1 lists 2014 daily precipitation totals, 2014 monthly precipitation totals, the 30-year
monthly normal (1981-2010) (NOAA, 2015a), and the 2014 departure from historical monthly
normals. Monthly totals are compared to the 30-year monthly normals at MSP (Table 4-1 and 4-
2; Figure 4-1).
In 2014, almost all precipitation data from January to April and November was provided by
NWS because the events during this time period were either snow or ice (Table 4-2). The May
through October precipitation data, as well as the majority of the December data, was provided
by MCWG since it was primarily rainfall that occurred.
The 2005-2014 CRWD annual precipitation data was compared to the NWS 30-year normal for
the Minneapolis-St. Paul region (Table 4-1; Figure 4-3). The NWS 30-year normal is
recalculated every 10 years. In 2010, the NWS 30-year normal was recalculated for 1981-2010 to
be 30.61 inches (formerly 29.41 inches (1971-2000)).

2014 CRWD Stormwater Monitoring Report 24
The total amount of precipitation recorded in CRWD in 2014 was 35.66 inches, which was 5.05
inches above NWS the 30-year normal (Table 4-1 and 4-2; Figure 4-3). This was also the fourth
wettest year since monitoring began in CRWD in 2005. Figure 4-2 is a cumulative precipitation
plot for 2014 which shows the total accumulated amount of precipitation throughout the entire
year as well as fluctuations in precipitation trends and significant precipitation events. In general,
precipitation throughout 2014 was inconsistent with extremely wet months followed by very dry
months.
Table 4-1: CRWD annual precipitation totals and departure from the NWS 30-year normal.
From January to March 2014, snowfall was a major source of precipitation which contributed to
a significant amount of spring recharge and runoff. In total, 76.2 inches of snow fell during the
winter of 2014, which was 21.8 inches greater than the 30-year normal (Table 4-4; Figure 4-4).
June 2014 was the wettest June and wettest month overall in Minnesota’s modern record (DNR,
2015d) with 9.1 inches occurring, which was 4.85 inches above the 30-year normal (Table 4-2;
Figure 4-1 and 4-2). Along with a wet June, April and May 2014 were also particularly wet with
both months being well-above the monthly normals (Figure 4-1). Cumulatively, the wet spring
months of April, May, and June represented 57% of the total annual precipitation that occurred
in 2014.
In contrast, July and August were dry with both months recording below normal precipitation
(Figure 4-1 and 4-2). Fall 2014 was also dry, with September and October 2014 being
significantly below the 30-year normal.
YearPrecipitation
(inches)a
Departure from
NWS Normal
2005 35.98 (+) 5.37"
2006 31.69 (+) 1.08"
2007 29.72 (-) 0.89"
2008 21.67 (-) 8.94"
2009 23.34 (-) 7.27"
2010 36.32 (+) 5.71"
2011 33.62 (+) 3.01"
2012 30.26 (-) 0.35"
2013 36.36 (+) 5.75"
2014 35.66 (+) 5.05"
NWS 30-Year
Normal30.61 --
a Annual precipitation reported by the Minnesota Climatology Working Group (MCWG)
and National Weather Service (NWS)
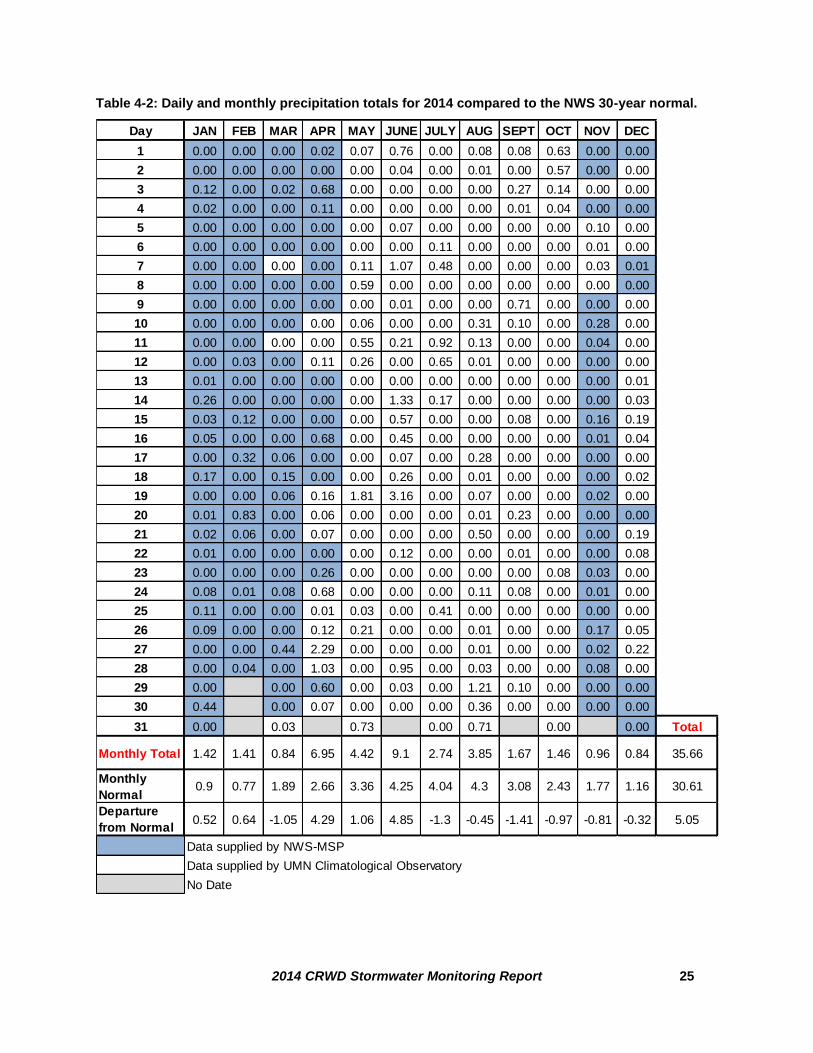
2014 CRWD Stormwater Monitoring Report 25
Table 4-2: Daily and monthly precipitation totals for 2014 compared to the NWS 30-year normal.
Day JAN FEB MAR APR MAY JUNE JULY AUG SEPT OCT NOV DEC
1 0.00 0.00 0.00 0.02 0.07 0.76 0.00 0.08 0.08 0.63 0.00 0.00
2 0.00 0.00 0.00 0.00 0.00 0.04 0.00 0.01 0.00 0.57 0.00 0.00
3 0.12 0.00 0.02 0.68 0.00 0.00 0.00 0.00 0.27 0.14 0.00 0.00
4 0.02 0.00 0.00 0.11 0.00 0.00 0.00 0.00 0.01 0.04 0.00 0.00
5 0.00 0.00 0.00 0.00 0.00 0.07 0.00 0.00 0.00 0.00 0.10 0.00
6 0.00 0.00 0.00 0.00 0.00 0.00 0.11 0.00 0.00 0.00 0.01 0.00
7 0.00 0.00 0.00 0.00 0.11 1.07 0.48 0.00 0.00 0.00 0.03 0.01
8 0.00 0.00 0.00 0.00 0.59 0.00 0.00 0.00 0.00 0.00 0.00 0.00
9 0.00 0.00 0.00 0.00 0.00 0.01 0.00 0.00 0.71 0.00 0.00 0.00
10 0.00 0.00 0.00 0.00 0.06 0.00 0.00 0.31 0.10 0.00 0.28 0.00
11 0.00 0.00 0.00 0.00 0.55 0.21 0.92 0.13 0.00 0.00 0.04 0.00
12 0.00 0.03 0.00 0.11 0.26 0.00 0.65 0.01 0.00 0.00 0.00 0.00
13 0.01 0.00 0.00 0.00 0.00 0.00 0.00 0.00 0.00 0.00 0.00 0.01
14 0.26 0.00 0.00 0.00 0.00 1.33 0.17 0.00 0.00 0.00 0.00 0.03
15 0.03 0.12 0.00 0.00 0.00 0.57 0.00 0.00 0.08 0.00 0.16 0.19
16 0.05 0.00 0.00 0.68 0.00 0.45 0.00 0.00 0.00 0.00 0.01 0.04
17 0.00 0.32 0.06 0.00 0.00 0.07 0.00 0.28 0.00 0.00 0.00 0.00
18 0.17 0.00 0.15 0.00 0.00 0.26 0.00 0.01 0.00 0.00 0.00 0.02
19 0.00 0.00 0.06 0.16 1.81 3.16 0.00 0.07 0.00 0.00 0.02 0.00
20 0.01 0.83 0.00 0.06 0.00 0.00 0.00 0.01 0.23 0.00 0.00 0.00
21 0.02 0.06 0.00 0.07 0.00 0.00 0.00 0.50 0.00 0.00 0.00 0.19
22 0.01 0.00 0.00 0.00 0.00 0.12 0.00 0.00 0.01 0.00 0.00 0.08
23 0.00 0.00 0.00 0.26 0.00 0.00 0.00 0.00 0.00 0.08 0.03 0.00
24 0.08 0.01 0.08 0.68 0.00 0.00 0.00 0.11 0.08 0.00 0.01 0.00
25 0.11 0.00 0.00 0.01 0.03 0.00 0.41 0.00 0.00 0.00 0.00 0.00
26 0.09 0.00 0.00 0.12 0.21 0.00 0.00 0.01 0.00 0.00 0.17 0.05
27 0.00 0.00 0.44 2.29 0.00 0.00 0.00 0.01 0.00 0.00 0.02 0.22
28 0.00 0.04 0.00 1.03 0.00 0.95 0.00 0.03 0.00 0.00 0.08 0.00
29 0.00 0.00 0.60 0.00 0.03 0.00 1.21 0.10 0.00 0.00 0.00
30 0.44 0.00 0.07 0.00 0.00 0.00 0.36 0.00 0.00 0.00 0.00
31 0.00 0.03 0.73 0.00 0.71 0.00 0.00 Total
Monthly Total 1.42 1.41 0.84 6.95 4.42 9.1 2.74 3.85 1.67 1.46 0.96 0.84 35.66
Monthly
Normal0.9 0.77 1.89 2.66 3.36 4.25 4.04 4.3 3.08 2.43 1.77 1.16 30.61
Departure
from Normal0.52 0.64 -1.05 4.29 1.06 4.85 -1.3 -0.45 -1.41 -0.97 -0.81 -0.32 5.05
Data supplied by NWS-MSP
Data supplied by UMN Climatological Observatory
No Date

2014 CRWD Stormwater Monitoring Report 26
Figure 4-1: 30-year normal and 2014 monthly precipitation totals for CRWD.
0
1
2
3
4
5
6
7
8
9
10
JAN FEB MAR APR MAY JUNE JULY AUG SEPT OCT NOV DEC
Pre
cip
ita
tio
n (
inc
he
s)
Month
30-Year Normal Monthly Precipitation Totals
CRWD 2014 Monthly Precipitation Totals

2014 CRWD Stormwater Monitoring Report 27
Figure 4-2: Daily precipitation totals and cumulative precipitation for January to December 2014.
0
5
10
15
20
25
30
35
40
0
0.5
1
1.5
2
2.5
3
3.5
Cu
mu
lati
ve P
recip
itati
on
(in
ch
es)
Daily P
recip
itati
on
(in
ch
es)
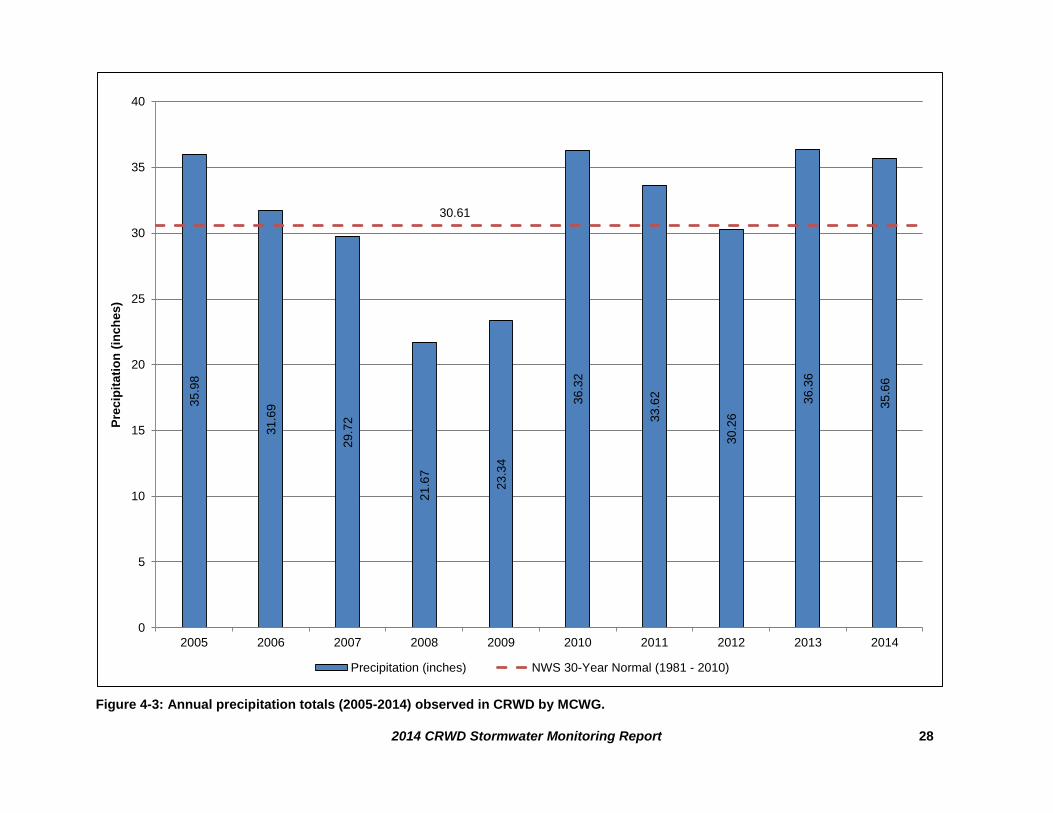
2014 CRWD Stormwater Monitoring Report 28
Figure 4-3: Annual precipitation totals (2005-2014) observed in CRWD by MCWG.
35.9
8
31.6
9
29.7
2
21.6
7
23.3
4
36.3
2
33.6
2
30.2
6
36.3
6
35.6
6
1 2 3 4 5 6 7 8 9 10
0
5
10
15
20
25
30
35
40
2005 2006 2007 2008 2009 2010 2011 2012 2013 2014
Pre
cip
itati
on
(in
ch
es)
Precipitation (inches) NWS 30-Year Normal (1981 - 2010)
30.61

2014 CRWD Stormwater Monitoring Report 29
4.3 2014 NOTABLE CLIMATOLOGICAL EVENTS
In 2014, climatic patterns were unique by fluctuating between extreme wet and dry periods with
several high intensity, short duration precipitation events. Also, 2014 was unique in that the
winter was extraordinarily cold with deep snow and a very late spring start.
Table 4-3 shows the most intense rain events in 15-minute, 1-, 6-, and 24-hour intervals during
2014. The most intense precipitation event occurred on June 19, 2014, which recorded the most
intense 15-minute, 1-, 6-, and 24-hour intervals for the entire year (Table 4-3). It was also the
highest daily total for June ever recorded at MSP Airport (NOAA, 2015b). During this event,
3.16 inches fell in 24 hours, with three 15-minute intervals recording over a quarter-inch of rain.
There were also a few other notable events in 2014, including a 2.4 inch in 24-hour event on
April 27, a 1.78 inch in 6-hour event on May 19, and a 0.81 inch in 1-hour event on August 29
(Table 4-3).
Table 4-3: Rainfall intensity statistics for 2014 from MCWG rain gauge data.
Snowpack in CRWD was also a significant climatic variable in 2014. The 2014 snowfall total of
76.2 inches measured at MSP was 21.8 inches higher than the 30-year normal of 54.5 inches
(Table 4-4). The last date with a 1 inch snowpack measured at MSP was April 5 (NWS, 2015)
(Figure 4-4). This was only 5 days later than the normal date of March 31 (DNR, 2015b).
Daily snowpack depths recorded at MSP were plotted against daily high temperature in Figure
4-4 (NWS, 2015). A complete melt was observed from March 27 to March 30 (2 inches to 0
inches). There was a brief two-day period of snowpack recorded again from April 4 to April 6
(resulting from a storm that dropped 5 inches on April 3 and 1.5 inches on April 4), before
melting away permanently for the spring. Snowpack reached a maximum depth of 24 inches on
February 21, and stayed deeper than 15 inches until March 11 when the temperature began
Time Period Date & Event End Time Amount (in)
6/19/14 8:15 0.39
6/19/14 3:15 0.39
6/19/14 3:30 0.38
6/19/14 3:30 1.18
8/29/14 16:45 0.81
6/7/14 7:45 0.78
6/19/14 8:30 2.43
5/19/14 15:00 1.78
6/15/14 1:00 1.33
6/19/14 19:30 3.16
4/27/14 18:15 2.4
6/15/14 8:45 1.88
24-Hour
Rainfall Intensity
15-minute
1-hour
6-Hour

2014 CRWD Stormwater Monitoring Report 30
warming. Significant snowfall events occurred on February 20 (8.4 inches), January 20 (6.4
inches), and April 3 (5 inches). The February 20 storm event was unique in that a
“thundersnow” occurred, in which thunder accompanied the snowfall during this storm event.
Snowmelt is a significant driver of hydrology in late winter and early spring and is dependent
upon many factors such as the amount of snowpack and temperature. Snowpack levels stayed
consistently high as a result of multiple significant snowfall events early on in the season, as well
as record-low temperatures that did not cause significant melt events to occur. Therefore, there
was a lot of snow present to impact snowmelt and runoff in the spring.
Table 4-4: Summary of 2014 climatological events.
Another unique climatic pattern in 2014 was extreme cold temperatures that occurred from
January to March 2014. The jet stream swung down from the Arctic and positioned itself over
Minnesota for much of January, February, and March with periods of daily high temperatures not
exceeding 0 degrees (Figure 4-4). This cold phenomenon was referred to as the “Polar Vortex”.
Due to extraordinarily cold winter and spring temperatures, ice out on CRWD lakes occurred
generally two weeks later than normal in 2014. Historical median ice out dates have not been
established for any of the five CRWD lakes, nor were any observations made by CRWD on the
lakes in 2014 (DNR, 2015a; DNR, 2015c). However, the DNR has collected annual and
historical median ice out dates for lakes nearby CRWD, including the five observed in Table 4-5.
Table 4-5: Summary of ice out dates for Twin Cities lakes nearby CRWD (DNR, 2015a; DNR, 2015c).
Variable 2014 Average Notes
Total Precipitation (inches) 35.66 30.61 5.05" higher than 30-yr normal
Total Snow (inches) 76.2 54.4 21.8" higher than 30-yr normal
Last Significant Snowfall 4/4 (1.5") N/A Variable - No data on averages
Last Spring date with greater than 1" snowpack 4/5 (4") 4/2 3 days later than normal
Spring Ice Out 4/18 4/5 13 days later than normal
Fall Leaf Off 10/27 N/A Later than normal
2014 Climate Summary
Lake Name 2014 Ice Out Date Historical Median Ice Out Date
Lake Nokomis April 17 April 5
Powderhorn Lake N/A April 4
Lake Josephine N/A April 7
Lake Owasso April 18 April 6
Lake Phalen April 18 April 5

2014 CRWD Stormwater Monitoring Report 31
Figure 4-4: Daily temperature highs and snowpack depths from January to April 2014 as observed at MSP (NWS, 2015).
0
5
10
15
20
25
30
-20
-10
0
10
20
30
40
50
60
70
80
1/1 1/8 1/15 1/22 1/29 2/5 2/12 2/19 2/26 3/5 3/12 3/19 3/26 4/2 4/9 4/16 4/23 4/30
Sn
ow
pa
ck
De
pth
(in
ch
es
)
Da
ily H
igh
Te
mp
era
ture
(D
eg
ree
s F
)
Date
Snowpack Depth
Daily High Temperature
Freezing Point

2014 CRWD Stormwater Monitoring Report 32

2014 CRWD Stormwater Monitoring Report 33
5 CRWD WATER QUALITY RESULTS SUMMARY
5.1 OVERALL TRENDS AND SITE COMPARISONS
5.1.1 WATER QUANTITY
Total Discharge (cf)
In 2014, the Trout Brook subwatershed exported the greatest amount of water (666,381,676 cf)
because it has the largest drainage area in CRWD (5,028 acres) (Figure 5-1; Table 5-7). The
2014 total discharge for all monitored subwatersheds for both continuously and seasonally
monitored stations were greater than the historical averages of previous monitoring years (2005-
2013) (Figure 5-1), largely due to an above average annual precipitation year. The total
precipitation amount in 2014 was 35.66 inches, which was 5.05 inches greater than the 30-year
normal. In addition, a deep snowpack during winter 2014, followed a very wet spring (57% of
2014 precipitation occurred in April-June) resulted in substantial runoff and high discharge
volumes at all monitoring stations.
For the continuously monitored stations (St. Anthony Park, Phalen Creek, Trout Brook-East
Branch, Trout Brook-West Branch, and Trout Brook Outlet), baseflow comprised the majority
(54-88%) of the total annual discharge, with the exception of East Kittsondale (35%) because it
is the only subwatershed that is not connected to a surface water (Figure 5-2; Table 5-7).
Stormflow accounted for less of the total annual discharge at the continuously monitored sites
since precipitation is episodic and seasonal, whereas baseflow is constant and perennial.
Due to a deep snowpack in 2014 (76.2 inches), snowmelt runoff made up a larger than normal
fraction of the total discharge at the continuously monitored stations (Figure 5-2; Table 5-7).
Throughout spring 2014, the snowpack melted slowly and diurnally with daily afternoon peaks
and was not fully melted until April 27. In addition, the large amount of snowmelt provided
substantial recharge and increased the antecedent soil moisture conditions, so any spring
precipitation following snowmelt became runoff.
At the seasonally monitored stations (Como 3, Como 7, Sarita), stormflow comprised the entire
total annual discharge since these sites do not have baseflow (Figure 5-2; Table 5-7). Villa Park
and Hidden Falls are also seasonally monitored, though baseflow is present at these stations. At
Villa Park, 60% of the total annual flow is baseflow. At Hidden Falls, 54% of the total annual
flow is baseflow. Snowmelt events were not recorded at any of the seasonally monitored sites
since snowmelt occurred prior to the flow monitoring equipment being installed spring 2014
(Table 3-3). Overall, the seasonally monitored stations record less total annual discharge than the
continuously monitored stations since they do not have baseflow and they are monitored for a
shorter time period (April to November).

2014 CRWD Stormwater Monitoring Report 34
Water Yield (cf/ac)
Water yield was calculated for each monitoring site by dividing the total annual discharge by
subwatershed drainage area in order to make subwatershed comparisons possible. From this
calculation, Phalen Creek recorded the highest annual water yield (145,979 cf/ac) in comparison
to all other continuously monitored stations in 2014 (Figure 5-3). However, Phalen Creek likely
recorded the highest water yield because it receives tail water from the Mississippi River when it
is flooded, which did occur in 2014 (50 days of inundation; 7th highest river stage recorded ever
(NWS, 2015b). Trout Brook-West Branch had the next highest water yield (142,936 cf/ac),
likely because it has the most surface water connections in its subwatershed. Overall, all
continuously monitored sites in 2014 recorded greater total water yields than historical averages
(Figure 5-3).
For the seasonally monitored sites, Villa Park had the highest annual water yield (22,301 cf/ac),
which is due to the presence of baseflow (unlike Como 3, Como 7, or Sarita) (Figure 5-3). Como
3 had the lowest annual water yield (9,634 cf/ac) of the seasonally monitored sites. The annual
water yields at Sarita (11,168 cf/ac) and Como 7 (17,798 cf/ac) were much greater than the
historical average (Figure 5-3).
Discharge is the primary driver of pollutant loading. While baseflow discharges show relatively
minor fluctuations at the continuously monitored sites, stormflow discharges are episodic and
directly related to climate and seasonality. To investigate this further, a sensitivity analysis of the
effect of climate (i.e. precipitation variability, rainfall intensity, and seasonality) on stormwater
runoff, discharge, and pollutant loading trends in CRWD was conducted in 2013 and reported in
the 2013 Stormwater Monitoring Report (CRWD, 2014). The objective of this report was to
determine how the watershed might respond to changes in climate or seasonal precipitation
patterns, including extended drought or high intensity precipitation events. The analysis found:
(1) cool-season precipitation amounts (i.e. snowpack, snowmelt, and spring rain events) are
positively correlated with baseflow volumes and nutrient loading; (2) seasonal rainfall is the
most important driver of seasonal and annual stormflow volumes and loads of nutrients,
sediment, and chloride; and (3) late season precipitation is important for annual nutrient loads,
with wetter fall periods resulting in increased nutrient loading likely from autumn leaf drop.

2014 CRWD Stormwater Monitoring Report 35
Figure 5-1: Total discharge at CRWD monitoring sites in 2014 compared to historical averages.
0
100,000,000
200,000,000
300,000,000
400,000,000
500,000,000
600,000,000
700,000,000T
ota
l D
isch
arg
e (
cf)
Site
Historical Average
2014
a
a. The historical average for continuously monitoredsites is based on discharge data from 2010-2013. The historical average for seasonally monitored sites is based on discharge data from 2005-2013.

2014 CRWD Stormwater Monitoring Report 36
Figure 5-2: Baseflow, stormflow, and snowmelt discharge totals at CRWD monitoring sites, 2014.
0
100,000,000
200,000,000
300,000,000
400,000,000
500,000,000
600,000,000
700,000,000T
ota
l D
isch
arg
e (
cf)
Site
Snowmelt
Storm
Base

2014 CRWD Stormwater Monitoring Report 37
Figure 5-3: Total annual water yield at CRWD monitoring sites in 2014 compared to historical averages.
0
20,000
40,000
60,000
80,000
100,000
120,000
140,000
To
tal A
nn
ua
l W
ate
r Y
ield
(c
f/a
c)
Site
Historical Average
2014
a
a. The historical average for continuously monitored sites is based on discharge data from 2010-2013. The historical average for seasonally monitored sites is based on discharge data from 2005-2013.

2014 CRWD Stormwater Monitoring Report 38
5.1.2 TOTAL SUSPENDED SOLIDS (TSS)
TSS Loads (lbs)
At the stations with continuous monitoring (East Kittsondale, Phalen Creek, St. Anthony Park,
Trout Brook-East Branch, Trout Brook-West Branch, and Trout Brook Outlet), stormflow was
the largest contributor to the total TSS load at all sites (Figure 5-4), even though baseflow
accounted for the majority of the total discharge (Figure 5-2). Baseflow generally has lower TSS
concentrations because it includes flow contributions from groundwater, surface water, and
permitted industrial discharges. In addition, velocity and flow volumes are lower during
baseflow periods, so water does not have as much ability to carry solids. Stormwater contains
more TSS because it washes off impervious surfaces. Also, sediment is less likely to settle out in
water while in transport.
In 2014, snowmelt was also a contributor to the total annual TSS loads at the continuously
monitored stations, especially in comparison to previous years. Generally, the snowmelt TSS
load at the continuously monitored sites accounted for 2-18% of the total annual load. East
Kittsondale had the highest percentage (18%; 144,378 lbs) of the total annual TSS load come
from snowmelt runoff (Figure 5-4; Table 5-7).
Of the continuously monitored stations, Trout Brook Outlet had the largest total annual TSS load
(2,364,568 lbs) in 2014, of which 78% of the total load was transported by stormflow (Figure
5-4; Table 5-7). For the seasonally monitored sites, the Como 7 subwatershed had the largest
total annual TSS load (68,026 lbs), which was all transported by stormflow (Figure 5-4; Table
5-7).
TSS Yields (lbs/ac)
In comparing the continuously monitored stations, East Kittsondale produced the highest total
annual TSS yields on a per acre basis in 2014 (711 lbs/ac) and exceeded its historical average
TSS yield (490 lbs/ac) (Figure 5-5; Figure 5-6). The Hidden Falls subwatershed also had a high
TSS yield in 2014 (623 lbs/ac). Note: this was the first year of monitoring at Hidden Falls, so no
historical data is available for comparison. Also, the majority of the Hidden Falls subwatershed
was undergoing demolition in 2014 due to the deconstruction of the Ford Site, so disturbed or
bare soils may have contributed to high sediment yields (Figure 5-5; Figure 5-6; Table 5-7).
In 2014, all monitored stations exceeded their historical average TSS yields, except for Trout
Brook-West Branch and Villa Park (Figure 5-5). At most stations, TSS yields were likely greater
than historical averages in 2014 because of the above average precipitation that occurred; TSS
loading is primarily driven by stormwater runoff. For Trout Brook-West Branch, it is uncertain
why the 2014 TSS yield was below the historical average. A number of factors could have
influenced the TSS yield reduction, such as watershed changes (i.e. reduced sediment loading).
For Villa Park, the 2014 TSS yield was likely lower than the historical average due to dredging
of the ponds that occurred in 2013 that increased storage in the system. The historical average at
Villa Park (2006-2013) is based on pre-dredging conditions.

2014 CRWD Stormwater Monitoring Report 39
Figure 5-4: Baseflow, stormflow, and snowmelt TSS load totals at CRWD monitoring sites, 2014.
0
500,000
1,000,000
1,500,000
2,000,000
2,500,000
EastKittsondale
Hidden Falls Phalen Creek St. AnthonyPark
Trout Brook-East Branch
Trout Brook-West Branch
Trout BrookOutlet
Como 3 Como 7Subwatershed
Sarita Villa Park
TS
S L
oad
(lb
s)
Site
Snowmelt
Storm
Base

2014 CRWD Stormwater Monitoring Report 40
Figure 5-5: Total TSS yields at CRWD monitoring sites in 2014 compared to historical averages.
0
100
200
300
400
500
600
700
800T
SS
Yie
ld (
lb/a
c)
Site
Historical Average
2014
a
a. The historical average for continuously monitoredsites is based on 2010-13 TSS yield data. The historical average for seasonally monitored sites is based on 2005-13 TSS yield data.

2014 CRWD Stormwater Monitoring Report 41
Figure 5-6: Total TSS yields from CRWD subwatersheds, 2014.

2014 CRWD Stormwater Monitoring Report 42
5.1.3 TOTAL PHOSPHORUS (TP)
TP Loads (lbs)
TP loading in 2014 primarily occurred during storm events at all continuously monitored stations
(Figure 5-7), even though baseflow accounted for the majority of the total discharge (except at
East Kittsondale and Hidden Falls) (Figure 5-2). Baseflow periods generally have lower TP
concentrations because the discharge is driven by groundwater or surface water. At East
Kittsondale, 79% of the total annual TP load (1,525 lbs) was from storm events. At Hidden Falls,
84% of the total annual TP load (92 lbs) was from storm events. Both East Kittsondale and
Hidden Falls have very low baseflow, so TP loading is greater during storm events. At Trout
Brook Outlet, 56% of the total annual TP load (3,133 lbs) was from storm events; however, this
station is primarily baseflow driven.
In 2014, snowmelt runoff contributed to the total annual TP loads measured at the continuously
monitored sites. At East Kittsondale, the total snowmelt TP load (217 lbs) exceeded total
baseflow TP load (107 lbs) (Figure 5-7; Table 5-7). Trout Brook Outlet had the highest snowmelt
TP load in comparison to all the other subwatersheds (372 lbs).
For the continuously monitored sites, overall Trout Brook Outlet produced the largest total
annual TP load (5,564 lbs) in 2014 (Figure 5-7; Table 5-7). Trout Brook-West Branch had the
next highest total annual TP load in 2014 (3,063 lbs). In comparing the seasonally monitored
stations, Villa Park had the largest total annual TP load (225 lbs), but a greater portion of loading
was related to baseflow (55%; 123 lbs) instead of stormflow (45%; 102 lbs) (Figure 5-7; Table
5-7).
TP Yields (lbs/ac)
In 2014, East Kittsondale produced the highest total annual TP yield (1.37 lb/ac) (Figure 5-8;
Figure 5-9). Phalen Creek (1.31 lbs/ac) and Trout Brook-West Branch (1.29 lbs/ac) also had high
annual TP yields (Figure 5-8; Figure 5-9). Como 3 (0.14 lbs/ac) and Sarita (0.16 lbs/ac) had the
lowest annual TP yields of all subwatershed in 2014 (Figure 5-8).
The 2014 total annual TP yields from all District monitoring stations (with the exception of
Hidden Falls, Trout Brook-West Branch, and Como 3) were higher than the historical averages,
which was likely related to the above-average precipitation year (Figure 5-8). For Hidden Falls,
2014 was the first year of monitoring, so no historical data is available for comparison. However,
in general TP loads and yields were lower at Hidden Falls in comparison to other stations. One
factor potentially contributing to this result is the general lack of vegetation in the Hidden Falls
subwatershed. For Trout Brook-West Branch, it is uncertain why the 2014 TP yield was below
the historical average, though influencing factors such as watershed. For Como 3, the historical
average TP yield is calculated based on only two years of data (2012-2013), so the dataset does
not represent a wide-range of conditions or precipitation events to date.

2014 CRWD Stormwater Monitoring Report 43
Figure 5-7: Baseflow, stormflow, and snowmelt TP load totals at CRWD monitoring sites, 2014.
0
1,000
2,000
3,000
4,000
5,000
6,000
EastKittsondale
Hidden Falls Phalen Creek St. AnthonyPark
Trout Brook-East Branch
Trout Brook-West Branch
Trout BrookOutlet
Como 3 Como 7Subwatershed
Sarita Villa Park
TP
Lo
ad
(lb
s)
Site
Snowmelt
Storm
Base

2014 CRWD Stormwater Monitoring Report 44
Figure 5-8: Total TP yields at CRWD monitoring sites in 2014 compared to historical averages.
0.00
0.20
0.40
0.60
0.80
1.00
1.20
1.40
1.60
1.80T
P Y
ield
(lb
/ac)
Site
Historical Average
2014
a
a. The historical average for continuously monitored sites is based on 2010-13 TP data. The historical average for seasonally monitored sites is based on 2005-13 TP data.

2014 CRWD Stormwater Monitoring Report 45
Figure 5-9: Total TP yields from CRWD subwatersheds, 2014.

2014 CRWD Stormwater Monitoring Report 46
5.2 COMPARISON OF CRWD DATA TO METRO TRIBUTARIES
The 2014 annual TP and TSS yields of CRWD subwatershed outlet stations (East Kittsondale,
Hidden Falls, Phalen Creek, St. Anthony Park, Trout Brook Outlet) were compared to the yields
observed in 2014 at four other Twin Cities metro-area tributaries (Bassett Creek, Battle Creek,
Fish Creek, Minnehaha Creek). Each tributary utilized for comparison is an open-channel system
that outlets directly to the Mississippi River.
When comparing discharge from CRWD outlets to other metro-area tributaries, it should be
noted that the entire CRWD watershed is highly urbanized with water flowing in pipes instead of
natural channels. In tributaries, discharge primarily flows in natural channels. Storm sewers
operate differently than natural streams. When water velocity decreases, sediments settle out of
the water column. In natural streams, this occurs when the stream meanders, flows through a
vegetated area, gets wider, or reaches a relatively flat stretch. Storm sewers are designed to
maintain velocity in the pipe; pipes have a set diameter, do not meander, and can change
elevation quickly. In natural streams, nutrients are taken up by vegetation and algae, but there is
no vegetation in storm sewers. As a result, most of the sediment and nutrients washed into storm
sewers remain in the water column until the pipe reaches a body of water. Sediments and
nutrients from streets and sidewalks are washed directly into the storm sewer and carried to the
river.
All five of CRWD’s major subwatershed outlet stations (East Kittsondale, Hidden Falls, Phalen
Creek, St. Anthony Park, and Trout Brook Outlet) produced a greater TSS yield per acre than the
TSS yields observed at the four metro-area tributaries (Figure 5-10). East Kittsondale produced
the highest TSS yield (711 lbs/ac) of all subwatershed outlets in 2014. Hidden Falls also
produced a high TSS yield (623 lbs/ac). Comparatively, Battle Creek produced the highest
average TSS yields of all the metro-area tributaries with only 150 lbs/ac (Figure 5-10). For the
seasonally monitored sites (Como 3, Como 7, Sarita, and Villa Park), Como 3 was the only
station that exceeded all TSS yields observed at the metro-area tributaries with 354 lbs/ac.
For annual average TP yields, all five of the major subwatershed outlet stations produced greater
TP yields in comparison to the metro-area tributaries. East Kittsondale (1.37 lbs/ac), Phalen
Creek (1.31 lbs/ac), and Trout Brook-West Branch (1.28 lbs/ac) had the highest yields of all the
stations (Figure 5-11). Comparatively, Bassett Creek had the highest of the tributary TP yields
with only 0.32 lbs/ac. For the seasonally monitored sites, Como 3 (0.43 lbs/ac) was the only
station that exceeded metro-area tributary TP yields. Como 7, Sarita, and Villa Park TP yields
were less than Basset, Battle, and Fish Creeks (Figure 5-11).

2014 CRWD Stormwater Monitoring Report 47
Figure 5-10: TSS yields from CRWD subwatersheds compared to Twin Cities metro-area tributaries, 2014.
0
100
200
300
400
500
600
700
EastKittsondale
HiddenFalls
PhalenCreek
St. AnthonyPark
TroutBrook-East
Branch
TroutBrook-West
Branch
Trout BrookOutlet
Como 3 Como 7 Sarita Villa Park
Av
era
ge T
SS
Yie
ld (
lb/a
c)
2014 Avg TSS yield(lb/ac)Basset Creek*
Battle Creek*
Fish Creek*
Minnehaha Creek*
* Water quality data for Twin Cities metro tributaries were collected by Metropolitan Council (MCES, 2014). Lines represent historical average annual TSS yields in lb/ac from 2005-2013.

2014 CRWD Stormwater Monitoring Report 48
Figure 5-11: TP yields from CRWD subwatersheds compared to Twin Cities metro-area tributaries, 2014.
0.0
0.2
0.4
0.6
0.8
1.0
1.2
1.4
1.6
EastKittsondale
HiddenFalls
PhalenCreek
St. AnthonyPark
TroutBrook-East
Branch
TroutBrook-West
Branch
Trout BrookOutlet
Como 3 Como 7 Sarita Villa Park
Av
era
ge T
P Y
ield
(lb
/ac)
2014 Avg TP yield(lb/acre)Basset Creek*
Battle Creek*
Fish Creek*
Minnehaha Creek*
* Water quality data for Twin Cities metro tributaries were collected by Metropolitan Council (MCES, 2014). Lines represent historical average annual TP yields in lb/ac from 2005-2013

2014 CRWD Stormwater Monitoring Report 49
Average annual pollutant concentrations observed in 2014 at CRWD subwatershed outlet
stations were compared to state water quality standards and average annual concentrations
observed at Lambert’s Landing on the Mississippi River in St. Paul, Minnesota (Table 5-1). The
Metropolitan Council monitors the Mississippi River at Lambert’s Landing and reports the data
online (MCES, 2015). When comparing CRWD storm tunnel outlets to the Mississippi River, it
is acknowledged that both systems are inherently different. However, the Lambert’s Landing
station is the only station operated by Metropolitan Council that is within CRWD and is
downstream of all monitoring stations, so it was determined to be a useful comparison.
Average nitrate concentrations at CRWD subwatershed outlet stations was the only parameter
that did not exceed average nitrate concentrations observed at Lambert’s Landing in 2014 (Table
5-1). However, average nitrite concentrations observed at all CRWD subwatershed outlet
stations were equal to those observed at Lambert’s Landing. Average concentrations for all other
measured parameters (nutrients, solids, and metals) observed at CRWD subwatershed outlet
stations exceeded those average concentrations observed at Lambert’s Landing (Table 5-1).
Additionally, average concentrations for TP, TSS, ammonia, and chloride observed at CRWD
subwatershed outlet stations all exceeded the State standards for the Mississippi River
Navigational Pool 2 (Table 5-1).
Average flow-weighted concentrations of TSS from all CRWD subwatershed monitoring stations
in 2014 (except Villa Park) exceeded the South Metro Mississippi River TSS TMDL goal of 32
mg/L (Figure 5-12). Additionally, the average flow-weighted concentrations of TSS from all
stations (except Villa Park) exceeded the 2014 Lambert’s Landing average flow-weighted
concentration of 38 mg/L (Figure 5-12). Como 3 (194 mg/L) had the highest average flow-
weighted TSS concentration, and East Kittsondale (144 mg/L) had the next highest. Villa Park
(11 mg/L) had the lowest highest flow-weighted TSS concentration.
For average flow-weighted TP concentrations, all CRWD subwatershed monitoring stations
exceeded the target TP concentration for the MPCA Lake Pepin Excess Nutrient TMDL (0.10
mg/L) in 2014 (Figure 5-13). The 2014 average flow-weighted TP concentration for Lambert’s
Landing (0.13 mg/L) was exceeded by most CRWD subwatershed monitoring stations in 2014,
except Hudden Falls, St. Anthony Park, and Trout Brook Outlet (Figure 5-13). East Kittsondale
(0.28 mg/L) had the highest average flow-weighted TP concentration of all subwatershed outlets
in 2014.

2014 CRWD Stormwater Monitoring Report 50
Table 5-1: Pollutant standards and average concentrations at CRWD sites and the Mississippi River at Lamberts Landing, 2014.
Metropolitan
Council Site
Standard
(mg/L)a
Lamberts
Landing
East
Kittsondale
Hidden
Falls
Phalen
Creek
St.
Anthony
Park
Trout
Brook
Outlet
TPa0.125 0.13 0.26 0.16 0.32 0.15 0.33
TSSb32 38 125 193 156 125 188
Ammoniac0.04 0.05 0.23 0.15 0.24 0.30 0.20
TKNdN/A 1.02 1.81 1.04 1.81 1.44 1.92
NitratedN/A 1.28 0.96 0.76 0.95 0.68 0.56
NitritedN/A 0.04 0.04 0.04 0.05 0.05 0.04
Cadmium * 0.00020 0.00025 0.00056 0.00029 0.00026 0.00024
Chromium * 0.00140 0.00640 0.00667 0.00691 0.00748 0.00593
Copper * 0.00240 0.01913 0.01593 0.01766 0.01109 0.01317
Lead * 0.00100 0.01571 0.05524 0.01809 0.00759 0.01229
Nickel * 0.00300 0.00474 0.00596 0.00464 0.01182 0.00483
Zinc * 0.00660 0.08891 0.19874 0.08923 0.05184 0.05507
Chloridee230 22 338 46 454 330 179
* The standard is dependent on w ater hardness; See Appendix B
c Ammonia standard is based on un-ionized ammonia, w hich varies and is dependent on temperature and pH
d There is no nitrate, nitrite, or TKN State standard for surface w ater.
e Chloride standards are from the MPCA.
All numbers are in mg/L.
Red Exceed/equal Lambert's Landing concentrations and the standard
Yellow Exceed/equal Lambert's Landing concentrations, but not the standard
2014 CRWD Monitoring Sites
Key
a The Mississippi River is subject to site specif ic State standards for specif ied reaches. Capitol Region Watershed
District discharges into tw o of these reaches. The TP standard for Mississippi River Navigational Pool 2 (river miles
847.7 to 815.2 reach from Ford Dam to Hastings Dam) w as chosen for comparison to the TP standard of 0.125 mg/L to
be consistent among all sites.
b The TSS State standard is a summer average that applies to Mississippi River Navigation Pools 2 - 4 (below Ford Dam)
from April 1 through September 30. This standard may be exceeded not more than 50% of the time.
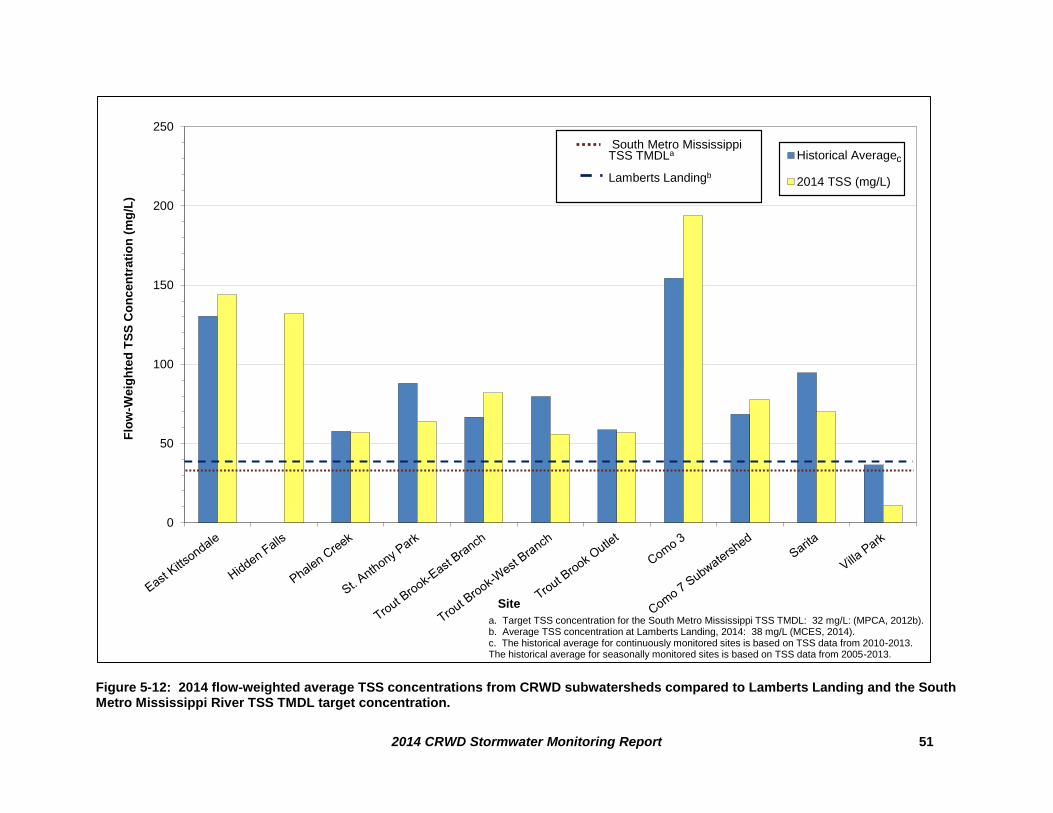
2014 CRWD Stormwater Monitoring Report 51
Figure 5-12: 2014 flow-weighted average TSS concentrations from CRWD subwatersheds compared to Lamberts Landing and the South Metro Mississippi River TSS TMDL target concentration.
0
50
100
150
200
250F
low
-We
igh
ted
TS
S C
on
cen
tra
tio
n (
mg
/L)
Site
Historical Average
2014 TSS (mg/L)
a. Target TSS concentration for the South Metro Mississippi TSS TMDL: 32 mg/L: (MPCA, 2012b).b. Average TSS concentration at Lamberts Landing, 2014: 38 mg/L (MCES, 2014).c. The historical average for continuously monitored sites is based on TSS data from 2010-2013. The historical average for seasonally monitored sites is based on TSS data from 2005-2013.
South Metro Mississippi TSS TMDLa
Lamberts Landingb
c

2014 CRWD Stormwater Monitoring Report 52
Figure 5-13: 2014 flow-weighted average TP concentrations from CRWD subwatersheds compared to Lamberts Landing and the Lake Pepin Excess Nutrient TMDL target TP concentration.
0.00
0.05
0.10
0.15
0.20
0.25
0.30
0.35
0.40
0.45
Flo
w-W
eig
hte
d T
P C
on
cen
tra
tio
n (
mg
/L)
Site
Historical Average
2014 TP (mg/L)
a. Target TP concentration for MPCA Lake Pepin Excess Nutrient TMDL: 0.10 mg/L (MPCA, 2013).b. Average TP concentration at Lamberts Landing, 2014: 0.13 mg/L (MCES, 2014).c. The historical average for continuously monitored sites is based on TP data from 2010-2013. The historical average for seasonally monitored sites is based on TP data from 2005-2013.
Lake Pepin Excess Nutrients TMDLa
Lamberts Landingb
c

2014 CRWD Stormwater Monitoring Report 53
5.2.1 METALS
The MPCA surface water standards for metals toxicity are a function of the water hardness of a
sample; therefore, the standard is not a set value and is instead based on the water hardness
measured at an individual monitoring station. Appendix A lists the equations used by MPCA to
calculate metal standards for cadmium, chromium, copper, lead, nickel, and zinc at each
monitoring station as a function of measured water hardness levels. A table of the calculated
standards for each individual station for all metals is also listed in Appendix A (Table A-1).
Average annual toxicity of metals for each individual station were calculated for baseflow,
snowmelt, stormflow, and total flow (yearly) and compared to the calculated MPCA standards.
For all stations, metal toxicity for average baseflow periods never exceeded the MPCA toxicity
standard in 2014 for any of the 6 metals analyzed (Table 5-2). Toxicity exceedances are
uncommon during baseflow periods because the hardness of the water is much higher since it is
primarily groundwater driven. Increased hardness in water buffers heavy metals and reduces
toxicity.
Metals toxicity in snowmelt and storm events is common since this flow type is direct surface
runoff, so the hardness of the water is significantly lower than baseflow. Metals of particular
concern in stormwater runoff are lead, copper, and zinc.
In 2014, the average storm concentrations of lead and copper at all stations (except Villa Park)
exceeded the MPCA toxicity standards (Table 5-2). Lead and copper were also observed to
exceed the MPCA toxicity standards during snowmelt events at all stations (except SAP and
Villa Park). Average stormflow concentrations of zinc exceeded the toxicity standard at East
Kittsondale, Hidden Falls, Phalen Creek, Como 3, and Como 7. For all sites, average toxicity of
cadmium, chromium, and nickel for all flow types (base, snowmelt, storm, and yearly) generally
did not exceed the MPCA toxicity standards in 2014.

2014 CRWD Stormwater Monitoring Report 54
Table 5-2: Metals toxicity and chronic toxicity standard exceedances at CRWD monitoring sites, 2014.
Parameter Average
Lambert's
Landing
East
Kittsondale
Hidden
Falls
Phalen
Creek
St.
Anthony
Park
Trout
Brook -
East
Branch
Trout
Brook -
West
Branch
Trout
Brook
Outlet
Villa Park
Out Como 3 Como 7 Sarita
Base -- 0.0002 0.0002 0.0003 0.0003 0.0002 0.0002 0.0002 0.0002 -- -- --
Illicit Discharge -- 0.0002 -- -- -- -- -- -- -- -- --
Snowmelt -- 0.0004 -- 0.0004 0.0004 0.0005 0.0004 0.0004 0.0003 0.0005 0.0005 --
Storm -- 0.0003 0.0008 0.0003 0.0003 0.0002 0.0002 0.0002 0.0002 0.0002 0.0002 0.0002
Yearly 0.0002 0.0002 0.0006 0.0003 0.0003 0.0002 0.0002 0.0002 0.0002 0.0003 0.0002 0.0002
Base -- 0.0007 0.0010 0.0010 0.0094 0.0016 0.0007 0.0008 0.0003 -- -- --
Illicit Discharge -- 0.0019 -- -- -- -- -- -- -- -- -- --
Snowmelt -- 0.0177 -- 0.0180 0.0222 0.0224 0.0149 0.0141 0.0049 0.0282 0.0104 --
Storm -- 0.0087 0.0105 0.0076 0.0055 0.0091 0.0046 0.0075 0.0010 0.0098 0.0037 0.0031
Yearly 0.0014 0.0064 0.0067 0.0069 0.0100 0.0081 0.0046 0.0059 0.0013 0.0128 0.0046 0.0031
Base -- 0.0022 0.0023 0.0025 0.0129 0.0031 0.0024 0.0021 0.0012 -- -- --
Illicit Discharge -- 0.0055 -- -- -- -- -- -- -- -- -- --
Snowmelt -- 0.0571 -- 0.0440 0.0189 0.0368 0.0296 0.0291 0.0075 0.0484 0.0226 --
Storm -- 0.0253 0.0250 0.0204 0.0138 0.0168 0.0131 0.0169 0.0024 0.0174 0.0096 0.0077
Yearly 0.0024 0.0191 0.0159 0.0177 0.0144 0.0145 0.0115 0.0132 0.0026 0.0224 0.0113 0.0077
Base -- 0.0005 0.0037 0.0013 0.0076 0.0031 0.0014 0.0014 0.0004 -- -- --
Illicit Discharge -- 0.0050 -- -- -- -- -- -- -- -- -- --
Snowmelt -- 0.0378 -- 0.0279 0.0107 0.0206 0.0215 0.0237 0.0031 0.0211 0.0098 --
Storm -- 0.0231 0.0896 0.0285 0.0112 0.0154 0.0123 0.0171 0.0037 0.0171 0.0083 0.0093
Yearly 0.0010 0.0157 0.0552 0.0181 0.0098 0.0119 0.0098 0.0123 0.0023 0.0178 0.0085 0.0093
Base -- 0.0022 0.0028 0.0010 0.0223 0.0039 0.0015 0.0016 0.0016 -- -- --
Illicit Discharge -- 0.0019 -- -- -- -- -- -- -- -- -- --
Snowmelt -- 0.0117 -- 0.0104 0.0229 0.0108 0.0087 0.0088 0.0034 0.0134 0.0061 --
Storm -- 0.0055 0.0081 0.0055 0.0050 0.0077 0.0037 0.0061 0.0015 0.0051 0.0027 0.0031
Yearly 0.0030 0.0047 0.0060 0.0046 0.0147 0.0068 0.0035 0.0048 0.0018 0.0064 0.0031 0.0031
Base -- 0.0095 0.0160 0.0196 0.0380 0.0134 0.0098 0.0099 0.0067 -- -- --
Illicit Discharge -- 0.0271 -- -- -- -- -- -- -- -- -- --
Snowmelt -- 0.2820 -- 0.2640 0.0887 0.2024 0.1538 0.1518 0.0470 0.3165 0.1154 --
Storm -- 0.1156 0.3206 0.0810 0.0636 0.0540 0.0599 0.0625 0.0151 0.1027 0.0582 0.0420
Yearly 0.0066 0.0889 0.1987 0.0892 0.0588 0.0582 0.0544 0.0551 0.0163 0.1369 0.0655 0.0420
Site exceeded the MPCA chronic standard for surface w aters
-- No data available
See Appendix B for metals standards.
Nickel
Zinc
Cadmium
Chromium
Copper
Lead

2014 CRWD Stormwater Monitoring Report 55
5.2.2 BACTERIA
E. coli samples were collected during baseflow, stormflow, snowmelt, and illicit discharge
periods. Grab samples were extracted using a sterile 100 mL plastic bag. For all flow types, the
MPCA surface water maximum numeric standard for E. coli is 1,260 cfu/100 mL.
For baseflow periods, E. coli concentrations generally did not exceed the MPCA maximum
numeric standard (1,260 cfu/100mL), with the exception of a few sites on isolated occurrences
(East Kittsondale, Hidden Falls, Trout Brook-East Branch, Trout Brook-West Branch, and Villa
Park) (Table 5-3). E. coli in baseflow is typically low since the discharge is primarily
groundwater driven or sourced from lakes or stormwater ponds. Therefore, the observance of
high E. coli in baseflow could be indicative of an illicit discharge source, such as a sanitary
misconnection. In 2014, this was known to be the cause of high E. coli at Trout Brook-East
Branch because a nearby sanitary main was contaminating the tunnel. The source was identified
and eliminated upon discovery.
During stormflow events, the majority (80%) of E. coli samples for all stations exceeded the
MPCA maximum numeric standard (1,260 cfu/100 mL) in 2014 (Table 5-4). The highest
bacteria count observed was at Hidden Falls on 10/1/2014 with 71,700 cfu/100 mL. The next
highest was observed at Villa Park on 08/21/2014 with 47,100 cfu/100 mL. Both of these
samples were taken from storm events that followed extended dry periods. For snowmelt events,
less than half of the samples (40%) did not meet the MPCA standard (Table 5-5).
Table 5-3: Baseflow grab sample E. coli concentrations at CRWD monitoring stations, 2014.
East
Kittsondale
Hidden
Falls
Phalen
Creek
St.
Anthony
Park
Trout
Brook-
East
Branch
Trout
Brook-West
Branch
Trout
Brook
Outlet
Villa Park
01/22/2014 189 -- 1 65 219 1,300 488 18
02/12/2014 52 -- 3 20 14 980 727 5
03/17/2014 866 -- 36 54 236 816 345 129
04/11/2014 1,046 -- 461 16 1 118 81 10
05/14/2014 1,414 20 -- -- 13 105 79 50
05/29/2014 1,300 124 26 34 131 145 178 8
06/10/2014 687 176 -- -- 179 387 105 8
06/25/2014 -- 23 -- -- -- -- -- --
07/02/2014 161 682 -- -- 23,800 172 1,733 435
07/21/2014 -- 138 32 30 46 108 114 17
08/04/2014 78 649 -- -- -- -- -- --
08/13/2014 461 238 -- 122 10 6,300 1,414 1,300
08/26/2014 -- 1,414 -- -- -- -- -- --
09/08/2014 108 76 28 88 387 1 166 727
09/29/2014 66 18,500 -- 47 1 178
10/09/2014 28 1,300 15 24 23 17 81 34
11/20/2014 1 -- 3 707 326 1,046 727 18
12/18/2014 12 -- 10 -- 272 326 179 548
Value exceeds MPCA maximum numeric standard (1,260 cfu/100mL).
-- No sample collected
Base Grab
Sample Date
Site
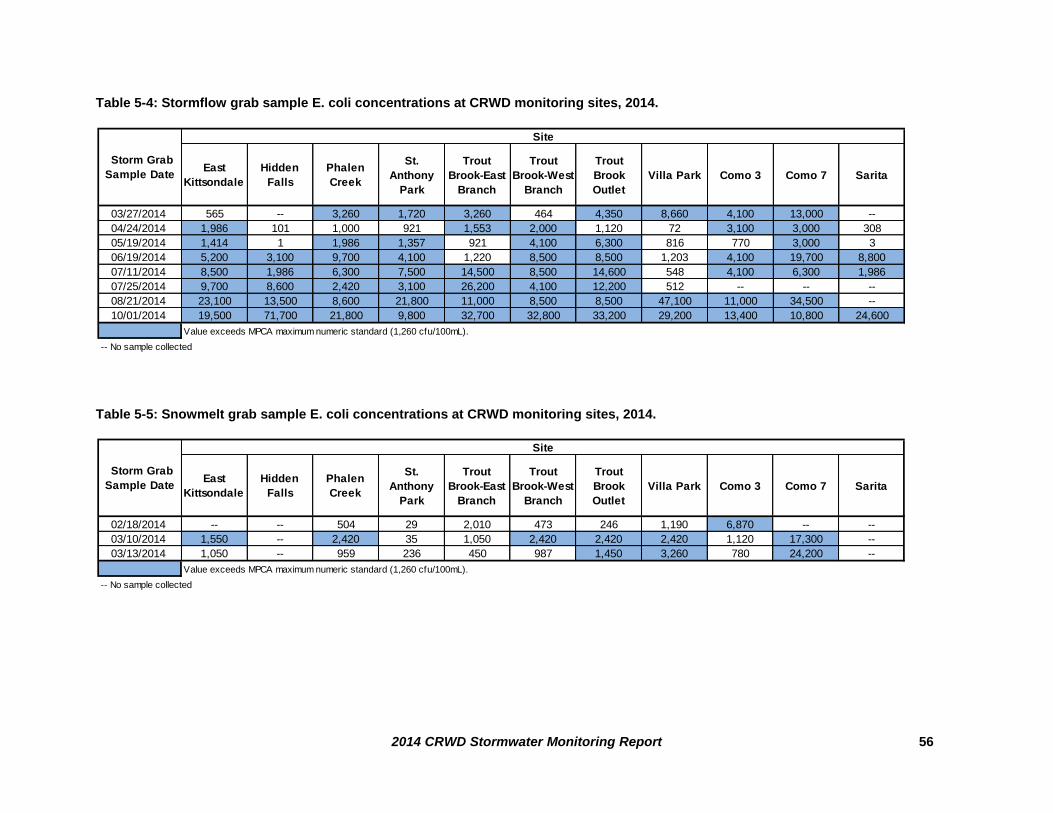
2014 CRWD Stormwater Monitoring Report 56
Table 5-4: Stormflow grab sample E. coli concentrations at CRWD monitoring sites, 2014.
Table 5-5: Snowmelt grab sample E. coli concentrations at CRWD monitoring sites, 2014.
East
Kittsondale
Hidden
Falls
Phalen
Creek
St.
Anthony
Park
Trout
Brook-East
Branch
Trout
Brook-West
Branch
Trout
Brook
Outlet
Villa Park Como 3 Como 7 Sarita
03/27/2014 565 -- 3,260 1,720 3,260 464 4,350 8,660 4,100 13,000 --
04/24/2014 1,986 101 1,000 921 1,553 2,000 1,120 72 3,100 3,000 308
05/19/2014 1,414 1 1,986 1,357 921 4,100 6,300 816 770 3,000 3
06/19/2014 5,200 3,100 9,700 4,100 1,220 8,500 8,500 1,203 4,100 19,700 8,800
07/11/2014 8,500 1,986 6,300 7,500 14,500 8,500 14,600 548 4,100 6,300 1,986
07/25/2014 9,700 8,600 2,420 3,100 26,200 4,100 12,200 512 -- -- --
08/21/2014 23,100 13,500 8,600 21,800 11,000 8,500 8,500 47,100 11,000 34,500 --
10/01/2014 19,500 71,700 21,800 9,800 32,700 32,800 33,200 29,200 13,400 10,800 24,600
Value exceeds MPCA maximum numeric standard (1,260 cfu/100mL).
-- No sample collected
Storm Grab
Sample Date
Site
East
Kittsondale
Hidden
Falls
Phalen
Creek
St.
Anthony
Park
Trout
Brook-East
Branch
Trout
Brook-West
Branch
Trout
Brook
Outlet
Villa Park Como 3 Como 7 Sarita
02/18/2014 -- -- 504 29 2,010 473 246 1,190 6,870 -- --
03/10/2014 1,550 -- 2,420 35 1,050 2,420 2,420 2,420 1,120 17,300 --
03/13/2014 1,050 -- 959 236 450 987 1,450 3,260 780 24,200 --
Value exceeds MPCA maximum numeric standard (1,260 cfu/100mL).
-- No sample collected
Storm Grab
Sample Date
Site

2014 CRWD Stormwater Monitoring Report 57
5.3 COMPARISON OF CRWD STORMWATER DATA AND NSQD DATA
Table 5-6 compares 2014 annual stormwater pollutant median concentrations for nutrients,
solids, metals, and bacteria from CRWD monitoring stations to the National Stormwater Quality
Database (NSQD) (Version 3) for mixed residential land use.
When comparing CRWD’s annual stormwater pollutant median concentrations to the NSQD’s
mixed residential land use category, most CRWD monitored subwatersheds (except Villa Park)
exceeded median NSQD stormwater concentrations for TSS and E. coli in 2014 (Table 5-6). For
TP, Trout Brook-East Branch and Trout Brook Outlet were the only CRWD stations to exceed
the NSQD median TP concentrations in 2014. Median TKN concentrations exceeded the NSQD
median concentration at East Kittsondale, Trout Brook-West Branch, and Trout Brook Outlet.
All monitored subwatersheds did not exceed the NSQD median concentrations for ammonia and
Nitrate+Nitrite.
The median storm concentrations for some heavy metals exceeded the NSQD concentrations
only at a few CRWD subwatersheds in 2014, including East Kittsondale (Cr, Cu), Hidden Falls
(Cr, Pb, Zn), Phalen Creek (Pb), Trout Brook-East Branch (Cr, Ni), Trout Brook Outlet (Pb) and
Como 3 (Cr) (Table 5-6). The median storm concentrations for all metals did not exceed the
NSQD medians at St. Anthony Park, Villa, Park, Como 7, and Sarita in 2014. None of the
CRWD monitoring stations exceed the NSQD median for cadmium.

2014 CRWD Stormwater Monitoring Report 58
Table 5-6: CRWD 2014 median stormflow concentrations compared to NSQD median concentrations.
NSQD -
Mixed
Residential
East
Kittsondale
Hidden
Falls
Phalen
Creek
St. Anthony
Park
Trout Brook -
East Branch
Trout Brook -
West Branch
Trout Brook
OutletVilla Park Como 3 Como 7 Sarita
103 1,116 167 1,433 3,418 932 2,379 5,028 753 517 793 929
34 46 116 50 48 -- -- 40 -- -- -- --
1,155 6,850 3,100 4,780 3,600 7,130 6,300 8,500 1,010 4,100 10,800 1,986
76 109 184 143 116 170 107 154 13 154 129 60
0.310 0.260 0.199 0.295 0.173 0.330 0.291 0.337 0.186 0.234 0.244 0.208
0.42 0.15 0.11 0.07 0.19 0.08 0.08 0.07 0.12 0.19 0.17 0.15
0.63 0.25 0.39 0.24 0.28 0.33 0.36 0.36 0.13 0.25 0.23 0.33
1.40 1.85 1.15 1.40 1.15 1.40 1.50 1.50 1.35 1.20 1.30 1.25
0.0008 0.0002 0.0005 0.0002 0.0002 0.0002 0.0002 0.0002 0.0002 0.0002 0.0002 0.0002
0.0070 0.0072 0.0075 0.0061 0.0041 0.0087 0.0035 0.0067 0.0005 0.0080 0.0026 0.0029
0.0200 0.0212 0.0190 0.0165 0.0096 0.0147 0.0105 0.0151 0.0016 0.0127 0.0080 0.0071
0.0190 0.0185 0.0615 0.0204 0.0112 0.0143 0.0121 0.0194 0.0009 0.0166 0.0066 0.0091
0.0060 0.0042 0.0057 0.0045 0.0035 0.0071 0.0030 0.0058 0.0013 0.0038 0.0020 0.0028
0.0985 0.0939 0.2395 0.0768 0.0494 0.0460 0.0506 0.0552 0.0097 0.0602 0.0534 0.0378
Value Exceeds NSQD Value
-- No data available
Lead (mg/L)
Nickel (mg/L)
Zinc (mg/L)
Ammonia (mg/L)
Nitrate+Nitrite (mg/L)
Total Kjeldahl Nitrogen (mg/L)
Cadmium (mg/L)
Chromium (mg/L)
Copper (mg/L)
Total Phosphorous (mg/L)
Area (acre)
Parameters
% Impervious
Escherichia coli (mpn/100mL)
Total Suspended Solids (mg/L)
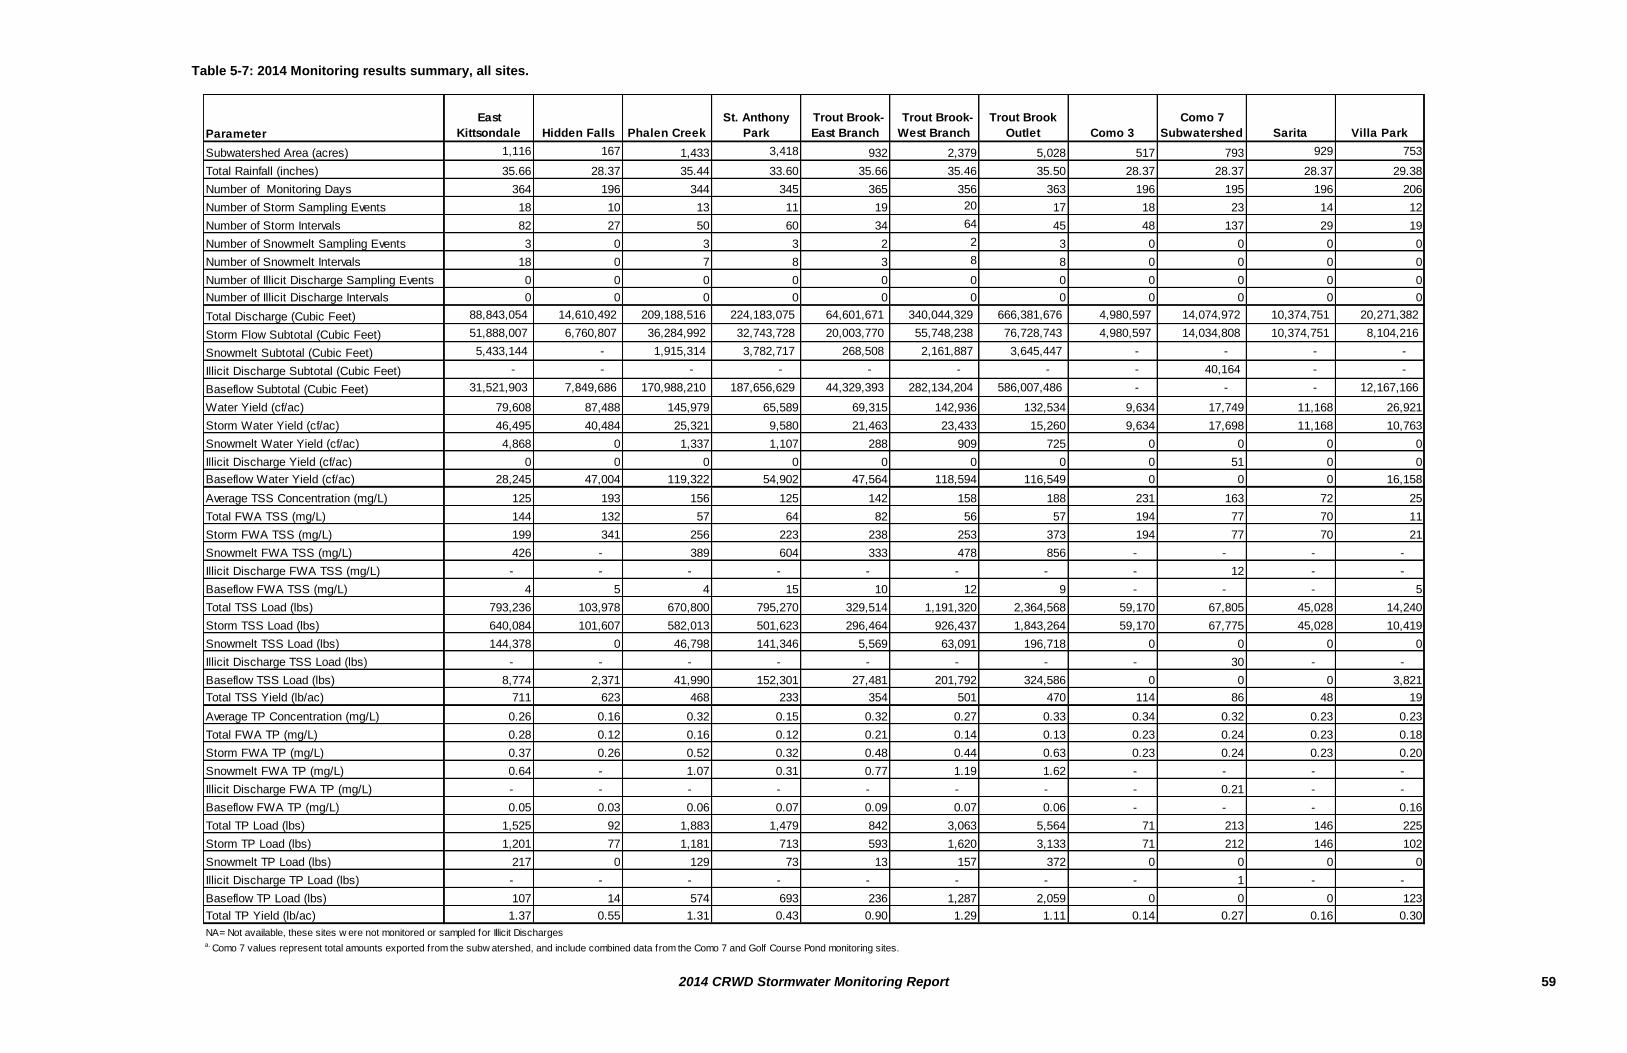
2014 CRWD Stormwater Monitoring Report 59
Table 5-7: 2014 Monitoring results summary, all sites.
Parameter
East
Kittsondale Hidden Falls Phalen Creek
St. Anthony
Park
Trout Brook-
East Branch
Trout Brook-
West Branch
Trout Brook
Outlet Como 3
Como 7
Subwatershed Sarita Villa Park
Subwatershed Area (acres) 1,116 167 1,433 3,418 932 2,379 5,028 517 793 929 753
Total Rainfall (inches) 35.66 28.37 35.44 33.60 35.66 35.46 35.50 28.37 28.37 28.37 29.38
Number of Monitoring Days 364 196 344 345 365 356 363 196 195 196 206
Number of Storm Sampling Events 18 10 13 11 19 20 17 18 23 14 12
Number of Storm Intervals 82 27 50 60 34 64 45 48 137 29 19
Number of Snowmelt Sampling Events 3 0 3 3 2 2 3 0 0 0 0
Number of Snowmelt Intervals 18 0 7 8 3 8 8 0 0 0 0
Number of Illicit Discharge Sampling Events 0 0 0 0 0 0 0 0 0 0 0
Number of Illicit Discharge Intervals 0 0 0 0 0 0 0 0 0 0 0
Total Discharge (Cubic Feet) 88,843,054 14,610,492 209,188,516 224,183,075 64,601,671 340,044,329 666,381,676 4,980,597 14,074,972 10,374,751 20,271,382
Storm Flow Subtotal (Cubic Feet) 51,888,007 6,760,807 36,284,992 32,743,728 20,003,770 55,748,238 76,728,743 4,980,597 14,034,808 10,374,751 8,104,216
Snowmelt Subtotal (Cubic Feet) 5,433,144 - 1,915,314 3,782,717 268,508 2,161,887 3,645,447 - - - -
Illicit Discharge Subtotal (Cubic Feet) - - - - - - - - 40,164 - -
Baseflow Subtotal (Cubic Feet) 31,521,903 7,849,686 170,988,210 187,656,629 44,329,393 282,134,204 586,007,486 - - - 12,167,166
Water Yield (cf/ac) 79,608 87,488 145,979 65,589 69,315 142,936 132,534 9,634 17,749 11,168 26,921
Storm Water Yield (cf/ac) 46,495 40,484 25,321 9,580 21,463 23,433 15,260 9,634 17,698 11,168 10,763
Snowmelt Water Yield (cf/ac) 4,868 0 1,337 1,107 288 909 725 0 0 0 0
Illicit Discharge Yield (cf/ac) 0 0 0 0 0 0 0 0 51 0 0
Baseflow Water Yield (cf/ac) 28,245 47,004 119,322 54,902 47,564 118,594 116,549 0 0 0 16,158
Average TSS Concentration (mg/L) 125 193 156 125 142 158 188 231 163 72 25
Total FWA TSS (mg/L) 144 132 57 64 82 56 57 194 77 70 11
Storm FWA TSS (mg/L) 199 341 256 223 238 253 373 194 77 70 21
Snowmelt FWA TSS (mg/L) 426 - 389 604 333 478 856 - - - -
Illicit Discharge FWA TSS (mg/L) - - - - - - - - 12 - -
Baseflow FWA TSS (mg/L) 4 5 4 15 10 12 9 - - - 5
Total TSS Load (lbs) 793,236 103,978 670,800 795,270 329,514 1,191,320 2,364,568 59,170 67,805 45,028 14,240
Storm TSS Load (lbs) 640,084 101,607 582,013 501,623 296,464 926,437 1,843,264 59,170 67,775 45,028 10,419
Snowmelt TSS Load (lbs) 144,378 0 46,798 141,346 5,569 63,091 196,718 0 0 0 0
Illicit Discharge TSS Load (lbs) - - - - - - - - 30 - -
Baseflow TSS Load (lbs) 8,774 2,371 41,990 152,301 27,481 201,792 324,586 0 0 0 3,821
Total TSS Yield (lb/ac) 711 623 468 233 354 501 470 114 86 48 19
Average TP Concentration (mg/L) 0.26 0.16 0.32 0.15 0.32 0.27 0.33 0.34 0.32 0.23 0.23
Total FWA TP (mg/L) 0.28 0.12 0.16 0.12 0.21 0.14 0.13 0.23 0.24 0.23 0.18
Storm FWA TP (mg/L) 0.37 0.26 0.52 0.32 0.48 0.44 0.63 0.23 0.24 0.23 0.20
Snowmelt FWA TP (mg/L) 0.64 - 1.07 0.31 0.77 1.19 1.62 - - - -
Illicit Discharge FWA TP (mg/L) - - - - - - - - 0.21 - -
Baseflow FWA TP (mg/L) 0.05 0.03 0.06 0.07 0.09 0.07 0.06 - - - 0.16
Total TP Load (lbs) 1,525 92 1,883 1,479 842 3,063 5,564 71 213 146 225
Storm TP Load (lbs) 1,201 77 1,181 713 593 1,620 3,133 71 212 146 102
Snowmelt TP Load (lbs) 217 0 129 73 13 157 372 0 0 0 0
Illicit Discharge TP Load (lbs) - - - - - - - - 1 - -
Baseflow TP Load (lbs) 107 14 574 693 236 1,287 2,059 0 0 0 123
Total TP Yield (lb/ac) 1.37 0.55 1.31 0.43 0.90 1.29 1.11 0.14 0.27 0.16 0.30
NA= Not available, these sites w ere not monitored or sampled for Illicit Dischargesa. Como 7 values represent total amounts exported from the subw atershed, and include combined data from the Como 7 and Golf Course Pond monitoring sites.
Table 5-6: Annual monitoring results summary for CRWD sites, 2013.

2014 CRWD Stormwater Monitoring Report 60

Como
2014 CRWD Stormwater Monitoring Report 61
6 COMO LAKE SUBWATERSHED RESULTS
6.1 DESCRIPTION
CRWD monitors two of the eight minor subwatersheds within the greater Como Lake
subwatershed: Como 7 and Como 3.
Como 7
The Como 7 subwatershed includes portions of the cities of St. Paul, Roseville, and Falcon
Heights. Como 7 is located west of Como Lake (Figure 6-2). North of Como 7 is Como 8
subwatershed, which drains to Gottfried’s Pit, a stormwater retention pond. When the water
level in Gottfried’s Pit reaches a specific level, a lift station pumps the water via storm sewer to
the Como Golf Course Pond (part of the Como 7 subwatershed) before being discharged to
Como Lake.
CRWD monitors the Como 7 subwatershed to determine the aggregated or combined
improvements to water quality based on the BMPs constructed as part of the Arlington-Pascal
Stormwater Improvement Project. Started in 2005, the project included four stormwater BMP
types: 1) eight infiltration trenches, 2) eight raingardens, 3) an underground infiltration and
storage facility (Arlington-Hamline Underground Storage Facility), and 4) a stormwater pond at
the Como Golf Course. These BMPs treat and infiltrate stormwater runoff, minimize localized
flooding, and reduce stormwater volumes in the storm sewer system. Three of the four BMPs
(the Arlington-Hamline Underground Stormwater Storage Facility, eight in-street infiltration
trenches, and eight neighborhood raingardens), became operational in 2006 and 2007. The last
BMP of the project, a storage and retention pond on the Como Park Golf Course (Como Golf
Course Pond) became operational in October 2007.
Figure 6-1: The Como 7 monitoring station (left) and the Como Golf Course Pond Outlet (right).

Como
2014 CRWD Stormwater Monitoring Report 62
Figure 6-2: Map of the Como subwatershed and monitoring locations.

Como
2014 CRWD Stormwater Monitoring Report 63
Como 3
The 458.2 acre Como 3 subwatershed is located entirely within the City of Saint Paul just west of
Como Lake (Figure 6-2). It consists of park areas (namely Como Park and parts of the Como
Zoo and Como Town Amusement Park) and single-family homes (located off of the southwest
corner of the lake). All stormwater from the Como 3 subwatershed is directed to Como Lake via
an inlet to the lake located off of Como Blvd W. just north of the intersection with Gateway
Drive. This inlet has been monitored since 2009 for flow. A full water quality monitoring station
was installed in 2012. North of Como 3 is the Como 7 subwatershed, which also drains entirely
to Como Lake.
In 2002, CRWD developed the Como Lake Strategic Management Plan, which was written to
address management concerns of Como Lake, and develop goals to improve the water quality of
the lake. One important goal included reducing the amount of phosphorus entering the lake from
the surrounding watershed. CRWD monitors the Como 3 inlet to Como Lake to determine the
amount of phosphorus entering the lake via this specific part of the overall Como subwatershed,
and to determine if any improvements to water quality are observed as a result of BMPs
constructed within the subwatershed that aim to reduce phosphorus runoff.
Figure 6-3: The Como 3 monitoring station in summer (left) and during winter snowmelt grab sampling (right).

Como
2014 CRWD Stormwater Monitoring Report 64
6.2 2014 MONITORING SUMMARY – COMO 7
The Como 7 subwatershed has been monitored for discharge and water quality from 2005-2014.
Flow and water quality monitoring at this location generally occurs between the months of April
to November. During the winter months, snowmelt grab samples are taken when possible, but
neither level nor flow are recorded during this period.
Summaries of 2014 monitoring data collected and observed at Como 7 are listed below.
Monitoring efficiency at Como 7 is explained in Appendix B.
6.2.1 DISCHARGE – COMO 7
Total stormflow discharge: 14,034,808 cubic feet (Figure 6-4; Table 6-1)
Total illicit discharge: 40,164 cubic feet (Figure 6-4; Table 6-1)
Total annual discharge: 14,074,972 cubic feet (Figure 6-4; Table 6-1)
6.2.2 TOTAL SUSPENDED SOLIDS (TSS) – COMO 7
Stormflow and illicit discharge samples were analyzed for TSS concentrations in mg/L in order
to calculate event-based and total annual loads.
Stormflow flow weighted average concentration: 77 mg/L (Table 6-1)
Illicit discharge flow weighted average concentration: 12 mg/L (Table 6-1)
Total stormflow TSS load: 67,775 lbs (Figure 6-10; Table 6-1)
Total illicit discharge TSS load: 30 lbs (Figure 6-10; Table 6-1)
Total annual TSS load: 67,805 lbs (Figure 6-10; Table 6-1)
6.2.3 TOTAL PHOSPHORUS (TP) – COMO 7
Stormflow and illicit discharge samples were analyzed for TP concentrations in mg/L in order to
calculate event-based and total annual loads.
Stormflow flow weighted average concentration: 0.24 mg/L (Table 6-1)
Illicit discharge flow weighted average concentration: 0.21 mg/L (Table 6-1)
Total stormflow TP load: 213 lbs (Figure 6-10; Table 6-1)
Total illicit discharge TP load: <1 lb (Figure 6-10; Table 6-1)
Total annual TP load: 213 lbs (Figure 6-10; Table 6-1)

Discharge Como
2014 CRWD Stormwater Monitoring Report 65
Figure 6-4: Historical total monitored discharge volumes at Como 7 subwatershed for stormflow and illicit discharge from 2005-2014.
0
2,000,000
4,000,000
6,000,000
8,000,000
10,000,000
12,000,000
14,000,000
16,000,000
18,000,000
2005 2006 2007 2008 2009 2010 2011 2012 2013 2014
Dis
ch
arg
e (
cf)
Year
Illicit Discharge
Storm

Discharge Como
2014 CRWD Stormwater Monitoring Report 66
Figure 6-5: Como 7 subwatershed cumulative discharge and daily precipitation.

Discharge Como
2014 CRWD Stormwater Monitoring Report 67
Figure 6-6: Como 7 level, velocity, and discharge.

Discharge Como
2014 CRWD Stormwater Monitoring Report 68
Figure 6-7: Como 7 level, discharge, and precipitation.

Discharge Como
2014 CRWD Stormwater Monitoring Report 69
Figure 6-8: Golf Course Pond Outlet level, velocity, and discharge.

Discharge Como
2014 CRWD Stormwater Monitoring Report 70
Figure 6-9: Golf Course Pond Outlet level, discharge, and precipitation.

Total Suspended Solids Como
2014 CRWD Stormwater Monitoring Report 71
Figure 6-10: Historical total monitored TSS loads at Como 7 subwatershed for illicit discharge and stormflow from 2005-2014.
0
10,000
20,000
30,000
40,000
50,000
60,000
70,000
80,000
2005 2006 2007 2008 2009 2010 2011 2012 2013 2014
TS
S L
oa
d (
lbs
)
Year
Illicit Discharge
Storm

Total Suspended Solids Como
2014 CRWD Stormwater Monitoring Report 72
Figure 6-11: Monthly average storm sample TSS concentrations in 2014 for Como 7 subwatershed and historical averages (2008-2013).
n=
6
n=
9
n=
30
n=
33
n=
31
n=
24
n=
13
n=
23
n=
2
n=
1
n=
4
n=
5
n=
6
n=
4
n=
4
n=
1
n=
2
0
50
100
150
200
250
300
350
400
450
Jan Feb Mar Apr May Jun Jul Aug Sep Oct Nov Dec
TS
S C
on
cen
tra
tio
n (
mg
/L)
Month
Historical Average (2008-2013)
2014

Total Phosphorus Como
2014 CRWD Stormwater Monitoring Report 73
Figure 6-12: Historical total monitored TP loads at Como 7 subwatershed for illicit discharge and stormflow from 2005-2014.
0
50
100
150
200
250
2005 2006 2007 2008 2009 2010 2011 2012 2013 2014
TP
Lo
ad
(lb
s)
Year
Illicit Discharge
Storm

Total Phosphorus Como
2014 CRWD Stormwater Monitoring Report 74
Figure 6-13: Monthly average storm sample TP concentrations in 2014 for Como 7 subwatershed and historical averages (2008-2013).
n=
6
n=
9
n=
30
n=
33
n=
31
n=
24
n=
13
n=
23
n=
2
n=
1
n=
4
n=
5
n=
6
n=
4
n=
4
n=
1
n=
2
0.00
0.20
0.40
0.60
0.80
1.00
1.20
Jan Feb Mar Apr May Jun Jul Aug Sep Oct Nov Dec
TP
Co
nc
en
tra
tio
n (
mg
/L)
Month
Historical Average (2008-2013)
2014
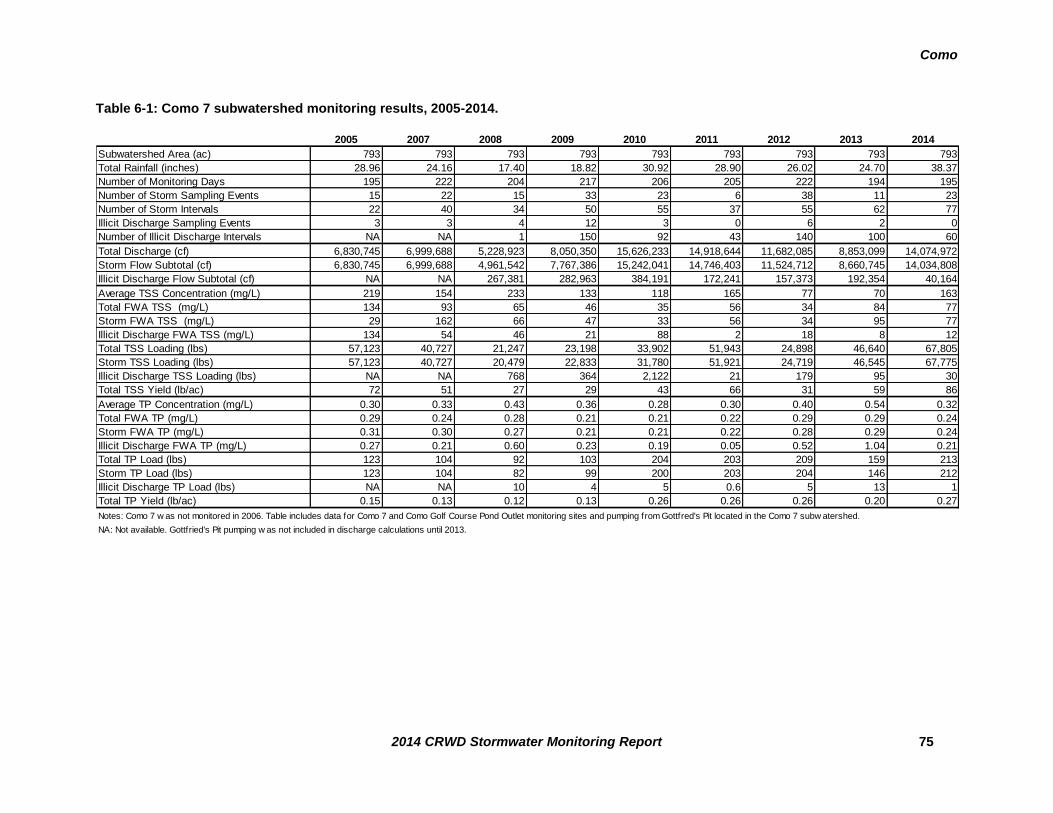
Como
2014 CRWD Stormwater Monitoring Report 75
Table 6-1: Como 7 subwatershed monitoring results, 2005-2014.
2005 2007 2008 2009 2010 2011 2012 2013 2014
Subwatershed Area (ac) 793 793 793 793 793 793 793 793 793
Total Rainfall (inches) 28.96 24.16 17.40 18.82 30.92 28.90 26.02 24.70 38.37
Number of Monitoring Days 195 222 204 217 206 205 222 194 195
Number of Storm Sampling Events 15 22 15 33 23 6 38 11 23
Number of Storm Intervals 22 40 34 50 55 37 55 62 77
Illicit Discharge Sampling Events 3 3 4 12 3 0 6 2 0
Number of Illicit Discharge Intervals NA NA 1 150 92 43 140 100 60
Total Discharge (cf) 6,830,745 6,999,688 5,228,923 8,050,350 15,626,233 14,918,644 11,682,085 8,853,099 14,074,972
Storm Flow Subtotal (cf) 6,830,745 6,999,688 4,961,542 7,767,386 15,242,041 14,746,403 11,524,712 8,660,745 14,034,808
Illicit Discharge Flow Subtotal (cf) NA NA 267,381 282,963 384,191 172,241 157,373 192,354 40,164
Average TSS Concentration (mg/L) 219 154 233 133 118 165 77 70 163
Total FWA TSS (mg/L) 134 93 65 46 35 56 34 84 77
Storm FWA TSS (mg/L) 29 162 66 47 33 56 34 95 77
Illicit Discharge FWA TSS (mg/L) 134 54 46 21 88 2 18 8 12
Total TSS Loading (lbs) 57,123 40,727 21,247 23,198 33,902 51,943 24,898 46,640 67,805
Storm TSS Loading (lbs) 57,123 40,727 20,479 22,833 31,780 51,921 24,719 46,545 67,775
Illicit Discharge TSS Loading (lbs) NA NA 768 364 2,122 21 179 95 30
Total TSS Yield (lb/ac) 72 51 27 29 43 66 31 59 86
Average TP Concentration (mg/L) 0.30 0.33 0.43 0.36 0.28 0.30 0.40 0.54 0.32
Total FWA TP (mg/L) 0.29 0.24 0.28 0.21 0.21 0.22 0.29 0.29 0.24
Storm FWA TP (mg/L) 0.31 0.30 0.27 0.21 0.21 0.22 0.28 0.29 0.24
Illicit Discharge FWA TP (mg/L) 0.27 0.21 0.60 0.23 0.19 0.05 0.52 1.04 0.21
Total TP Load (lbs) 123 104 92 103 204 203 209 159 213
Storm TP Load (lbs) 123 104 82 99 200 203 204 146 212
Illicit Discharge TP Load (lbs) NA NA 10 4 5 0.6 5 13 1
Total TP Yield (lb/ac) 0.15 0.13 0.12 0.13 0.26 0.26 0.26 0.20 0.27
Notes: Como 7 w as not monitored in 2006. Table includes data for Como 7 and Como Golf Course Pond Outlet monitoring sites and pumping from Gottfred's Pit located in the Como 7 subw atershed.
NA: Not available. Gottfried's Pit pumping w as not included in discharge calculations until 2013.

Como
2014 CRWD Stormwater Monitoring Report 76
6.3 2014 MONITORING SUMMARY – COMO 3
The Como 3 subwatershed has been monitored for discharge and water quality from 2012-2014.
Flow and water quality monitoring at this location generally occurs between the months of April
to November. During the winter months, snowmelt grab samples are taken when possible, but
neither level nor flow are recorded during this period.
Summaries of 2014 monitoring data collected and observed at Como 3 are listed below.
Monitoring efficiency at Como 3 is explained in Appendix B.
6.3.1 DISCHARGE – COMO 3
Total stormflow discharge: 4,980,597 cubic feet (Figure 6-14; Table 6-2)
Total annual discharge: 4,980,597 cubic feet (Figure 6-14;Table 6-2)
6.3.2 TOTAL SUSPENDED SOLIDS (TSS) – COMO 3
Stormflow samples were analyzed for TSS concentrations in mg/L in order to calculate event-
based and total annual loads.
Stormflow flow weighted average concentration: 194 mg/L (Table 6-2)
Total stormflow TSS load: 59,170 lbs (Figure 6-18;Table 6-2)
Total annual TSS load: 59,170 lbs (Figure 6-18;Table 6-2)
6.3.3 TOTAL PHOSPHORUS (TP) – COMO 3
Stormflow samples were analyzed for TP concentrations in mg/L in order to calculate event-
based and total annual loads.
Stormflow flow weighted average concentration: 0.23 mg/L (Table 6-2)
Total stormflow TP load: 71 lbs (Figure 6-20;Table 6-2)
Total annual TP load: 71 lbs (Figure 6-20;Table 6-2)

Discharge Como
2014 CRWD Stormwater Monitoring Report 77
Figure 6-14: Historical total monitored discharge volumes at Como 3 subwatershed for stormflow and illicit discharge from 2012-2014
3,800,000
4,000,000
4,200,000
4,400,000
4,600,000
4,800,000
5,000,000
5,200,000
2012 2013 2014
Dis
ch
arg
e (
cf)
Year
Illicit Discharge
Storm

Discharge Como
2014 CRWD Stormwater Monitoring Report 78
Figure 6-15: Como 3 cumulative discharge and daily precipitation.

Discharge Como
2014 CRWD Stormwater Monitoring Report 79
Figure 6-16: Como 3 level, velocity, and discharge.

Discharge Como
2014 CRWD Stormwater Monitoring Report 80
Figure 6-17: Como 3 level, discharge, and precipitation.

Total Suspended Solids Como
2014 CRWD Stormwater Monitoring Report 81
Figure 6-18: Historical total monitored TSS loads at Como 3 subwatershed for stormflow from 2012-2014.
0
10,000
20,000
30,000
40,000
50,000
60,000
70,000
2012 2013 2014
TS
S L
oa
d (
lbs
)
Year
Storm

Total Suspended Solids Como
2014 CRWD Stormwater Monitoring Report 82
Figure 6-19: Monthly average storm sample TSS concentrations in 2014 for Como 3 subwatershed and historical averages (2009-2014).
n=
2
n=
3
n=
15
n=
15
n=
12
n=
9
n=
5
n=
9
n=
1
n=
3
n=
5
n=
4
n=
3
n=
4
n=
1
0
100
200
300
400
500
600
700
Jan Feb Mar Apr May Jun Jul Aug Sep Oct Nov Dec
TS
S C
on
cen
trati
on
(m
g/L
)
Month
Historical Average (2009-2013)
2014

Total Phosphorus Como
2014 CRWD Stormwater Monitoring Report 83
Figure 6-20: Historical total monitored TP loads at Como 3 subwatershed for stormflow from 2012-2014.
0
10
20
30
40
50
60
70
80
90
100
2012 2013 2014
TP
Lo
ad
(lb
s)
Year
Storm
Storm

Total Phosphorus Como
2014 CRWD Stormwater Monitoring Report 84
Figure 6-21: Monthly average storm sample TP concentrations in 2014 for Como 3 subwatershed and historical averages (2009-2013).
n=
2
n=
3
n=
15
n=
15
n=
12
n=
9
n=
5
n=
9
n=
0
n=
1
n=
3
n=
5
n=
4
n=
3
n=
4
n=
1
n=
0
0.0
00
0.00
0.20
0.40
0.60
0.80
1.00
1.20
1.40
Jan Feb Mar Apr May Jun Jul Aug Sep Oct Nov Dec
TP
Co
nc
en
tra
tio
n (
mg
/L)
Month
Historical Average (2009-2013)
2014
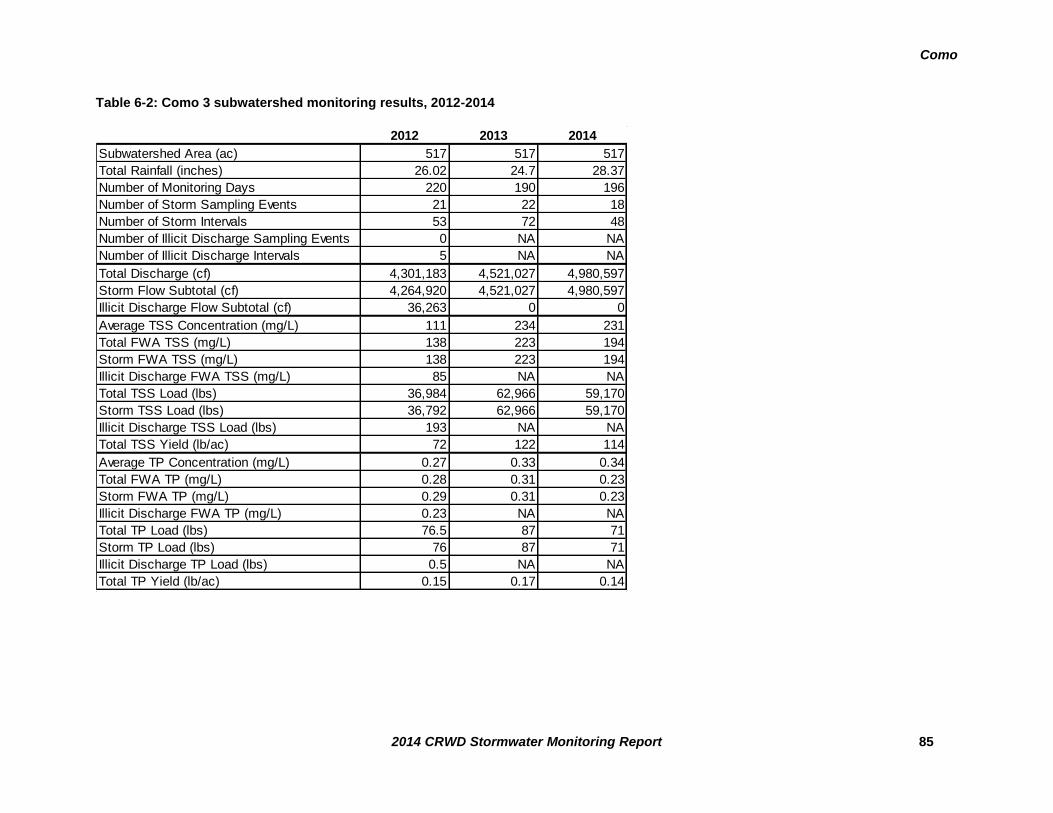
Como
2014 CRWD Stormwater Monitoring Report 85
Table 6-2: Como 3 subwatershed monitoring results, 2012-2014
2012 2013 2014
Subwatershed Area (ac) 517 517 517
Total Rainfall (inches) 26.02 24.7 28.37
Number of Monitoring Days 220 190 196
Number of Storm Sampling Events 21 22 18
Number of Storm Intervals 53 72 48
Number of Illicit Discharge Sampling Events 0 NA NA
Number of Illicit Discharge Intervals 5 NA NA
Total Discharge (cf) 4,301,183 4,521,027 4,980,597
Storm Flow Subtotal (cf) 4,264,920 4,521,027 4,980,597
Illicit Discharge Flow Subtotal (cf) 36,263 0 0
Average TSS Concentration (mg/L) 111 234 231
Total FWA TSS (mg/L) 138 223 194
Storm FWA TSS (mg/L) 138 223 194
Illicit Discharge FWA TSS (mg/L) 85 NA NA
Total TSS Load (lbs) 36,984 62,966 59,170
Storm TSS Load (lbs) 36,792 62,966 59,170
Illicit Discharge TSS Load (lbs) 193 NA NA
Total TSS Yield (lb/ac) 72 122 114
Average TP Concentration (mg/L) 0.27 0.33 0.34
Total FWA TP (mg/L) 0.28 0.31 0.23
Storm FWA TP (mg/L) 0.29 0.31 0.23
Illicit Discharge FWA TP (mg/L) 0.23 NA NA
Total TP Load (lbs) 76.5 87 71
Storm TP Load (lbs) 76 87 71
Illicit Discharge TP Load (lbs) 0.5 NA NA
Total TP Yield (lb/ac) 0.15 0.17 0.14
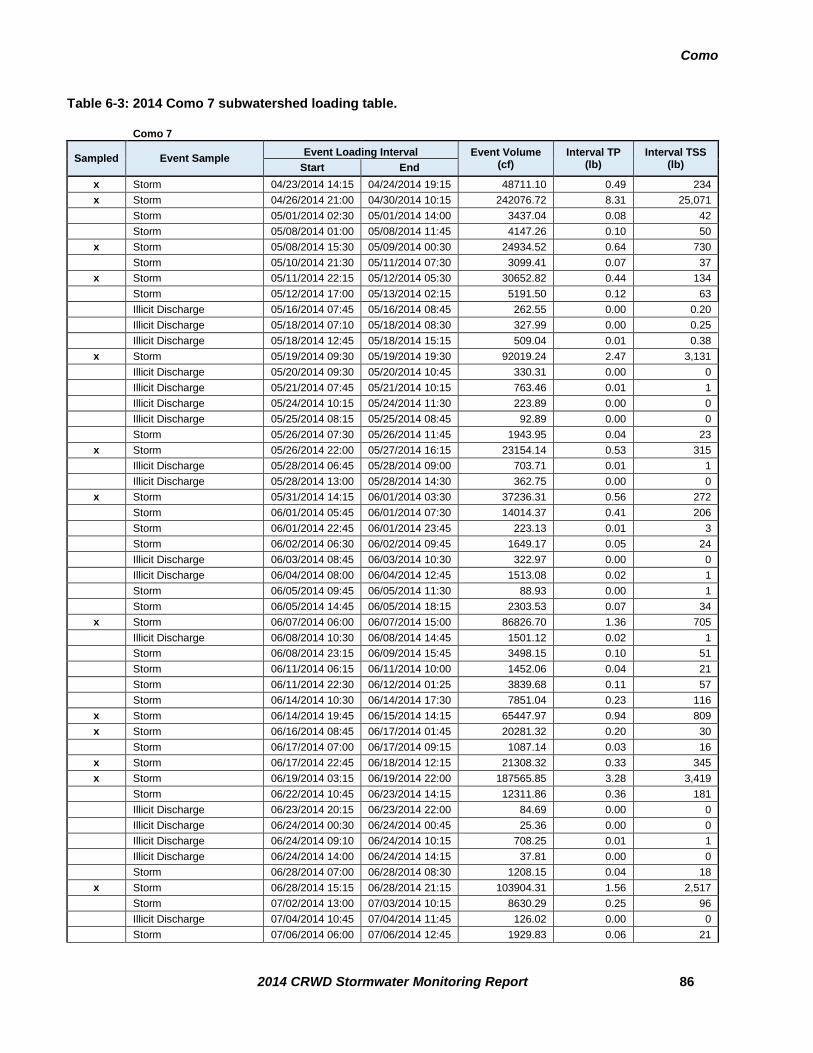
Como
2014 CRWD Stormwater Monitoring Report 86
Table 6-3: 2014 Como 7 subwatershed loading table.
Como 7
Sampled Event Sample Event Loading Interval Event Volume
(cf) Interval TP
(lb) Interval TSS
(lb) Start End
x Storm 04/23/2014 14:15 04/24/2014 19:15 48711.10 0.49 234
x Storm 04/26/2014 21:00 04/30/2014 10:15 242076.72 8.31 25,071
Storm 05/01/2014 02:30 05/01/2014 14:00 3437.04 0.08 42
Storm 05/08/2014 01:00 05/08/2014 11:45 4147.26 0.10 50
x Storm 05/08/2014 15:30 05/09/2014 00:30 24934.52 0.64 730
Storm 05/10/2014 21:30 05/11/2014 07:30 3099.41 0.07 37
x Storm 05/11/2014 22:15 05/12/2014 05:30 30652.82 0.44 134
Storm 05/12/2014 17:00 05/13/2014 02:15 5191.50 0.12 63
Illicit Discharge 05/16/2014 07:45 05/16/2014 08:45 262.55 0.00 0.20
Illicit Discharge 05/18/2014 07:10 05/18/2014 08:30 327.99 0.00 0.25
Illicit Discharge 05/18/2014 12:45 05/18/2014 15:15 509.04 0.01 0.38
x Storm 05/19/2014 09:30 05/19/2014 19:30 92019.24 2.47 3,131
Illicit Discharge 05/20/2014 09:30 05/20/2014 10:45 330.31 0.00 0
Illicit Discharge 05/21/2014 07:45 05/21/2014 10:15 763.46 0.01 1
Illicit Discharge 05/24/2014 10:15 05/24/2014 11:30 223.89 0.00 0
Illicit Discharge 05/25/2014 08:15 05/25/2014 08:45 92.89 0.00 0
Storm 05/26/2014 07:30 05/26/2014 11:45 1943.95 0.04 23
x Storm 05/26/2014 22:00 05/27/2014 16:15 23154.14 0.53 315
Illicit Discharge 05/28/2014 06:45 05/28/2014 09:00 703.71 0.01 1
Illicit Discharge 05/28/2014 13:00 05/28/2014 14:30 362.75 0.00 0
x Storm 05/31/2014 14:15 06/01/2014 03:30 37236.31 0.56 272
Storm 06/01/2014 05:45 06/01/2014 07:30 14014.37 0.41 206
Storm 06/01/2014 22:45 06/01/2014 23:45 223.13 0.01 3
Storm 06/02/2014 06:30 06/02/2014 09:45 1649.17 0.05 24
Illicit Discharge 06/03/2014 08:45 06/03/2014 10:30 322.97 0.00 0
Illicit Discharge 06/04/2014 08:00 06/04/2014 12:45 1513.08 0.02 1
Storm 06/05/2014 09:45 06/05/2014 11:30 88.93 0.00 1
Storm 06/05/2014 14:45 06/05/2014 18:15 2303.53 0.07 34
x Storm 06/07/2014 06:00 06/07/2014 15:00 86826.70 1.36 705
Illicit Discharge 06/08/2014 10:30 06/08/2014 14:45 1501.12 0.02 1
Storm 06/08/2014 23:15 06/09/2014 15:45 3498.15 0.10 51
Storm 06/11/2014 06:15 06/11/2014 10:00 1452.06 0.04 21
Storm 06/11/2014 22:30 06/12/2014 01:25 3839.68 0.11 57
Storm 06/14/2014 10:30 06/14/2014 17:30 7851.04 0.23 116
x Storm 06/14/2014 19:45 06/15/2014 14:15 65447.97 0.94 809
x Storm 06/16/2014 08:45 06/17/2014 01:45 20281.32 0.20 30
Storm 06/17/2014 07:00 06/17/2014 09:15 1087.14 0.03 16
x Storm 06/17/2014 22:45 06/18/2014 12:15 21308.32 0.33 345
x Storm 06/19/2014 03:15 06/19/2014 22:00 187565.85 3.28 3,419
Storm 06/22/2014 10:45 06/23/2014 14:15 12311.86 0.36 181
Illicit Discharge 06/23/2014 20:15 06/23/2014 22:00 84.69 0.00 0
Illicit Discharge 06/24/2014 00:30 06/24/2014 00:45 25.36 0.00 0
Illicit Discharge 06/24/2014 09:10 06/24/2014 10:15 708.25 0.01 1
Illicit Discharge 06/24/2014 14:00 06/24/2014 14:15 37.81 0.00 0
Storm 06/28/2014 07:00 06/28/2014 08:30 1208.15 0.04 18
x Storm 06/28/2014 15:15 06/28/2014 21:15 103904.31 1.56 2,517
Storm 07/02/2014 13:00 07/03/2014 10:15 8630.29 0.25 96
Illicit Discharge 07/04/2014 10:45 07/04/2014 11:45 126.02 0.00 0
Storm 07/06/2014 06:00 07/06/2014 12:45 1929.83 0.06 21
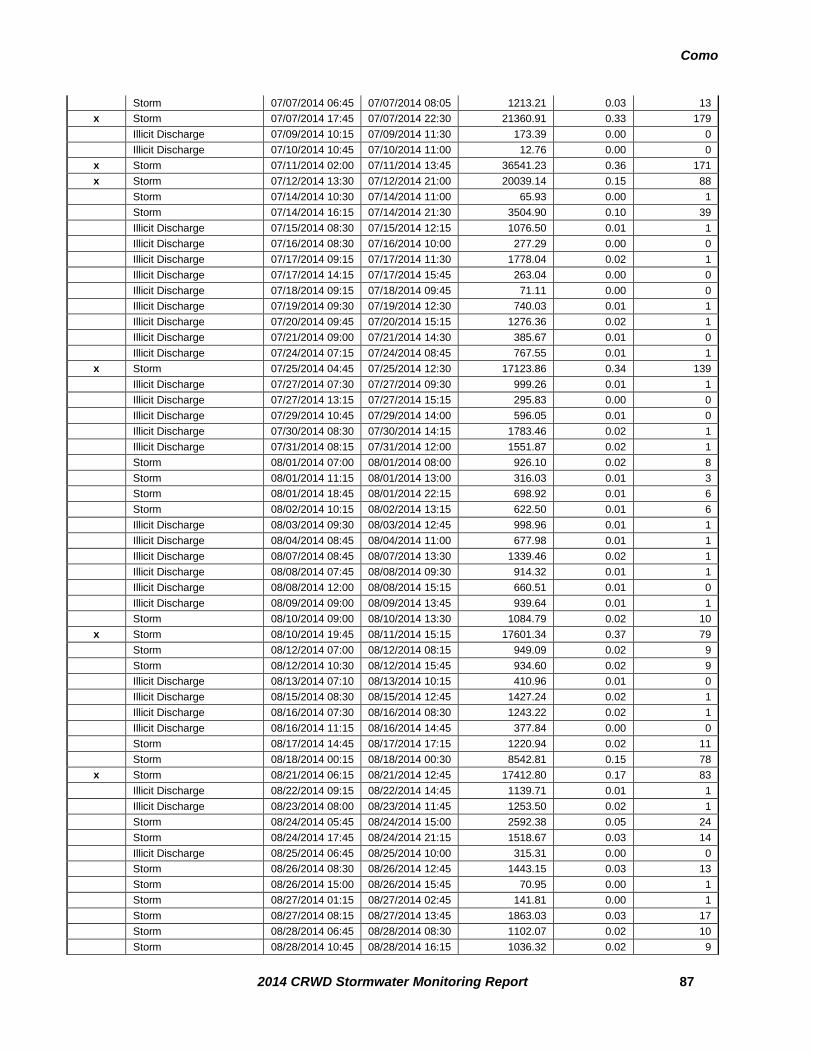
Como
2014 CRWD Stormwater Monitoring Report 87
Storm 07/07/2014 06:45 07/07/2014 08:05 1213.21 0.03 13
x Storm 07/07/2014 17:45 07/07/2014 22:30 21360.91 0.33 179
Illicit Discharge 07/09/2014 10:15 07/09/2014 11:30 173.39 0.00 0
Illicit Discharge 07/10/2014 10:45 07/10/2014 11:00 12.76 0.00 0
x Storm 07/11/2014 02:00 07/11/2014 13:45 36541.23 0.36 171
x Storm 07/12/2014 13:30 07/12/2014 21:00 20039.14 0.15 88
Storm 07/14/2014 10:30 07/14/2014 11:00 65.93 0.00 1
Storm 07/14/2014 16:15 07/14/2014 21:30 3504.90 0.10 39
Illicit Discharge 07/15/2014 08:30 07/15/2014 12:15 1076.50 0.01 1
Illicit Discharge 07/16/2014 08:30 07/16/2014 10:00 277.29 0.00 0
Illicit Discharge 07/17/2014 09:15 07/17/2014 11:30 1778.04 0.02 1
Illicit Discharge 07/17/2014 14:15 07/17/2014 15:45 263.04 0.00 0
Illicit Discharge 07/18/2014 09:15 07/18/2014 09:45 71.11 0.00 0
Illicit Discharge 07/19/2014 09:30 07/19/2014 12:30 740.03 0.01 1
Illicit Discharge 07/20/2014 09:45 07/20/2014 15:15 1276.36 0.02 1
Illicit Discharge 07/21/2014 09:00 07/21/2014 14:30 385.67 0.01 0
Illicit Discharge 07/24/2014 07:15 07/24/2014 08:45 767.55 0.01 1
x Storm 07/25/2014 04:45 07/25/2014 12:30 17123.86 0.34 139
Illicit Discharge 07/27/2014 07:30 07/27/2014 09:30 999.26 0.01 1
Illicit Discharge 07/27/2014 13:15 07/27/2014 15:15 295.83 0.00 0
Illicit Discharge 07/29/2014 10:45 07/29/2014 14:00 596.05 0.01 0
Illicit Discharge 07/30/2014 08:30 07/30/2014 14:15 1783.46 0.02 1
Illicit Discharge 07/31/2014 08:15 07/31/2014 12:00 1551.87 0.02 1
Storm 08/01/2014 07:00 08/01/2014 08:00 926.10 0.02 8
Storm 08/01/2014 11:15 08/01/2014 13:00 316.03 0.01 3
Storm 08/01/2014 18:45 08/01/2014 22:15 698.92 0.01 6
Storm 08/02/2014 10:15 08/02/2014 13:15 622.50 0.01 6
Illicit Discharge 08/03/2014 09:30 08/03/2014 12:45 998.96 0.01 1
Illicit Discharge 08/04/2014 08:45 08/04/2014 11:00 677.98 0.01 1
Illicit Discharge 08/07/2014 08:45 08/07/2014 13:30 1339.46 0.02 1
Illicit Discharge 08/08/2014 07:45 08/08/2014 09:30 914.32 0.01 1
Illicit Discharge 08/08/2014 12:00 08/08/2014 15:15 660.51 0.01 0
Illicit Discharge 08/09/2014 09:00 08/09/2014 13:45 939.64 0.01 1
Storm 08/10/2014 09:00 08/10/2014 13:30 1084.79 0.02 10
x Storm 08/10/2014 19:45 08/11/2014 15:15 17601.34 0.37 79
Storm 08/12/2014 07:00 08/12/2014 08:15 949.09 0.02 9
Storm 08/12/2014 10:30 08/12/2014 15:45 934.60 0.02 9
Illicit Discharge 08/13/2014 07:10 08/13/2014 10:15 410.96 0.01 0
Illicit Discharge 08/15/2014 08:30 08/15/2014 12:45 1427.24 0.02 1
Illicit Discharge 08/16/2014 07:30 08/16/2014 08:30 1243.22 0.02 1
Illicit Discharge 08/16/2014 11:15 08/16/2014 14:45 377.84 0.00 0
Storm 08/17/2014 14:45 08/17/2014 17:15 1220.94 0.02 11
Storm 08/18/2014 00:15 08/18/2014 00:30 8542.81 0.15 78
x Storm 08/21/2014 06:15 08/21/2014 12:45 17412.80 0.17 83
Illicit Discharge 08/22/2014 09:15 08/22/2014 14:45 1139.71 0.01 1
Illicit Discharge 08/23/2014 08:00 08/23/2014 11:45 1253.50 0.02 1
Storm 08/24/2014 05:45 08/24/2014 15:00 2592.38 0.05 24
Storm 08/24/2014 17:45 08/24/2014 21:15 1518.67 0.03 14
Illicit Discharge 08/25/2014 06:45 08/25/2014 10:00 315.31 0.00 0
Storm 08/26/2014 08:30 08/26/2014 12:45 1443.15 0.03 13
Storm 08/26/2014 15:00 08/26/2014 15:45 70.95 0.00 1
Storm 08/27/2014 01:15 08/27/2014 02:45 141.81 0.00 1
Storm 08/27/2014 08:15 08/27/2014 13:45 1863.03 0.03 17
Storm 08/28/2014 06:45 08/28/2014 08:30 1102.07 0.02 10
Storm 08/28/2014 10:45 08/28/2014 16:15 1036.32 0.02 9

Como
2014 CRWD Stormwater Monitoring Report 88
Storm 08/29/2014 03:30 08/29/2014 06:15 4704.01 0.09 43
x Storm 08/29/2014 10:00 08/30/2014 08:00 56581.96 1.01 653
Storm 08/30/2014 10:30 08/30/2014 15:30 1836.62 0.03 17
Storm 08/31/2014 01:45 08/31/2014 02:15 64.13 0.00 1
Storm 08/31/2014 09:30 08/31/2014 12:45 1311.15 0.02 12
Storm 08/31/2014 21:45 09/01/2014 15:15 25253.26 0.46 230
Illicit Discharge 09/02/2014 01:30 09/02/2014 02:30 134.17 0.00 0
Illicit Discharge 09/02/2014 12:00 09/02/2014 15:45 217.92 0.00 0
Storm 09/03/2014 08:00 09/03/2014 14:30 7213.67 0.18 71
Storm 09/03/2014 21:00 09/03/2014 22:15 3225.98 0.08 32
Storm 09/04/2014 06:45 09/04/2014 08:30 1249.33 0.03 12
Illicit Discharge 09/05/2014 09:15 09/05/2014 10:45 352.89 0.00 0
Illicit Discharge 09/08/2014 07:30 09/08/2014 08:30 1029.63 0.01 1
Storm 09/09/2014 10:30 09/09/2014 14:30 897.16 0.02 9
x Storm 09/09/2014 21:15 09/10/2014 12:45 54544.83 0.85 286
Illicit Discharge 09/12/2014 09:30 09/12/2014 11:30 372.21 0.00 0
Illicit Discharge 09/13/2014 10:45 09/13/2014 13:15 435.76 0.01 0
Illicit Discharge 09/14/2014 09:30 09/14/2014 13:15 866.53 0.01 1
Storm 09/15/2014 06:45 09/15/2014 13:15 2096.31 0.05 21
Illicit Discharge 09/16/2014 08:30 09/16/2014 12:15 868.56 0.01 1
Illicit Discharge 09/19/2014 07:00 09/19/2014 08:45 839.34 0.01 1
Storm 09/20/2014 17:45 09/20/2014 20:15 7711.01 0.19 76
Illicit Discharge 09/23/2014 09:15 09/23/2014 11:45 663.67 0.01 0
Storm 09/24/2014 10:30 09/24/2014 17:00 2273.60 0.06 22
Illicit Discharge 09/26/2014 07:00 09/26/2014 08:30 936.58 0.01 1
Illicit Discharge 09/26/2014 11:15 09/26/2014 15:15 1142.45 0.01 1
Illicit Discharge 09/27/2014 10:45 09/27/2014 13:00 472.15 0.01 0
Illicit Discharge 09/28/2014 11:00 09/28/2014 12:15 189.11 0.00 0
Storm 09/29/2014 08:45 09/29/2014 13:30 2938.92 0.07 29
x Storm 10/01/2014 07:45 10/01/2014 17:45 23900.84 0.36 36
x Storm 10/02/2014 11:15 10/02/2014 23:30 24081.52 0.27 32
Storm 10/03/2014 23:15 10/04/2014 05:45 5443.13 0.11 35
Storm 10/23/2014 03:00 10/23/2014 05:30 1266.79 0.03 8
Illicit Discharge Subtotal 40,164 1 30
Storm Subtotal 1,448,547 30 41,416
Total 1,488,711 30 41,446
Como Golf Course Pond
Sampled Event Sample Event Loading Interval Event Volume
(cf) Interval TP
(lb) Interval TSS
(lb) Start End
Storm 04/18/2014 13:30 04/22/2014 15:30 181,798 2.84 908
Storm 04/23/2014 17:20 05/03/2014 06:40 2,229,370 34.79 11,134
Storm 05/08/2014 16:05 05/15/2014 14:35 789,660 11.34 596
Storm 05/19/2014 11:15 05/23/2014 14:55 874,166 12.55 660
Storm 05/27/2014 05:20 05/30/2014 00:30 180,554 2.59 136
Storm 05/31/2014 20:35 06/05/2014 13:00 701,073 10.07 530
Storm 06/05/2014 15:55 06/06/2014 01:00 474 0.01 1
Storm 06/07/2014 07:55 06/11/2014 20:05 640,742 11.20 1,320
Storm 06/11/2014 23:50 06/12/2014 22:25 5,998 0.10 12
Storm 06/14/2014 14:20 06/25/2014 21:45 2,704,570 47.27 5,572
Storm 06/27/2014 09:10 07/02/2014 06:45 739,230 12.92 1,523
Storm 07/07/2014 18:20 07/10/2014 18:25 263,174 2.79 345
Storm 07/11/2014 08:10 07/16/2014 00:00 679,792 7.21 891
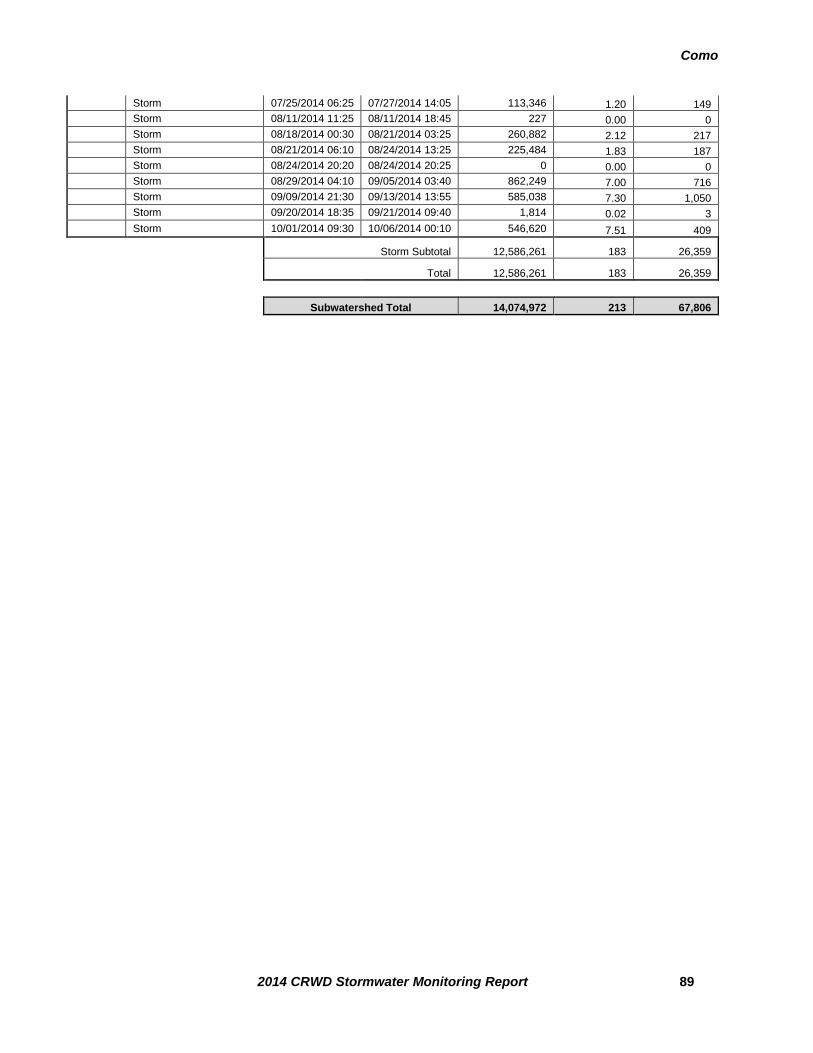
Como
2014 CRWD Stormwater Monitoring Report 89
Storm 07/25/2014 06:25 07/27/2014 14:05 113,346 1.20 149
Storm 08/11/2014 11:25 08/11/2014 18:45 227 0.00 0
Storm 08/18/2014 00:30 08/21/2014 03:25 260,882 2.12 217
Storm 08/21/2014 06:10 08/24/2014 13:25 225,484 1.83 187
Storm 08/24/2014 20:20 08/24/2014 20:25 0 0.00 0
Storm 08/29/2014 04:10 09/05/2014 03:40 862,249 7.00 716
Storm 09/09/2014 21:30 09/13/2014 13:55 585,038 7.30 1,050
Storm 09/20/2014 18:35 09/21/2014 09:40 1,814 0.02 3
Storm 10/01/2014 09:30 10/06/2014 00:10 546,620 7.51 409
Storm Subtotal 12,586,261 183 26,359
Total 12,586,261 183 26,359
Subwatershed Total 14,074,972 213 67,806

Como
2014 CRWD Stormwater Monitoring Report 90
Table 6-4: 2014 Como 3 loading table.
Sampled Event Sample Event Loading Interval Event Volume
(cf) Interval TP
(lb) Interval TSS
(lb) Start End
Storm 04/23/2014 14:45 04/24/2014 01:45 22,055 0.36 268
x Storm 04/24/2014 05:00 04/24/2014 21:00 113,922 1.35 839
x Storm 04/26/2014 21:00 04/30/2014 14:45 958,773 11.37 10,504
Storm 05/01/2014 02:00 05/01/2014 11:30 6,775 0.12 33
x Storm 05/08/2014 07:45 05/08/2014 23:15 89,821 3.81 3,387
Storm 05/10/2014 21:30 05/11/2014 00:30 3,583 0.06 17
x Storm 05/11/2014 21:45 05/12/2014 10:30 110,822 3.74 450
Storm 05/12/2014 16:45 05/13/2014 01:15 16,931 0.30 82
x Storm 05/19/2014 10:30 05/20/2014 21:30 342,831 5.99 7,255
x Storm 05/27/2014 03:15 05/27/2014 14:00 109,353 1.23 464
x Storm 05/31/2014 14:30 06/02/2014 11:30 288,203 1.80 1,547
Storm 06/05/2014 15:15 06/05/2014 18:30 7,546 0.08 54
x Storm 06/07/2014 07:30 06/09/2014 01:30 168,770 2.11 1,243
Storm 06/11/2014 23:30 06/12/2014 05:00 17,734 0.20 126
x Storm 06/14/2014 10:45 06/16/2014 11:15 249,049 2.64 1,042
Storm 06/16/2014 17:15 06/17/2014 13:15 57,901 0.65 411
x Storm 06/18/2014 02:45 06/20/2014 01:45 669,078 10.86 16,665
Storm 06/22/2014 11:00 06/22/2014 14:00 22,138 0.25 157
x Storm 06/28/2014 15:45 06/29/2014 03:45 258,163 3.87 3,384
Storm 07/06/2014 06:45 07/06/2014 09:45 4,133 0.06 22
x Storm 07/07/2014 18:00 07/07/2014 23:15 76,732 1.44 627
x Storm 07/11/2014 07:45 07/11/2014 16:00 172,426 1.51 818
x Storm 07/12/2014 13:15 07/13/2014 00:00 130,513 1.47 1,255
Storm 07/14/2014 16:15 07/14/2014 21:00 8,860 0.13 48
Storm 07/25/2014 05:00 07/25/2014 10:00 36,970 0.55 199
x Storm 08/10/2014 21:45 08/11/2014 04:30 66,121 0.95 842
Storm 08/11/2014 07:15 08/11/2014 14:45 11,702 0.16 79
Storm 08/17/2014 15:45 08/17/2014 17:15 1,749 0.02 12
Storm 08/17/2014 19:30 08/17/2014 20:45 1,073 0.01 7
x Storm 08/18/2014 00:00 08/18/2014 05:00 95,955 1.14 1,138
Storm 08/21/2014 05:30 08/21/2014 11:15 32,965 0.45 222
Storm 08/24/2014 05:45 08/24/2014 08:15 3,950 0.05 27
Storm 08/24/2014 17:45 08/24/2014 21:00 13,369 0.18 90
Storm 08/29/2014 03:30 08/29/2014 06:30 10,069 0.14 68
Storm 08/29/2014 10:00 08/29/2014 12:45 5,153 0.07 35
x Storm 08/29/2014 16:45 08/30/2014 08:15 184,282 2.76 2,864
Storm 08/31/2014 21:45 09/01/2014 07:00 61,769 0.85 416
Storm 09/03/2014 09:00 09/03/2014 14:00 15,226 0.29 53
Storm 09/03/2014 21:15 09/04/2014 00:00 5,722 0.11 20
x Storm 09/09/2014 21:15 09/10/2014 11:45 158,021 3.26 1,845
Storm 09/15/2014 07:15 09/15/2014 10:00 3,168 0.06 11
Storm 09/20/2014 17:45 09/20/2014 22:45 24,916 0.47 87
Storm 09/24/2014 14:45 09/24/2014 17:30 6,339 0.12 22
Storm 09/29/2014 10:00 09/29/2014 13:15 8,995 0.17 31
Storm 10/01/2014 07:45 10/01/2014 18:15 99,711 1.43 171
Storm 10/02/2014 12:45 10/03/2014 03:00 106,998 1.54 184
Storm 10/03/2014 23:45 10/04/2014 07:00 23,854 0.34 41
Storm 10/23/2014 03:15 10/23/2014 05:45 3,367 0.05 6
Storm Subtotal 4,887,554 71 59,170
Total 4,887,554 71 59,170
TOTAL ANNUAL 4,887,554 71 59,170

Como
2014 CRWD Stormwater Monitoring Report 91
Table 6-5: 2014 Como 7 subwatershed laboratory data.
Sample Sampling Start Sampling End Ortho-P Cl Cd Cr Cu Pb Ni Zn NH3 TKN Total P NO3 NO2 TDS TSS VSS Hardness CBOD SO4 E. coli Dissolved P
Type Date/Time Date/Time mg/L mg/L mg/L mg/L mg/L mg/L mg/L mg/L mg/L mg/L mg/L mg/L mg/L mg/L mg/L mg/L mg/L mg/L mg/L mpn/100 mL mg/L
Snow melt Grab 02/19/2014 13:35 02/19/2014 13:35 0.139 8,302.6 0.00100 0.01420 0.02840 0.01030 0.00820 0.12800 2.280 9.7 0.50 0.50 0.26 13,600 120 80 320 - - - 0.194
Snow melt Grab 03/10/2014 13:40 03/10/2014 13:40 0.218 1,724.8 0.00025 0.01390 0.02760 0.01200 0.00700 0.15200 2.110 12.0 0.55 0.44 0.17 2,900 184 88 140 - - 17,300 0.266
Snow melt Grab 03/13/2014 12:50 03/13/2014 12:50 0.464 1,610.2 0.00040 0.00550 0.01780 0.00690 0.00450 0.09150 2.290 6.6 0.88 0.47 0.17 2,890 73 36 136 - - 24,200 0.526
Snow melt Grab 03/20/2014 13:40 03/20/2014 13:40 - 419.2 0.00040 0.00810 0.01670 0.00990 0.00470 0.09000 0.570 5.3 0.55 0.45 0.10 772 96 48 36 - - - 0.226
Storm Grab 03/27/2014 13:15 03/27/2014 13:15 0.375 148.0 0.00025 0.01860 0.04120 0.01900 0.01270 0.18000 1.170 6.7 1.14 0.64 0.08 368 392 160 48 - - 13,000 0.418
Storm Composite 04/24/2014 07:31 04/24/2014 13:46 0.005 4.5 0.00020 0.00280 0.00630 0.00430 0.00160 0.04380 0.570 1.2 0.16 0.33 0.03 48 77 42 20 - - - 0.058
Storm Grab 04/24/2014 08:25 04/24/2014 08:25 - - - - - - - - - - - - - - - - - - - 3,000 -
Storm Composite 04/27/2014 04:16 04/27/2014 07:01 0.052 3.2 0.00020 0.00240 0.00630 0.00480 0.00170 0.04350 0.470 1.2 0.13 0.28 0.03 36 127 43 32 - - - 0.053
Storm Composite 04/27/2014 10:01 04/27/2014 11:47 0.050 2.7 0.00020 0.00480 0.01010 0.01010 0.00310 0.07410 0.390 1.9 0.32 0.17 0.03 34 - 192 44 - - - 0.030
Storm Composite 04/28/2014 12:16 04/29/2014 03:31 0.031 2.4 0.00020 0.00240 0.00490 0.00450 0.00160 0.03630 0.160 0.8 0.11 0.20 0.03 39 61 24 16 - - - 0.032
Storm Composite 05/08/2014 16:16 05/08/2014 17:01 0.035 2.6 0.00020 0.00880 0.01850 0.02090 0.00590 0.11700 0.800 3.8 0.41 0.36 0.03 29 469 156 32 - - - 0.046
Storm Composite 05/11/2014 23:02 05/12/2014 02:31 0.032 2.5 0.00020 0.00190 0.00650 0.00440 0.00180 0.05030 0.170 1.3 0.23 0.11 0.03 35 70 26 20 - - - 0.079
Storm Grab 05/19/2014 11:00 05/19/2014 11:00 - - - - - - - - - - - - - - - - - - - 3,000
Storm Composite 05/19/2014 11:01 05/19/2014 13:17 0.051 2.0 0.00031 0.00790 0.01690 0.01980 0.00510 0.12700 0.320 2.6 0.43 0.27 0.03 42 545 102 26 - - - 0.088
Storm Composite 05/27/2014 03:46 05/27/2014 06:46 0.031 2.2 0.00020 0.00250 0.00850 0.00490 0.00200 0.05780 0.230 2.4 0.37 0.20 0.03 48 218 90 24 - - - 0.048
Storm Composite 05/31/2014 20:31 06/01/2014 07:46 0.048 2.0 0.00020 0.00260 0.00610 0.00590 0.00200 0.05680 0.100 1.2 0.24 0.18 0.03 35 117 52 22 - - - 0.059
Storm Composite 06/07/2014 08:01 06/07/2014 08:52 2.2 0.00020 0.00190 0.00370 0.00470 0.00130 0.02860 0.250 1.5 0.25 0.21 0.03 33 130 53 30 - - - 0.076
Storm Composite 06/14/2014 20:31 06/15/2014 02:46 0.033 2.0 0.00020 0.00210 0.00650 0.00680 0.00170 0.03540 0.100 1.3 0.23 0.18 0.05 32 198 94 14 - - - 0.032
Storm Composite 06/16/2014 17:31 06/16/2014 21:16 0.031 4.3 0.00020 0.00120 0.00410 0.00260 0.00110 0.02280 0.030 1.2 0.16 0.14 0.03 46 24 13 30 - - - 0.038
Storm Composite 06/18/2014 03:12 06/18/2014 03:31 0.030 2.2 0.00020 0.00330 0.00800 0.01050 0.00290 0.05340 0.190 1.6 0.25 0.17 0.03 36 259 108 20 - - - 0.051
Storm Composite 06/19/2014 03:42 06/19/2014 04:40 0.036 2.1 0.00020 0.00500 0.01050 0.01390 0.00420 0.06340 0.120 1.4 0.28 0.17 0.03 44 292 92 18 - - - 0.049
Storm Grab 06/19/2014 08:30 06/19/2014 08:30 - - - - - - - - - - - - - - - - - - - 19,700 -
Storm Composite 06/28/2014 16:16 06/28/2014 18:03 - 2.0 0.00020 0.00330 0.01000 0.01080 0.00250 0.05230 0.180 1.4 0.24 0.12 0.03 38 388 63 24 - - - 0.072
Storm Composite 07/07/2014 18:16 07/07/2014 19:16 0.061 2.4 0.00020 0.00330 0.00930 0.00810 0.00240 0.04810 0.140 1.7 0.25 0.26 0.03 35 134 46 28 - - - 0.072
Storm Grab 07/11/2014 08:37 07/11/2014 08:37 - - - - - - - - - - - - - - - - - - - 6,300 -
Storm Composite 07/11/2014 08:31 07/11/2014 10:01 0.054 2.0 0.00020 0.00180 0.00490 0.00340 0.00130 0.02510 0.190 1.1 0.16 0.10 0.03 25 75 32 24 - - - 0.051
Storm Grab 07/12/2014 13:46 07/12/2014 15:46 0.046 2.0 0.00020 0.00220 0.00470 0.00300 0.00110 0.02410 0.240 0.9 0.12 0.20 0.03 29 70 38 24 - - - 0.043
Storm Composite 07/25/2014 05:31 07/25/2014 07:01 - 8.8 0.00020 0.00240 0.01050 0.00600 0.00250 0.06430 0.080 2.3 0.32 0.44 0.07 74 130 69 34 - - - 0.106
Storm Composite 08/10/2014 22:16 08/11/2014 02:01 0.064 4.7 0.00020 0.00300 0.01210 0.00670 0.00250 0.07130 0.220 2.4 0.34 0.43 0.04 59 72 32 22 - - - 0.090
Storm Grab 08/21/2014 08:10 08/21/2014 08:10 - - - - - - - - - - - - - - - - - - - 34,500 -
Storm Composite 08/21/2014 06:31 08/21/2014 09:01 0.052 4.2 0.00020 0.00220 0.00630 0.00660 0.00150 0.06010 0.170 1.0 0.16 0.41 0.04 52 76 36 20 - - - 0.068
Storm Composite 08/29/2014 17:16 08/29/2014 18:05 - 2.0 0.00020 0.00460 0.01160 0.01260 0.00300 0.07300 0.150 1.5 0.34 0.23 0.03 28 226 91 20 - - - 0.084
Storm Composite 08/30/2014 01:01 08/30/2014 03:16 - 2.0 0.00020 0.00320 0.00930 0.01070 0.00220 0.05470 0.080 1.2 0.23 0.15 0.03 24 144 44 28 - - - 0.085
Storm Composite 09/09/2014 21:32 09/10/2014 00:31 0.109 3.0 0.00020 0.00330 0.01200 0.01430 0.00240 0.05530 0.120 1.3 0.25 0.26 0.03 37 84 29 18 5.2 1.4 - 0.174
Storm Grab 10/01/2014 09:45 10/01/2014 09:45 - - - - - - - - - - - - - - - - - - - 10,800 -
Storm Composite 10/01/2014 08:31 10/01/2014 13:16 0.103 3.4 0.00020 0.00120 0.00510 0.00150 0.00110 0.02650 0.170 0.9 0.24 0.11 0.03 33 24 18 24 - - - 0.128
Storm Composite 10/02/2014 13:31 10/02/2014 19:46 0.066 2.0 0.00020 0.00160 0.00480 0.00330 0.00100 0.02520 0.050 0.9 0.18 0.05 0.03 27 21 14 28 - - - 0.086
Snow melt Average 0.274 3,014.2 0.00051 0.01043 0.02263 0.00978 0.00610 0.11538 1.813 8.4 0.62 0.47 0.18 5,041 118 63 158 - - 20,750 0.303
Storm Average 0.063 8.3 0.00021 0.00371 0.00958 0.00830 0.00267 0.05816 0.254 1.7 0.28 0.24 0.03 51 170 65 26 5.2 1.4 12,900 0.082
Annual Average 0.089 396.1 0.00025 0.00458 0.01126 0.00849 0.00312 0.06554 0.455 2.6 0.32 0.27 0.05 694 163 65 43 5.2 1.4 14,644 0.111
Annual Maximum 0.464 8,302.6 0.00100 0.01860 0.04120 0.02090 0.01270 0.18000 2.290 12.0 1.14 0.64 0.26 13,600 545 192 320 5.2 1.4 34,500 0.526
Annual Minimum 0.005 2.0 0.00020 0.00120 0.00370 0.00150 0.00100 0.02280 0.030 0.8 0.11 0.05 0.03 24 21 13 14 5.2 1.4 3,000 0.030
Annual Median 0.051 2.5 0.00020 0.00300 0.00930 0.00680 0.00240 0.05530 0.190 1.4 0.25 0.21 0.03 37 124 48 24 5.2 1.4 13,000 0.072
Actual number less than value (<)
Estimated concentration above the adjusted method detection limit and below the adjusted reporting limit.
- Not collected

Como
2014 CRWD Stormwater Monitoring Report 92

Como
2014 CRWD Stormwater Monitoring Report 93
Table 6-6: 2014 Como 3 subwatershed laboratory data.
Sample Sampling Start Sampling End Ortho-P Cl Cd Cr Cu Pb Ni Zn NH3 TKN Total P NO3 NO2 TDS TSS VSS Hardness CBOD SO4 E. coli Dissolved P
Type Date/Time Date/Time mg/L mg/L mg/L mg/L mg/L mg/L mg/L mg/L mg/L mg/L mg/L mg/L mg/L mg/L mg/L mg/L mg/L mg/L mg/L mpn/100 mL mg/L
Snow melt Grab 02/18/2014 14:00 02/18/2014 14:00 0.025 18,622.2 0.00100 0.04050 0.05800 0.02540 0.01510 0.49700 2.840 8.9 0.43 0.65 0.30 29,300 260 135 168 - - 6,870 0.077
Snow melt Grab 03/10/2014 13:00 03/10/2014 13:00 0.210 1,702.2 0.00035 0.03380 0.05660 0.02420 0.01480 0.35600 1.770 6.9 0.61 0.45 0.19 2,800 456 200 144 - - 1,120 0.237
Snow melt Grab 03/13/2014 13:00 03/13/2014 13:00 0.303 1,060.9 0.00040 0.01400 0.03250 0.01350 0.00850 0.17100 1.170 5.2 0.62 0.14 0.14 1,950 194 79 96 - - 780 0.336
Snow melt Grab 03/20/2014 14:00 03/20/2014 14:00 - 780.4 0.00020 0.02460 0.04650 0.02120 0.01510 0.24200 0.620 5.9 0.64 0.42 0.11 1,400 396 156 80 - - - 0.174
Storm Grab 03/27/2014 13:30 03/27/2014 13:30 0.302 171.4 0.00040 0.04470 0.09150 0.02400 0.02740 0.63700 1.050 7.7 1.24 0.57 0.10 406 616 228 48 - - 4,110 0.339
Storm Composite 04/24/2014 07:30 04/24/2014 13:00 0.047 14.2 0.00020 0.01100 0.01450 0.00970 0.00410 0.07980 0.500 1.5 0.19 0.38 0.03 74 118 42 32 - - - 0.053
Storm Grab 04/24/2014 08:35 04/24/2014 08:35 - - - - - - - - - - - - - - - - - - - 3,100 -
Storm Composite 04/27/2014 04:30 04/27/2014 12:17 0.040 7.8 0.00020 0.01000 0.01670 0.01760 0.00540 0.09170 0.440 1.8 0.27 0.28 0.03 51 279 66 26 - - - 0.035
Storm Composite 04/28/2014 10:01 04/29/2014 04:45 0.026 5.4 0.00020 0.00740 0.00860 0.00790 0.00280 0.05870 0.160 0.8 0.11 0.17 0.03 42 72 19 28 - - - 0.072
Storm Composite 05/08/2014 16:16 05/08/2014 17:15 0.037 6.6 0.00025 0.02210 0.03990 0.04200 0.01110 0.24700 1.100 4.4 0.68 0.43 0.04 51 604 136 42 - - - 0.059
Storm Composite 05/11/2014 23:16 05/12/2014 02:30 0.030 5.9 0.00020 0.00400 0.01030 0.00920 0.00270 0.06020 0.160 2.5 0.54 0.15 0.03 45 65 20 26 - - - 0.063
Storm Composite 05/19/2014 11:30 05/19/2014 13:04 0.047 4.2 0.00020 0.01160 0.01580 0.02080 0.00470 0.08520 0.300 1.6 0.28 0.19 0.03 47 339 62 28 - - - 0.069
Storm Grab 05/19/2014 11:35 05/19/2014 11:35 - - - - - - - - - - - - - - - - - - - 770 -
Storm Composite 05/27/2014 04:01 05/27/2014 08:30 0.028 3.9 0.00020 0.00420 0.00700 0.00620 0.00170 0.04190 0.290 1.2 0.18 0.22 0.03 44 68 22 20 - - - 0.043
Storm Composite 05/31/2014 22:46 06/01/2014 07:31 0.033 2.7 0.00020 0.00360 0.00630 0.00800 0.00190 0.04560 0.200 0.9 0.10 0.22 0.03 30 86 22 22 - - - 0.040
Storm Composite 06/07/2014 08:01 06/07/2014 09:15 - 3.3 0.00020 0.00440 0.00730 0.00850 0.00210 0.03490 0.230 1.1 0.20 0.22 0.03 34 118 28 30 - - - 0.035
Storm Composite 06/14/2014 20:31 06/15/2014 05:45 0.022 2.4 0.00020 0.00430 0.00740 0.01060 0.00220 0.03820 0.080 1.0 0.17 0.19 0.03 38 67 20 20 - - - 0.020
Storm Composite 06/19/2014 04:03 06/19/2014 04:52 0.029 2.8 0.00020 0.00510 0.01270 0.02290 0.00410 0.05710 0.130 1.3 0.26 0.14 0.03 42 399 55 22 - - - 0.044
Storm Grab 06/19/2014 08:45 06/19/2014 08:45 - - - - - - - - - - - - - - - - - - - 4,100 -
Storm Composite 06/28/2014 14:46 06/28/2014 18:30 0.051 4.0 0.00020 0.00810 0.01370 0.02210 0.00420 0.06680 0.190 1.0 0.24 0.16 0.03 40 210 45 26 - - - 0.058
Storm Composite 07/07/2014 18:31 07/07/2014 18:47 0.041 4.6 0.00020 0.01090 0.01670 0.01890 0.00380 0.08140 0.120 1.8 0.30 0.23 0.03 43 131 32 32 - - - 0.045
Storm Composite 07/11/2014 08:46 07/11/2014 09:46 0.056 2.4 0.00020 0.00760 0.00760 0.00750 0.00180 0.03500 0.090 0.7 0.14 0.10 0.03 22 76 19 36 - - - 0.057
Storm Grab 07/11/2014 08:56 07/11/2014 08:56 - - - - - - - - - - - - - - - - - - - 4,100 -
Storm Composite 07/12/2014 13:46 07/12/2014 14:02 0.038 2.3 0.00020 0.01030 0.00980 0.01290 0.00290 0.04530 0.200 1.1 0.18 0.18 0.03 33 154 48 26 - - - 0.041
Storm Composite 08/10/2014 20:16 08/10/2014 22:45 0.121 12.6 0.00020 0.00960 0.02480 0.02380 0.00700 0.13500 0.210 1.2 0.23 0.66 0.03 81 204 68 32 - - - 0.133
Storm Composite 08/18/2014 00:31 08/18/2014 01:01 0.057 2.8 0.00020 0.00340 0.01020 0.01660 0.00280 0.05400 0.190 1.1 0.19 0.19 0.03 35 190 40 32 - - - 0.072
Storm Grab 08/21/2014 08:20 08/21/2014 08:20 - - - - - - - - - - - - - - - - - - - 11,000 -
Storm Composite 08/29/2014 17:17 08/29/2014 18:04 - 2.0 0.00020 0.01290 0.01810 0.02730 0.00540 0.09270 0.120 1.4 0.28 0.25 0.03 41 428 158 44 - - - 0.053
Storm Composite 08/30/2014 01:31 08/30/2014 02:31 - 2.3 0.00020 0.00310 0.00850 0.01380 0.00230 0.04180 0.060 1.1 0.20 0.13 0.03 17 70 14 36 - - - 0.056
Storm Composite 09/09/2014 21:31 09/09/2014 23:16 0.103 3.3 0.00020 0.00800 0.01830 0.02970 0.00680 0.12800 0.130 1.8 0.33 0.30 0.03 37 187 38 32 7.2 2.0 - 0.098
Storm Grab 10/01/2014 10:00 10/01/2014 10:00 - - - - - - - - - - - - - - - - - - - 13,400 -
Snow melt Average 0.179 5,541.4 0.00049 0.02823 0.04840 0.02108 0.01338 0.31650 1.600 6.7 0.58 0.42 0.19 8,863 327 143 122 - - 2,923 0.206
Storm Average 0.062 12.7 0.00021 0.00982 0.01741 0.01714 0.00510 0.10273 0.283 1.8 0.30 0.26 0.03 60 213 56 30 7.2 2.0 5,797 0.071
Annual Average 0.078 897.3 0.00026 0.01277 0.02237 0.01777 0.00643 0.13693 0.494 2.6 0.34 0.28 0.06 1,468 231 70 45 7.2 2.0 4,935 0.092
Annual Maximum 0.303 18,622.2 0.00100 0.04470 0.09150 0.04200 0.02740 0.63700 2.840 8.9 1.24 0.66 0.30 29,300 616 228 168 7.2 2.0 13,400 0.339
Annual Minimum 0.022 2.0 0.00020 0.00310 0.00630 0.00620 0.00170 0.03490 0.060 0.7 0.10 0.10 0.03 17 65 14 20 7.2 2.0 770 0.020
Annual Median 0.041 4.2 0.00020 0.00960 0.01450 0.01760 0.00410 0.07980 0.200 1.4 0.26 0.22 0.03 43 190 45 32 7.2 2.0 4,100 0.058
Actual number less than value (<)
Estimated concentration above the adjusted method detection limit and below the adjusted reporting limit.
- Not collected

Como
2014 CRWD Stormwater Monitoring Report 94

Hidden Falls
2014 CRWD Stormwater Monitoring Report 95
7 HIDDEN FALLS SUBWATERSHED RESULTS
7.1 DESCRIPTION
The Hidden Falls subwatershed is a small subwatershed (166 acres), which encompasses the
former Ford Motor Company Twin Cities Assembly Plant (Figure 7-2). The former assembly
plant site makes up approximately 70% of the watershed’s total area while the remainder of the
land area is residential. Monitoring of the Hidden Falls subwatershed began in April 2014, one
year after demolition of the Ford site began in May 2013. The primary goal of monitoring the
subwatershed is to characterize the water quality over time as the Ford site is demolished and
redeveloped.
Figure 7-1: The Hidden Falls monitoring station (top); Hidden Falls, downstream of monitoring station (bottom).

Hidden Falls
2014 CRWD Stormwater Monitoring Report 96
Figure 7-2: Map of Hidden Falls subwatershed and monitoring location.

Hidden Falls
2014 CRWD Stormwater Monitoring Report 97
7.2 2014 MONITORING SUMMARY
The Hidden Falls subwatershed has been monitored for discharge and water quality for the 2014
monitoring season. Flow and water quality monitoring at this location generally occurs between
the months of April and October. During the winter months, ice accumulation prevents
monitoring activities.
7.2.1 DISCHARGE
Level, velocity, and discharge were monitored at Hidden Falls for both baseflow and stormflow
events in 2014.
Total baseflow discharge: 7,849,686 cubic feet (Table 7-1)
Total stormflow discharge: 6,760,807 cubic feet (Table 7-1)
Total annual discharge: 14,610,492 cubic feet (Figure 7-4; Table 7-1)
7.2.2 TOTAL SUSPENDED SOLIDS (TSS)
Baseflow and stormflow samples were analyzed for TSS concentrations in mg/L in order to
calculate-event based and total annual loads.
Baseflow flow weighted average concentration: 5 mg/L (Table 7-1)
Stormflow flow weighted average concentration: 341 mg/L (Table 7-1)
Total baseflow TSS load: 2,371 mg/L (Table 7-1)
Total stormflow TSS load: 101,607 mg/L (Table 7-1)
Total annual TSS load: 103,978 mg/L (Table 7-1)
7.2.3 TOTAL PHOSPHORUS (TP)
Baseflow and stormflow samples were analyzed for TP concentrations in mg/L in order to
calculate event-based and total annual loads.
Baseflow flow weighted average concentration: 0.03 mg/L (Table 7-1)
Stormflow flow weighted average concentration: 0.26 mg/L (Table 7-1)
Total baseflow TP load: 14 mg/L (Table 7-1)
Total stormflow TP load: 77 mg/L (Table 7-1)
Total annual TP load: 92 mg/L (Table 7-1)

Discharge Hidden Falls
2014 CRWD Stormwater Monitoring Report 98
Figure 7-3: Hidden Falls cumulative discharge and daily precipitation.

Discharge Hidden Falls
2014 CRWD Stormwater Monitoring Report 99
Figure 7-4: Hidden Falls level, velocity, and discharge.

Discharge Hidden Falls
2014 CRWD Stormwater Monitoring Report 100
Figure 7-5: Hidden Falls level, discharge, and precipitation.

Total Suspended Solids Hidden Falls
2014 CRWD Stormwater Monitoring Report 101
Figure 7-6: Monthly average storm sample TSS concentrations in 2014 for Hidden Falls subwatershed and historical averages (2014 only).
n=
0
n=
3
n=
4
n=
3
n=
2
n=
2
n=
2
n=
2
n=
3
n=
4
n=
3
n=
2
n=
2
n=
2
n=
2
0
100
200
300
400
500
600
Jan Feb Mar Apr May Jun Jul Aug Sep Oct Nov Dec
TS
S C
on
cen
trati
on
(m
g/L
)
Month
Historical Average
2014

Total Phosphorus Hidden Falls
2014 CRWD Stormwater Monitoring Report 102
Figure 7-6: Monthly average storm sample TP concentrations in 2014 for Hidden Falls subwatershed and historical averages (2014 only).
n=
0
n=
3
n=
4
n=
3
n=
2
n=
2
n=
2
n=
2
n=
0
0.0
00
n=
3
n=
4
n=
3
n=
2
n=
2
n=
2
n=
2
0.0
00
0.00
0.10
0.20
0.30
0.40
0.50
0.60
Jan Feb Mar Apr May Jun Jul Aug Sep Oct Nov Dec
TP
Co
ncen
trati
on
(m
g/L
)
Month
Historical Average
2014

Hidden Falls
2014 CRWD Stormwater Monitoring Report 103
Table 7-1: Hidden Falls subwatershed monitoring results, 2014.
2014
Subwatershed Area (ac) 167
Total Rainfall (inches) 28.37
Number of Monitoring Days 196
Number of Storm Sampling Events 10
Number of Storm Intervals 27
Number of Snowmelt Sampling Events 0
Number of Snowmelt Intervals 0
Total Discharge (cf) 14,610,492
Storm Flow Subtotal (cf) 6,760,807
Baseflow Subtotal (cf) 7,849,686
Average TSS Concentration (mg/L) 193
Total FWA TSS (mg/L) 132
Storm FWA TSS (mg/L) 341
Baseflow FWA TSS (mg/L) 5
Total TSS Load (lbs) 103,978
Storm TSS Load (lbs) 101,607
Baseflow TSS Load (lbs) 2,371
Total TSS Yield (lb/ac) 623
Average TP Concentration (mg/L) 0.16
Total FWA TP Concentration (mg/L) 0.12
Storm FWA TP Concentration (mg/L) 0.26
Baseflow FWA TP (mg/L) 0.03
Total TP Load (lbs) 92
Storm TP Load (lbs) 77
Baseflow TP Load (lbs) 14
Total TP Yield (lb/ac) 0.55

Hidden Falls
2014 CRWD Stormwater Monitoring Report 104
Table 7-2: Hidden Falls subwatershed loading table.
Sampled Event Sample Event Loading Interval Event Volume
(cf) Interval TP
(lb) Interval TSS
(lb) Start End
Storm 04/24/2014 10:20 04/24/2014 11:45 31,739 0.51 331
x Storm 04/27/2014 04:20 04/27/2014 07:05 67,890 0.99 985
Storm 04/27/2014 10:25 04/27/2014 15:15 206,994 2.85 1,802
Storm 04/27/2014 17:35 04/27/2014 18:35 100,653 1.31 825
x Storm 05/08/2014 15:45 05/12/2014 16:15 196,263 14.03 34,484
Storm 05/19/2014 12:15 05/21/2014 06:45 728,713 12.41 15,720
Storm 05/31/2014 23:05 06/01/2014 04:00 209,648 3.90 4,985
Storm 06/01/2014 05:10 06/01/2014 09:30 318,935 3.12 2,947
x Storm 06/07/2014 07:30 06/07/2014 09:05 103,239 1.07 876
Storm 06/14/2014 19:30 06/14/2014 20:55 110,901 1.00 933
Storm 06/14/2014 22:55 06/15/2014 10:35 326,348 3.16 2,978
Storm 06/18/2014 02:30 06/18/2014 03:45 16,107 0.18 175
Storm 06/19/2014 03:15 06/19/2014 15:20 1,021,115 9.21 8,596
Storm 06/19/2014 17:55 06/21/2014 16:00 355,821 4.39 4,257
Storm 06/22/2014 10:45 06/22/2014 14:30 10,539 0.21 215
x Storm 06/28/2014 16:45 06/28/2014 18:40 103,698 1.00 2,427
Storm 07/07/2014 18:00 07/07/2014 19:10 30,497 0.45 549
x Storm 07/11/2014 08:15 07/11/2014 09:55 155,227 1.08 1,151
x Storm 07/25/2014 04:45 07/25/2014 12:15 97,580 2.11 2,640
Storm 08/03/2014 20:30 08/04/2014 16:00 160,901 1.67 1,344
Storm 08/29/2014 17:00 08/29/2014 18:25 45,208 0.46 369
x Storm 08/30/2014 00:30 08/30/2014 06:45 98,882 1.30 1,312
x Storm 08/31/2014 21:30 09/01/2014 00:55 51,267 0.36 179
x Storm 09/09/2014 20:45 09/13/2014 21:15 96,768 3.99 4,721
Storm 09/20/2014 17:45 09/20/2014 20:30 15,954 0.33 367
Storm 10/01/2014 10:50 10/01/2014 11:40 22,035 0.82 800
x Storm 10/02/2014 12:30 10/02/2014 15:55 89,364 5.28 5,639
Storm Subtotal 4,772,285 77 101,607
Total 4,772,285 77 101,607
Month
Base Loading Interval Monthly Base Volume (cf)
Interval TP (lb)
Interval TSS (lb) Start End
January 01/01/2014 00:00 01/31/2014 23:59 --- --- ---
February 02/01/2014 00:00 02/28/2014 23:59 --- --- ---
March 03/01/2014 00:00 03/31/2014 23:59 --- --- ---
April 04/01/2014 00:00 04/30/2014 23:59 1,012,639 2.18 198
May 05/01/2014 00:00 05/31/2014 23:59 2,407,624 4.74 527
June 06/01/2014 00:00 06/30/2014 23:59 2,267,545 3.39 282
July 07/01/2014 00:00 07/31/2014 23:59 838,610 1.44 131
August 08/01/2014 00:00 08/31/2014 23:59 410,232 1.08 872
September 09/01/2014 00:00 09/30/2014 23:59 422,614 0.76 185
October 10/01/2014 00:00 10/31/2014 23:59 473,069 0.74 177
November* 11/01/2014 00:00 11/30/2014 23:59 17,082 0.02 6
December 12/01/2014 00:00 12/31/2014 23:59 --- --- ---
Base Subtotal 7,849,415 14 2,377
TOTAL ANNUAL 12,621,701 92 103,985
*October concentration used

Hidden Falls
2014 CRWD Stormwater Monitoring Report 105
Table 7-3: 2014 Hidden Falls subwatershed laboratory data.
Sample Sampling Start Sampling End Ortho-P Cl Cd Cr Cu Pb Ni Zn NH3 TKN Total P NO3 NO2 TDS TSS VSS Hardness CBOD SO4 E. coli Dissolved P
Type Date/Time Date/Time mg/L mg/L mg/L mg/L mg/L mg/L mg/L mg/L mg/L mg/L mg/L mg/L mg/L mg/L mg/L mg/L mg/L mg/L mg/L mpn/100 mL mg/L
Base Grab 04/22/2014 08:30 04/22/2014 08:30 - 74.1 0.00020 0.00053 0.00150 0.00056 0.00150 0.02380 0.310 0.8 0.03 1.27 0.03 471 3 1 312 - - - 0.020
Base Grab 05/14/2014 08:40 05/14/2014 08:40 - - - - - - - - - - - - - - - - - - - 20 -
Base Composite 05/14/2014 09:01 05/15/2014 05:46 0.005 83.2 0.00020 0.00077 0.00220 0.00350 0.00190 0.02740 0.250 1.0 0.02 1.46 0.03 545 5 2 368 - - - 0.021
Base Grab 05/29/2014 08:50 05/29/2014 08:50 - - - - - - - - - - - - - - - - - - - 124 -
Base Composite 05/29/2014 09:31 05/30/2014 08:00 0.016 116.4 0.00020 0.00036 0.00150 0.00058 0.00230 0.01440 0.160 0.7 0.04 2.06 0.03 782 2 1 492 - - - 0.024
Base Grab 06/10/2014 08:20 06/10/2014 08:20 - - - - - - - - - - - - - - - - - - - 176 -
Base Composite 06/10/2014 08:31 06/11/2014 02:16 0.005 99.6 0.00020 0.00039 0.00140 0.00030 0.00230 0.00840 0.120 0.6 0.03 1.88 0.03 714 2 1 444 - - - 0.020
Base Composite 06/23/2014 14:01 06/24/2014 10:30 0.009 88.8 0.00020 0.00055 0.00170 0.00041 0.00220 0.01130 0.060 0.5 0.02 1.54 0.03 694 2 1 420 - - - 0.020
Base Grab 06/25/2014 08:30 06/25/2014 08:30 - - - - - - - - - - - - - - - - - - - 23 -
Base Grab 07/02/2014 08:20 07/02/2014 08:20 - - - - - - - - - - - - - - - - - - - 682 -
Base Grab 07/03/2014 08:25 07/03/2014 08:25 0.006 103.3 0.00020 0.00037 0.00130 0.00010 0.00240 0.00860 0.150 0.6 0.03 1.84 0.03 716 2 1 420 - - - 0.020
Base Grab 07/21/2014 08:55 07/21/2014 08:55 0.010 119.9 0.00020 0.00032 0.00120 0.00057 0.00250 0.00730 0.200 0.6 0.02 1.79 0.04 769 3 1 436 - - 138 0.028
Base Grab 08/04/2014 08:40 08/04/2014 08:40 - - - - - - - - - - - - - - - - - - 649 -
Base Composite 08/04/2014 08:46 08/05/2014 07:45 0.007 83.5 0.00020 0.00520 0.00510 0.00610 0.00480 0.02410 0.110 0.6 0.13 1.28 0.03 550 46 5 324 - 95.2 - 0.020
Base Grab 08/13/2014 09:00 08/13/2014 09:00 - - - - - - - - - - - - - - - - - - - 238 -
Base Composite 08/13/2014 09:31 08/14/2014 08:31 0.005 110.5 0.00020 0.00140 0.00440 0.01780 0.00460 0.03080 0.170 0.8 0.02 1.81 0.06 745 34 5 404 1.0 147.0 - 0.020
Base Grab 08/26/2014 08:25 08/26/2014 08:25 - - - - - - - - - - - - - - - - - - - 1,414 -
Base Composite 08/26/2014 08:47 08/27/2014 08:16 0.113 26.1 0.00020 0.00054 0.00280 0.00400 0.00300 0.01120 0.070 0.8 0.04 0.93 0.06 778 19 5 432 - - - 0.031
Base Grab 09/08/2014 08:40 09/08/2014 08:40 - - - - - - - - - - - - - - - - - - - 76 -
Base Composite 09/08/2014 09:01 09/09/2014 05:01 0.005 103.9 0.00020 0.00088 0.00170 0.00240 0.00310 0.01190 0.170 0.7 0.03 0.87 0.07 735 7 1 416 - - - 0.020
Base Grab 09/29/2014 08:40 09/29/2014 08:40 - - - - - - - - - - - - - - - - - - - 18,500 -
Base Grab 10/09/2014 09:15 10/09/2014 09:15 - - - - - - - - - - - - - - - - - - - 1,300 -
Base Composite 10/09/2014 10:01 10/09/2014 18:30 0.005 39.7 0.00020 0.00039 0.00250 0.00830 0.00270 0.01250 0.060 2.6 0.03 0.43 0.03 330 6 3 208 - - - 0.020
Base Average 0.017 87.4 0.00020 0.00098 0.00228 0.00372 0.00278 0.01598 0.153 0.9 0.04 1.43 0.039 652 11 2 390 1.0 121.1 1,945 0.022
Storm Grab 04/24/2014 08:45 04/24/2014 08:45 0.033 20.1 0.00051 0.00680 0.01670 0.05840 0.00450 0.21300 0.340 1.2 0.11 0.57 0.03 166 73 23 116 - 30.1 101 0.030
Storm Composite 04/27/2014 04:30 04/27/2014 14:02 0.032 10.8 0.00072 0.00830 0.02220 0.06450 0.00540 0.27900 0.340 1.4 0.20 0.39 0.03 122 194 46 80 - - - 0.039
Storm Composite 04/28/2014 09:16 04/28/2014 18:30 0.029 16.4 0.00056 0.00700 0.01840 0.05720 0.00450 0.23800 0.120 0.9 0.20 0.56 0.03 174 125 26 102 - - - 0.063
Storm Composite 05/08/2014 16:16 05/08/2014 17:45 0.013 8.5 0.00490 0.04300 0.11000 0.46300 0.02580 1.71000 0.570 2.1 0.46 0.39 0.04 92 1,520 292 84 - - - 0.036
Storm Composite 05/11/2014 23:16 05/12/2014 02:30 0.034 13.6 0.00069 0.00830 0.02510 0.06710 0.00560 0.31300 0.130 1.3 0.24 0.10 0.03 102 100 27 82 - - - 0.082
Storm Composite 05/19/2014 11:16 05/19/2014 13:48 0.022 6.6 0.00120 0.01260 0.03130 0.11200 0.00900 0.48300 0.200 1.6 0.26 0.20 0.03 73 363 80 50 - - - 0.032
Storm Grab 05/19/2014 11:40 05/19/2014 11:40 - - - - - - - - - - - - - - - - - - - 1 -
Storm Composite 05/31/2014 20:31 06/01/2014 03:51 0.005 10.4 0.00075 0.00850 0.02330 0.07670 0.00600 0.44800 0.110 1.2 0.21 0.29 0.03 82 264 58 56 - - - 0.020
Storm Composite 06/07/2014 08:01 06/07/2014 14:00 - 12.9 0.00040 0.00580 0.01580 0.04220 0.00450 0.22200 0.190 1.1 0.17 0.36 0.03 105 130 31 76 - - - 0.042
Storm Composite 06/16/2014 18:01 06/16/2014 22:15 0.016 18.5 0.00020 0.00150 0.00570 0.00550 0.00150 0.03460 0.020 0.5 0.06 0.38 0.03 145 10 4 84 - - - 0.021
Storm Grab 06/19/2014 08:40 06/19/2014 08:40 - - - - - - - - - - - - - - - - - - - 3,100 -
Storm Composite 06/28/2014 17:16 06/28/2014 18:00 0.008 8.3 0.00043 0.00660 0.01680 0.07030 0.00500 0.24100 0.070 0.7 0.14 0.19 0.03 74 335 45 44 - - - 0.020
Storm Grab 07/11/2014 09:00 07/11/2014 09:00 - - - - - - - - - - - - - - - - - - - 1,986 -
Storm Composite 07/11/2014 08:46 07/11/2014 11:45 0.012 6.3 0.00023 0.00420 0.00950 0.02530 0.00330 0.11600 0.050 0.5 0.11 0.14 0.03 63 116 23 48 - - - 0.020
Storm Grab 07/25/2014 08:25 07/25/2014 08:25 - - - - - - - - - - - - - - - - - - 8,600 -
Storm Composite 07/25/2014 05:16 07/25/2014 07:00 - 22.1 0.00069 0.01210 0.02760 0.08910 0.00920 0.30300 0.100 1.6 0.33 0.36 0.06 144 412 55 84 - - - 0.020
Storm Grab 08/21/2014 08:35 08/21/2014 08:35 - - - - - - - - - - - - - - - - - - - 13,500 -
Storm Composite 08/30/2014 00:45 08/30/2014 03:15 - 18.7 0.00034 0.00640 0.01410 0.04990 0.00570 0.15200 0.020 0.8 0.20 0.19 0.03 142 202 32 68 - - - 0.030
Storm Composite 08/31/2014 22:30 09/01/2014 05:45 - 25.7 0.00020 0.00350 0.00800 0.01820 0.00290 0.06180 0.020 0.6 0.11 0.21 0.03 172 55 11 80 - - - 0.020
Storm Composite 09/09/2014 21:16 09/10/2014 00:45 0.018 28.8 0.00071 0.01440 0.02830 0.10300 0.01270 0.32500 0.110 1.8 0.42 0.45 0.04 176 486 70 92 7.1 22.2 - 0.020
Storm Composite 09/29/2014 10:30 09/29/2014 18:46 0.005 48.2 0.00045 0.00710 0.01960 0.05030 0.00770 0.17000 0.020 1.0 0.19 0.54 0.06 267 173 39 156 - - - 0.020
Storm Composite 10/01/2014 08:16 10/01/2014 15:15 0.026 23.8 0.00032 0.00790 0.01590 0.04890 0.00720 0.13800 0.020 0.9 0.23 0.13 0.08 164 143 26 132 - - - 0.038
Storm Grab 10/01/2014 08:55 10/01/2014 08:55 - - - - - - - - - - - - - - - - - - - 71,700 -
Storm Composite 10/02/2014 13:16 10/02/2014 22:00 0.029 18.3 0.00100 0.02440 0.04230 0.21100 0.02510 0.32300 0.120 1.8 0.89 0.24 0.15 180 950 115 124 - - - 0.030
Storm Average 0.020 17.7 0.00079 0.01047 0.02503 0.08959 0.00809 0.32058 0.142 1.2 0.25 0.32 0.044 136 314 56 87 7.1 26.2 14,141 0.032
Annual Average 0.019 45.6 0.00056 0.00667 0.01593 0.05524 0.00596 0.19874 0.146 1.0 0.16 0.76 0.042 342 193 34 208 4.1 73.6 6,438 0.028
Annual Maximum 0.113 119.9 0.00490 0.04300 0.11000 0.46300 0.02580 1.71000 0.570 2.6 0.89 2.06 0.150 782 1,520 292 492 7.1 147.0 71,700 0.082
Annual Minimum 0.005 6.3 0.00020 0.00032 0.00120 0.00010 0.00150 0.00730 0.020 0.5 0.02 0.10 0.030 63 2 1 44 1.0 22.2 1 0.020
Annual Median 0.012 24.8 0.00028 0.00550 0.01180 0.03375 0.00450 0.12700 0.120 0.9 0.12 0.44 0.030 175 87 23 120 4.1 62.7 649 0.021
Actual number less than value (<)
Estimated concentration above the adjusted method detection limit and below the adjusted reporting limit.
- Not collected

Hidden Falls
2014 CRWD Stormwater Monitoring Report 106

East Kittsondale
2014 CRWD Stormwater Monitoring Report 107
8 EAST KITTSONDALE SUBWATERSHED RESULTS
8.1 DESCRIPTION
The East Kittsondale subwatershed is located in the southern portion of CRWD and drains 1,116 acres of St. Paul (Figure 8-2). East Kittsondale is the smallest of the four major subwatersheds monitored by CRWD. The subwatershed empties into the Mississippi River, downstream of the confluence of the Minnesota and Mississippi Rivers. There are no surface water bodies in the subwatershed. Land use in the subwatershed is largely residential, with 46% impervious surface cover. CRWD operates a full water quality monitoring station in the East Kittsondale subwatershed. Flow monitoring equipment is installed year-round while a water quality sampler is only installed for the non-winter monitoring period (April to early November). The station is not located at the true outlet to the river because the depth of the storm sewer beneath the ground surface makes it difficult to monitor any farther downstream.
Figure 8-1: The East Kittsondale monitoring site location (top, bottom left) and flow-logging and sampling equipment installed inside storm tunnel (bottom right).

East Kittsondale
2014 CRWD Stormwater Monitoring Report 108
Figure 8-2: Map of the East Kittsondale subwatershed and monitoring location.

East Kittsondale
2014 CRWD Stormwater Monitoring Report 109
8.2 2014 MONITORING SUMMARY
The East Kittsondale subwatershed has been monitored for flow and water quality since 2005. From 2005-2009, monitoring only occurred during the spring, summer, and fall with no winter monitoring. Since 2010, the site has been monitored for the full calendar year with continuous flow data recorded and, at a minimum, one full water quality sampling event per month. Due to these differences in monitoring period, the 2010-2014 loading, and discharge data may show a significant difference when compared to pre-2010 data. Stormflow data should not be affected by differences in monitoring period as all storm samples since 2005 were collected during the spring, summer, or fall.
The East Kittsondale monitoring site has a history of illicit discharges. In 2010, an illicit connection was identified and corrected. In 2012 possible illicit discharges were noticed during a dry period of the year. In 2013, greater attention was paid to the flow data during a dry period from August to October to identify and record potential illicit discharges. In 2014, one illicit discharge was identified in May.
Summaries of 2014 monitoring data collected and observed at East Kittsondale are listed below. Monitoring efficiency at East Kittsondale is explained in Appendix B.
8.2.1 DISCHARGE
Level, velocity, and discharge were monitored at East Kittsondale for both baseflow, stormflow, and snowmelt events in 2014.
• Total baseflow discharge: 31,521,903 cubic feet (Figure 8-3; Table 8-1) • Total stormflow discharge: 51,888,007 cubic feet (Figure 8-3; Table 8-1) • Total snowmelt discharge: 5,433,144 cubic feet (Figure 8-3; Table 8-1) • Total annual discharge: 88,843,054 cubic feet (Figure 8-4; Table 8-1)
8.2.2 TOTAL SUSPENDED SOLIDS (TSS)
Baseflow, stormflow, and snowmelt samples were analyzed for TSS concentrations in mg/L in order to calculate event-based and total annual loads.
• Baseflow flow weighted average concentration: 4 mg/L (Table 8-1) • Stormflow flow weighted average concentration: 199 mg/L (Table 8-1) • Snowmelt flow weighted average concentration: 426 mg/L (Table 8-1) • Total baseflow TSS load: 8,774 lbs (Figure 8-7; Table 8-1) • Total stormflow TSS load: 640,084 lbs (Figure 8-7; Table 8-1) • Total snowmelt TSS load: 144,378 lbs (Figure 8-7; Table 8-1) • Total annual TSS load: 793,236 lbs (Figure 8-7; Table 8-1)
8.2.3 TOTAL PHOSPHORUS (TP)
Baseflow, stormflow, and snowmelt samples were analyzed for TP concentrations in mg/L in order to calculate event-based and total annual loads.

East Kittsondale
2014 CRWD Stormwater Monitoring Report 110
• Baseflow flow weighted average concentration: 0.05 mg/L (Table 8-1) • Stormflow flow weighted average concentration: 0.37 mg/L (Table 8-1) • Snowmelt flow weighted average concentration: 0.64 mg/L (Table 8-1) • Total baseflow TP load: 107 lbs (Figure 8-9; Table 8-1) • Total stormflow TP load: 1,201 lbs (Figure 8-9; Table 8-1) • Total snowmelt TP load: 217 lbs (Figure 8-9; Table 8-1) • Total annual TP load: 1,525 lbs (Figure 8-9; Table 8-1)

Discharge East Kittsondale
2014 CRWD Stormwater Monitoring Report 111
Figure 8-3: Historical total monitored discharge volumes at East Kittsondale subwatershed for snowmelt, illicit discharge, stormflow and baseflow from 2005-2014.
0
10,000,000
20,000,000
30,000,000
40,000,000
50,000,000
60,000,000
70,000,000
80,000,000
90,000,000
100,000,000
2005 2006 2007 2008 2009 2010 2011 2012 2013 2014
Dis
char
ge (c
f)
Year
Snowmelt
Illicit Discharge
Storm
Base
Seasonally Monitored (~Apr-Nov)
Continuously Monitored (Jan-Dec)

Discharge East Kittsondale
2014 CRWD Stormwater Monitoring Report 112
Figure 8-4: East Kittsondale cumulative discharge and daily precipitation.

Discharge East Kittsondale
2014 CRWD Stormwater Monitoring Report 113
Figure 8-5: East Kittsondale level, velocity, and discharge.

Discharge East Kittsondale
2014 CRWD Stormwater Monitoring Report 114
Figure 8-6: East Kittsondale level, discharge, and precipitation.

Total Suspended Solids East Kittsondale
2014 CRWD Stormwater Monitoring Report 115
Figure 8-7: Historical total monitored TSS loads at East Kittsondale subwatershed for snowmelt, illicit discharge, stormflow and baseflow from 2005-2014.
0
200,000
400,000
600,000
800,000
1,000,000
1,200,000
2005 2006 2007 2008 2009 2010 2011 2012 2013 2014
TSS
Load
(lbs
)
Year
Snowmelt
Illicit Discharge
Storm
Base

Total Suspended Solids East Kittsondale
2014 CRWD Stormwater Monitoring Report 116
Figure 8-8: Monthly average storm sample TSS concentrations in 2014 for East Kittsondale subwatershed and historical averages (2005-2013).
n=1
n=9
n=28
n=28
n=29
n=33
n=19
n=20
n=2
n=1
n=3
n=5
n=4
n=3
n=4
0
100
200
300
400
500
600
700
800
Jan Feb Mar Apr May Jun Jul Aug Sep Oct Nov Dec
TSS
Con
cent
ratio
n (m
g/L)
Month
Historical Average (2005-2013)
2014

Total Phosphorus East Kittsondale
2014 CRWD Stormwater Monitoring Report 117
Figure 8-9: Historical total monitored TP loads at East Kittsondale subwatershed for snowmelt, illicit discharge, stormflow and baseflow from 2005-2014.
0
200
400
600
800
1,000
1,200
1,400
1,600
1,800
2005 2006 2007 2008 2009 2010 2011 2012 2013 2014
TP L
oad
(lbs)
Year
Snowmelt
Illicit Discharge
Storm
Base

Total Phosphorus East Kittsondale
2014 CRWD Stormwater Monitoring Report 118
Figure 8-10: Monthly average storm sample TP concentrations in 2014 for East Kittsondale subwatershed and historical averages (2005-2013).
n=1
n=9
n=28
n=28
n=29
n=33
n=19
n=20
n=2
n=1
n=3
n=5
n=4
n=3
n=4
n=0
n=0
0.00
0.50
1.00
1.50
2.00
2.50
Jan Feb Mar Apr May Jun Jul Aug Sep Oct Nov Dec
TP C
once
ntra
tion
(mg/
L)
Month
Historical Average (2005-2013)
2014
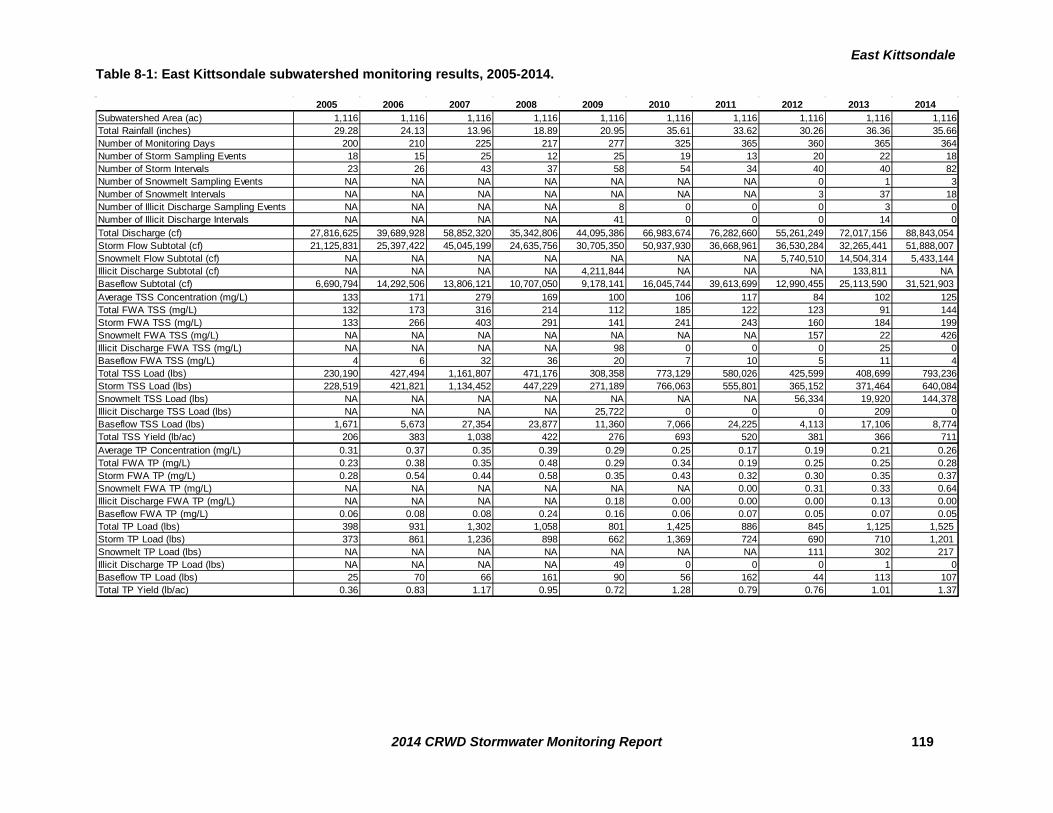
East Kittsondale
2014 CRWD Stormwater Monitoring Report 119
Table 8-1: East Kittsondale subwatershed monitoring results, 2005-2014.
2005 2006 2007 2008 2009 2010 2011 2012 2013 2014Subwatershed Area (ac) 1,116 1,116 1,116 1,116 1,116 1,116 1,116 1,116 1,116 1,116Total Rainfall (inches) 29.28 24.13 13.96 18.89 20.95 35.61 33.62 30.26 36.36 35.66Number of Monitoring Days 200 210 225 217 277 325 365 360 365 364Number of Storm Sampling Events 18 15 25 12 25 19 13 20 22 18Number of Storm Intervals 23 26 43 37 58 54 34 40 40 82Number of Snowmelt Sampling Events NA NA NA NA NA NA NA 0 1 3Number of Snowmelt Intervals NA NA NA NA NA NA NA 3 37 18Number of Illicit Discharge Sampling Events NA NA NA NA 8 0 0 0 3 0Number of Illicit Discharge Intervals NA NA NA NA 41 0 0 0 14 0Total Discharge (cf) 27,816,625 39,689,928 58,852,320 35,342,806 44,095,386 66,983,674 76,282,660 55,261,249 72,017,156 88,843,054 Storm Flow Subtotal (cf) 21,125,831 25,397,422 45,045,199 24,635,756 30,705,350 50,937,930 36,668,961 36,530,284 32,265,441 51,888,007 Snowmelt Flow Subtotal (cf) NA NA NA NA NA NA NA 5,740,510 14,504,314 5,433,144 Illicit Discharge Subtotal (cf) NA NA NA NA 4,211,844 NA NA NA 133,811 NABaseflow Subtotal (cf) 6,690,794 14,292,506 13,806,121 10,707,050 9,178,141 16,045,744 39,613,699 12,990,455 25,113,590 31,521,903 Average TSS Concentration (mg/L) 133 171 279 169 100 106 117 84 102 125Total FWA TSS (mg/L) 132 173 316 214 112 185 122 123 91 144Storm FWA TSS (mg/L) 133 266 403 291 141 241 243 160 184 199Snowmelt FWA TSS (mg/L) NA NA NA NA NA NA NA 157 22 426Illicit Discharge FWA TSS (mg/L) NA NA NA NA 98 0 0 0 25 0Baseflow FWA TSS (mg/L) 4 6 32 36 20 7 10 5 11 4Total TSS Load (lbs) 230,190 427,494 1,161,807 471,176 308,358 773,129 580,026 425,599 408,699 793,236Storm TSS Load (lbs) 228,519 421,821 1,134,452 447,229 271,189 766,063 555,801 365,152 371,464 640,084Snowmelt TSS Load (lbs) NA NA NA NA NA NA NA 56,334 19,920 144,378Illicit Discharge TSS Load (lbs) NA NA NA NA 25,722 0 0 0 209 0Baseflow TSS Load (lbs) 1,671 5,673 27,354 23,877 11,360 7,066 24,225 4,113 17,106 8,774Total TSS Yield (lb/ac) 206 383 1,038 422 276 693 520 381 366 711Average TP Concentration (mg/L) 0.31 0.37 0.35 0.39 0.29 0.25 0.17 0.19 0.21 0.26Total FWA TP (mg/L) 0.23 0.38 0.35 0.48 0.29 0.34 0.19 0.25 0.25 0.28Storm FWA TP (mg/L) 0.28 0.54 0.44 0.58 0.35 0.43 0.32 0.30 0.35 0.37Snowmelt FWA TP (mg/L) NA NA NA NA NA NA 0.00 0.31 0.33 0.64Illicit Discharge FWA TP (mg/L) NA NA NA NA 0.18 0.00 0.00 0.00 0.13 0.00Baseflow FWA TP (mg/L) 0.06 0.08 0.08 0.24 0.16 0.06 0.07 0.05 0.07 0.05Total TP Load (lbs) 398 931 1,302 1,058 801 1,425 886 845 1,125 1,525 Storm TP Load (lbs) 373 861 1,236 898 662 1,369 724 690 710 1,201 Snowmelt TP Load (lbs) NA NA NA NA NA NA NA 111 302 217 Illicit Discharge TP Load (lbs) NA NA NA NA 49 0 0 0 1 0Baseflow TP Load (lbs) 25 70 66 161 90 56 162 44 113 107Total TP Yield (lb/ac) 0.36 0.83 1.17 0.95 0.72 1.28 0.79 0.76 1.01 1.37

East Kittsondale
2014 CRWD Stormwater Monitoring Report 120
Table 8-2: 2014 East Kittsondale subwatershed loading table.
Sampled Event Sample Event Loading Interval Event Volume (cf)
Interval TP (lb)
Interval TSS (lb) Start End
Snowmelt 01/13/2014 12:45 01/13/2014 13:30 2,405 0.01 0 Snowmelt 01/19/2014 13:30 01/19/2014 21:00 25,798 0.06 3 Snowmelt 02/18/2014 12:30 02/18/2014 18:45 34,281 0.06 4 Snowmelt 02/19/2014 12:30 02/19/2014 19:30 83,319 0.16 10 Snowmelt 02/20/2014 12:00 02/20/2014 15:15 20,711 0.04 3 Snowmelt 02/20/2014 16:30 02/20/2014 18:30 4,075 0.01 1 Snowmelt 03/05/2014 13:45 03/05/2014 17:30 19,115 1.08 744 Snowmelt 03/08/2014 12:45 03/08/2014 19:30 99,301 3.43 2,283 Snowmelt 03/09/2014 12:00 03/10/2014 03:30 331,395 10.18 6,690 x Snowmelt 03/10/2014 09:30 03/11/2014 23:15 1,807,269 84.07 85,546 Snowmelt 03/12/2014 11:15 03/12/2014 20:15 172,252 5.79 3,837 x Snowmelt 03/13/2014 10:15 03/15/2014 03:15 1,607,516 70.16 23,776 Snowmelt 03/16/2014 13:00 03/16/2014 17:30 28,052 1.49 1,023 Snowmelt 03/17/2014 13:00 03/17/2014 21:00 204,611 6.23 4,089 Snowmelt 03/19/2014 12:15 03/19/2014 21:45 87,508 3.50 2,354 x Snowmelt 03/20/2014 11:30 03/21/2014 00:00 566,848 19.85 6,895 Snowmelt 03/21/2014 11:45 03/21/2014 23:30 327,566 9.87 6,474 Snowmelt 03/22/2014 14:30 03/22/2014 17:45 8,235 0.91 646 Storm 03/26/2014 13:45 03/26/2014 22:00 108,883 3.69 2,452 x Storm 03/27/2014 07:15 03/27/2014 23:15 1,201,711 183.73 61,768 Storm 03/28/2014 10:45 03/28/2014 21:15 270,152 8.82 5,831 Storm 03/29/2014 11:30 03/30/2014 00:30 356,871 10.75 7,050 Storm 03/30/2014 10:00 04/01/2014 03:15 1,285,271 38.29 25,090 Storm 04/01/2014 14:00 04/01/2014 19:00 17,412 1.05 910 Storm 04/02/2014 14:30 04/02/2014 17:30 5,273 0.63 568 Storm 04/03/2014 14:45 04/03/2014 18:45 21,571 0.87 730 Storm 04/04/2014 12:00 04/05/2014 02:45 476,000 11.04 8,455 Storm 04/05/2014 11:00 04/06/2014 03:45 676,884 15.97 12,283 Storm 04/06/2014 10:15 04/06/2014 22:15 313,244 8.27 6,503 Storm 04/07/2014 11:45 04/07/2014 22:00 126,081 3.94 3,186 Storm 04/08/2014 13:30 04/08/2014 19:00 14,913 1.05 925 Storm 04/12/2014 06:15 04/12/2014 16:00 190,715 4.59 3,540 Storm 04/16/2014 16:15 04/17/2014 17:30 1,060,881 24.13 18,407 Storm 04/19/2014 16:30 04/20/2014 08:15 550,895 12.47 9,499 Storm 04/21/2014 02:15 04/21/2014 09:00 211,044 5.00 3,846 x Storm 04/23/2014 14:30 04/24/2014 02:00 283,626 6.52 1,973 Storm 04/24/2014 05:00 04/24/2014 19:45 1,177,953 25.79 19,504 x Storm 04/26/2014 20:45 04/30/2014 21:15 7,328,985 121.18 103,269 Storm 05/01/2014 03:15 05/01/2014 11:00 50,310 2.98 1,766 Storm 05/08/2014 07:30 05/08/2014 12:45 98,936 3.35 1,913 x Storm 05/08/2014 15:30 05/09/2014 01:30 496,830 21.29 23,274 Storm 05/10/2014 20:45 05/11/2014 01:45 106,722 3.61 2,059 x Storm 05/11/2014 21:30 05/12/2014 08:00 912,544 13.86 4,450 Storm 05/12/2014 16:30 05/13/2014 01:00 218,379 7.03 3,995 Storm 05/15/2014 12:15 05/15/2014 14:00 5,547 0.28 167 x Storm 05/19/2014 10:30 05/23/2014 11:00 2,888,910 57.72 33,256 x Storm 05/26/2014 21:30 05/27/2014 18:00 1,115,023 31.88 15,524 Storm 05/28/2014 12:45 05/28/2014 14:30 7,382 0.36 208 Storm 05/29/2014 10:00 05/29/2014 11:15 8,010 0.34 198 Storm 05/30/2014 09:00 05/30/2014 10:15 9,370 0.37 217

East Kittsondale
2014 CRWD Stormwater Monitoring Report 121
x Storm 05/31/2014 15:15 06/02/2014 04:15 3,460,320 45.87 26,349 Storm 06/02/2014 06:30 06/02/2014 14:15 82,887 3.48 1,627 Storm 06/05/2014 15:30 06/05/2014 21:00 98,607 3.12 1,430 x Storm 06/07/2014 07:30 06/07/2014 16:00 1,101,023 13.85 4,354 Storm 06/11/2014 23:00 06/12/2014 07:30 281,363 8.29 3,774 x Storm 06/14/2014 10:30 06/15/2014 22:45 3,324,177 56.31 17,212 x Storm 06/16/2014 16:45 06/17/2014 04:30 685,310 6.37 1,574 Storm 06/18/2014 02:30 06/18/2014 13:15 787,520 22.17 10,056 Storm 06/19/2014 03:00 06/23/2014 03:30 5,343,552 152.23 69,135 Storm 06/28/2014 15:30 06/29/2014 09:15 1,597,975 44.35 20,091 Storm 07/01/2014 15:30 07/01/2014 17:45 21,386 0.79 431 Storm 07/06/2014 06:15 07/06/2014 11:30 101,629 2.71 1,407 x Storm 07/07/2014 18:00 07/08/2014 00:45 389,609 9.49 5,596 x Storm 07/11/2014 06:15 07/12/2014 11:00 1,767,917 18.41 12,183 Storm 07/12/2014 13:30 07/12/2014 20:45 280,721 6.66 3,389 Storm 07/14/2014 17:30 07/15/2014 04:00 213,938 5.20 2,655 x Storm 07/25/2014 04:45 07/25/2014 16:30 472,141 13.47 4,967 Storm 08/01/2014 18:30 08/01/2014 23:45 78,864 1.71 887 Storm 08/03/2014 20:30 08/03/2014 23:45 150,612 2.94 1,497 x Storm 08/10/2014 19:15 08/11/2014 22:30 566,361 13.89 212 Storm 08/17/2014 15:15 08/17/2014 19:00 69,718 1.55 808 Storm 08/17/2014 23:30 08/18/2014 10:15 537,873 10.06 5,083 x Storm 08/18/2014 20:30 08/18/2014 22:15 6,341 0.22 237 Storm 08/21/2014 06:00 08/21/2014 14:00 206,233 4.05 2,064 Storm 08/24/2014 06:45 08/24/2014 09:00 12,012 0.39 215 Storm 08/24/2014 17:30 08/24/2014 22:00 107,115 2.28 1,182 Storm 08/29/2014 03:30 08/29/2014 07:30 78,828 1.69 878 Storm 08/29/2014 11:15 08/29/2014 15:00 12,293 0.40 221 x Storm 08/29/2014 17:15 08/30/2014 14:15 1,555,043 12.98 6,717 x Storm 08/31/2014 21:30 09/01/2014 13:45 881,911 6.26 6,193 Storm 09/02/2014 12:00 09/02/2014 14:30 10,545 0.41 233 Storm 09/03/2014 08:45 09/03/2014 15:45 228,881 5.65 2,957 Storm 09/09/2014 21:00 09/10/2014 15:15 644,239 15.16 7,837 Storm 09/15/2014 07:00 09/15/2014 10:45 44,753 1.36 750 Storm 09/20/2014 17:30 09/21/2014 01:45 239,244 5.69 2,948 Storm 09/24/2014 14:30 09/24/2014 19:00 63,246 1.70 907 Storm 09/29/2014 09:45 09/29/2014 13:45 213,645 5.17 2,692 Storm 10/01/2014 07:15 10/01/2014 22:45 946,153 16.68 5,981 Storm 10/02/2014 12:30 10/03/2014 06:45 1,139,651 20.07 7,193 Storm 10/03/2014 23:30 10/04/2014 07:15 259,166 4.97 1,805 Storm 10/23/2014 02:45 10/23/2014 10:00 82,613 1.70 624 Storm 11/11/2014 13:15 11/11/2014 18:45 22,516 2.59 1,480 Storm 11/22/2014 15:15 11/22/2014 15:45 0 0.28 163 Storm 11/23/2014 00:15 11/23/2014 08:45 95,605 13.49 7,731 Storm 11/23/2014 22:45 11/24/2014 01:15 5,359 2.33 1,349 Storm 12/10/2014 14:45 12/11/2014 02:15 20,276 0.03 3 Storm 12/13/2014 08:45 12/13/2014 19:15 104,054 0.13 13 Storm 12/15/2014 02:15 12/15/2014 04:45 14,128 0.02 2 Storm 12/15/2014 12:15 12/16/2014 05:45 344,744 0.43 43 Storm 12/21/2014 10:15 12/23/2014 07:00 1,065,468 1.33 133
Snowmelt Subtotal 5,430,260 217 144,378 Storm Subtotal 51,413,889 1,201 640,084 Total 56,844,149 1,418 784,462
Month Base Loading Interval

East Kittsondale
2014 CRWD Stormwater Monitoring Report 122
Start End Monthly Base Volume (cf)
Interval TP (lb)
Interval TSS (lb)
January 01/01/2014 00:00 01/31/2014 23:59 1,758,562 4.61 220 February 02/01/2014 00:00 02/28/2014 23:59 1,206,820 1.96 151 March 03/01/2014 00:00 03/31/2014 23:59 2,994,003 8.91 563 April 04/01/2014 00:00 04/30/2014 23:59 3,142,454 13.94 785 May 05/01/2014 00:00 05/31/2014 23:59 2,648,400 8.44 662 June 06/01/2014 00:00 06/30/2014 23:59 3,777,495 12.49 1,414 July 07/01/2014 00:00 07/31/2014 23:59 3,267,182 14.06 1,121 August 08/01/2014 00:00 08/31/2014 23:59 2,805,777 10.34 1,051 September 09/01/2014 00:00 09/30/2014 23:59 2,471,836 13.73 771 October 10/01/2014 00:00 10/31/2014 23:59 2,166,672 7.71 1,014 November 11/01/2014 00:00 11/30/2014 23:59 2,837,653 6.91 727 December 12/01/2014 00:00 12/31/2014 23:59 2,363,868 3.62 296 Base Subtotal 31,440,723 107 8,774
TOTAL ANNUAL 88,284,872 1,525 793,236

East Kittsondale
2014 CRWD Stormwater Monitoring Report 123
Table 8-3: 2014 East Kittsondale subwatershed laboratory data.
Sample Sampling Start Sampling End Ortho-P Cl Cd Cr Cu Pb Ni Zn NH3 TKN Total P NO3 NO2 TDS TSS VSS Hardness CBOD SO4 E. coli Dissolved P Potassium Flouride ion Type Date/Time Date/Time mg/L mg/L mg/L mg/L mg/L mg/L mg/L mg/L mg/L mg/L mg/L mg/L mg/L mg/L mg/L mg/L mg/L mg/L mg/L mpn/100 mL mg/L mg/L mg/LIllicit Discharge 05/29/2014 10:32 05/29/2014 11:16 - 138.6 0.00020 0.00190 0.00550 0.00500 0.00190 0.02710 0.450 1.6 0.15 - - - 1,110 146 200 - - - - 3.5 0.823
ID Average - 138.6 0.0002 0.0019 0.0055 0.0050 0.0019 0.0271 0.450 1.6 0.15 - - - 1110 146 200 - - - - 3.500 0.823
Base Grab 01/22/2014 10:10 01/22/2014 10:10 0.016 513.2 0.00020 0.00024 0.00130 0.00010 0.00180 0.00770 0.020 0.5 0.03 1.26 0.03 1,350 2 1 528 1.0 113.0 189 0.020 - -Base Grab 02/12/2014 09:15 02/12/2014 09:15 0.041 978.9 0.00020 0.00019 0.00076 0.00010 0.00170 0.00190 0.020 0.4 0.02 1.38 0.03 1,240 1 1 532 - - 52 0.044 - -Base Grab 03/17/2014 08:55 03/17/2014 08:55 0.046 1,139.1 0.00040 0.00110 0.00330 0.00039 0.00300 0.02400 0.020 1.1 0.07 1.21 0.03 2,460 2 2 642 - - 866 0.044 - -Base Grab 04/11/2014 08:45 04/11/2014 08:45 0.044 789.5 0.00020 0.00094 0.00280 0.00047 0.00300 0.01460 0.100 1.3 0.07 1.61 0.04 1,680 3 2 612 - - 1,046 0.049 - -Base Grab 05/14/2014 09:20 05/14/2014 09:20 - - - - - - - - - - - - - - - - - - 1,414 - - -Base Composite 05/14/2014 09:24 05/15/2014 06:46 0.030 550.3 0.00020 0.00088 0.00410 0.00083 0.00200 0.02020 0.120 1.0 0.09 2.08 0.03 1,350 6 4 540 - - - 0.056 - -Base Grab 05/29/2014 09:25 05/29/2014 09:25 - - - - - - - - - - - - - - - - - - - 1,300 - - -Base Composite 05/29/2014 11:17 05/30/2014 01:16 0.015 981.7 0.00020 0.00078 0.00230 0.00043 0.00160 0.00830 0.080 0.8 0.07 2.65 0.03 1,320 8 2 524 - - - 0.029 - -Base Grab 06/10/2014 08:55 06/10/2014 08:55 - - - - - - - - - - - - - - - - - - - 687 - - -Base Composite 06/10/2014 09:01 06/10/2014 17:01 - 425.1 - - - - - - 0.020 1.1 0.15 2.12 0.03 - 48 16 444 - - - 0.030 4.8 0.170Base Composite 06/10/2014 17:16 06/11/2014 02:16 0.032 446.1 0.00020 0.00150 0.00290 0.00032 0.00170 0.00950 0.020 0.7 0.06 1.86 0.03 1,190 3 1 456 - - - 0.033 - -Base Grab 07/02/2014 08:55 07/02/2014 08:55 - - - - - - - - - - - - - - - - - - - 161 - - -Base Composite 07/02/2014 09:01 07/03/2014 08:46 0.025 444.0 0.00020 0.00079 0.00330 0.00033 0.00190 0.01130 0.020 0.6 0.05 3.19 0.03 1,180 4 1 428 - - - 0.044 - -Base Grab 07/21/2014 09:25 07/21/2014 09:25 0.028 425.9 0.00020 0.00058 0.00170 0.00010 0.00200 0.00600 0.040 0.4 0.03 2.92 0.03 1,220 3 1 492 - - 78 0.028 - -Base Grab 08/13/2014 09:35 08/13/2014 09:35 - - - - - - - - - - - - - - - - - - - 461 - - -Base Composite 08/13/2014 09:43 08/14/2014 09:16 0.011 417.9 0.00020 0.00059 0.00250 0.00036 0.00230 0.00660 0.020 0.7 0.02 2.28 0.03 1,080 6 2 464 1.4 97.4 - 0.022 - -Base Grab 09/08/2014 09:15 09/08/2014 09:15 - - - - - - - - - - - - - - - - - - - 108 - -Base Composite 09/08/2014 09:17 09/09/2014 09:16 0.025 359.5 0.00020 0.00055 0.00220 0.00230 0.00190 0.00490 0.020 0.7 0.05 1.84 0.08 1,070 3 1 476 - - - 0.020 - -Base Grab 09/29/2014 09:10 09/29/2014 09:10 - - - - - - - - - - - - - - - - - - - 66 - - -Base Grab 10/09/2014 09:55 10/09/2014 09:55 - - - - - - - - - - - - - - - - - - - 28 - - -Base Composite 10/09/2014 09:57 10/10/2014 08:16 0.012 360.3 0.00020 0.00065 0.00180 0.00029 0.00180 0.00440 0.020 0.8 0.02 2.03 0.03 1,000 2 1 448 - - - 0.020 - -Base Grab 11/20/2014 09:40 11/20/2014 09:40 0.014 939.8 0.00020 0.00020 0.00080 0.00010 0.00200 0.00360 0.020 0.5 0.02 1.40 0.03 2,050 1 1 552 1.0 99.2 1 0.020 - -Base Grab 12/18/2014 09:10 12/18/2014 09:10 0.024 913.9 0.00020 0.00081 0.00140 0.00022 0.00360 0.00950 0.020 0.5 0.03 1.14 0.03 1,700 2 1 548 - - 12 0.020 - -
Base Average 0.026 645.7 0.00021 0.00070 0.00223 0.00045 0.00216 0.00946 0.037 0.7 0.05 1.93 0.034 1,421 6 2 512 1.1 103.2 431 0.032 4.800 0.170
Snow melt Grab 03/10/2014 12:40 03/10/2014 12:40 0.203 1,439.8 0.00048 0.02530 0.06830 0.03970 0.01480 0.35200 1.530 6.2 0.64 0.49 0.18 2,460 644 208 120 - - 1,550 0.240Snow melt Grab 03/13/2014 13:20 03/13/2014 13:20 0.289 979.9 0.00040 0.01510 0.05830 0.04020 0.01180 0.28800 1.020 5.0 0.63 0.35 0.12 1,750 212 78 104 - - 1,050 0.331Snow melt Grab 03/20/2014 15:30 03/20/2014 15:30 - 211.6 0.00027 0.01280 0.04480 0.03340 0.00850 0.20600 0.560 3.7 0.50 0.45 0.08 496 172 68 44 - - - 0.227Storm Grab 03/27/2014 13:40 03/27/2014 13:40 0.301 117.3 0.00044 0.03550 0.07120 0.05940 0.01960 0.00560 1.110 7.7 2.10 0.60 0.07 320 704 268 32 - - 565 0.356Storm Composite 04/23/2014 15:17 04/23/2014 17:25 0.036 203.4 0.00020 0.01050 0.02960 0.01340 0.00570 0.13600 0.680 3.9 0.32 0.96 0.09 1,130 94 43 156 - - - 0.289Storm Grab 04/24/2014 10:20 04/24/2014 10:20 - - - - - - - - - - - - - - - - - - - 1,986 -Storm Composite 04/26/2014 22:02 04/27/2014 15:16 0.038 15.7 0.00020 0.00860 0.02080 0.01950 0.00470 0.11400 0.450 2.1 0.25 0.31 0.03 64 247 113 40 - - - 0.067Storm Composite 04/28/2014 09:47 04/29/2014 09:01 0.040 17.6 0.00024 0.00750 0.02160 0.02180 0.00430 0.14100 0.140 1.9 0.26 0.33 0.03 91 182 75 40 - - - 0.082Storm Composite 05/08/2014 16:33 05/08/2014 17:46 0.032 16.3 0.00047 0.01750 0.05580 0.06200 0.01120 0.32500 0.900 4.4 0.64 0.48 0.04 72 696 260 40 - - - 0.045Storm Composite 05/11/2014 23:18 05/12/2014 03:31 0.039 9.9 0.00020 0.00420 0.01670 0.01380 0.00310 0.08850 0.160 1.2 0.23 0.13 0.03 48 73 28 44 - - - 0.069Storm Composite 05/19/2014 11:17 05/19/2014 15:31 0.042 4.1 0.00025 0.00880 0.02660 0.03410 0.00510 0.13300 0.190 1.8 0.30 0.19 0.03 39 171 52 228 - - - 0.071Storm Grab 05/19/2014 11:55 05/19/2014 11:55 - - - - - - - - - - - - - - - - - - - 1,414 -Storm Composite 05/27/2014 03:46 05/27/2014 10:46 0.005 15.4 0.00020 0.00640 0.02410 0.01740 0.00400 0.09930 0.140 2.7 0.43 0.44 0.03 89 208 105 64 - - - 0.022Storm Composite 05/31/2014 20:46 06/01/2014 06:46 0.022 4.8 0.00020 0.00370 0.01180 0.01450 0.00250 0.06170 0.060 1.1 0.20 0.22 0.03 37 113 45 40 - - - 0.020Storm Composite 06/07/2014 08:16 06/07/2014 13:01 8.3 0.00020 0.00440 0.01180 0.01040 0.00210 0.05220 0.140 1.0 0.19 0.22 0.03 53 59 20 28 - - - 0.048Storm Composite 06/14/2014 11:32 06/14/2014 15:16 0.065 20.4 0.00020 0.00680 0.01770 0.00970 0.00290 0.08600 0.040 2.4 0.38 0.05 0.03 106 93 64 40 - - - 0.104Storm Composite 06/14/2014 20:34 06/15/2014 03:31 0.025 3.6 0.00020 0.00400 0.01220 0.01460 0.00270 0.07570 0.110 1.0 0.14 0.19 0.03 42 65 22 20 - - - 0.020Storm Composite 06/16/2014 18:01 06/16/2014 22:01 0.021 11.1 0.00020 0.00480 0.01060 0.00660 0.00200 0.04970 0.020 0.9 0.14 0.21 0.03 58 34 16 44 - - - 0.029Storm Grab 06/19/2014 09:05 06/19/2014 09:05 - - - - - - - - - - - - - - - - - - - 5,200 -Storm Composite 07/07/2014 18:32 07/07/2014 19:04 0.046 10.9 0.00033 0.01020 0.03280 0.03410 0.00680 0.18700 0.220 2.5 0.36 0.31 0.03 59 209 81 36 - - - 0.068Storm Composite 07/11/2014 08:46 07/11/2014 10:01 0.035 2.0 0.00020 0.00540 0.01560 0.02050 0.00320 0.07640 0.020 0.9 0.16 0.06 0.03 32 103 27 32 - - - 0.040Storm Grab 07/11/2014 09:20 07/11/2014 09:20 - - - - - - - - - - - - - - - - - - - 8,500 -Storm Composite 07/25/2014 05:47 07/25/2014 06:47 - 18.8 0.00023 0.00870 0.03290 0.02180 0.00690 0.17600 0.220 2.8 0.42 0.57 0.03 113 153 59 68 - - - 0.417Storm Grab 07/25/2014 08:55 07/25/2014 08:55 - - -- -- -- -- -- -- - - - - - - - - - - - 9,700 -Storm Grab 08/10/2014 22:02 08/10/2014 22:47 0.058 21.4 0.00044 0.01270 0.04950 0.04330 0.01060 0.27200 0.280 1.9 0.34 0.60 0.03 117 6 4 48 - - - 0.339Storm Composite 08/18/2014 00:31 08/18/2014 01:16 0.047 6.3 0.00023 0.00770 0.02320 0.02580 0.00840 0.12800 0.230 1.6 0.26 0.21 0.03 43 242 102 40 - - - 0.068Storm Grab 08/21/2014 09:05 08/21/2014 09:05 - - - - - - - - - - - - - - - - - - - 23,100Storm Composite 08/30/2014 01:16 08/30/2014 02:46 - 2.4 0.00020 0.00360 0.01240 0.01320 0.00260 0.06390 0.070 0.6 0.13 0.16 0.03 40 66 23 36 - - - 0.057Storm Composite 08/31/2014 22:47 09/01/2014 01:32 - 4.4 0.00020 0.00290 0.00850 0.00570 0.00140 0.04020 0.030 0.6 0.11 0.08 0.03 40 105 51 28 - - - 0.043Storm Grab 10/01/2014 09:20 10/01/2014 09:20 - - - - - - - - - - - - - - - - - - - 19,500 -
Snow melt Average 0.246 877.1 0.00038 0.01773 0.05713 0.03777 0.01170 0.28200 1.037 5.0 0.59 0.43 0.127 1,569 343 118 89 - - 1,300 0.266Storm Average 0.053 25.7 0.00025 0.00870 0.02527 0.02308 0.00549 0.11556 0.261 2.1 0.37 0.32 0.036 130 181 73 55 - - 8,746 0.113
Annual Average 0.053 337.6 0.00025 0.00640 0.01913 0.01571 0.00474 0.08891 0.234 1.8 0.26 0.96 0.042 735 125 49 238 1.1 103.2 3,161 0.093Annual Maximum 0.301 1,439.8 0.00048 0.03550 0.07120 0.06200 0.01960 0.35200 1.530 7.7 2.10 3.19 0.180 2,460 704 268 642 1.4 113.0 23,100 0.417Annual Minimum 0.005 2.0 0.00020 0.00019 0.00076 0.00010 0.00140 0.00190 0.020 0.4 0.02 0.05 0.030 32 1 1 20 1.0 97.4 1 0.020Annual Median 0.034 160.4 0.00020 0.00420 0.01220 0.01320 0.00300 0.06170 0.090 1.1 0.15 0.53 0.030 320 66 23 86 1.0 99.2 866 0.045
Actual number less than value (<)Estimated concentration above the adjusted method detection limit and below the adjusted reporting limit.
- Not collected

East Kittsondale
2014 CRWD Stormwater Monitoring Report 124

Lake McCarrons
9 LAKE MCCARRONS SUBWATERSHED RESULTS
9.1 DESCRIPTION
The Lake McCarrons subwatershed drains 1,070 acres and is the northernmost subwatershed in CRWD, located entirely within the city limits of Roseville (Figure 9-2). Land use in the subwatershed is predominantly residential and parkland. The largest subwatershed within the Lake McCarrons subwatershed is the Villa Park subwatershed (753 acres), which flows through the Villa Park Wetland System before discharging into the lake. The Villa Park Wetland System is designed to capture and treat stormwater runoff from the Villa Park subwatershed before entering Lake McCarrons.
CRWD operates a monitoring station at the outlet of the Villa Park Wetland System (called Villa Park Outlet) in order to quantify and characterize the water exiting the wetland system to Lake McCarrons. CRWD also operates a flow-only station at the outlet of Lake McCarrons (called McCarrons Outlet) to determine total discharge from the lake during storm events (the lake only discharges when water levels are higher than normal). When it overflows, water flowing from the outlet of Lake McCarrons enters the Trout Brook Storm Sewer System which eventually discharges to the Mississippi River. For more information on Lake McCarrons water quality, refer to the CRWD 2014 Lakes Monitoring Report (CRWD, 2015).
Figure 9-1: The Lake McCarrons Outlet monitoring site location (left); and Villa Park Wetland System (Villa Park Outlet) monitoring site location (right).
2014 CRWD Stormwater Monitoring Report 125

Lake McCarrons
Figure 9-2: Map of the Lake McCarrons subwatershed and monitoring locations.
2014 CRWD Stormwater Monitoring Report 126

Lake McCarrons
9.2 2014 MONITORING SUMMARY – VILLA PARK OUTLET
The Lake McCarrons subwatershed has been monitored for discharge and water quality at the Villa Park Outlet from 2006-2014. Flow and water quality monitoring at this location generally occurs between the months of April to November. During the winter months, baseflow grab samples are taken once a month, but neither level nor flow are recorded during this period.
Summaries of 2014 monitoring data collected and observed at Villa Park Outlet are listed below. Monitoring efficiency at Villa Park Outlet is explained in Appendix B.
9.2.1 DISCHARGE
Level, velocity, and discharge were monitored at Villa Park Outlet for both baseflow and stormflow events in 2014.
• Total baseflow discharge: 12,167,166 cubic feet (Figure 9-3; Table 9-1) • Total stormflow discharge: 8,104,216 cubic feet (Figure 9-3; Table 9-1) • Total annual discharge: 20,271,382 cubic feet (Figure 9-4; Table 9-1)
9.2.2 TOTAL SUSPENDED SOLIDS (TSS)
Baseflow and stormflow samples were analyzed for TSS concentrations in mg/L in order to calculate event-based and total annual loads.
• Baseflow flow weighted average concentration: 5 mg/L (Table 9-1) • Stormflow flow weighted average concentration: 21 mg/L (Table 9-1) • Total baseflow TSS load: 3,821 lbs (Figure 9-7; Table 9-1) • Total stormflow TSS load: 10,419 lbs (Figure 9-7; Table 9-1) • Total annual TSS load: 14,240 lbs (Figure 9-7; Table 9-1)
9.2.3 TOTAL PHOSPHORUS (TP)
Baseflow and stormflow samples were analyzed for TP concentrations in mg/L in order to calculate event-based and total annual loads.
• Baseflow flow weighted average concentration: 0.18 mg/L (Table 9-1) • Stormflow flow weighted average concentration: 0.20 mg/L (Table 9-1) • Total baseflow TP load: 123 lbs (Figure 9-9; Table 9-1) • Total stormflow TP load: 102 lbs (Figure 9-9; Table 9-1) • Total annual TP load: 225 lbs (Figure 9-9; Table 9-1)
2014 CRWD Stormwater Monitoring Report 127

Discharge Lake McCarrons
Figure 9-3: Historical total monitored discharge volumes at Villa Park Outlet for baseflow and stormflow from 2006-2014.
0
5,000,000
10,000,000
15,000,000
20,000,000
25,000,000
2006 2007 2008 2009 2010 2011 2012 2013 2014
Dis
char
ge (c
f)
Year
Storm
Base
2014 CRWD Stormwater Monitoring Report 128

Discharge Lake McCarrons
Figure 9-4: Villa Park Outlet cumulative discharge and daily precipitation.
2014 CRWD Stormwater Monitoring Report 129
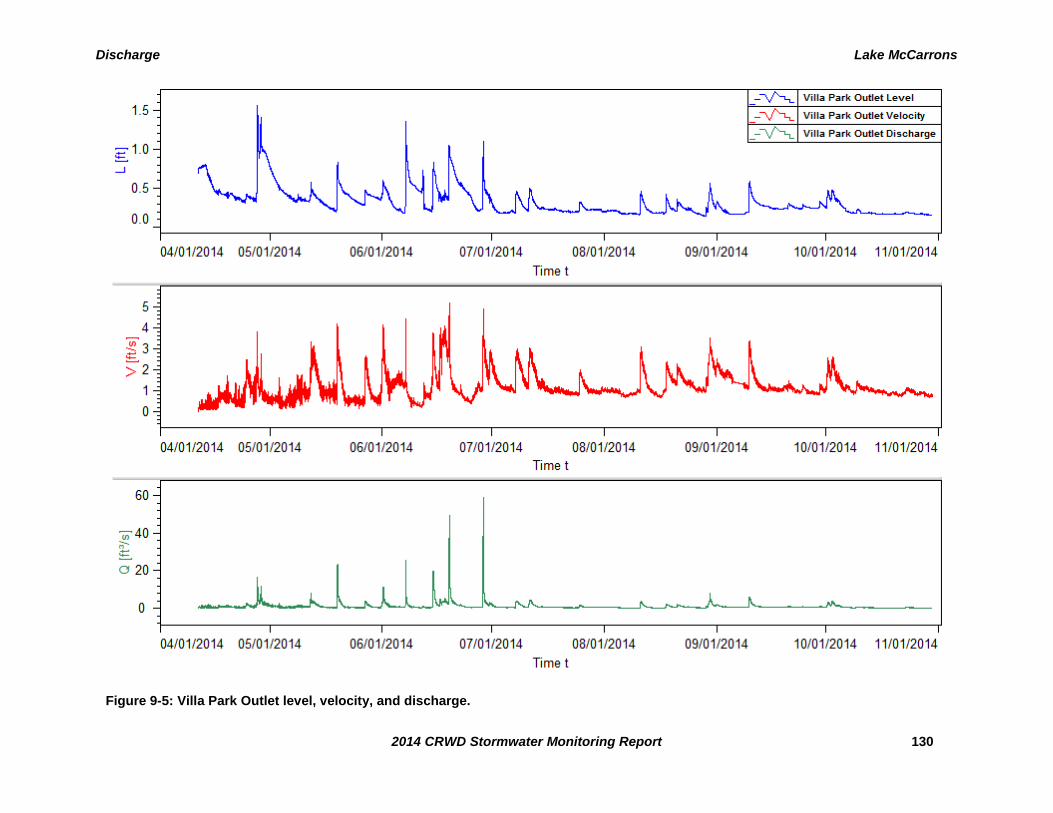
Discharge Lake McCarrons
Figure 9-5: Villa Park Outlet level, velocity, and discharge.
2014 CRWD Stormwater Monitoring Report 130

Discharge Lake McCarrons
Figure 9-6: Villa Park Outlet level, discharge, and precipitation.
2014 CRWD Stormwater Monitoring Report 131
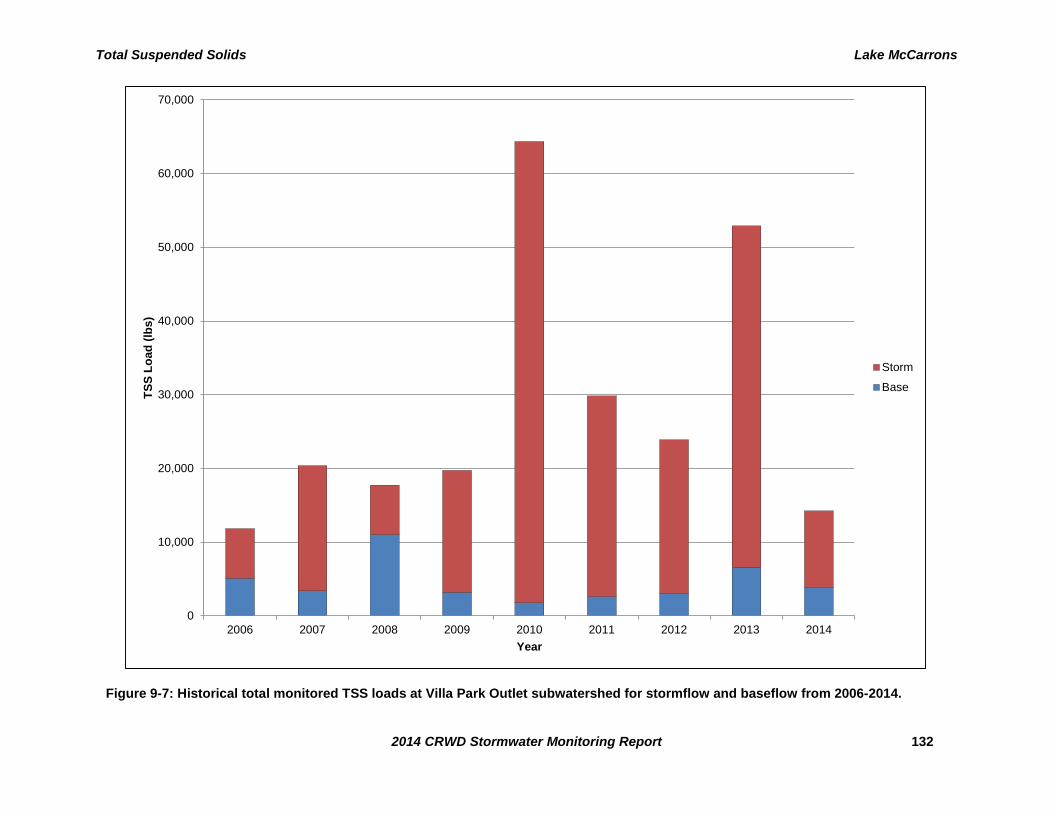
Total Suspended Solids Lake McCarrons
Figure 9-7: Historical total monitored TSS loads at Villa Park Outlet subwatershed for stormflow and baseflow from 2006-2014.
0
10,000
20,000
30,000
40,000
50,000
60,000
70,000
2006 2007 2008 2009 2010 2011 2012 2013 2014
TSS
Load
(lbs
)
Year
Storm
Base
2014 CRWD Stormwater Monitoring Report 132

Total Suspended Solids Lake McCarrons
Figure 9-8: Monthly average storm sample TSS concentrations in 2014 for Villa Park Outlet subwatershed and historical averages (2006-2013).
n=4
n=6
n=17
n=22
n=22
n=18
n=11
n=14
n=2
n=1
n=3
n=3
n=4 n=
1
n=1
n=1
n=2
0
20
40
60
80
100
120
Jan Feb Mar Apr May Jun Jul Aug Sep Oct Nov Dec
TSS
Con
cent
ratio
n (m
g/L)
Month
Historical Average (2006-2013)
2014
2014 CRWD Stormwater Monitoring Report 133

Total Phosphorus Lake McCarrons
Figure 9-9: Historical total monitored TP loads at Villa Park Outlet subwatershed for stormflow and baseflow from 2006-2014.
0
50
100
150
200
250
300
350
400
2006 2007 2008 2009 2010 2011 2012 2013 2014
TP L
oad
(lbs)
Year
Storm
Base
2014 CRWD Stormwater Monitoring Report 134

Total Phosphorus Lake McCarrons
Figure 9-10: Monthly average storm sample TP concentrations in 2014 for Villa Park Outlet subwatershed and historical averages (2006-2013).
n=4
n=6
n=17
n=22
n=22
n=18
n=11
n=14
n=2
n=1
n=3
n=3
n=4
n=1
n=1
n=1
n=2
0.00
0
0.00
0.10
0.20
0.30
0.40
0.50
0.60
Jan Feb Mar Apr May Jun Jul Aug Sep Oct Nov Dec
TP C
once
ntra
tion
(mg/
L)
Month
Historical Average (2006-2013)
2014
2014 CRWD Stormwater Monitoring Report 135

Lake McCarrons
Table 9-1: Villa Park Outlet subwatershed monitoring results, 2006-2014.
2006 2007 2008 2009 2010 2011 2012 2013 2014Subwatershed Area (ac) 753 753 753 753 753 753 753 753 753Total Rainfall (inches) 24.66 24.16 19.45 19.11 31.32 28.90 26.38 26.00 29.38Number of Monitoring Days 204 228 223 220 212 211 232 197 206Number of Storm Sampling Events 12 18 12 17 13 10 17 13 12Number of Storm Intervals 15 28 19 24 28 23 36 21 19Total Discharge (cf) 11,075,521 14,512,244 12,884,967 7,597,428 13,687,318 15,879,438 12,427,912 16,792,317 20,271,382Storm Flow Subtotal (cf) 5,564,657 9,835,524 7,839,161 5,668,868 11,029,258 12,382,914 9,898,813 12,633,927 8,104,216Baseflow Subtotal (cf) 5,510,864 4,656,826 5,045,805 1,928,561 2,658,060 3,496,524 2,529,099 4,158,390 12,167,166Average TSS Concentration (mg/L) 18 18 25 32 59 21 35 38 25Total FWA TSS (mg/L) 17 23 22 43 75 30 31 50 11Storm FWA TSS (mg/L) 19 28 14 49 91 35 34 59 21Baseflow FWA TSS (mg/L) 15 12 35 26 11 12 19 25 5Total TSS Load (lbs) 11,833 20,394 17,740 20,410 64,362 29,837 23,891 52,906 14,240Storm TSS Load (lbs) 6,742 16,981 6,725 17,230 62,584 27,241 20,840 46,308 10,419Baseflow TSS Load (lbs) 5,091 3,397 11,014 3,180 1,778 2,596 3,051 6,599 3,821Total TSS Yield (lb/ac) 16 27 24 27 85 40 32 70 19Average TP Concentration (mg/L) 0.28 0.26 0.32 0.29 0.34 0.21 0.32 0.41 0.23Total FWA TP Concentration (mg/L) 0.31 0.24 0.27 0.24 0.26 0.20 0.22 0.33 0.18Storm FWA TP Concentration (mg/L) 0.23 0.22 0.23 0.23 0.26 0.19 0.21 0.32 0.20Baseflow FWA TP (mg/L) 0.40 0.28 0.32 0.28 0.26 0.23 0.27 0.35 0.16Total TP Load (lbs) 216 216 215 113 225 195 174 343 225Storm TP Load (lbs) 79 136 114 80 182 145 132 251 102Baseflow TP Load (lbs) 137 80 101 33 43 51 42 92 123Total TP Yield (lb/ac) 0.29 0.29 0.29 0.15 0.30 0.26 0.23 0.46 0.30
2014 CRWD Stormwater Monitoring Report 136

Lake McCarrons
Table 9-2: Villa Park Outlet loading table.
Sampled Event Sample Event Loading Interval Event Volume (cf)
Interval TP (lb)
Interval TSS (lb) Start End
x Storm 04/27/2014 10:30 04/29/2014 03:30 469,192 4.01 843.10 x Storm 05/12/2014 00:45 05/14/2014 08:15 314,101 3.12 259.71 Storm 05/19/2014 11:05 05/19/2014 11:30 601 0.01 0.61 x Storm 05/19/2014 11:45 05/21/2014 10:55 667,500 5.00 626.30 x Storm 05/27/2014 05:10 05/30/2014 19:55 272,724 3.06 38.40 Storm 05/31/2014 23:30 06/01/2014 00:20 1,892 0.02 2.92 Storm 06/01/2014 01:50 06/01/2014 14:50 176,284 2.31 321.64 x Storm 06/07/2014 07:40 06/09/2014 01:05 432,871 5.90 394.63 x Storm 06/14/2014 20:00 06/18/2014 20:15 1,140,058 22.80 1,754.65 x Storm 06/19/2014 03:30 06/20/2014 11:50 1,302,615 13.55 1,149.73 x Storm 06/28/2014 15:40 07/02/2014 07:45 1,122,828 16.12 3,588.26 Storm 07/07/2014 14:10 07/07/2014 14:20 612 0.00 0.13 Storm 07/07/2014 18:00 07/09/2014 02:40 130,930 0.74 20.10 x Storm 07/11/2014 08:10 07/13/2014 15:30 322,466 1.23 70.81 x Storm 08/10/2014 21:50 08/13/2014 23:00 270,221 2.66 192.38 Storm 08/18/2014 00:10 08/22/2014 00:20 248,908 2.68 195.49 Storm 08/29/2014 17:07 09/02/2014 17:17 471,609 4.89 355.75 x Storm 09/09/2014 21:07 09/13/2014 21:17 450,934 6.24 288.80 x Storm 10/01/2014 10:30 10/04/2014 19:20 309,479 8.11 315.64
Storm Subtotal 8,105,825 102 10,419 Total 8,105,825 102 10,419
Month Base Loading Interval Monthly Base Volume (cf)
Interval TP (lb)
Interval TSS (lb) Start End
January 01/01/2014 00:00 01/31/2014 23:59 --- --- --- February 02/01/2014 00:00 02/28/2014 23:59 --- --- --- March 03/01/2014 00:00 03/31/2014 23:59 --- --- --- April 04/01/2014 00:00 04/30/2014 23:59 1,794,054 13.88 569 May 05/01/2014 00:00 05/31/2014 23:59 2,022,274 15.54 569 June 06/01/2014 00:00 06/30/2014 23:59 2,728,669 38.43 680 July 07/01/2014 00:00 07/31/2014 23:59 1,706,839 15.50 533 August 08/01/2014 00:00 08/31/2014 23:59 1,182,547 6.50 443 September 09/01/2014 00:00 09/30/2014 23:59 1,553,244 24.43 582 October 10/01/2014 00:00 10/31/2014 23:59 1,179,263 8.69 446 November 11/01/2014 00:00 11/30/2014 23:59 --- --- --- December 12/01/2014 00:00 12/31/2014 23:59 --- --- ---
Base Subtotal 12,166,891 123 3,821
TOTAL ANNUAL 20,272,716 225 14,240
2014 CRWD Stormwater Monitoring Report 137

Lake McCarrons
2014 CRWD Stormwater Monitoring Report 138

Lake McCarrons Table 9-3: 2014 Villa Park Outlet laboratory data.
VP OutSample Sampling Start Sampling End Ortho-P Cl Cd Cr Cu Pb Ni Zn NH3 TKN Total P NO3 NO2 TDS TSS VSS Hardness CBOD SO4 E. coli Dissolved PType Date/Time Date/Time mg/L mg/L mg/L mg/L mg/L mg/L mg/L mg/L mg/L mg/L mg/L mg/L mg/L mg/L mg/L mg/L mg/L mg/L mg/L mpn/100 mL mg/LBase Grab 01/22/2014 09:15 01/22/2014 09:15 0.035 243.2 0.00020 0.00014 0.00030 0.00010 0.00120 0.00190 0.80 2.2 0.18 0.05 0.03 838 5 2 500 1.5 33.2 18 0.053Base Grab 02/12/2014 08:25 02/12/2014 08:25 0.031 337.5 0.00020 0.00008 0.00100 0.00010 0.00100 0.00310 1.04 1.8 0.16 0.15 0.03 988 4 2 488 - - 5 0.031Base Grab 03/17/2014 08:35 03/17/2014 08:35 0.139 443.0 0.00020 0.00094 0.00390 0.00089 0.00140 0.01840 0.63 2.7 0.27 0.52 0.04 982 6 4 220 - - 129 0.160Base Grab 04/11/2014 08:20 04/11/2014 08:20 0.026 91.6 0.00020 0.00034 0.00100 0.00049 0.00069 0.00490 0.22 1.2 0.12 0.28 0.03 279 5 3 124 - - 10 0.038Base Grab 05/14/2014 10:00 05/14/2014 10:00 - - - - - - - - - - - - - - - - - - 50 -Base Grab 05/15/2014 10:30 05/15/2014 10:30 0.014 89.3 0.00020 0.00026 0.00150 0.00022 0.00110 0.00240 0.11 1.1 0.04 0.05 0.03 348 2 2 200 - - - 0.045Base Grab 05/29/2014 10:00 05/29/2014 10:00 - - - - - - - - - - - - - - - - - - 8 -Base Composite 05/29/2014 10:31 05/30/2014 10:46 0.035 89.1 0.00020 0.00021 0.00110 0.00054 0.00120 0.00760 0.20 1.2 0.20 0.08 0.05 339 7 6 200 - - - 0.074Base Grab 06/10/2014 09:20 06/10/2014 09:20 - - - - - - - - - - - - - - - - - - - 8 -Base Composite 06/10/2014 10:01 06/11/2014 10:15 0.059 71.8 0.00020 0.00021 0.00190 0.00038 0.00710 0.00890 0.26 1.1 0.23 0.06 0.03 295 4 3 152 - - - 0.060Base Grab 07/02/2014 09:20 07/02/2014 09:20 - - - - - - - - - - - - - - - - - - - 435 -Base Composite 07/02/2014 09:46 07/03/2014 10:30 0.083 43.0 0.00052 0.00033 0.00160 0.00062 0.00130 0.01010 0.27 1.0 0.20 0.06 0.03 225 6 4 144 - - - 0.101Base Grab 07/21/2014 09:45 07/21/2014 09:45 0.032 75.8 0.00020 0.00012 0.00030 0.00010 0.00080 0.00100 0.09 0.6 0.10 0.05 0.03 346 4 3 244 - - 17 0.054Base Grab 08/13/2014 10:05 08/13/2014 10:05 - - - - - - - - - - - - - - - - - - - 1,300 -Base Composite 08/13/2014 10:16 08/14/2014 10:45 0.025 98.3 0.00020 0.00050 0.00096 0.00061 0.00130 0.00620 0.02 0.7 0.09 0.05 0.03 451 6 5 300 5.8 19.6 - 0.027Base Grab 09/08/2014 09:40 09/08/2014 09:40 - - - - - - - - - - - - - - - - - - - 727 -Base Composite 09/08/2014 10:16 09/09/2014 07:45 0.049 72.0 0.00020 0.00057 0.00100 0.00038 0.00100 0.01010 0.04 1.1 0.25 0.05 0.03 322 6 4 232 - - - 0.039Base Grab 10/09/2014 10:15 10/09/2014 10:15 - - - - - - - - - - - - - - - - - - - 34 -Base Composite 10/09/2014 11:01 10/10/2014 02:15 0.025 81.6 0.00020 0.00020 0.00073 0.00044 0.00100 0.00570 0.04 0.7 0.12 0.05 0.03 324 6 4 248 - - - -Base Grab 11/20/2014 10:15 11/20/2014 10:15 0.032 143.1 0.00020 0.00013 0.00030 0.00027 0.00120 0.00092 0.52 1.7 0.17 0.05 0.03 18 5 4 432 3.2 27.1 18 0.025Base Grab 12/18/2014 09:55 12/18/2014 09:55 0.011 297.6 0.00020 0.00081 0.00180 0.00065 0.00160 0.01250 0.32 1.8 0.20 0.52 0.03 548 10 9 324 - - 548 0.020
Base Average 0.043 155.5 0.00022 0.00035 0.00124 0.00041 0.00156 0.00669 0.33 1.4 0.17 0.14 0.03 450 5 4 272 3.5 26.6 236 0.056
Snow melt Grab 02/18/2014 14:15 02/18/2014 14:15 0.028 987.7 0.00054 0.01760 0.02140 0.01010 0.00940 0.13400 1.30 9.7 1.52 0.58 0.06 2,140 275 140 468 - - 1,190 0.057Snow melt Grab 02/19/2014 15:20 02/19/2014 15:20 0.020 549.0 0.00020 0.00140 0.00250 0.00140 0.00180 0.01720 1.02 2.5 0.17 0.57 0.03 1,210 25 13 484 - - - 0.020Snow melt Grab 03/10/2014 13:50 03/10/2014 13:50 0.130 566.7 0.00020 0.00230 0.00410 0.00170 0.00220 0.03030 1.41 3.8 0.31 0.20 0.06 1,230 39 22 404 - - 2,420 0.138Snow melt Grab 03/13/2014 13:30 03/13/2014 13:30 0.100 778.0 0.00040 0.00200 0.00550 0.00130 0.00210 0.03270 1.25 3.4 0.30 0.29 0.06 1,580 19 11 316 - - 3,260 0.105Snow melt Grab 03/20/2014 14:10 03/20/2014 14:10 - 620.7 0.00040 0.00100 0.00380 0.00076 0.00170 0.02070 0.79 3.3 0.27 0.33 0.06 1,260 14 8 292 - - - 0.073Storm Grab 03/27/2014 13:45 03/27/2014 13:45 0.149 284.8 0.00020 0.00580 0.01150 0.04150 0.00430 0.06360 0.61 3.2 0.56 0.34 0.04 624 110 54 208 - - 8,660 0.190Storm Grab 04/24/2014 08:50 04/24/2014 08:50 - - - - - - - - - - - - - - - - - - - 72 -Storm Grab 04/25/2014 09:50 04/25/2014 09:50 0.006 180.4 0.00020 0.00062 0.00160 0.00038 0.00100 0.00870 0.02 2.0 0.09 0.70 0.03 594 7 5 228 - - - 0.020Storm Composite 04/27/2014 09:16 04/27/2014 15:31 0.012 169.8 0.00020 0.00200 0.00370 0.00370 0.00240 0.02660 0.04 2.1 0.19 0.10 0.03 481 149 40 176 - - - 0.020Storm Composite 04/28/2014 10:46 04/28/2014 16:00 0.026 80.3 0.00020 0.00160 0.00330 0.00210 0.00130 0.02020 0.12 1.3 0.13 0.37 0.03 208 19 7 88 - - - 0.065Storm Composite 05/12/2014 10:31 05/12/2014 13:15 - 98.3 0.00020 0.00100 0.00200 0.00044 0.00170 0.01160 0.02 1.5 0.14 0.05 0.03 9 6 188 - - - 0.043Storm Grab 05/19/2014 11:47 05/19/2014 11:47 - - - - - - - - - - - - - - - - - - 816 -Storm Composite 05/19/2014 13:16 05/19/2014 18:16 0.013 108.8 0.00020 0.00042 0.00180 0.00092 0.00120 0.01330 0.18 1.3 0.12 0.06 0.03 381 13 8 28 - - - 0.020Storm Composite 05/27/2014 07:00 05/27/2014 14:15 0.072 79.5 0.00020 0.00029 0.00100 0.00055 0.00110 0.00990 0.55 1.4 0.16 0.09 0.03 293 3 3 176 - - - 0.086Storm Composite 06/07/2014 08:16 06/07/2014 14:30 - 69.5 0.00020 0.00037 0.00150 0.00094 0.00160 0.00780 0.41 1.3 0.22 0.10 0.04 286 13 7 180 - - - 0.068Storm Composite 06/14/2014 22:16 06/15/2014 03:45 0.052 64.3 0.00020 0.00052 0.00170 0.00140 0.00130 0.01340 0.49 1.5 0.30 0.06 0.03 267 20 13 140 - - - 0.056Storm Composite 06/19/2014 05:27 06/19/2014 11:12 - 42.2 0.00020 0.00050 0.00130 0.00120 0.00130 0.00950 0.42 1.0 0.18 0.16 0.03 192 12 5 116 - - - 0.096Storm Grab 06/19/2014 09:00 06/19/2014 09:00 - - - - - - - - - - - - - - - - - - - 1,203 -Storm Composite 06/28/2014 17:01 06/28/2014 20:15 0.055 54.0 0.00020 0.00120 0.00260 0.00280 0.00190 0.01940 0.43 1.5 0.23 0.16 0.04 257 44 14 152 - - - 0.063Storm Grab 07/11/2014 09:11 07/11/2014 09:11 - - - - - - - - - - - - - - - - - - - 548 -Storm Composite 07/11/2014 11:16 07/12/2014 00:01 0.029 70.5 0.00020 0.00024 0.00140 0.00029 0.00094 0.00520 0.09 0.7 0.09 0.10 0.03 301 4 3 208 - - - 0.028Storm Grab 07/25/2014 08:00 07/25/2014 08:00 - - - - - - - - - - - - - - - - - - - 512 -Storm Composite 08/11/2014 02:16 08/11/2014 10:00 0.029 117.0 0.00020 0.00050 0.00081 0.00052 0.00150 0.00540 0.07 0.9 0.14 0.07 0.03 524 10 5 336 - - - 0.022Storm Grab 08/21/2014 08:30 08/21/2014 08:30 - - - - - - - - - - - - - - - - - - - 47,100 -Storm Composite 09/09/2014 22:16 09/10/2014 09:30 0.060 58.4 0.00020 0.00039 0.00140 0.00051 0.00096 0.00910 0.02 1.2 0.23 0.05 0.03 256 9 6 160 7.2 7.3 - 0.132Storm Grab 10/01/2014 10:10 10/01/2014 10:10 - - - - - - - - - - - - - - - - - - - 29,200 -Storm Composite 10/01/2014 11:01 10/02/2014 09:00 0.061 85.2 0.00020 0.00023 0.00110 0.00042 0.00100 0.00820 0.02 1.5 0.30 0.05 0.03 330 13 10 226 - - - 0.078Storm Composite 10/02/2014 15:46 10/03/2014 09:00 0.063 85.8 0.00020 0.00023 0.00130 0.00140 0.00110 0.00920 0.11 1.3 0.23 0.05 0.03 324 9 8 256 - - - 0.070
Snow melt Average 0.070 700.4 0.00035 0.00486 0.00746 0.00305 0.00344 0.04698 1.154 4.5 0.51 0.39 0.05 1,484 74 39 393 - - 2,290 0.079Storm Average 0.048 103.1 0.00020 0.00099 0.00238 0.00369 0.00154 0.01507 0.225 1.5 0.21 0.16 0.03 355 28 12 179 7.2 7.3 11,014 0.066
Annual Average 0.048 209.4 0.00023 0.00129 0.00265 0.00229 0.00182 0.01628 0.40 1.9 0.23 0.19 0.04 560 25 13 247 4.4 21.8 3,932 0.064Annual Maximum 0.149 987.7 0.00054 0.01760 0.02140 0.04150 0.00940 0.13400 1.41 9.7 1.52 0.70 0.06 2,140 275 140 500 7.2 33.2 47,100 0.190Annual Minimum 0.006 42.2 0.00020 0.00008 0.00030 0.00010 0.00069 0.00092 0.02 0.6 0.04 0.05 0.03 18 2 2 28 1.5 7.3 5 0.020Annual Median 0.032 91.6 0.00020 0.00050 0.00150 0.00061 0.00130 0.00950 0.26 1.4 0.19 0.09 0.03 343 9 6 220 4.5 23.4 512 0.057
Actual number less than value (<)Actual number greater than value (>)Estimated concentration above the adjusted method detection limit and below the adjusted reporting limit.
- Not collected
2014 CRWD Stormwater Monitoring Report 139

Lake McCarrons
2014 CRWD Stormwater Monitoring Report 140

Lake McCarrons
9.3 2014 MONITORING SUMMARY – LAKE MCCARRONS OUTLET
The discharge at the outlet of Lake McCarrons has been monitored from 2006-2014. Flow monitoring at this location generally occurs between the months of April to November. During the winter months, level and flow are not recorded. However, outflow during this time period is rare.
A summary of the 2014 monitoring data collected and observed at McCarrons Outlet is listed below. Monitoring efficiency at McCarrons Outlet is explained in Appendix B.
9.3.1 DISCHARGE
Level, velocity, and discharge were monitored at McCarrons Outlet in 2014 (Figure 9-11).
• Total Annual Discharge: 72,267,022 cubic feet
Table 9-4: Historical stage and discharge (2005-2014) at Lake McCarrons Outlet monitoring station.
Year Average Stage (ft) Discharge (cf)2005 0.16 83,156,6302006 0.10 8,603,9542007 0.13 18,831,1562008 0.07 4,888,5482009 0.11 9,673,9892010 0.23 13,998,9002011 0.41 21,723,8002012 NA NA2013 0.39 38,664,0002014 0.55 72,267,022
Historical Average (2005-2013) 0.17 24,942,622
NA: Not Available
2014 CRWD Stormwater Monitoring Report 141

Discharge Lake McCarrons
Figure 9-11: Lake McCarrons Outlet level, velocity, and discharge.
2014 CRWD Stormwater Monitoring Report 142
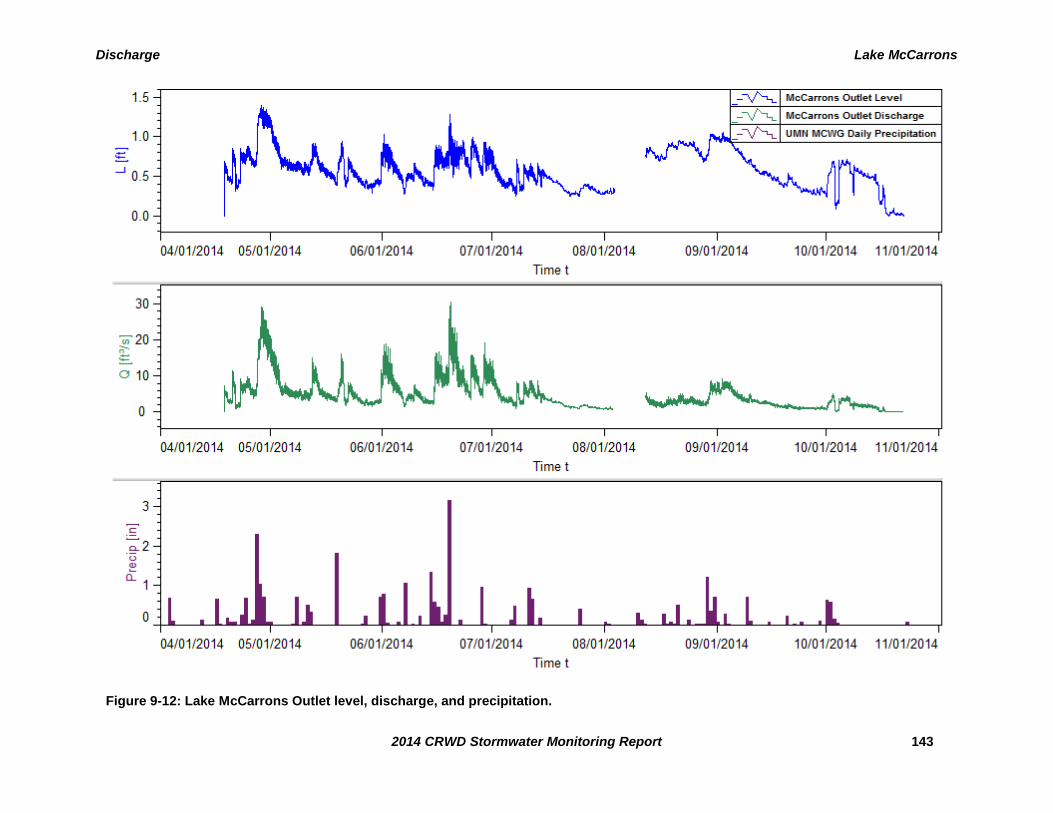
Discharge Lake McCarrons
Figure 9-12: Lake McCarrons Outlet level, discharge, and precipitation.
2014 CRWD Stormwater Monitoring Report 143

Lake McCarrons
2014 CRWD Stormwater Monitoring Report 144

Phalen Creek
2014 CRWD Stormwater Monitoring Report 145
10 PHALEN CREEK SUBWATERSHED RESULTS
10.1 DESCRIPTION
The Phalen Creek subwatershed is the eastern-most subwatershed in CRWD (Figure 10-2).
Located entirely within the city limits of St. Paul, Phalen Creek drains 1,433 acres and outlets to
the Mississippi River. CRWD monitors the Phalen Creek storm sewer near its outlet to the
Mississippi River at the Bruce Vento Nature Sanctuary. Land use in the Phalen Creek
subwatershed is a mix of industrial, commercial, and residential with approximately 50%
impervious surfaces (CRWD, 2000).
Figure 10-1: The Phalen Creek monitoring site location (left), flow-logging and sampling equipment installed inside storm tunnel (top right), and open channel entrance (bottom right).

Phalen Creek
2014 CRWD Stormwater Monitoring Report 146
Figure 10-2: Map of the Phalen Creek subwatershed and monitoring location.

Phalen Creek
2014 CRWD Stormwater Monitoring Report 147
10.2 2014 MONITORING SUMMARY
The Phalen Creek subwatershed has been monitored for flow and water quality since 2005. From
2005 to 2008, monitoring only occurred during the spring, summer, and fall. In 2009, monitoring
occurred from April to December and beginning in 2010, the subwatershed has been monitored
for the full calendar year recording continuous flow data. Since 2010, one full water quality
sample, at a minimum, has been collected each month. Due to these differences in monitoring
period, the 2010-2014 loading and discharge data may show significant differences when
compared to pre-2010 data. Stormflow data should not be affected by differences in monitoring
period as all storm samples since 2005 were collected during the spring, summer, or fall.
The Phalen Creek monitoring site is located close to the storm sewer’s outfall to the Mississippi
River. The river occasionally backs up into the pipe interfering with the accuracy of the flow
measurements.
Summaries of 2014 monitoring data collected and observed at Phalen Creek are listed below.
Monitoring efficiency at Phalen Creek is explained in Appendix B.
10.2.1 DISCHARGE
Level, velocity, and discharge were monitored at Phalen Creek for both baseflow and stormflow
events in 2014.
Total baseflow discharge: 170,988,210 cubic feet (Figure 10-3; Table 10-1)
Total stormflow discharge: 36,284,992 cubic feet (Figure 10-3; Table 10-1)
Total snowmelt discharge: 1,915,314 cubic feet (Figure 10-3; Table 10-1)
Total annual discharge: 209,188,516 cubic feet (Figure 10-4)
10.2.2 TOTAL SUSPENDED SOLIDS (TSS)
Baseflow, stormflow, and snowmelt samples were analyzed for TSS concentrations in mg/L in
order to calculate event-based and total annual loads.
Baseflow flow weighted average concentration: 4 mg/L (Table 10-1)
Stormflow flow weighted average concentration: 256 mg/L (Table 10-1)
Snowmelt flow weighted average concentration: 389 mg/L (Table 10-1)
Total baseflow TSS load: 41,990 lbs (Figure 10-7; Table 10-1)
Total stormflow TSS load: 582,013 lbs (Figure 10-7; Table 10-1)
Total snowmelt TSS load: 46,798 lbs (Figure 10-7; Table 10-1)
Total annual TSS load: 670,800 lbs (Figure 10-7; Table 10-1)
10.2.3 TOTAL PHOSPHORUS (TP)
Baseflow, stormflow, and snowmelt samples were analyzed for TP concentrations in mg/L in
order to calculate event-based and total annual loads.
Baseflow flow weighted average concentration: 0.06 mg/L (Table 10-1)

Phalen Creek
2014 CRWD Stormwater Monitoring Report 148
Stormflow flow weighted average concentration: 0.52 mg/L (Table 10-1)
Snowmelt flow weighted average concentration: 1.07 mg/L (Table 10-1)
Total baseflow TP load: 574 lbs (Figure 10-9; Table 10-1)
Total stormflow TP load: 1,181 lbs (Figure 10-9; Table 10-1)
Total snowmelt TP load: 129 lbs (Figure 10-9; Table 10-1)
Total annual TP load: 1,883 lbs (Figure 10-9; Table 10-1)
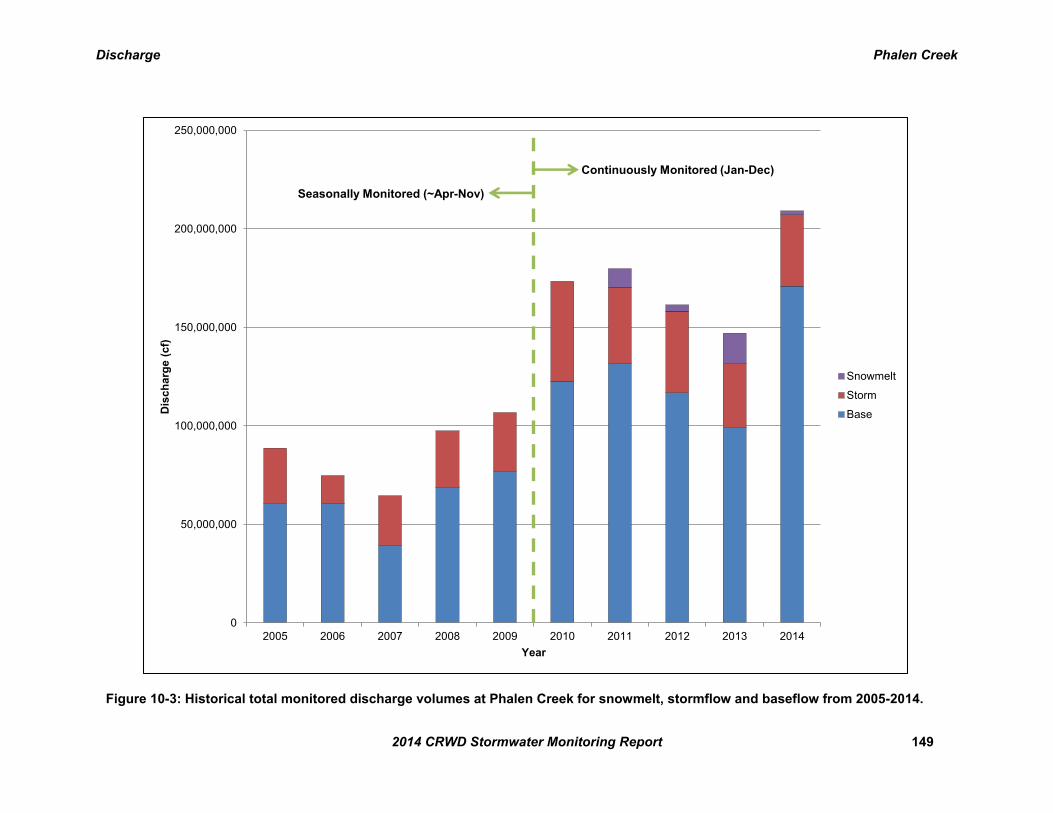
Discharge Phalen Creek
2014 CRWD Stormwater Monitoring Report 149
Figure 10-3: Historical total monitored discharge volumes at Phalen Creek for snowmelt, stormflow and baseflow from 2005-2014.
0
50,000,000
100,000,000
150,000,000
200,000,000
250,000,000
2005 2006 2007 2008 2009 2010 2011 2012 2013 2014
Dis
ch
arg
e (
cf)
Year
Snowmelt
Storm
Base
Seasonally Monitored (~Apr-Nov)
Continuously Monitored (Jan-Dec)

Discharge Phalen Creek
2014 CRWD Stormwater Monitoring Report 150
Figure 10-4: Phalen Creek cumulative discharge and daily precipitation.
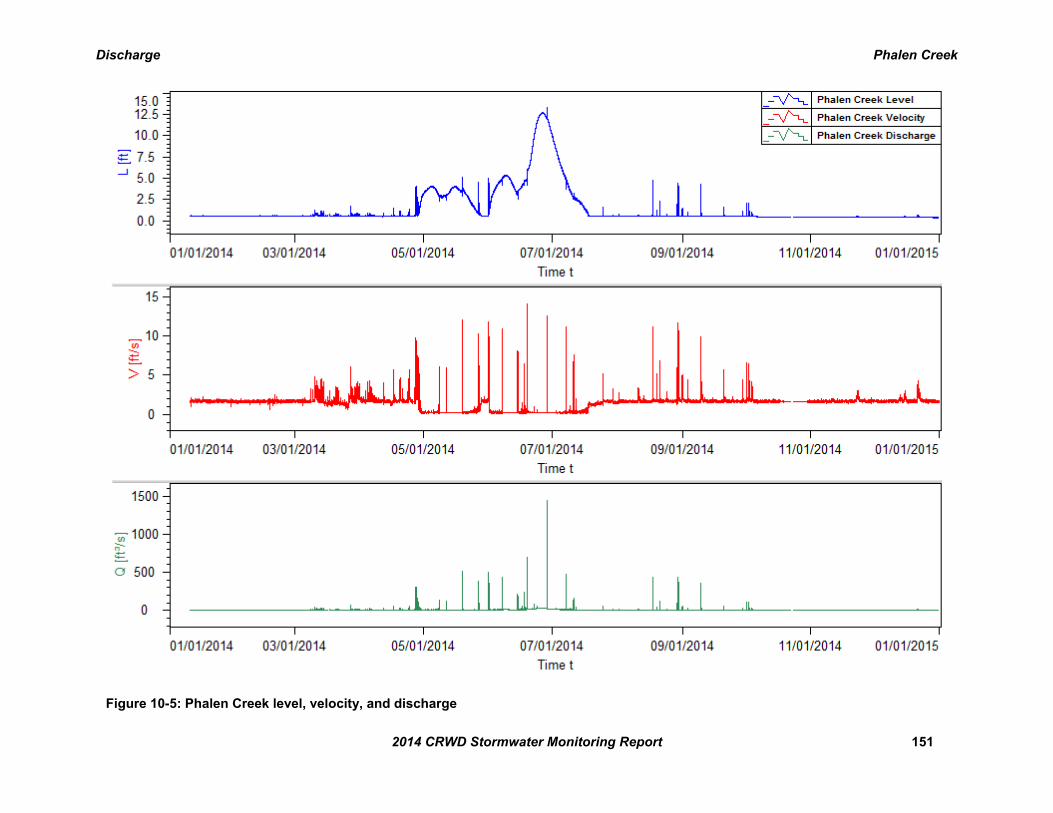
Discharge Phalen Creek
2014 CRWD Stormwater Monitoring Report 151
Figure 10-5: Phalen Creek level, velocity, and discharge

Discharge Phalen Creek
2014 CRWD Stormwater Monitoring Report 152
Figure 10-6: Phalen Creek level, discharge, and precipitation.

Total Suspended Solids Phalen Creek
2014 CRWD Stormwater Monitoring Report 153
Figure 10-7: Historical total monitored TSS loads at Phalen Creek subwatershed for snowmelt, stormflow and baseflow from 2005-2014.
0
200,000
400,000
600,000
800,000
1,000,000
1,200,000
1,400,000
2005 2006 2007 2008 2009 2010 2011 2012 2013 2014
TS
S L
oad
(lb
s)
Year
Snowmelt
Storm
Base

Total Suspended Solids Phalen Creek
2014 CRWD Stormwater Monitoring Report 154
Figure 10-8: Monthly average storm sample TSS concentrations in 2014 for Phalen Creek subwatershed and historical averages (2005-2013).
n=
5
n=
8
n=
19
n=
28
n=
25
n=
26
n=
20
n=
15
n=
1
n=
1
n=
2
n=
1
n=
1
n=
3
n=
1
n=
2
0
100
200
300
400
500
600
700
Jan Feb Mar Apr May Jun Jul Aug Sep Oct Nov Dec
TS
S C
on
cen
trati
on
(m
g/L
)
Month
Historical Average (2005-2013)
2014

Total Phosphorus Phalen Creek
2014 CRWD Stormwater Monitoring Report 155
Figure 10-99: Historical total monitored TP loads at Phalen Creek subwatershed for snowmelt, stormflow and baseflow from 2005-2014.
0
500
1,000
1,500
2,000
2,500
2005 2006 2007 2008 2009 2010 2011 2012 2013 2014
TP
Lo
ad
(lb
s)
Year
Snowmelt
Storm
Base

Total Phosphorus Phalen Creek
2014 CRWD Stormwater Monitoring Report 156
Figure 10-10: Historical total monitored TP loads at Phalen Creek subwatershed for snowmelt, stormflow and baseflow from 2005-2014.
0
500
1,000
1,500
2,000
2,500
2005 2006 2007 2008 2009 2010 2011 2012 2013 2014
TP
Lo
ad
(lb
s)
Year
Snowmelt
Storm
Base
Figure 10-1011: Monthly average storm sample TP concentrations in 2014 for Phalen Creek subwatershed and historical averages (2005-2013).
n=
5
n=
8
n=
19
n=
28
n=
25
n=
26
n=
20
n=
15
n=
1
n=
1
n=
2
n=
1
n=
0
n=
1
n=
3
n=
1
n=
2
0.00
0.20
0.40
0.60
0.80
1.00
1.20
1.40
1.60
Jan Feb Mar Apr May Jun Jul Aug Sep Oct Nov Dec
TP
Co
nc
en
trati
on
(m
g/L
)
Month
Historical Average (2005-2013)
2014

Phalen Creek
2014 CRWD Stormwater Monitoring Report 157
Table 10-1: Phalen Creek subwatershed monitoring results, 2005-2014.
2005 2006 2007 2008 2009 2010 2011 2012 2013 2014
Subwatershed Area (ac) 1,433 1,433 1,433 1,433 1,433 1,433 1,433 1,433 1,433 1,433
Total Rainfall (inches) 29.28 24.13 13.96 17.73 20.34 36.32 33.62 29.73 31.20 35.44
Number of Monitoring Days 197 194 134 210 262 362 365 348 342 344
Number of Storm Sampling Events 15 7 16 17 18 22 6 18 18 13
Number of Storm Intervals 23 15 22 38 33 55 29 40 43 50
Number of Snowmelt Sampling Events NA NA NA NA NA NA 6 2 1 3
Number of Snowmelt Intervals NA NA NA NA NA NA 8 13 17 7
Total Discharge (cf) 88,688,082 74,856,833 64,631,475 97,607,350 106,837,331 173,450,665 179,835,227 161,506,783 147,100,294 209,188,516
Storm Flow Subtotal (cf) 28,075,754 14,451,216 25,260,005 29,007,153 30,113,506 50,698,610 38,703,641 41,442,850 32,392,177 36,284,992
Snowmelt Flow Subtotal (cf) NA NA NA NA NA NA 9,361,953 3,153,892 15,527,373 1,915,314
Baseflow Subtotal (cf) 60,612,328 60,405,617 39,371,470 68,600,197 76,723,824 122,752,055 131,769,633 116,910,040 99,180,744 170,988,210
Average TSS Concentration (mg/L) 289 183 103 169 136 204 34 68 105 156
Total FWA TSS (mg/L) 185 115 105 70 80 112 28 42 49 57
Storm FWA TSS (mg/L) 535 454 164 207 277 369 92 141 165 256
Snowmelt FWA TSS (mg/L) NA NA NA NA NA NA 53 78 83 389
Baseflow FWA TSS (mg/L) 23 34 3 11 3 5 8 6 5 4
Total TSS Load (lbs) 1,022,726 538,550 422,175 423,925 535,477 1,209,635 316,563 423,213 448,171 670,800
Storm TSS Load (lbs) 937,202 409,501 415,784 375,408 520,356 1,167,829 221,169 365,001 334,441 582,013
Snowmelt TSS Load (lbs) NA NA NA NA NA NA 30,974 15,357 80,533 46,798
Baseflow TSS Load (lbs) 85,524 129,049 6,391 48,517 15,121 41,806 64,419 42,855 33,197 41,990
Total TSS Yield (lb/ac) 714 376 295 296 374 844 221 295 313 468
Average TP Concentration (mg/L) 0.39 0.29 0.20 0.39 0.30 0.35 0.16 0.21 0.20 0.32
Total FWA TP (mg/L) 0.22 0.20 0.17 0.17 0.17 0.19 0.13 0.15 0.16 0.16
Storm FWA TP (mg/L) 0.57 0.57 0.34 0.44 0.48 0.54 0.28 0.33 0.33 0.52
Snowmelt FWA TP (mg/L) NA NA NA NA NA NA 0.27 0.39 0.44 1.07
Baseflow FWA TP (mg/L) 0.07 0.20 0.06 0.06 0.05 0.05 0.08 0.07 0.06 0.06
Total TP Load (lbs) 1242 914 674 1,033 1,157 2,104 1,474 1,470 1,483 1,883
Storm TP Load (lbs) 993 518 536 796 902 1,706 667 864 672 1,181
Snowmelt TP Load (lbs) NA NA NA NA NA NA 157 77 426 129
Baseflow TP Load (lbs) 249 396 138 237 255 398 650 530 385 574
Total TP Yield (lb/ac) 0.87 0.64 0.47 0.72 0.81 1.47 1.03 1.03 1.03 1.31
NA: Not available. Snow melt events w ere not monitored or sampled until 2011.

Phalen Creek
2014 CRWD Stormwater Monitoring Report 158
Table 10-2: 2014 Phalen Creek subwatershed loading table.
Sampled Event Sample Event Loading Interval Event Volume
(cf) Interval TP
(lb) Interval TSS
(lb) Start End
Snowmelt 03/09/2014 12:50 03/09/2014 13:10 1,686 0.32 49
x Snowmelt 03/10/2014 10:45 03/11/2014 07:45 701,602 46.21 25,230
Snowmelt 03/11/2014 12:15 03/11/2014 18:50 145,123 13.02 1,955
x Snowmelt 03/13/2014 11:20 03/13/2014 22:50 475,361 31.42 9,455
Snowmelt 03/14/2014 12:05 03/14/2014 18:30 215,531 14.13 2,105
x Snowmelt 03/20/2014 12:20 03/20/2014 21:15 267,214 15.61 6,740
Snowmelt 03/21/2014 12:45 03/21/2014 21:00 120,091 8.46 1,262
x Storm 03/27/2014 13:15 03/27/2014 19:55 486,175 80.92 32,555
Storm 03/28/2014 11:45 03/28/2014 18:50 107,829 8.29 1,240
Storm 03/29/2014 12:30 03/29/2014 19:55 134,961 9.31 1,389
Storm 03/30/2014 11:00 03/31/2014 00:15 359,619 19.97 2,959
Storm 04/04/2014 13:35 04/04/2014 20:10 130,554 4.35 2,448
Storm 04/05/2014 11:50 04/05/2014 22:35 360,185 7.72 4,126
Storm 04/12/2014 06:45 04/12/2014 11:00 92,271 2.04 1,094
Storm 04/16/2014 18:15 04/17/2014 04:30 663,027 11.30 5,814
Storm 04/19/2014 22:00 04/20/2014 05:30 285,427 5.37 2,812
Storm 04/21/2014 03:30 04/21/2014 08:45 57,406 1.66 923
Storm 04/23/2014 19:45 04/23/2014 22:45 72,764 1.71 924
x Storm 04/24/2014 06:45 04/24/2014 16:15 628,970 10.69 4,872
Storm 04/26/2014 21:45 04/26/2014 23:45 17,851 0.79 454
x Storm 04/27/2014 03:45 04/29/2014 00:05 5,624,739 69.15 44,663
Storm 04/29/2014 02:55 04/29/2014 15:00 576,390 10.19 5,280
Storm 04/29/2014 16:45 04/29/2014 19:40 37,369 1.62 928
Storm 05/08/2014 07:40 05/08/2014 09:35 37,159 1.91 843
Storm 05/08/2014 15:55 05/09/2014 01:00 203,567 8.57 3,714
Storm 05/11/2014 23:10 05/12/2014 06:05 594,863 17.95 7,470
x Storm 05/19/2014 11:05 05/19/2014 19:45 2,268,435 112.21 66,282
Storm 05/27/2014 05:05 05/27/2014 10:10 1,008,981 27.86 11,439
Storm 05/27/2014 15:00 05/27/2014 20:45 314,240 9.80 4,098
x Storm 05/31/2014 20:00 06/01/2014 12:05 3,428,478 71.43 50,238
Storm 06/07/2014 07:00 06/11/2014 07:10 1,681,876 133.13 53,428
Storm 06/14/2014 13:50 06/15/2014 07:40 1,802,921 70.75 26,522
Storm 06/16/2014 17:45 06/16/2014 22:30 277,828 13.13 5,038
Storm 06/18/2014 02:50 06/18/2014 05:20 611,804 22.60 8,399
Storm 06/19/2014 03:15 06/19/2014 13:30 4,409,743 155.29 57,286
Storm 06/22/2014 11:10 06/22/2014 12:40 59,507 4.87 1,959
Storm 06/28/2014 15:45 06/28/2014 19:50 2,139,728 79.98 29,773
Storm 07/02/2014 23:20 07/03/2014 01:35 33,376 4.61 2,470
Storm 07/07/2014 18:10 07/07/2014 20:30 666,603 18.66 9,153
Storm 07/11/2014 08:20 07/11/2014 12:00 616,177 17.30 8,487
Storm 07/12/2014 13:40 07/12/2014 18:15 84,295 4.18 2,153
x Storm 07/25/2014 05:30 07/25/2014 13:00 228,684 9.91 3,191
x Storm 08/17/2014 23:45 08/18/2014 05:30 970,868 31.63 56,753
Storm 08/19/2014 18:15 08/19/2014 21:00 67,261 3.39 2,254
x Storm 08/21/2014 06:00 08/21/2014 12:00 288,124 7.34 4,145
Storm 08/24/2014 17:30 08/24/2014 21:00 26,662 2.55 1,745
Storm 08/29/2014 03:15 08/29/2014 06:45 122,657 4.82 3,154
x Storm 08/29/2014 17:00 08/31/2014 01:45 1,440,120 29.25 11,641
x Storm 08/31/2014 22:00 09/01/2014 08:30 552,180 5.12 1,213
Storm 09/03/2014 09:45 09/03/2014 13:45 91,444 4.11 1,527

Phalen Creek
2014 CRWD Stormwater Monitoring Report 159
x Storm 09/09/2014 20:45 09/10/2014 14:30 716,921 21.71 25,142
Storm 09/20/2014 17:45 09/20/2014 23:45 153,764 5.49 2,005
Storm 09/29/2014 10:15 09/29/2014 12:30 55,805 2.24 827
x Storm 10/01/2014 08:15 10/01/2014 16:45 723,894 16.52 2,491
x Storm 10/02/2014 12:45 10/03/2014 00:00 873,204 13.09 3,406
Storm 10/03/2014 23:45 10/04/2014 04:45 142,463 3.93 1,279
Storm 12/21/2014 14:00 12/21/2014 17:45 47,376 0.18 6
Snowmelt Subtotal 1,926,609 129 46,798
Storm Subtotal 36,376,545 1,181 582,013
Total 38,303,153 1,310 628,811
Month
Base Loading Interval Monthly Base Volume (cf)
Interval TP (lb)
Interval TSS (lb) Start End
January 01/01/2014 00:00 01/31/2014 23:59 9,117,404 30.27 1,551
February 02/01/2014 00:00 02/28/2014 23:59 11,258,803 50.60 12,791
March 03/01/2014 00:00 03/31/2014 23:59 14,866,466 44.72 2,795
April 04/01/2014 00:00 04/30/2014 23:59 13,237,363 41.29 3,303
May 05/01/2014 00:00 05/31/2014 23:59 16,437,219 72.85 4,463
June 06/01/2014 00:00 06/30/2014 23:59 20,012,859 112.44 6,871
July 07/01/2014 00:00 07/31/2014 23:59 14,126,584 44.09 1,896
August 08/01/2014 00:00 08/31/2014 23:59 12,449,074 39.66 2,722
September 09/01/2014 00:00 09/30/2014 23:59 12,294,395 38.35 1,534
October 10/01/2014 00:00 10/31/2014 23:59 10,156,446 36.22 1,294
November 11/01/2014 00:00 11/30/2014 23:59 8,898,297 30.51 1,664
December 12/01/2014 00:00 12/31/2014 23:59 8,835,679 32.60 1,105
Base Subtotal 151,690,589 574 41,990
TOTAL ANNUAL 189,993,743 1,883 670,800

Phalen Creek
2014 CRWD Stormwater Monitoring Report 160

Phalen Creek
2014 CRWD Stormwater Monitoring Report 161
Table 10-3: 2014 Phalen Creek subwatershed laboratory data.
Sample Sampling Start Sampling End Ortho-P Cl Cd Cr Cu Pb Ni Zn NH3 TKN Total P NO3 NO2 TDS TSS VSS Hardness CBOD SO4 E. coli Dissolved P
Type Date/Time Date/Time mg/L mg/L mg/L mg/L mg/L mg/L mg/L mg/L mg/L mg/L mg/L mg/L mg/L mg/L mg/L mg/L mg/L mg/L mg/L mpn/100 mL mg/L
Base Grab 01/22/2014 11:20 01/22/2014 11:20 0.037 254.6 0.00020 0.00100 0.00130 0.00070 0.00083 0.01460 0.020 0.3 0.09 1.74 0.03 789 5 1 452 1.0 64.1 1 0.023
Base Grab 02/12/2014 10:45 02/12/2014 10:45 0.048 2,969.5 0.00067 0.00430 0.01600 0.00410 0.00320 0.09220 0.460 1.2 0.11 1.96 0.06 5,620 30 12 456 - - 3 0.059
Base Grab 03/17/2014 09:30 03/17/2014 09:30 0.033 157.8 0.00040 0.00068 0.00130 0.00025 0.00084 0.01490 0.030 0.6 0.05 1.80 0.03 682 1 1 472 - - 36 0.031
Base Grab 04/11/2014 09:20 04/11/2014 09:20 0.036 190.0 0.00020 0.00073 0.00130 0.00120 0.00088 0.01510 0.020 0.6 0.06 1.61 0.03 682 8 3 452 - - 461 0.044
Base Grab 05/29/2014 11:20 05/29/2014 11:20 - - - - - - - - - - - - - - - - - - - 26 -
Base Composite 05/29/2014 14:02 05/30/2014 06:16 0.030 143.2 0.00020 0.00039 0.00120 0.00030 0.00061 0.00670 0.020 0.4 0.07 2.11 0.03 658 3 2 304 - - - 0.032
Base Grab 07/21/2014 11:15 07/21/2014 11:15 0.042 167.8 0.00020 0.00054 0.00066 0.00010 0.00067 0.00880 0.050 0.3 0.06 2.45 0.03 713 1 1 392 - - 32 0.039
Base Grab 08/14/2014 09:45 08/14/2014 09:45 0.043 162.2 0.00020 0.00080 0.00130 0.00410 0.00096 0.01500 0.020 0.4 0.05 1.87 0.03 694 5 3 456 1.0 68.0 - 0.036
Base Grab 09/08/2014 11:05 09/08/2014 11:05 - - - - - - - - - - - - - - - - - - - 28 -
Base Composite 09/08/2014 11:17 09/09/2014 09:46 0.047 154.6 0.00020 0.00059 0.00120 0.00082 0.00100 0.01870 0.020 0.3 0.07 1.54 0.03 686 1 1 460 - - - 0.042
Base Grab 10/09/2014 11:40 10/09/2014 11:40 - - - - - - - - - - - - - - - - - - - 15 -
Base Composite 10/09/2014 12:02 10/10/2014 09:46 0.033 154.5 0.00020 0.00061 0.00140 0.00097 0.00076 0.01170 0.020 0.6 0.06 1.73 0.03 637 2 2 464 - - - 0.045
Base Grab 11/20/2014 11:35 11/20/2014 11:35 0.035 162.7 0.00020 0.00067 0.00065 0.00120 0.00077 0.00950 0.020 0.3 0.04 1.50 0.03 652 4 2 468 1.0 65.8 3 0.040
Base Grab 12/18/2014 10:50 12/18/2014 10:50 0.040 163.9 0.00020 0.00071 0.00065 0.00023 0.00084 0.00810 0.020 0.3 0.04 1.41 0.03 639 1 1 452 - - 10 0.054
Base Average 0.039 425.5 0.00026 0.00100 0.00245 0.00127 0.00103 0.01957 0.064 0.5 0.06 1.79 0.03 1,132 6 3 439 1.0 66.0 62 0.040
Snow melt Grab 02/18/2014 13:40 02/18/2014 13:40 0.064 3,267.8 0.00045 0.01820 0.04430 0.01680 0.00920 0.23600 0.740 3.5 0.36 1.68 0.14 5,750 168 63 400 - - 504 0.083
Snow melt Grab 02/19/2014 13:42 02/19/2014 13:42 0.085 2,946.9 0.00058 0.03250 0.07200 0.04560 0.01800 0.48800 1.090 5.5 0.88 0.88 0.17 4,890 364 140 276 - - - 0.119
Snow melt Grab 03/10/2014 13:14 03/10/2014 13:14 0.226 1,153.2 0.00030 0.01830 0.04160 0.02530 0.00970 0.28700 1.090 6.6 0.62 0.49 0.15 2,020 328 140 140 - - 2,420 0.252
Snow melt Grab 03/13/2014 13:50 03/13/2014 13:50 0.302 609.6 0.00040 0.01150 0.03450 0.02630 0.00790 0.17800 0.730 3.4 0.67 0.38 0.10 1,070 197 73 160 - - 959 0.329
Snow melt Grab 03/20/2014 14:45 03/20/2014 14:45 - 276.6 0.00020 0.00970 0.02770 0.02570 0.00700 0.13100 0.460 3.8 0.56 0.48 0.08 552 234 68 252 - - - 0.255
Storm Grab 03/27/2014 14:10 03/27/2014 14:10 0.298 55.3 0.00062 0.02730 0.07120 0.00023 0.01980 0.00930 0.820 6.6 1.52 0.51 0.07 228 604 192 60 - - 3,260 0.343
Storm Composite 04/24/2014 07:46 04/24/2014 14:01 0.057 18.6 0.00020 0.00620 0.01280 0.01390 0.00290 0.07680 0.390 1.4 0.20 0.48 0.03 104 85 35 56 - - - 0.055
Storm Grab 04/24/2014 10:45 04/24/2014 10:45 - - - - - - - - - - - - - - - - - - - 1,000 -
Storm Composite 04/28/2014 10:17 04/28/2014 13:47 0.040 8.1 0.00020 0.00470 0.00980 0.01750 0.00260 0.05640 0.130 1.0 0.19 0.18 0.03 67 113 37 52 - - - 0.056
Storm Grab 05/19/2014 12:20 05/19/2014 12:20 - - - - - - - - - - - - - - - - - - - 1,986 -
Storm Composite 05/19/2014 12:46 05/19/2014 13:36 0.059 4.1 0.00039 0.01280 0.03200 0.07970 0.00970 0.17600 0.120 3.2 0.73 0.05 0.03 66 428 108 52 - - - 0.089
Storm Composite 05/31/2014 22:01 06/01/2014 06:15 0.025 7.6 0.00020 0.00660 0.01650 0.04730 0.00550 0.08800 0.030 1.3 0.31 0.21 0.03 65 214 50 - - - 0.039
Storm Grab 06/19/2014 09:25 06/19/2014 09:25 - - - - - - - - - - - - - - - - - - - 9,700 -
Storm Grab 07/11/2014 09:45 07/11/2014 09:45 - - - - - - - - - - - - - - - - - - - 6,300 -
Storm Grab 07/25/2014 08:55 07/25/2014 08:55 - - - - - - - - - - - - - - - - - - - 2,420 -
Storm Composite 07/25/2014 06:17 07/25/2014 08:16 - 33.1 0.00020 0.00600 0.01880 0.02040 0.00490 0.09800 0.020 2.3 0.46 0.78 0.06 189 143 70 104 - - - 0.114
Storm Composite 08/18/2014 00:17 08/18/2014 04:01 0.122 12.3 0.00051 0.00740 0.02690 0.06710 0.00680 0.17500 0.090 2.1 0.47 0.37 0.03 74 814 243 60 - - - 0.124
Storm Grab 08/21/2014 09:15 08/21/2014 09:15 - - - - - - - - - - - - - - - - - - - 8,600 -
Storm Composite 08/21/2014 06:50 08/21/2014 09:01 0.029 23.0 0.00021 0.00690 0.02160 0.03570 0.00490 0.10400 0.020 1.4 0.30 0.57 0.03 127 162 47 92 - - - 0.023
Storm Composite 08/30/2014 01:47 08/30/2014 04:01 - 5.3 0.00020 0.00490 0.01280 0.02840 0.00380 0.06340 0.030 0.9 0.25 0.15 0.03 59 95 23 48 - - - 0.082
Storm Composite 08/31/2014 22:47 09/01/2014 02:01 - 14.0 0.00020 0.00220 0.00740 0.00700 0.00190 0.03340 0.020 0.7 0.12 0.06 0.03 92 26 12 60 - - - 0.049
Storm Composite 09/09/2014 21:47 09/10/2014 02:01 0.113 20.2 0.00023 0.00610 0.01690 0.03250 0.00450 0.07750 0.070 1.6 0.35 0.17 0.05 115 388 75 88 24 8.2 - 0.108
Storm Grab 10/01/2014 09:35 10/01/2014 09:35 - - - - - - - - - - - - - - - - - - - 21,800 -
Storm Composite 10/01/2014 08:47 10/01/2014 16:01 0.108 16.0 0.00020 0.00410 0.00990 0.00990 0.00220 0.05050 0.280 1.1 0.29 0.05 0.03 90 42 21 76 - - - 0.137
Storm Composite 10/02/2014 13:22 10/02/2014 20:46 0.060 15.7 0.00020 0.00410 0.00840 0.01120 0.00200 0.04420 0.050 0.9 0.20 0.42 0.03 97 49 18 84 - - - 0.072
Snow melt Average 0.169 1,650.8 0.00039 0.01804 0.04402 0.02794 0.01036 0.26400 0.822 4.6 0.62 0.78 0.13 2,856 258 97 246 - - 1,294 0.208
Storm Average 0.091 17.9 0.00027 0.00764 0.02038 0.02853 0.00550 0.08096 0.159 1.9 0.41 0.31 0.04 106 243 72 69 24.0 8.2 6,883 0.099
Annual Average 0.080 454.1 0.00029 0.00691 0.01766 0.01809 0.00464 0.08923 0.237 1.8 0.32 0.95 0.05 969 156 50 246 6.8 51.5 2,836 0.096
Annual Maximum 0.302 3,267.8 0.00067 0.03250 0.07200 0.07970 0.01980 0.48800 1.090 6.6 1.52 2.45 0.17 5,750 814 243 472 24.0 68.0 21,800 0.343
Annual Minimum 0.025 4.1 0.00020 0.00039 0.00065 0.00010 0.00061 0.00670 0.020 0.3 0.04 0.05 0.03 59 1 1 48 1.0 8.2 1 0.023
Annual Median 0.047 154.5 0.00020 0.00470 0.01280 0.01120 0.00290 0.05640 0.050 1.1 0.20 0.57 0.03 637 85 23 206 1.0 65.0 504 0.056
Actual number less than value (<)
Actual number greater than value (>)
Estimated concentration above the adjusted method detection limit and below the adjusted reporting limit.
- Not collected

Phalen Creek
2014 CRWD Stormwater Monitoring Report 162

St. Anthony Park
2014 CRWD Stormwater Monitoring Report 163
11 ST. ANTHONY PARK SUBWATERSHED RESULTS
11.1 DESCRIPTION
The St. Anthony Park subwatershed has a drainage area of 3,418 acres and is the western-most subwatershed monitored by CRWD. CRWD monitors the storm sewer outlet of the St. Anthony Park subwatershed where it directly flows into the Mississippi River at Desnoyer Park in St. Paul (Figure 11-2). The subwatershed is primarily comprised of industrial and residential land uses with 48% impervious surface land coverage.
CRWD also monitors a 929 acre upland subwatershed of St. Anthony Park called Sarita. The Sarita subwatershed is monitored in a storm sewer at the outlet of the Sarita Wetland near Como Avenue (Figure 11-2). The Sarita subwatershed has substantially different land use than any other CRWD subwatershed because it encompasses the Minnesota State Fair Grounds and the University of Minnesota St. Paul Campus where open space dominates. The predominant land use within the Sarita subwatershed is institutional with 16% impervious surface coverage.
Figure 11-1: The St. Anthony Park monitoring site location (left, top right); and Sarita Outlet monitoring site location (bottom right).
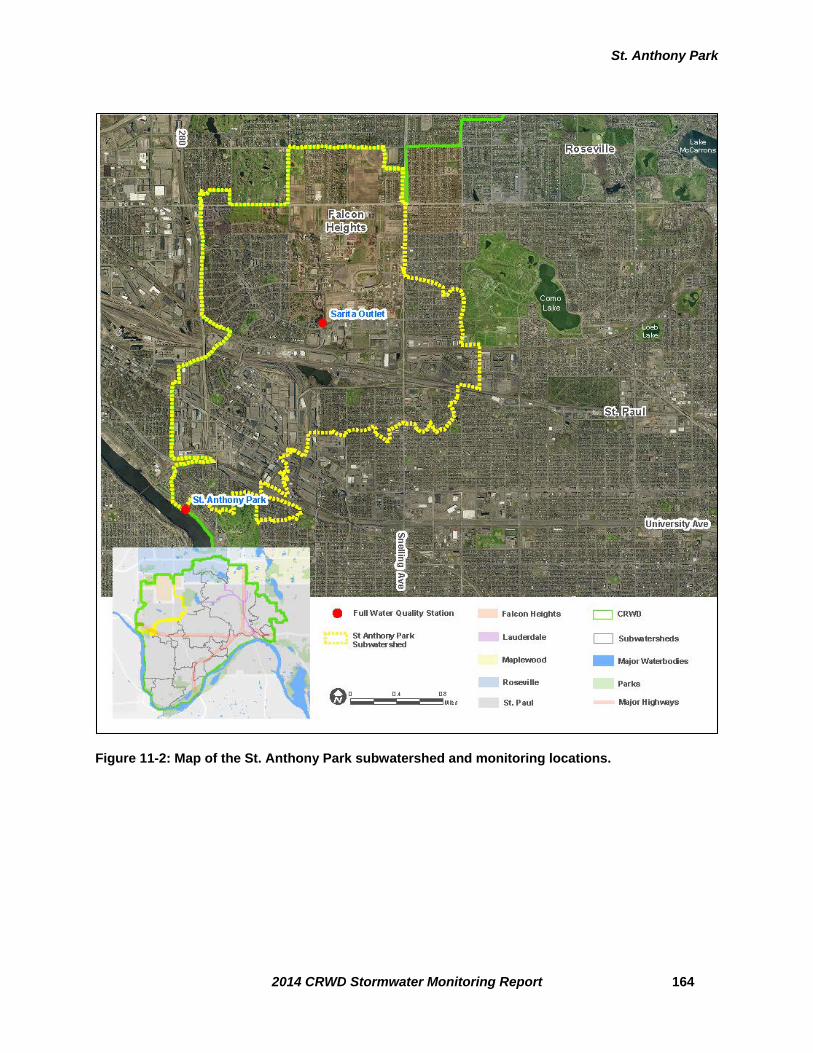
St. Anthony Park
2014 CRWD Stormwater Monitoring Report 164
Figure 11-2: Map of the St. Anthony Park subwatershed and monitoring locations.

St. Anthony Park
2014 CRWD Stormwater Monitoring Report 165
11.2 2014 MONITORING SUMMARY – ST. ANTHONY PARK
The St. Anthony Park site has been monitored for flow and water quality since 2005, with year-round monitoring beginning in 2009. Beginning in 2009, flow monitoring equipment was installed for the full calendar year and a minimum of one full water quality sample has been collected and analyzed each month. Due to these differences in monitoring period, the 2009-2014 load and discharge data may show a significant difference when compared to pre-2009 data. Stormflow data should not be affected by differences in monitoring period as all storm samples since 2005 were collected during the spring, summer, or fall.
The St. Anthony Park monitoring site is located directly at the outfall to the Mississippi River. Its close proximity to the river can make monitoring difficult because of the influence of the river which often backs up into the storm sewer. The storm sewer has a steep gradient resulting in very high velocity flows during storm events. These high velocities increase the risk of monitoring equipment becoming dislodged or damaged. Because of equipment issues and the site characteristics listed above, significant portions of data have been lost each year.
11.2.1 DISCHARGE – ST. ANTHONY PARK
Level, velocity, and discharge were monitored at St. Anthony Park for baseflow, stormflow, and snowmelt events in 2014.
• Total baseflow discharge: 187,656,629 cubic feet (Figure 11-3; Table 11-1) • Total stormflow discharge: 32,743,728 cubic feet (Figure 11-3; Table 11-1) • Total snowmelt discharge: 3,782,717 cubic feet (Figure 11-3; Table 11-1) • Total annual discharge: 224,183,075 cubic feet (Figure 11-4; Table 11-1)
11.2.2 TOTAL SUSPENDED SOLIDS (TSS) – ST. ANTHONY PARK
Baseflow, stormflow, and snowmelt samples were analyzed for TSS concentrations in mg/L in order to calculate event-based and total annual loads.
• Baseflow flow weighted average concentration: 15 mg/L (Table 11-1) • Stormflow flow weighted average concentration: 223 mg/L (Table 11-1) • Snowmelt flow weighted average concentration: 604 mg/L (Table 11-1) • Total baseflow TSS load: 152,301 lbs (Figure 11-7; Table 11-1) • Total stormflow TSS load: 501,623 lbs (Figure 11-7; Table 11-1) • Total snowmelt TSS load: 141,346 lbs (Figure 11-7; Table 11-1) • Total annual TSS load: 795,270 lbs (Figure 11-7; Table 11-1)
11.2.3 TOTAL PHOSPHORUS (TP) – ST. ANTHONY PARK
Baseflow, stormflow, and snowmelt samples were analyzed for TP concentrations in mg/L in order to calculate event-based and total annual loads.
• Baseflow flow weighted average concentration: 0.07 mg/L (Table 11-1) • Stormflow flow weighted average concentration: 0.32 mg/L (Table 11-1)

St. Anthony Park
2014 CRWD Stormwater Monitoring Report 166
• Snowmelt flow weighted average concentration: 0.31 mg/L (Table 11-1) • Total baseflow TP load: 693 lbs (Figure 11-9; Table 11-1) • Total stormflow TP load: 713 lbs (Figure 11-9; Table 11-1) • Total snowmelt TP load: lbs (Figure 11-9; Table 11-1) • Total annual TP load: 1,479 lbs (Figure 11-9; Table 11-1)

Discharge St. Anthony Park
2014 CRWD Stormwater Monitoring Report 167
Figure 11-3: Historical monitored discharge volumes at St. Anthony Park subwatershed for snowmelt, stormflow and baseflow from 2005-2014.
0
50,000,000
100,000,000
150,000,000
200,000,000
250,000,000
2005 2006 2007 2008 2009 2010 2011 2012 2013 2014
Dis
char
ge (c
f)
Year
Snowmelt
Storm
Base
Seasonally Monitored (~Apr-Nov)
Continuously Monitored (Jan-Dec)

Discharge St. Anthony Park
2014 CRWD Stormwater Monitoring Report 168
Figure 11-4: St. Anthony Park cumulative discharge and daily precipitation.

Discharge St. Anthony Park
2014 CRWD Stormwater Monitoring Report 169
Figure 11-5: St. Anthony Park level, velocity, and discharge.

Discharge St. Anthony Park
2014 CRWD Stormwater Monitoring Report 170
Figure 11-6: St. Anthony Park level, discharge, and precipitation.

Total Suspended Solids St. Anthony Park
2014 CRWD Stormwater Monitoring Report 171
Figure 11-7: Historical total monitored TSS loads at St. Anthony Park subwatershed for snowmelt, stormflow and baseflow from 2005-2014.
0
100,000
200,000
300,000
400,000
500,000
600,000
700,000
800,000
900,000
1,000,000
2005 2006 2007 2008 2009 2010 2011 2012 2013 2014
TSS
Load
(lbs
)
Year
Snowmelt
Storm
Base

Total Suspended Solids St. Anthony Park
2014 CRWD Stormwater Monitoring Report 172
Figure 11-8: Monthly average storm sample TSS concentrations in 2014 for St. Anthony Park subwatershed and historical averages (2005-2013).
n=4
n=8
n=17
n=23
n=22
n=30
n=19
n=16 n=
1
n=1
n=1
n=3
n=2
n=4
n=1 n=
1
0
50
100
150
200
250
300
350
400
450
500
Jan Feb Mar Apr May Jun Jul Aug Sep Oct Nov Dec
TSS
Con
cent
ratio
n (m
g/L)
Month
Historical Average (2005-2013)
2014

Total Phosphorus St. Anthony Park
2014 CRWD Stormwater Monitoring Report 173
Figure 11-9: Historical total monitored TP loads at St. Anthony Park subwatershed for snowmelt, stormflow and baseflow from 2005-2014.
0
500
1,000
1,500
2,000
2,500
2005 2006 2007 2008 2009 2010 2011 2012 2013 2014
TP L
oad
(lbs)
Year
Snowmelt
Storm
Base

Total Phosphorus St. Anthony Park
2014 CRWD Stormwater Monitoring Report 174
Figure 11-10: Monthly average storm sample TP concentrations in 2014 for St. Anthony Park subwatershed and historical averages (2005-2013).
n=4
n=8
n=17
n=23
n=22
n=30
n=19
n=16
n=1
n=1
n=1
n=3
n=2
n=4
n=1
n=1
0.00
0.10
0.20
0.30
0.40
0.50
0.60
Jan Feb Mar Apr May Jun Jul Aug Sep Oct Nov Dec
TP C
once
ntra
tion
(mg/
L)
Month
Historical Average (2005-2013)
2014

St. Anthony Park
2014 CRWD Stormwater Monitoring Report 175
Table 11-1: St. Anthony Park subwatershed monitoring results, 2005-2014.
2005 2006 2007 2008 2009 2010 2011 2012 2013 2014Subwatershed Area (ac) 3,418 3,418 3,418 3,418 3,418 3,418 3,418 3,418 3,418 3,418Total Rainfall (inches) 28.27 24.13 23.99 9.95 18.72 26.84 29.24 29.71 34.00 33.60Number of Monitoring Days 191 192 215 126 218 188 269 334 351 345Number of Storm Sampling Events 44 21 19 12 25 17 7 5 8 11Number of Storm Intervals 9 23 33 24 38 44 17 30 30 60Number of Snowmelt Sampling Events NA NA NA NA NA NA 0 2 2 3Number of Snowmelt Intervals NA NA NA NA NA NA 0 3 24 8Total Discharge (cf) 191,591,247 145,671,734 209,782,937 57,793,346 99,163,464 117,851,525 115,056,718 103,140,522 139,036,000 224,183,075Storm Flow Subtotal (cf) 65,769,117 49,091,775 60,484,181 19,865,767 41,313,601 57,480,844 26,284,149 37,566,038 30,798,646 32,743,728Snowmelt Flow Subtotal (cf) NA NA NA NA NA NA 0 3,099,892 18,726,594 3,782,717Baseflow Subtotal (cf) 119,056,352 96,579,959 149,298,756 37,927,579 57,849,863 60,370,681 88,572,569 62,373,370 89,510,760 187,656,629Average TSS Concentration (mg/L) 124 108 145 129 138 149 89 75 102 125Total FWA TSS (mg/L) 66 62 72 92 95 123 73 63 93 64Storm FWA TSS (mg/L) 146 152 205 247 176 238 214 71 284 223Snowmelt FWA TSS (mg/L) NA NA NA NA NA NA 0 181 117 604Baseflow FWA TSS (mg/L) 21 16 18 10 38 13 31 53 22 15Total TSS Load (lbs) 787,976 564,202 941,282 330,829 589,228 904,150 524,922 408,192 804,368 795,270Storm TSS Load (lbs) 599,259 465,259 774,686 306,571 453,744 853,968 353,893 165,371 546,783 501,623Snowmelt TSS Load (lbs) NA NA NA NA NA NA 0 34,992 136,847 141,346Baseflow TSS Load (lbs) 153,661 98,943 166,595 24,258 135,484 50,182 171,030 206,376 120,738 152,301Total TSS Yield (lb/ac) 231 165 275 97 172 250 154 136 235 233Average TP Concentration (mg/L) 0.22 0.22 0.21 0.21 0.23 0.22 0.19 0.13 0.14 0.15Total FWA TP (mg/L) 0.17 0.14 0.13 0.16 0.17 0.18 0.13 0.13 0.15 0.12Storm FWA TP (mg/L) 0.23 0.27 0.27 0.33 0.29 0.30 0.26 0.19 0.30 0.32Snowmelt FWA TP (mg/L) NA NA NA NA NA NA 0.00 0.15 0.26 0.31Baseflow FWA TP (mg/L) 0.14 0.08 0.07 0.07 0.09 0.06 0.09 0.10 0.08 0.07Total TP Load (lbs) 1999 1,307 1,668 561 1,070 1,313 944 867 1,316 1,479Storm TP Load (lbs) 942 820 1,031 406 738 1,091 431 440 571 713Snowmelt TP Load (lbs) NA NA NA NA NA NA 0 30 302 73Baseflow TP Load (lbs) 1022 487 636 155 332 222 513 396 443 693Total TP Yield (lb/ac) 0.58 0.38 0.49 0.16 0.31 0.38 0.28 0.25 0.39 0.43NA: Not available. Snow melt events w ere not monitored or sampled until 2011.

St. Anthony Park
2014 CRWD Stormwater Monitoring Report 176
Table 11-2: 2014 St. Anthony Park subwatershed loading table.
Sampled Event Sample Event Loading Interval Event Volume (cf)
Interval TP (lb)
Interval TSS (lb) Start End
Snowmelt 03/08/2014 15:30 03/08/2014 20:00 55,498 1.87 1,523 Snowmelt 03/09/2014 15:30 03/09/2014 21:15 134,009 4.10 3,303 x Snowmelt 03/10/2014 12:00 03/12/2014 06:30 2,048,910 39.49 100,151 x Snowmelt 03/13/2014 14:15 03/14/2014 08:25 788,760 1.92 3,978 Snowmelt 03/14/2014 13:10 03/14/2014 20:00 216,984 9.38 7,862 Snowmelt 03/17/2014 14:15 03/17/2014 16:40 20,787 1.39 1,206 x Snowmelt 03/20/2014 13:30 03/20/2014 23:45 409,539 11.08 20,106 Snowmelt 03/21/2014 13:10 03/21/2014 18:20 74,806 3.78 3,217 x Storm 03/27/2014 12:45 03/28/2014 00:00 1,021,378 41.87 13,402 Storm 03/29/2014 14:00 03/29/2014 19:45 89,058 3.50 2,909 Storm 03/30/2014 13:30 04/01/2014 07:15 1,139,220 28.13 21,901 Storm 04/04/2014 13:20 04/04/2014 20:45 214,795 5.48 3,586 Storm 04/05/2014 15:15 04/06/2014 04:00 511,268 11.13 6,992 Storm 04/06/2014 12:15 04/06/2014 17:00 43,830 3.78 2,883 Storm 04/12/2014 07:45 04/12/2014 09:45 30,977 1.64 1,207 Storm 04/16/2014 03:30 04/16/2014 05:45 51,920 2.20 1,571 Storm 04/16/2014 20:30 04/17/2014 00:45 244,614 7.97 5,488 Storm 04/19/2014 03:00 04/19/2014 05:45 54,352 2.78 2,033 Storm 04/19/2014 23:30 04/20/2014 06:30 303,780 9.65 6,611 Storm 04/21/2014 23:00 04/22/2014 02:30 86,557 3.05 2,123 x Storm 04/24/2014 08:30 04/24/2014 18:00 1,144,553 15.71 11,386 Storm 04/26/2014 21:00 04/27/2014 02:30 126,381 3.73 2,518 x Storm 04/27/2014 05:45 04/27/2014 12:15 519,580 4.68 1,554 Storm 04/27/2014 15:15 04/27/2014 18:30 43,311 3.40 2,581 Storm 04/27/2014 20:15 04/27/2014 21:00 2,909 1.24 993 Storm 04/28/2014 11:15 04/28/2014 23:15 1,518,476 35.72 22,923 Storm 04/29/2014 03:00 04/30/2014 07:30 1,270,324 44.64 31,105 Storm 05/01/2014 03:30 05/01/2014 06:45 42,923 3.16 1,591 Storm 05/02/2014 20:15 05/02/2014 22:00 66,305 1.71 831 Storm 05/04/2014 11:00 05/04/2014 14:00 158,506 3.56 1,717 Storm 05/09/2014 10:45 05/09/2014 14:15 41,992 2.80 1,408 Storm 05/09/2014 21:30 05/10/2014 04:15 219,360 6.02 2,937 Storm 05/10/2014 14:00 05/10/2014 16:15 40,381 1.81 901 x Storm 05/11/2014 23:45 05/12/2014 05:45 316,375 4.45 2,152 Storm 05/12/2014 13:30 05/12/2014 16:00 74,810 2.30 1,127 Storm 05/12/2014 23:00 05/13/2014 01:15 50,160 3.01 1,509 Storm 05/13/2014 16:15 05/13/2014 19:00 48,635 3.56 1,795 x Storm 05/19/2014 13:00 05/19/2014 21:30 1,923,886 24.17 12,867 Storm 05/20/2014 04:15 05/20/2014 06:45 25,055 2.54 1,285 Storm 05/20/2014 16:00 05/20/2014 20:15 117,234 5.37 2,674 Storm 05/27/2014 06:00 05/27/2014 08:00 57,731 1.77 868 Storm 05/31/2014 21:15 06/01/2014 14:00 1,363,483 22.36 10,525 Storm 06/03/2014 05:30 06/03/2014 06:00 14,378 0.53 386 Storm 06/03/2014 18:00 06/03/2014 19:45 38,000 1.67 1,238 x Storm 06/07/2014 08:15 06/11/2014 08:45 2,498,217 93.07 96,388 x Storm 06/14/2014 20:45 06/15/2014 13:45 2,957,436 21.89 12,603 Storm 06/15/2014 18:15 06/16/2014 00:15 220,481 6.01 4,246 Storm 06/16/2014 17:30 06/16/2014 22:45 405,528 9.88 6,863 Storm 06/17/2014 07:00 06/17/2014 08:45 38,885 1.47 1,079 Storm 06/17/2014 17:00 06/17/2014 21:00 112,707 3.69 2,666

St. Anthony Park
2014 CRWD Stormwater Monitoring Report 177
Storm 06/18/2014 02:45 06/18/2014 06:30 497,379 9.18 6,060 x Storm 06/19/2014 04:30 06/20/2014 04:00 9,176,270 104.47 85,585 Storm 06/20/2014 20:15 06/20/2014 22:30 39,332 3.05 2,346 Storm 06/21/2014 06:00 06/21/2014 07:45 42,565 2.62 1,991 Storm 06/21/2014 15:45 06/21/2014 21:45 353,554 10.62 7,599 Storm 06/22/2014 11:30 06/22/2014 12:30 6,663 1.21 956 Storm 06/26/2014 13:45 06/26/2014 18:30 183,476 7.10 5,216 x Storm 06/28/2014 16:30 06/28/2014 22:45 941,346 29.46 31,331 Storm 07/07/2014 18:45 07/08/2014 06:30 391,967 9.44 4,400 x Storm 07/11/2014 08:15 07/11/2014 21:45 2,800,342 29.65 20,271 Storm 07/12/2014 14:30 07/13/2014 03:45 644,442 14.75 6,830 Storm 07/14/2014 18:45 07/14/2014 23:15 106,823 3.40 1,640 Storm 07/25/2014 06:45 07/27/2014 15:45 612,249 18.35 8,783 Storm 08/29/2014 22:15 08/29/2014 22:30 3,476 0.17 121 Storm 08/30/2014 03:30 08/30/2014 14:00 185,553 5.16 3,617 x Storm 08/31/2014 23:30 09/01/2014 15:15 798,505 6.60 877 Storm 09/03/2014 11:45 09/03/2014 14:45 50,775 1.11 557 Storm 12/22/2014 14:00 12/22/2014 14:25 1,193 0.05 23
Snowmelt Subtotal 3,749,293 73 141,346 Storm Subtotal 36,085,663 713 501,623 Total 39,834,956 786 642,969
Month Base Loading Interval Monthly Base Volume (cf)
Interval TP (lb)
Interval TSS (lb) Start End
January 01/01/2014 00:00 01/31/2014 23:59 6,356,507 25.00 3,175 February 02/01/2014 00:00 02/28/2014 23:59 5,077,642 14.60 3,807 March 03/01/2014 00:00 03/31/2014 23:59 11,102,045 56.62 12,506 April 04/01/2014 00:00 04/30/2014 23:59 25,320,027 142.69 15,855 May 05/01/2014 00:00 05/31/2014 23:59 36,560,849 120.94 33,087 June 06/01/2014 00:00 06/30/2014 23:59 25,919,400 129.44 35,597 July 07/01/2014 00:00 07/31/2014 23:59 17,966,026 77.67 13,970 August 08/01/2014 00:00 08/31/2014 23:59 7,552,219 27.17 9,704 September 09/01/2014 00:00 09/30/2014 23:59 8,161,857 35.33 9,249 October 10/01/2014 00:00 10/31/2014 23:59 6,815,136 28.05 6,575 November 11/01/2014 00:00 11/30/2014 23:59 4,632,461 15.74 5,668 December 12/01/2014 00:00 12/31/2014 23:59 5,045,498 19.82 3,109 Base Subtotal 160,509,667 693 152,301
TOTAL ANNUAL 200,344,623 1,479 795,270

St. Anthony Park
2014 CRWD Stormwater Monitoring Report 178

St. Anthony Park
2014 CRWD Stormwater Monitoring Report 179
Table 11-3: 2014 St. Anthony Park subwatershed laboratory data.
Sample Sampling Start Sampling End Ortho-P Cl Cd Cr Cu Pb Ni Zn NH3 TKN Total P NO3 NO2 TDS TSS VSS Hardness CBOD SO4 E. coli Dissolved PType Date/Time Date/Time mg/L mg/L mg/L mg/L mg/L mg/L mg/L mg/L mg/L mg/L mg/L mg/L mg/L mg/L mg/L mg/L mg/L mg/L mg/L mpn/100 mL mg/LIllicit Discharge 12/18/2014 08:30 12/18/2014 08:30 0.025 245.9 0.00140 0.07580 0.10000 0.06620 0.09020 0.23900 0.320 2.2 1.83 0.84 0.03 840 1,680 245 456 - - 4,100 0.053
ID Average 0.025 245.9 0.00140 0.07580 0.10000 0.06620 0.09020 0.23900 0.320 2.2 1.83 0.84 0.03 840 1,680 245 456 - - 4,100 0.053
Base Grab 01/22/2014 08:40 01/22/2014 08:40 0.005 192.7 0.00020 0.00140 0.00230 0.00065 0.03800 0.03760 0.190 1.8 0.06 0.92 0.03 734 26 6 416 1.0 132.0 65 0.020Base Grab 02/12/2014 08:30 02/12/2014 08:30 0.005 147.1 0.00020 0.00091 0.00100 0.00050 0.02890 0.01160 0.230 0.8 0.02 0.97 0.03 668 16 4 428 - - 20 0.020Base Grab 03/17/2014 08:30 03/17/2014 08:30 0.005 86.0 0.00040 0.00350 0.00460 0.00120 0.00750 0.02070 0.090 0.8 0.04 0.80 0.03 404 22 4 252 - - 54 0.020Base Grab 04/11/2014 08:15 04/11/2014 08:15 0.019 63.5 0.00020 0.00056 0.00140 0.00047 0.00530 0.00860 0.190 1.4 0.11 1.29 0.03 301 17 5 188 - - 16 0.034Base Grab 05/29/2014 08:15 05/29/2014 08:15 - - - - - - - - - - - - - - - - - - - 34 -Base Composite 05/29/2014 08:33 05/30/2014 03:47 0.005 323.6 0.00020 0.00066 0.00270 0.00064 0.01320 0.01570 0.210 0.9 0.05 1.59 0.04 933 12 5 220 - - - 0.020Base Grab 07/21/2014 08:25 07/21/2014 08:25 0.042 40.2 0.00020 0.00045 0.00140 0.00028 0.00310 0.00310 0.050 0.9 0.08 0.61 0.03 301 13 3 208 - - 30 0.047Base Grab 08/13/2014 08:30 08/13/2014 08:30 - - - - - - - - - - - - - - - - - - - 122 -Base Composite 08/13/2014 08:47 08/14/2014 08:01 0.005 288.4 - - - - - - 0.160 0.8 0.05 1.42 0.04 924 47 11 464 1.8 125.0 - 0.020Base Grab 09/08/2014 08:15 09/08/2014 08:15 - - - - - - - - - - - - - - - - - - - 88 -Base Grab 09/09/2014 08:25 09/09/2014 08:25 0.023 62.0 0.00020 0.00087 0.00170 0.00047 0.00620 0.00580 0.060 1.1 0.08 0.56 0.03 326 16 5 218 - - - 0.020Base Grab 09/29/2014 08:10 09/29/2014 08:10 - - - - - - - - - - - - - - - - - - - 47 -Base Grab 10/09/2014 08:50 10/09/2014 08:50 - - - - - - - - - - - - - - - - - - - 24 -Base Composite 10/09/2014 09:01 10/10/2014 08:30 0.005 205.3 0.00020 0.00580 0.00930 0.00510 0.01800 0.02630 0.150 1.4 0.11 1.06 0.04 699 42 13 436 - - - 0.043Base Grab 11/20/2014 08:30 11/20/2014 08:30 0.009 161.9 0.00020 0.00360 0.00440 0.00058 0.01240 0.01160 0.110 0.8 0.05 0.81 0.03 600 24 6 384 1.0 66.3 707 0.020
Base Average 0.012 157.1 0.00022 0.00197 0.00320 0.00110 0.01473 0.01567 0.144 1.1 0.07 1.00 0.03 589 24 6 321 1.3 107.8 110 0.026
Snow melt Grab 02/18/2014 13:10 02/18/2014 13:10 0.005 2,554.2 0.00020 0.00320 0.00610 0.00220 0.03270 0.06150 0.720 1.8 0.03 1.04 0.08 4,520 39 8 508 - - 29 0.020Snow melt Grab 02/19/2014 13:13 02/19/2014 13:13 0.005 1,701.1 0.00055 0.01730 0.02730 0.02260 0.04640 0.13300 0.580 1.8 0.20 0.93 0.08 3,250 360 57 488 - - - 0.020Snow melt Grab 03/10/2014 12:11 03/10/2014 12:11 0.005 1,501.4 0.00042 0.03870 0.03680 0.01560 0.01620 0.14800 0.880 3.2 0.26 0.80 0.13 2,680 620 108 232 - - 35 0.020Snow melt Grab 03/13/2014 12:50 03/13/2014 12:50 0.005 410.4 0.00040 0.01820 0.00470 0.00075 0.00550 0.01430 0.360 1.5 0.05 0.99 0.04 932 64 4 240 - - 236 0.020Snow melt Grab 03/20/2014 13:41 03/20/2014 13:41 - 676.4 0.00026 0.03370 0.01950 0.01240 0.01390 0.08680 0.520 3.1 0.32 0.76 0.08 1,390 540 48 240 - - - 0.040Storm Grab 03/27/2014 13:15 03/27/2014 13:15 0.093 301.2 0.00031 0.01370 0.03250 0.01400 0.01510 0.13000 1.120 4.0 0.53 0.92 0.11 720 168 44 252 - - 1,720 0.135Storm Grab 04/24/2014 08:10 04/24/2014 08:10 0.029 47.7 0.00042 0.01100 0.02420 0.01710 0.00840 0.01350 0.540 2.0 0.21 0.72 0.06 177 146 48 68 - 14.0 921 0.046Storm Composite 04/24/2014 09:19 04/24/2014 12:04 0.016 31.5 0.00028 0.00730 0.01600 0.01350 0.00530 0.09190 0.450 1.3 0.19 0.39 0.04 124 125 42 60 - - - 0.020Storm Composite 04/27/2014 06:33 04/27/2014 08:16 0.023 25.0 0.00020 0.00240 0.00700 0.00530 0.00230 0.05530 0.470 1.2 0.13 0.39 0.03 110 38 14 32 - - - 0.031Storm Composite 05/12/2014 02:32 05/12/2014 03:01 - 19.0 0.00020 0.00250 0.00670 0.00700 0.00250 0.04090 0.060 0.8 0.14 0.13 0.04 - 63 21 38 - - - 0.066Storm Grab 05/19/2014 11:15 05/19/2014 11:15 - - - - - - - - - - - - - - - - - - - 1,357 -Storm Composite 05/19/2014 14:17 05/19/2014 15:25 0.039 12.9 0.00020 0.00430 0.00870 0.01060 0.00340 0.04540 0.190 1.1 0.17 0.22 0.03 69 88 27 26 - - - 0.045Storm Composite 06/07/2014 08:47 06/07/2014 09:52 - 11.8 0.00020 0.00380 0.01060 0.01250 0.00350 0.05340 0.320 1.6 0.23 0.30 0.03 62 195 90 22 - - - 0.054Storm Composite 06/14/2014 21:32 06/15/2014 02:46 0.077 12.6 0.00020 0.00270 0.00670 0.00640 0.00220 0.03920 0.090 0.8 0.11 0.24 0.03 69 58 23 28 - - - 0.020Storm Grab 06/19/2014 08:15 06/19/2014 08:15 - - - - - - - - - - - - - - - - - - - 4,100 -Storm Composite 06/19/2014 05:32 06/19/2014 06:36 0.027 12.6 0.00020 0.00330 0.00780 0.01050 0.00350 0.03800 0.060 0.9 0.17 0.16 0.03 74 134 33 30 - - - 0.034Storm Composite 06/28/2014 17:34 06/28/2014 19:01 0.120 10.2 0.00036 0.00810 0.02760 0.02150 0.00800 0.17400 0.190 1.6 0.38 0.23 0.05 76 386 145 48 - - - 0.145Storm Grab 07/11/2014 08:45 07/11/2014 08:45 - - - - - - - - - - - - - - - - - - - 7,500 -Storm Composite 07/11/2014 08:47 07/11/2014 09:52 0.027 5.4 0.00024 0.00450 0.01050 0.01170 0.00360 0.05340 0.080 0.8 0.16 0.14 0.03 42 106 27 38 - - 0.032Storm Grab 07/25/2014 08:00 07/25/2014 08:00 - - - - - - - - - - - - - - - - - - - 3,100 -Storm Grab 08/21/2014 08:10 08/21/2014 08:10 - - - - - - - - - - - - - - - - - - - 21,800 -Storm Composite 09/01/2014 00:16 09/01/2014 02:01 0.023 16.7 0.00020 0.00210 0.00690 0.00370 0.00210 0.02830 0.080 0.7 0.12 0.08 0.03 93 18 7 54 - - - 0.046Storm Grab 10/01/2014 08:35 10/01/2014 08:35 - - - - - - - - - - - - - - - - - - - 9,800 -
Snow melt Average 0.005 1,368.7 0.00037 0.02222 0.01888 0.01071 0.02294 0.08872 0.612 2.3 0.17 0.90 0.08 2,554 325 45 342 - - 100 0.024Storm Average 0.047 42.2 0.00025 0.00548 0.01377 0.01115 0.00499 0.06361 0.304 1.4 0.21 0.33 0.04 147 127 43 58 - 14.0 6,287 0.056
Annual Average 0.026 330.4 0.00026 0.00748 0.01109 0.00759 0.01182 0.05184 0.302 1.4 0.15 0.68 0.05 780 125 30 208 1.3 84.3 2,355 0.039Annual Maximum 0.120 2,554.2 0.00055 0.03870 0.03680 0.02260 0.04640 0.17400 1.120 4.0 0.53 1.59 0.13 4,520 620 145 508 1.8 132.0 21,800 0.145Annual Minimum 0.005 5.4 0.00020 0.00045 0.00100 0.00028 0.00210 0.00310 0.050 0.7 0.02 0.08 0.03 42 12 3 22 1.0 14.0 16 0.020Annual Median 0.018 63.5 0.00020 0.00355 0.00695 0.00585 0.00685 0.03860 0.190 1.2 0.12 0.76 0.03 365 58 14 218 1.0 95.7 105 0.031
Actual number less than value (<)Estimated concentration above the adjusted method detection limit and below the adjusted reporting limit.
- Not collected

St. Anthony Park
2014 CRWD Stormwater Monitoring Report 180
St. Anthony Park
2014 CRWD Stormwater Monitoring Report 181
11.3 2014 MONITORING SUMMARY - SARITA
Sarita has been monitored for flow and water quality since 2006. It is generally monitored from late March to mid-November. Sarita does not have baseflow, but may discharge for a prolonged period following large precipitation events. The number of monitoring days has not varied significantly year-to-year (Table 11-4).
11.3.1 DISCHARGE – SARITA
Level, velocity, and discharge were monitored at Sarita for stormflow in 2014.
• Total stormflow discharge: 10,374,751 cubic feet (Figure 11-11; Table 11-4) • Total annual discharge: 10,374,751 cubic feet (Figure 11-12; Table 11-4)
11.3.2 TOTAL SUSPENDED SOLIDS (TSS) – SARITA
Stormflow samples were analyzed for TSS concentrations in mg/L in order to calculate loads.
• Stormflow flow weighted average concentration: 70 mg/L (Table 11-4) • Total stormflow TSS load: 45,028 lbs (Figure 11-15; Table 11-4) • Total annual TSS load: 45,028 lbs (Figure 11-15; Table 11-4)
11.3.3 TOTAL PHOSPHORUS (TP) – SARITA
Stormflow samples were analyzed for TP concentrations in mg/L in order to calculate loads.
• Stormflow flow weighted average concentration: 0.23 mg/L (Table 11-4) • Total stormflow TP load: 146 lbs (Figure 11-17; Table 11-4) • Total annual TP load: 146 lbs (Figure 11-17; Table 11-4)

Discharge St. Anthony Park
2014 CRWD Stormwater Monitoring Report 182
Figure 11-11: Historical total monitored discharge volumes at Sarita subwatershed for stormflow from 2006-2014.
0
2,000,000
4,000,000
6,000,000
8,000,000
10,000,000
12,000,000
2006 2007 2008 2009 2010 2011 2012 2013 2014
Dis
char
ge (c
f)
Year
Storm

Discharge St. Anthony Park
2014 CRWD Stormwater Monitoring Report 183
Figure 11-12: Sarita Outlet cumulative discharge and daily precipitation.
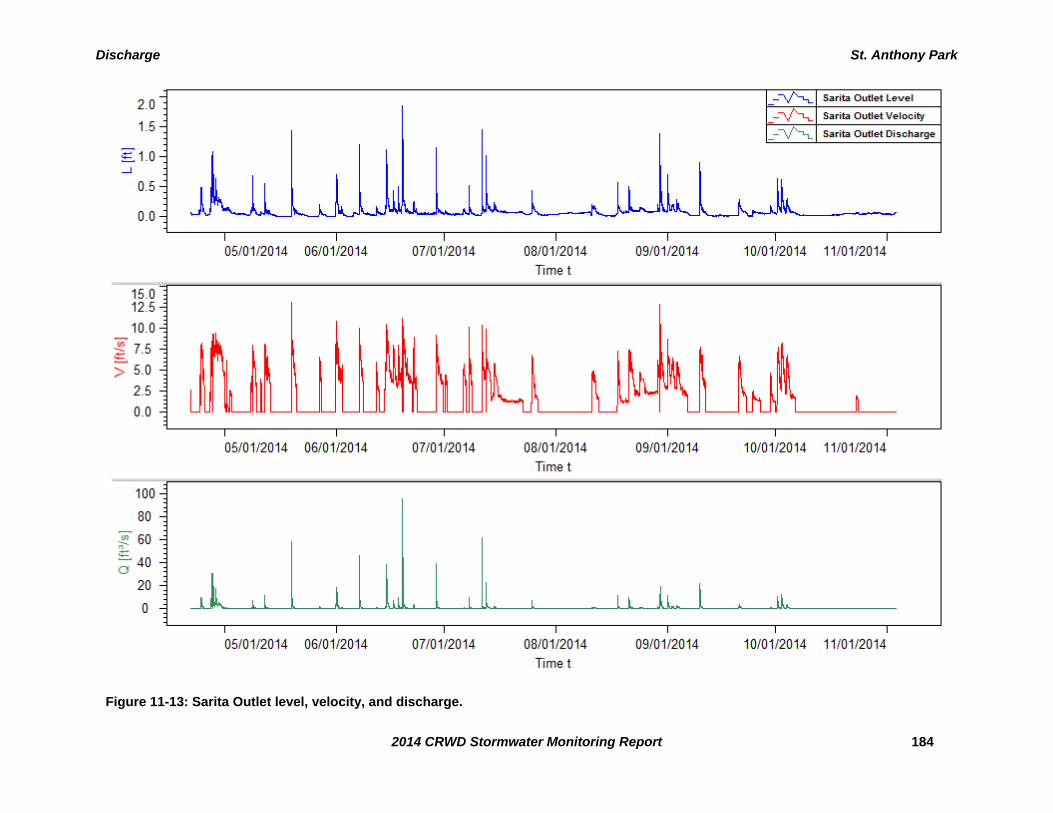
Discharge St. Anthony Park
2014 CRWD Stormwater Monitoring Report 184
Figure 11-13: Sarita Outlet level, velocity, and discharge.

Discharge St. Anthony Park
2014 CRWD Stormwater Monitoring Report 185
Figure 11-14: Sarita Outlet level, discharge, and precipitation.

Total Suspended Solids St. Anthony Park
2014 CRWD Stormwater Monitoring Report 186
Figure 11-15: Historical total monitored TSS loads at Sarita subwatershed for snowmelt, stormflow and baseflow from 2005-2014.
0
10,000
20,000
30,000
40,000
50,000
60,000
70,000
2006 2007 2008 2009 2010 2011 2012 2013 2014
TSS
Load
(lbs
)
Year
Storm

Total Suspended Solids St. Anthony Park
2014 CRWD Stormwater Monitoring Report 187
Figure 11-16: Monthly average storm sample TSS concentrations in 2014 for Sarita subwatershed and historical averages (2006-2013).
n=1
n=4
n=8
n=13
n=16
n=19
n=11
n=12
n=1
n=3
n=3
n=5
n=3
n=3
n=1
n=2
0
20
40
60
80
100
120
140
Jan Feb Mar Apr May Jun Jul Aug Sep Oct Nov Dec
TSS
Con
cent
ratio
n (m
g/L)
Month
Historical Average (2006-2013)
2014

Total Phosphorus St. Anthony Park
2014 CRWD Stormwater Monitoring Report 188
Figure 11-17: Historical total monitored TP loads at Sarita subwatershed for snowmelt, stormflow and baseflow from 2005-2014.
0
20
40
60
80
100
120
140
160
180
200
2006 2007 2008 2009 2010 2011 2012 2013 2014
TP L
oad
(lbs)
Year
Storm

Total Phosphorus St. Anthony Park
2014 CRWD Stormwater Monitoring Report 189
Figure 11-18: Monthly average storm sample TP concentrations in 2014 for Sarita subwatershed and historical averages (2006-2013).
n=1
n=4
n=8
n=13
n=16
n=19
n=11
n=12
n=1
0.00
0
n=3
n=3
n=5
n=3
n=3
n=1
n=2
0.00
0
0.00
0.05
0.10
0.15
0.20
0.25
0.30
0.35
0.40
Jan Feb Mar Apr May Jun Jul Aug Sep Oct Nov Dec
TP C
once
ntra
tion
(mg/
L)
Month
Historical Average (2006-2013)
2014

St. Anthony Park
2014 CRWD Stormwater Monitoring Report 190
Table 11-4: Sarita monitoring results, 2006-2014.
2006 2007 2008 2009 2010 2011 2012 2013 2014Subwatershed Area (ac) 929 929 929 929 929 929 929 929 929Total Rainfall (inches) 18.19 23.19 17.64 18.72 30.62 28.90 26.16 24.70 28.37Number of Monitoring Days 159 227 211 213 205 203 228 193 196Number of Storm Sampling Events 7 17 13 13 11 6 17 16 14Number of Storm Intervals 19 33 23 18 30 28 33 32 29Total Discharge (cf) 4,722,303 5,364,747 2,501,022 2,028,779 5,052,244 6,490,307 6,249,725 8,540,386 10,374,751Storm Flow Subtotal (cf) 4,722,303 5,364,747 2,484,855 2,024,843 5,052,244 6,490,307 6,249,725 8,540,386 10,374,751Average TSS Concentration (mg/L) 186 79 82 48 85 53 81 78 72Total FWA TSS (mg/L) 90 99 102 44 143 70 91 118 70Storm FWA TSS (mg/L) 90 99 102 44 143 70 91 118 70Total TSS Load (lbs) 26,516 33,176 15,862 5,553 45,191 28,530 35,652 63,090 45,028Storm TSS Load (lbs) 26,516 33,176 15,780 5,541 45,191 28,530 35,652 63,090 45,028Total TSS Yield (lb/ac) 29 36 17 6 49 31 38 68 48Average TP Concentration (mg/L) 0.36 0.26 0.27 0.21 0.23 0.17 0.24 0.32 0.23Total FWA TP (mg/L) 0.34 0.29 0.29 0.20 0.25 0.20 0.25 0.36 0.23Storm FWA TP (mg/L) 0.34 0.29 0.29 0.20 0.25 0.20 0.25 0.36 0.23Total TP Load (lbs) 102 98 45 26 77 81 98 190 146Storm TP Load (lbs) 102 98 45 26 77 81 98 190 146Total TP Yield (lb/ac) 0.11 0.11 0.05 0.03 0.08 0.09 0.11 0.20 0.16

St. Anthony Park
2014 CRWD Stormwater Monitoring Report 191
Table 11-5: 2014 Sarita loading table.
Site Name: Sarita
Sampled Event Sample Event Loading Interval Event Volume (cf)
Interval TP (lb)
Interval TSS (lb) Start End
Storm 4/21/2014 13:30 4/21/2014 15:30 849 0.01 3 x Storm 4/24/2014 0:15 4/25/2014 8:45 230,538 2.73 374 x Storm 4/26/2014 22:30 5/1/2014 7:30 1,689,131 21.62 7,645 Storm 5/1/2014 10:45 5/2/2014 3:00 18,433 0.29 60 Storm 5/2/2014 6:15 5/2/2014 22:45 9,133 0.14 30 x Storm 5/8/2014 1:30 5/9/2014 19:30 199,879 2.62 774 Storm 5/11/2014 1:00 5/11/2014 4:45 2,355 0.04 8 x Storm 5/11/2014 23:30 5/13/2014 15:00 175,127 2.08 306 Storm 5/19/2014 11:00 5/21/2014 1:00 620,733 9.69 2,015 Storm 5/27/2014 4:30 5/27/2014 20:45 39,405 0.61 128 x Storm 5/31/2014 20:30 6/2/2014 18:30 365,286 3.19 524 x Storm 6/7/2014 8:00 6/8/2014 14:30 393,662 7.13 3,957 Storm 6/12/2014 0:00 6/12/2014 19:45 26,952 0.35 114 x Storm 6/14/2014 10:30 6/21/2014 23:45 2,272,546 23.41 6,313 Storm 6/22/2014 11:00 6/23/2014 12:00 67,116 0.88 284 x Storm 6/28/2014 17:00 6/30/2014 14:15 307,537 4.61 1,401 Storm 7/1/2014 6:15 7/1/2014 19:30 9,759 0.15 46 Storm 7/6/2014 7:00 7/7/2014 0:45 23,190 0.36 109 x Storm 7/7/2014 18:15 7/8/2014 18:00 111,084 1.32 277 x Storm 7/11/2014 8:00 7/22/2014 21:30 818,625 9.71 4,088 x Storm 7/25/2014 3:15 7/26/2014 20:45 130,594 1.71 220 Storm 8/10/2014 22:00 8/12/2014 19:45 98,971 1.30 392 x Storm 8/18/2014 0:00 9/6/2014 12:15 1,631,918 36.98 13,210 x Storm 9/9/2014 21:30 9/11/2014 15:15 262,183 3.76 867 Storm 9/20/2014 18:00 9/22/2014 23:15 119,874 2.10 408 Storm 9/24/2014 15:15 9/26/2014 18:30 18,769 0.33 64 Storm 9/29/2014 10:30 10/1/2014 1:00 29,683 0.52 101 x Storm 10/1/2014 7:45 10/6/2014 9:15 661,005 8.67 1,300 Storm 10/23/2014 5:15 10/23/2014 18:45 5,049 0.07 9
Storm Subtotal 10,339,388 146 45,028
TOTAL ANNUAL 10,339,388 146 45,028

St. Anthony Park
2014 CRWD Stormwater Monitoring Report 192

St. Anthony Park
2014 CRWD Stormwater Monitoring Report 193
Table 11-6: 2014 Sarita laboratory data.
SaritaSample Sampling Start Sampling End Ortho-P Cl Cd Cr Cu Pb Ni Zn NH3 TKN Total P NO3 NO2 TDS TSS VSS Hardness CBOD SO4 E. coli Dissolved PType Date/Time Date/Time mg/L mg/L mg/L mg/L mg/L mg/L mg/L mg/L mg/L mg/L mg/L mg/L mg/L mg/L mg/L mg/L mg/L mg/L mg/L mpn/100 mL mg/LStorm Grab 04/24/2014 08:00 04/24/2014 08:00 0.045 30.1 0.00020 0.00160 0.00670 0.00310 0.00170 0.04380 0.610 1.9 0.19 0.77 0.06 127 26 19 46 - 8.8 308 0.067Storm Composite 04/27/2014 04:47 04/27/2014 12:49 0.049 6.0 0.00020 0.00380 0.00820 0.01060 0.00340 0.04940 0.370 1.5 0.23 0.32 0.03 69 87 22 32 - - - 0.052Storm Composite 04/28/2014 10:46 04/28/2014 15:15 0.044 2.6 0.00020 0.00440 0.00810 0.01110 0.00400 0.04870 0.170 0.8 0.18 0.22 0.03 62 58 15 32 - - - 0.043Storm Composite 05/08/2014 16:47 05/08/2014 21:30 0.030 7.6 0.00020 0.00260 0.00710 0.00730 0.00240 0.04850 0.440 1.5 0.21 0.44 0.04 82 62 16 54 - - - 0.050Storm Composite 05/12/2014 00:16 05/12/2014 06:00 0.058 4.7 0.00020 0.00150 0.00630 0.00430 0.00190 0.03800 0.100 0.9 0.19 0.05 0.03 63 28 10 46 - - - 0.095Storm Grab 05/19/2014 11:10 05/19/2014 11:10 - - - - - - - - - - - - - - - - - - - 3 -Storm Composite 05/31/2014 21:31 06/01/2014 07:46 0.075 3.2 0.00020 0.00120 0.00280 0.00320 0.00150 0.02010 0.160 0.8 0.14 0.27 0.04 55 23 7 42 - - - 0.091Storm Composite 06/07/2014 08:17 06/07/2014 10:31 - 2.3 0.00020 0.00420 0.00920 0.01370 0.00460 0.05220 0.400 1.8 0.29 0.40 0.03 46 161 35 52 - - - 0.038Storm Composite 06/14/2014 20:46 06/15/2014 01:01 0.044 3.5 0.00020 0.00230 0.00520 0.00710 0.00220 0.02830 0.150 1.0 0.20 0.28 0.03 54 72 20 32 - - - 0.033Storm Composite 06/16/2014 19:46 06/16/2014 22:15 0.059 3.7 0.00020 0.00110 0.00420 0.00230 0.00150 0.01750 0.110 0.8 0.13 0.14 0.04 52 17 5 52 - - - 0.060Storm Composite 06/19/2014 04:16 06/19/2014 05:23 0.048 2.0 0.00020 0.00560 0.01050 0.02050 0.00520 0.05460 0.150 1.5 0.32 0.22 0.03 57 183 41 28 - - - 0.059Storm Grab 06/19/2014 08:10 06/19/2014 08:10 - - - - - - - - - - - - - - - - - - - 8,800 -Storm Composite 06/28/2014 17:46 06/28/2014 21:45 0.089 3.2 0.00020 0.00330 0.00710 0.01040 0.00340 0.03750 0.180 1.1 0.24 0.24 0.03 54 73 18 40 - - - 0.095Storm Composite 07/07/2014 18:46 07/07/2014 20:45 0.036 6.8 0.00020 0.00210 0.00630 0.00640 0.00260 0.03250 0.160 1.3 0.19 0.31 0.03 93 40 11 60 - - - 0.040Storm Grab 07/11/2014 08:20 07/11/2014 08:20 - - - - - - - - - - - - - - - - - - - 1,986 -Storm Composite 07/11/2014 09:02 07/11/2014 11:01 0.077 2.0 0.00020 0.00360 0.00700 0.00930 0.00360 0.03260 0.140 0.7 0.19 0.14 0.03 43 80 18 68 - - - 0.076Storm Grab 07/25/2014 06:31 07/25/2014 08:46 - 6.8 0.00020 0.00170 0.00790 0.01050 0.00220 0.03330 0.140 1.5 0.21 0.47 0.04 98 27 11 64 - - - 0.044Storm Composite 08/18/2014 00:31 08/18/2014 03:45 0.024 4.9 0.00020 0.00380 0.00970 0.01400 0.00360 0.05450 0.080 1.4 0.28 0.29 0.03 82 111 32 72 - - - 0.054Storm Composite 08/21/2014 06:31 08/21/2014 09:15 0.066 6.9 0.00020 0.00440 0.01110 0.01330 0.00420 0.06020 0.100 1.3 0.28 0.43 0.03 99 107 37 76 - - - 0.063Storm Composite 08/29/2014 17:32 08/29/2014 20:31 - 6.5 0.00025 0.00830 0.01620 0.02380 0.00690 0.10100 0.190 2.5 0.53 0.11 0.03 78 171 48 60 - - - 0.078Storm Composite 09/09/2014 23:01 09/10/2014 04:30 0.054 5.6 0.00020 0.00320 0.00740 0.00880 0.00300 0.03630 0.060 1.2 0.23 0.31 0.04 77 53 14 46 6.2 3.1 - 0.054Storm Grab 10/01/2014 09:25 10/01/2014 09:25 - - - - - - - - - - - - - - - - - - - 24,600 -Storm Composite 10/01/2014 09:31 10/01/2014 17:15 0.111 4.7 0.00020 0.00170 0.00580 0.00240 0.00200 0.02370 0.020 0.9 0.23 0.37 0.05 66 24 9 64 - - - 0.133Storm Composite 10/02/2014 14:46 10/02/2014 23:45 0.085 4.9 0.00020 0.00250 0.00660 0.00300 0.00260 0.02710 0.060 0.9 0.19 0.39 0.05 69 39 12 64 - - - 0.098
Snow melt Average - - - - - - - - - - - - - - - - - - - - -Storm Average 0.058 5.9 0.00020 0.00315 0.00767 0.00926 0.00313 0.04199 0.190 1.3 0.23 0.31 0.04 71 72 20 52 6.2 5.9 7,139 0.066
Annual Average 0.058 5.9 0.00020 0.00315 0.00767 0.00926 0.00313 0.04199 0.190 1.3 0.23 0.31 0.04 71 72 20 52 6.2 5.9 7,139 0.066Annual Maximum 0.111 30.1 0.00025 0.00830 0.01620 0.02380 0.00690 0.10100 0.610 2.5 0.53 0.77 0.06 127 183 48 76 6.2 8.8 24,600 0.133Annual Minimum 0.024 2.0 0.00020 0.00110 0.00280 0.00230 0.00150 0.01750 0.020 0.7 0.13 0.05 0.03 43 17 5 28 6.2 3.1 3 0.033Annual Median 0.054 4.8 0.00020 0.00290 0.00710 0.00905 0.00280 0.03775 0.150 1.3 0.21 0.30 0.03 68 60 17 52 6.2 5.9 1,986 0.060
Actual number less than value (<)Estimated concentration above the adjusted method detection limit and below the adjusted reporting limit.
- Not collected

St. Anthony Park
2014 CRWD Stormwater Monitoring Report 194
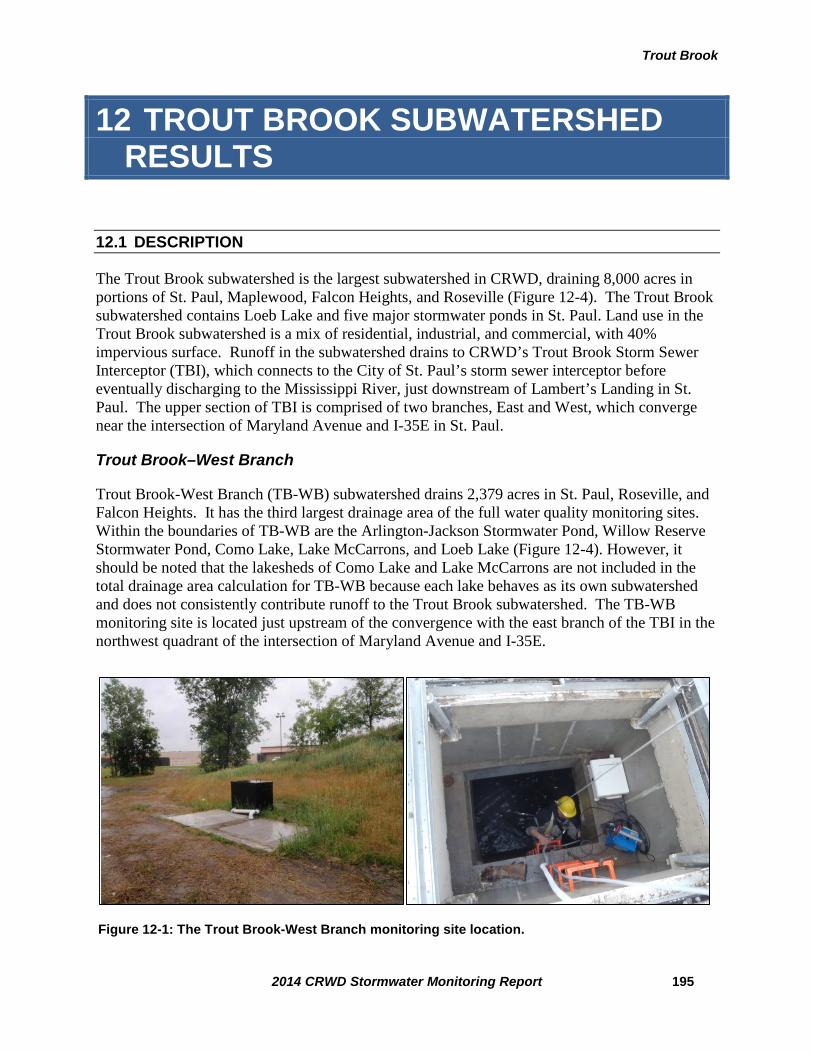
Trout Brook
12 TROUT BROOK SUBWATERSHED RESULTS
12.1 DESCRIPTION
The Trout Brook subwatershed is the largest subwatershed in CRWD, draining 8,000 acres in portions of St. Paul, Maplewood, Falcon Heights, and Roseville (Figure 12-4). The Trout Brook subwatershed contains Loeb Lake and five major stormwater ponds in St. Paul. Land use in the Trout Brook subwatershed is a mix of residential, industrial, and commercial, with 40% impervious surface. Runoff in the subwatershed drains to CRWD’s Trout Brook Storm Sewer Interceptor (TBI), which connects to the City of St. Paul’s storm sewer interceptor before eventually discharging to the Mississippi River, just downstream of Lambert’s Landing in St. Paul. The upper section of TBI is comprised of two branches, East and West, which converge near the intersection of Maryland Avenue and I-35E in St. Paul.
Trout Brook–West Branch
Trout Brook-West Branch (TB-WB) subwatershed drains 2,379 acres in St. Paul, Roseville, and Falcon Heights. It has the third largest drainage area of the full water quality monitoring sites. Within the boundaries of TB-WB are the Arlington-Jackson Stormwater Pond, Willow Reserve Stormwater Pond, Como Lake, Lake McCarrons, and Loeb Lake (Figure 12-4). However, it should be noted that the lakesheds of Como Lake and Lake McCarrons are not included in the total drainage area calculation for TB-WB because each lake behaves as its own subwatershed and does not consistently contribute runoff to the Trout Brook subwatershed. The TB-WB monitoring site is located just upstream of the convergence with the east branch of the TBI in the northwest quadrant of the intersection of Maryland Avenue and I-35E.
Figure 12-1: The Trout Brook-West Branch monitoring site location.
2014 CRWD Stormwater Monitoring Report 195

Trout Brook
Trout Brook–East Branch
Trout Brook-East Branch (TB-EB) subwatershed drains 932 acres in St. Paul and Maplewood and includes two stormwater ponds, Westminster-Mississippi and Arlington-Arkwright. First established in 2006, this monitoring station was moved slightly downstream in 2007 from its original location to a manhole located between L’Orient Street and the I-35E ramp (Figure 12-4). The TB-EB subwatershed receives direct runoff from the I-35E corridor, which is very influential to the water quality measured at this monitoring station.
Trout Brook Outlet
The Trout Brook Outlet (TBO) monitoring station receives water from nearly 5,028 acres of the Trout Brook subwatershed, which includes the combined discharge from TB-EB and TB-WB monitoring locations. Like TB-WB, the TBO subwatershed does not include the lakeshed drainage areas of Como Lake and Lake McCarrons in its total drainage area (Figure 12-4)
Figure 12-2: The Trout Brook-East Branch monitoring site location.
Figure 12-3: The Trout Brook Outlet monitoring site location.
2014 CRWD Stormwater Monitoring Report 196

Trout Brook
Figure 12-4: Map of the Trout Brook subwatershed and monitoring locations.
2014 CRWD Stormwater Monitoring Report 197

Trout Brook
12.2 2014 MONITORING SUMMARY – TROUT BROOK – WEST BRANCH
The Trout Brook West Branch subwatershed has been monitored for discharge and water quality since 2005. Flow and water quality monitoring at this location generally occurred between the months of April to November from 2005-2009. Since 2010 flow monitoring has been conducted year-round.
Summaries of 2014 monitoring data collected and observed at Trout Brook West Branch are listed below. Monitoring efficiency at Trout Brook West Branch is explained in Appendix B.
12.2.1 DISCHARGE – TROUT BROOK WEST BRANCH
Level, velocity, and discharge were monitored at Trout Brook West Branch for baseflow, stormflow and snowmelt events in 2014.
• Total baseflow discharge: 282,134,204 cubic feet (Figure 12-5; Table 12-1) • Total stormflow discharge: 55,748,238 cubic feet (Figure 12-5; Table 12-1) • Total snowmelt discharge: 2,161,887 cubic feet (Figure 12-5; Table 12-1) • Total annual discharge: 340,044,329 cubic feet (Figure 12-5; Table 12-1)
12.2.2 TOTAL SUSPENDED SOLIDS (TSS) – TROUT BROOK WEST BRANCH
Baseflow, stormflow, and snowmelt samples were analyzed for TSS concentrations in mg/L in order to calculate event-based and total annual loads.
• Baseflow flow weighted average concentration: 12 mg/L (Table 12-1) • Stormflow flow weighted average concentration: 253 mg/L (Table 12-1) • Snowmelt flow weighted average concentration: 478 mg/L (Table 12-1) • Total baseflow TSS load: 201,792 lbs (Figure 12-9; Table 12-1) • Total stormflow TSS load: 926,437 lbs (Figure 12-9; Table 12-1) • Total snowmelt TSS load: 63,091 lbs (Figure 12-9; Table 12-1) • Total annual TSS load: 1,191,320 lbs (Figure 12-9; Table 12-1)
12.2.3 TOTAL PHOSPHORUS (TP) – TROUT BROOK WEST BRANCH
Baseflow, stormflow and snowmelt samples were analyzed for TP concentrations in mg/L in order to calculate event-based and total annual loads.
• Baseflow flow weighted average concentration: 0.07 mg/L (Table 12-1) • Stormflow flow weighted average concentration: 0.44 mg/L (Table 12-1) • Snowmelt flow weighted average concentration: 1.19 mg/L (Table 12-1 • Total baseflow TP load: 1,287 lbs (Figure 12-11; Table 12-1) • Total stormflow TP load: 1,620 lbs (Figure 12-11; Table 12-1) • Total snowmelt TP load: 157 lbs (Figure 12-11; Table 12-1) • Total annual TP load: 3,063 lbs (Figure 12-11; Table 12-1)
2014 CRWD Stormwater Monitoring Report 198

Discharge Trout Brook
Figure 12-5: Historical total monitored discharge volumes at Trout Brook West Branch subwatershed for snowmelt, stormflow and baseflow from 2005-2014
0
50,000,000
100,000,000
150,000,000
200,000,000
250,000,000
300,000,000
350,000,000
400,000,000
2005 2006 2007 2008 2009 2010 2011 2012 2013 2014
Dis
char
ge (c
f)
Year
Snowmelt
Storm
Base
Seasonally Monitored (~Apr-Nov)
Continuously Monitored (Jan-Dec)
2014 CRWD Stormwater Monitoring Report 199

Discharge Trout Brook
Figure 12-6: Trout Brook West Branch cumulative discharge and daily precipitation.
2014 CRWD Stormwater Monitoring Report 200

Discharge Trout Brook
Figure 12-7: Trout Brook - West Branch level, velocity, and discharge.
2014 CRWD Stormwater Monitoring Report 201

Discharge Trout Brook
Figure 12-8: Trout Brook - West Branch level, discharge, and precipitation.
2014 CRWD Stormwater Monitoring Report 202
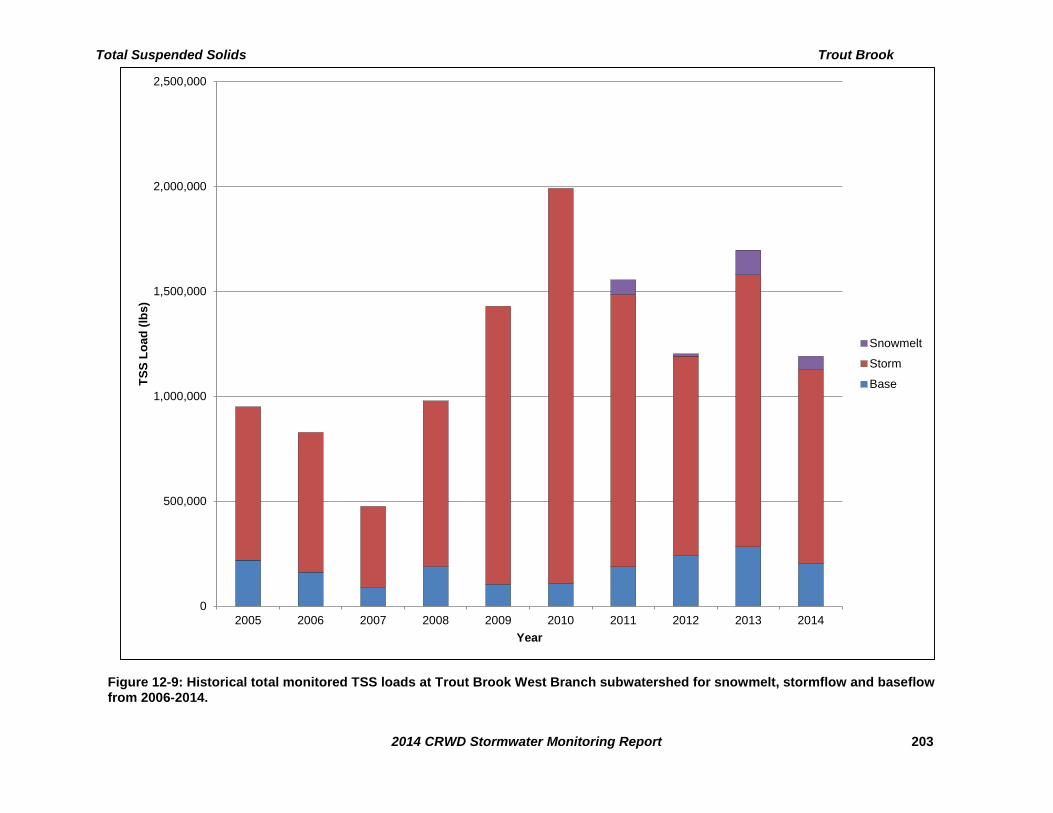
Total Suspended Solids Trout Brook
Figure 12-9: Historical total monitored TSS loads at Trout Brook West Branch subwatershed for snowmelt, stormflow and baseflow from 2006-2014.
0
500,000
1,000,000
1,500,000
2,000,000
2,500,000
2005 2006 2007 2008 2009 2010 2011 2012 2013 2014
TSS
Load
(lbs
)
Year
Snowmelt
Storm
Base
2014 CRWD Stormwater Monitoring Report 203

Total Suspended Solids Trout Brook
Figure 12-10: Monthly average storm sample TSS concentrations in 2014 for Trout Brook West Branch subwatershed and historical averages (2007-2013).
n=3
n=5
n=22
n=17
n=21
n=21
n=9
n=14
n=1
n=1
n=3
n=6
n=4
n=3
n=3
n=1
n=2
0
50
100
150
200
250
300
350
400
450
Jan Feb Mar Apr May Jun Jul Aug Sep Oct Nov Dec
TSS
Con
cent
ratio
n (m
g/L)
Month
Historical Average (2007-2013)
2014
2014 CRWD Stormwater Monitoring Report 204

Total Phosphorus Trout Brook
Figure 12-11: Historical total monitored TP loads at Trout Brook West Branch subwatershed for snowmelt, stormflow and baseflow from 2006-2014.
0
500
1,000
1,500
2,000
2,500
3,000
3,500
4,000
4,500
2005 2006 2007 2008 2009 2010 2011 2012 2013 2014
TP L
oad
(lbs)
Year
Snowmelt
Storm
Base
2014 CRWD Stormwater Monitoring Report 205

Total Phosphorus Trout Brook
Figure 12-12: Monthly average storm sample TP concentrations in 2014 for Trout Brook West Branch subwatershed and historical averages (2007-2013).
n=3
n=5
n=22
n=17
n=21
n=21
n=9
n=14
n=1
n=1
n=3
n=6
n=4
n=3
n=3
n=1
n=2
0.00
0
0.00
0.10
0.20
0.30
0.40
0.50
0.60
0.70
0.80
0.90
1.00
Jan Feb Mar Apr May Jun Jul Aug Sep Oct Nov Dec
TP C
once
ntra
tion
(mg/
L)
Month
Historical Average (2007-2013)
2014
2014 CRWD Stormwater Monitoring Report 206

Trout Brook Table 12-1: Trout Brook West Branch subwatershed monitoring results, 2005-2014.
2005 2006 2007 2008 2009 2010 2011 2012 2013 2014Subwatershed Area (ac) 2,379 2,379 2,379 2,379 2,379 2,379 2,379 2,379 2,379 2,379Total Rainfall (inches) 28.78 24.67 24.25 18.99 20.63 36.32 33.62 29.72 36.36 35.46Number of Monitoring Days 191 212 228 224 273 365 365 344 365 356Number of Storm Sampling Events 27 12 18 8 20 21 11 15 17 20Number of Storm Intervals 14 21 38 27 31 54 27 50 30 64Number of Snowmelt Sampling Events NA NA NA NA NA NA 6 2 1 2Number of Snowmelt Intervals NA NA NA NA NA NA 13 4 11 8Total Discharge (cf) 141,113,120 105,996,024 178,456,040 136,464,730 173,066,683 333,565,680 328,689,637 284,097,170 344,928,332 340,044,329Storm Flow Subtotal (cf) 27,471,750 26,637,070 39,682,781 33,416,733 56,480,312 136,032,158 135,021,212 114,260,205 82,367,885 55,748,238Snowmelt Flow Subtotal (cf) NA NA NA NA NA NA 15,136,168 3,067,371 30,734,929 2,161,887Baseflow Subtotal (cf) 103,641,370 79,358,954 138,773,259 103,047,997 116,586,370 197,212,437 178,532,258 166,769,594 231,825,518 282,134,204Average TSS Concentration (mg/L) 270 266 109 375 130 203 70 69 200 158Total FWA TSS (mg/L) 108 125 43 115 86 96 76 68 79 56Storm FWA TSS (mg/L) 312 400 156 378 233 222 154 133 252 253Snowmelt FWA TSS (mg/L) NA NA NA NA NA NA 73 58 61 478Baseflow FWA TSS (mg/L) 34 33 10 29 14 9 17 23 20 12Total TSS Load (lbs) 950,788 827,991 476,080 978,540 927,558 1,991,582 1,555,358 1,203,283 1,697,347 1,191,320Storm TSS Load (lbs) 730,597 665,210 386,111 788,964 747,671 1,881,829 1,298,980 949,463 1,296,088 926,437Snowmelt TSS Load (lbs) NA NA NA NA NA NA 68,730 11,167 117,907 63,091Baseflow TSS Load (lbs) 220,191 162,781 89,468 189,576 104,904 109,272 187,648 242,653 283,352 201,792Total TSS Yield (lb/ac) 400 348 200 411 390 837 654 506 713 501Average TP Concentration (mg/L) 0.36 0.28 0.24 0.50 0.29 0.26 0.20 0.24 0.29 0.27Total FWA TP (mg/L) 0.16 0.19 0.11 0.17 0.17 0.18 0.20 0.22 0.19 0.14Storm FWA TP (mg/L) 0.41 0.42 0.31 0.47 0.41 0.37 0.34 0.41 0.42 0.44Snowmelt FWA TP (mg/L) NA NA NA NA NA NA 0.27 0.27 0.25 1.19Baseflow FWA TP (mg/L) 0.08 0.11 0.06 0.07 0.06 0.05 0.09 0.10 0.10 0.07Total TP Load (lbs) 1,440 1,249 1,255 1,453 1,739 3,820 4,116 3,983 4,134 3,063Storm TP Load (lbs) 955 697 761 981 1,179 3,150 2,878 2,942 2,159 1,620Snowmelt TP Load (lbs) NA NA NA NA NA NA 255 51 478 157Baseflow TP Load (lbs) 484 553 494 472 422 668 983 983 1,497 1,287Total TP Yield (lb/ac) 0.61 0.53 0.53 0.61 0.73 1.61 1.73 1.67 1.74 1.29NA: Not available. Snow melt events w ere not monitored or sampled until 2011.
2014 CRWD Stormwater Monitoring Report 207

Trout Brook
12.3 2014 MONITORING SUMMARY – TROUT BROOK – EAST BRANCH
The Trout Brook East Branch subwatershed has been monitored for discharge and water quality since 2006. Flow and water quality monitoring at this location generally occurred between the months of April to November from 2006-2009. Since 2010 flow monitoring has been conducted year-round.
Summaries of 2014 monitoring data collected and observed at Trout Brook East Branch are listed below. Monitoring efficiency at Trout Brook West Branch is explained in Appendix B.
12.3.1 DISCHARGE – TROUT BROOK EAST BRANCH
Level, velocity, and discharge were monitored at Trout Brook East Branch for baseflow, stormflow and snowmelt events in 2014.
• Total baseflow discharge: 44,329,393 cubic feet (Figure 12-13 Table 12-2) • Total stormflow discharge: 20,003,770 cubic feet (Figure 12-13; Table 12-2) • Total snowmelt discharge: 268,508 cubic feet (Figure 12-13; Table 12-2) • Total annual discharge: 64,601,671 cubic feet (Figure 12-13; Table 12-2)
12.3.2 TOTAL SUSPENDED SOLIDS (TSS) – TROUT BROOK EAST BRANCH
Baseflow, stormflow, and snowmelt samples were analyzed for TSS concentrations in mg/L in order to calculate event-based and total annual loads.
• Baseflow flow weighted average concentration: 10 mg/L (Table 12-2) • Stormflow flow weighted average concentration: 238 mg/L (Table 12-2) • Snowmelt flow weighted average concentration: 333 mg/L (Table 12-2) • Total baseflow TSS load: 27,481 lbs (Figure 12-17; Table 12-2) • Total stormflow TSS load: 296,464 lbs (Figure 12-17; Table 12-2) • Total snowmelt TSS load: 5,569 (Figure 12-17; Table 12-2) • Total annual TSS load: 329,514 lbs (Figure 12-17; Table 12-2)
12.3.3 TOTAL PHOSPHORUS (TP) – TROUT BROOK EAST BRANCH
Baseflow, stormflow, and snowmelt samples were analyzed for TP concentrations in mg/L in order to calculate event-based and total annual loads.
• Baseflow flow weighted average concentration: 0.09 mg/L (Table 12-2) • Stormflow flow weighted average concentration: 0.48 mg/L (Table 12-2) • Snowmelt flow weighted average concentration: 0.77 mg/L (Table 12-2) • Total baseflow TP load: 236 lbs (Figure 12-19; Table 12-2) • Total stormflow TP load: 593 lbs (Figure 12-19; Table 12-2) • Total snowmelt TP load: 13 lbs (Figure 12-19; Table 12-2) • Total annual TP load: 842 lbs (Figure 12-19; Table 12-2)
2014 CRWD Stormwater Monitoring Report 208

Discharge Trout Brook
Figure 12-13: Historical total monitored discharge volumes at Trout Brook East Branch for snowmelt, stormflow and baseflow from 2006-2014.
0
10,000,000
20,000,000
30,000,000
40,000,000
50,000,000
60,000,000
70,000,000
2006 2007 2008 2009 2010 2011 2012 2013 2014
Dis
char
ge (c
f)
Year
Snowmelt
Storm
Base
Seasonally Monitored (~Apr-Nov)
Continuously Monitored (Jan-Dec)
2014 CRWD Stormwater Monitoring Report 209

Discharge Trout Brook
Figure 12-14: Trout Brook East Branch cumulative discharge and daily precipitation.
2014 CRWD Stormwater Monitoring Report 210

Discharge Trout Brook
Figure 12-15: Trout Brook - East Branch level, velocity, and discharge.
2014 CRWD Stormwater Monitoring Report 211

Discharge Trout Brook
Figure 12-16: Trout Brook - East Branch level, discharge, and precipitation.
2014 CRWD Stormwater Monitoring Report 212

Total Suspended Solids Trout Brook
Figure 12-17: Historical total monitored TSS loads at Trout Brook East Branch subwatershed for snowmelt, stormflow and baseflow from 2006-2014.
0
50,000
100,000
150,000
200,000
250,000
300,000
350,000
400,000
2006 2007 2008 2009 2010 2011 2012 2013 2014
TSS
Load
(lbs
)
Year
Snowmelt
Storm
Base
2014 CRWD Stormwater Monitoring Report 213
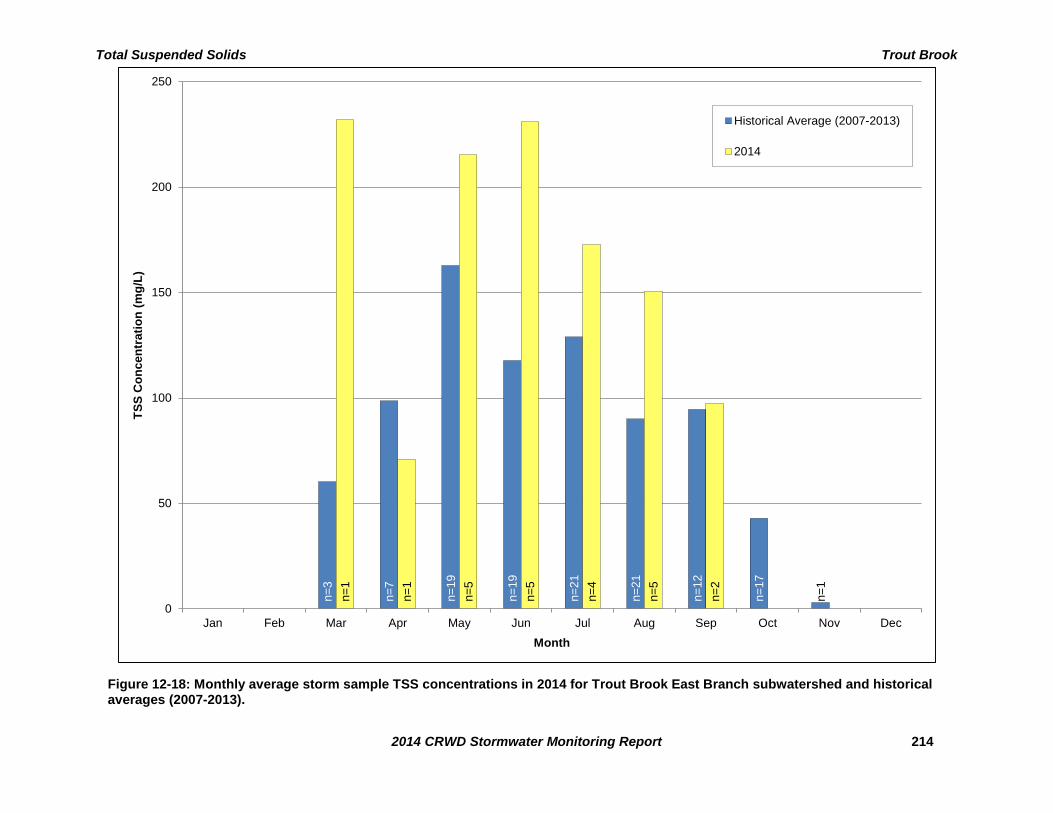
Total Suspended Solids Trout Brook
Figure 12-18: Monthly average storm sample TSS concentrations in 2014 for Trout Brook East Branch subwatershed and historical averages (2007-2013).
n=3
n=7
n=19
n=19
n=21
n=21
n=12
n=17
n=1
n=1
n=1
n=5
n=5
n=4
n=5
n=2
0
50
100
150
200
250
Jan Feb Mar Apr May Jun Jul Aug Sep Oct Nov Dec
TSS
Con
cent
ratio
n (m
g/L)
Month
Historical Average (2007-2013)
2014
2014 CRWD Stormwater Monitoring Report 214

Total Phosphorus Trout Brook
Figure 12-19: Historical total monitored TP loads at Trout Brook East Branch subwatershed for snowmelt, stormflow and baseflow from 2006-2014.
0
100
200
300
400
500
600
700
800
900
2006 2007 2008 2009 2010 2011 2012 2013 2014
TP L
oad
(lbs)
Year
Snowmelt
Storm
Base
2014 CRWD Stormwater Monitoring Report 215

Total Phosphorus Trout Brook
Figure 12-20: Monthly average storm sample TP concentrations in 2014 for Trout Brook East Branch subwatershed and historical averages (2007-2013).
n=3
n=7
n=19
n=19
n=21
n=21
n=12
n=17
n=1
n=1
n=1
n=5
n=5
n=4
n=5
n=2
n=0
0.00
0.10
0.20
0.30
0.40
0.50
0.60
0.70
0.80
0.90
1.00
Jan Feb Mar Apr May Jun Jul Aug Sep Oct Nov Dec
TP C
once
ntra
tion
(mg/
L)
Month
Historical Average (2007-2013)
2014
2014 CRWD Stormwater Monitoring Report 216

Trout Brook Table 12-2: Trout Brook East Branch subwatershed monitoring results, 2006-2014.
2006 2007 2008 2009 2010 2011 2012 2013 2014Subwatershed Area (ac) 451 932 932 932 932 932 932 932 932Total Rainfall (inches) 23.87 23.92 17.91 20.63 36.27 33.43 30.01 36.36 35.66Number of Monitoring Days 191 220 220 273 359 349 357 365 365Number of Storm Sampling Events 11 24 14 18 19 11 17 15 19Number of Storm Intervals 27 30 19 32 37 32 34 32 34Number of Snowmelt Sampling Events NA NA NA NA NA 9 2 2 2Number of Snowmelt Intervals NA NA NA NA NA 10 6 12 3Total Discharge (cf) 8,769,577 22,368,888 19,741,039 26,611,519 41,959,911 43,363,061 42,492,402 49,693,121 64,601,671Storm Flow Subtotal (cf) 7,411,730 14,214,980 9,634,182 11,911,763 21,073,199 19,264,104 15,359,967 16,230,742 20,003,770Snowmelt Flow Subtotal (cf) NA NA NA NA NA 2,405,051 2,496,397 7,466,757 268,508Baseflow Subtotal (cf) 1,357,847 8,153,908 10,106,857 14,699,756 20,886,712 21,693,906 24,636,038 25,995,622 44,329,393Average TSS Concentration (mg/L) 37 98 72 49 51 37 53 245 142Total FWA TSS (mg/L) 44 71 70 39 44 46 54 123 82Storm FWA TSS (mg/L) 51 105 132 79 83 79 109 332 238Snowmelt FWA TSS (mg/L) NA NA NA NA NA 56 64 32 333Baseflow FWA TSS (mg/L) 7 11 11 8 5 16 19 18 10Total TSS Load (lbs) 24,279 99,207 86,186 65,532 115,109 124,707 143,168 380,532 329,514Storm TSS Load (lbs) 23,687 93,578 79,265 58,555 109,063 94,989 104,312 336,596 296,464Snowmelt TSS Load (lbs) NA NA NA NA NA 8,365 10,019 14,872 5,569Baseflow TSS Load (lbs) 591 5,628 6,921 6,977 3,047 21,353 28,837 29,064 27,481Total TSS Yield (lb/ac) 54 106 92 70 124 134 154 408 354Average TP Concentration (mg/L) 0.22 0.24 0.18 0.17 0.28 0.20 0.22 0.32 0.32Total FWA TP (mg/L) 0.28 0.21 0.18 0.15 0.26 0.20 0.21 0.26 0.21Storm FWA TP (mg/L) 0.32 0.28 0.29 0.26 0.40 0.31 0.38 0.47 0.48Snowmelt FWA TP (mg/L) NA NA NA NA NA 0.20 0.32 0.29 0.77Baseflow FWA TP (mg/L) 0.09 0.08 0.07 0.06 0.12 0.10 0.09 0.12 0.09Total TP Load (lbs) 155 292 218 245 683 544 550 804 842Storm TP Load (lbs) 147 251 173 190 531 378 363 480 593Snowmelt TP Load (lbs) NA NA NA NA NA 30 49 136 13Baseflow TP Load (lbs) 8 41 45 55 152 136 138 188 236Total TP Yield (lb/ac) 0.34 0.31 0.23 0.26 0.73 0.58 0.59 0.86 0.90NA: Not available. Snow melt events w ere not monitored or sampled until 2011.
2014 CRWD Stormwater Monitoring Report 217

Trout Brook
12.4 2014 MONITORING SUMMARY – TROUT BROOK – OUTLET
The Trout Brook Outlet subwatershed has been monitored for discharge and water quality since 2005. Flow and water quality monitoring at this location generally occurred between the months of April to November from 2005-2009. Since 2010 flow monitoring has been conducted year-round.
Summaries of 2014 monitoring data collected and observed at Trout Brook Outlet are listed below. Monitoring efficiency at Trout Brook Outlet is explained in Appendix B.
12.4.1 DISCHARGE – TROUT BROOK OUTLET
Level, velocity, and discharge were monitored at Trout Brook Outlet for baseflow, stormflow and snowmelt events in 2014.
• Total baseflow discharge: 586,007,486 cubic feet (Figure 12-21; Table 12-1) • Total stormflow discharge: 76,728,743 cubic feet (Figure 12-21; Table 12-1) • Total snowmelt discharge: 3,645,447 cubic feet (Figure 12-21; Table 12-1) • Total annual discharge: 666,381,676 cubic feet (Figure 12-21; Table 12-1)
12.4.2 TOTAL SUSPENDED SOLIDS (TSS) – TROUT BROOK OUTLET
Baseflow, stormflow, and snowmelt samples were analyzed for TSS concentrations in mg/L in order to calculate event-based and total annual loads.
• Baseflow flow weighted average concentration: 9 mg/L (Table 12-3) • Stormflow flow weighted average concentration: 373 mg/L (Table 12-3) • Snowmelt flow weighted average concentration: 856 mg/L (Table 12-3) • Total baseflow TSS load: 324,586 lbs (Figure 12-25; Table 12-3) • Total stormflow TSS load: 1,843,264 lbs (Figure 12-25; Table 12-3) • Total snowmelt TSS load: 196,718 (Figure 12-25; Table 12-3) • Total annual TSS load: 2,364,568 lbs (Figure 12-25; Table 12-3)
12.4.3 TOTAL PHOSPHORUS (TP) – TROUT BROOK OUTLET
Baseflow, stormflow and snowmelt samples were analyzed for TP concentrations in mg/L in order to calculate event-based and total annual loads.
• Baseflow flow weighted average concentration: 0.06 mg/L (Table 12-3) • Stormflow flow weighted average concentration: 0.63 mg/L (Table 12-3) • Snowmelt flow weighted average concentration: 1.62 mg/L (Table 12-3) • Total baseflow TP load: 2,059 lbs (Figure 12-27; Table 12-3) • Total stormflow TP load: 3,133 lbs (Figure 12-27; Table 12-3) • Total snowmelt TP load: 372 (Figure 12-27; Table 12-3) • Total annual TP load: 5,564 lbs (Figure 12-27; Table 12-3)
2014 CRWD Stormwater Monitoring Report 218

Discharge Trout Brook
Figure 12-21: Historical total monitored discharge volumes at Trout Brook Outlet subwatershed for snowmelt, stormflow and baseflow from 2005-2014.
0
100,000,000
200,000,000
300,000,000
400,000,000
500,000,000
600,000,000
700,000,000
800,000,000
2005 2006 2007 2008 2009 2010 2011 2012 2013 2014
Dis
char
ge (c
f)
Year
Snowmelt
Storm
Base
Seasonally Monitored (~Apr-Nov)
Continuously Monitored (Jan-Dec)
2014 CRWD Stormwater Monitoring Report 219

Discharge Trout Brook
Figure 12-22: Trout Brook Outlet cumulative discharge and daily precipitation.
2014 CRWD Stormwater Monitoring Report 220

Discharge Trout Brook
Figure 12-23: Trout Brook Outlet level, velocity, and discharge.
2014 CRWD Stormwater Monitoring Report 221

Discharge Trout Brook
Figure 12-24: Trout Brook Outlet level, discharge, and precipitation.
2014 CRWD Stormwater Monitoring Report 222

Total Suspended Solids Trout Brook
Figure 12-25: Historical total monitored TSS loads at Trout Brook Outlet subwatershed for snowmelt, stormflow and baseflow from 2005-2014.
0
500,000
1,000,000
1,500,000
2,000,000
2,500,000
3,000,000
2005 2006 2007 2008 2009 2010 2011 2012 2013 2014
TSS
Load
(lbs
)
Year
Snowmelt
Storm
Base
2014 CRWD Stormwater Monitoring Report 223

Total Suspended Solids Trout Brook
Figure 12-26: Monthly average storm sample TSS concentrations in 2014 for Trout Brook Outlet subwatershed and historical averages (2007-2013).
n=3
n=6
n=25
n=20
n=25
n=20
n=10
n=13
n=2
n=1
n=3
n=4
n=4
n=2
n=4
n=1
n=1
0
100
200
300
400
500
600
700
800
900
1,000
Jan Feb Mar Apr May Jun Jul Aug Sep Oct Nov Dec
TSS
Con
cent
ratio
n (m
g/L)
Month
Historical Average (2007-2013)
2014
2014 CRWD Stormwater Monitoring Report 224

Total Phosphorus Trout Brook
Figure 12-27: Historical total monitored TP loads at Trout Brook Outlet subwatershed for snowmelt, stormflow and baseflow from 2005-2014.
0
1,000
2,000
3,000
4,000
5,000
6,000
2005 2006 2007 2008 2009 2010 2011 2012 2013 2014
TP L
oad
(lbs)
Year
Snowmelt
Storm
Base
2014 CRWD Stormwater Monitoring Report 225

Total Phosphorus Trout Brook
Figure 12-28: Monthly average storm sample TP concentrations in 2014 for Trout Brook Outlet subwatershed and historical averages (2007-2013).
n=3
n=6
n=25
n=20
n=25
n=20
n=10
n=13
n=2
n=1
n=3
n=4
n=4
n=2
n=4
n=1
n=1
0.00
0
0.00
0.20
0.40
0.60
0.80
1.00
1.20
1.40
1.60
Jan Feb Mar Apr May Jun Jul Aug Sep Oct Nov Dec
TP C
once
ntra
tion
(mg/
L)
Month
Historical Average (2007-2013)
2014
2014 CRWD Stormwater Monitoring Report 226

Trout Brook Table 12-3: Trout Brook Outlet subwatershed monitoring results, 2005-2014.
2005 2006 2007 2008 2009 2010 2011 2012 2013 2014Subwatershed Area (ac) 5,028 5,028 5,028 5,028 5,028 5,028 5,028 5,028 5,028 5,028Total Rainfall (inches) 29.28 24.67 24.23 15.54 20.95 36.32 24.53 30.26 36.36 35.50Number of Monitoring Days 198 210 226 198 276 364 344 359 365 363Number of Storm Sampling Events 23 21 19 14 23 24 6 18 19 17Number of Storm Intervals 15 40 38 26 33 52 20 48 30 45Number of Snowmelt Sampling Events NA NA NA NA NA NA 3 1 2 3Number of Snowmelt Intervals NA NA NA NA NA NA 6 4 11 8Total Discharge (cf) 292,595,899 438,485,575 388,392,876 279,271,142 356,849,169 496,585,344 533,045,947 481,542,037 536,193,654 666,381,676Storm Flow Subtotal (cf) 80,113,383 88,748,004 133,852,477 88,336,642 113,482,177 180,006,459 126,247,447 167,030,961 91,385,535 76,728,743Snowmelt Flow Subtotal (cf) NA NA NA NA NA NA 69,637,200 3,307,320 33,744,420 3,645,447Baseflow Subtotal (cf) 212,482,516 349,737,571 254,540,399 190,934,500 243,366,992 316,578,885 337,161,300 311,203,756 411,063,699 586,007,486Average TSS Concentration (mg/L) 311 141 198 82 104 156 47 54 177 188Total FWA TSS (mg/L) 71 50 102 60 56 82 45 43 65 57Storm FWA TSS (mg/L) 201 199 285 175 159 211 129 97 282 373Snowmelt FWA TSS (mg/L) NA NA NA NA NA NA 43 123 87 856Baseflow FWA TSS (mg/L) 20 12 6 8 8 9 13 13 15 9Total TSS Load (lbs) 1,306,755 1,363,229 2,474,834 1,054,580 1,143,682 2,557,705 1,484,552 1,281,255 2,164,883 2,364,568Storm TSS Load (lbs) 1,054,690 1,104,384 2,377,790 963,965 1,027,807 2,374,988 1,013,270 1,012,503 1,608,203 1,843,264Snowmelt TSS Load (lbs) NA NA NA NA NA NA 187,628 25,491 182,492 196,718Baseflow TSS Load (lbs) 252,065 258,845 97,044 90,615 115,875 182,717 283,654 248,311 328,524 324,586Total TSS Yield (lb/ac) 320 271 492 210 227 509 295 255 431 470Average TP Concentration (mg/L) 0.51 0.26 0.30 0.20 0.28 0.31 0.15 0.17 0.30 0.33Total FWA TP (mg/L) 0.15 0.13 0.18 0.16 0.16 0.18 0.15 0.14 0.15 0.13Storm FWA TP (mg/L) 0.34 0.39 0.41 0.39 0.41 0.40 0.30 0.27 0.48 0.63Snowmelt FWA TP (mg/L) NA NA NA NA NA NA 0.22 0.41 0.31 1.62Baseflow FWA TP (mg/L) 0.07 0.07 0.05 0.06 0.05 0.05 0.07 0.06 0.06 0.06Total TP Load (lbs) 2,698 3,630 4,249 2,845 3,638 5,529 4,831 4,162 5,077 5,564Storm TP Load (lbs) 1,742 2,155 3,438 2,175 2,874 4,482 2,366 2,864 2,762 3,133Snowmelt TP Load (lbs) NA NA NA NA NA NA 959 85 661 372Baseflow TP Load (lbs) 956 1,476 811 670 764 1,047 1,505 1,212 1,655 2,059Total TP Yield (lb/ac) 0.70 0.72 0.85 0.57 0.72 1.10 0.96 0.83 1.01 1.11NA: Not available. Snow melt events w ere not monitored or sampled until 2011.
2014 CRWD Stormwater Monitoring Report 227
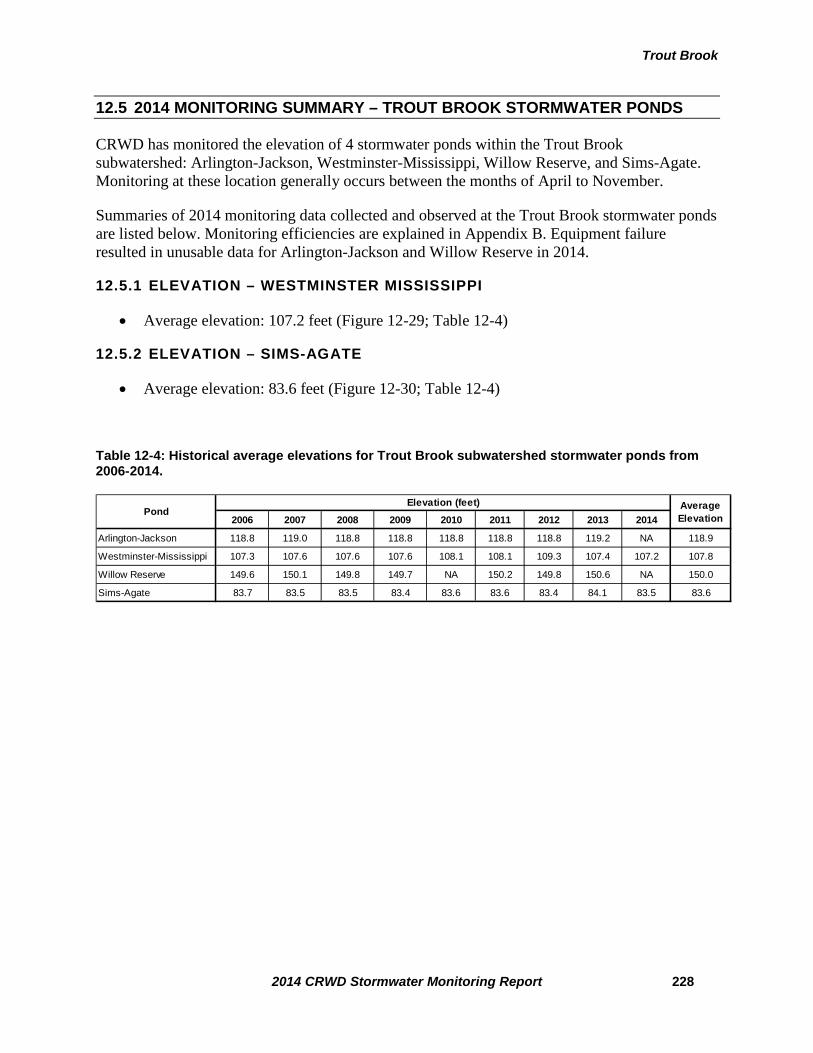
Trout Brook
12.5 2014 MONITORING SUMMARY – TROUT BROOK STORMWATER PONDS
CRWD has monitored the elevation of 4 stormwater ponds within the Trout Brook subwatershed: Arlington-Jackson, Westminster-Mississippi, Willow Reserve, and Sims-Agate. Monitoring at these location generally occurs between the months of April to November.
Summaries of 2014 monitoring data collected and observed at the Trout Brook stormwater ponds are listed below. Monitoring efficiencies are explained in Appendix B. Equipment failure resulted in unusable data for Arlington-Jackson and Willow Reserve in 2014.
12.5.1 ELEVATION – WESTMINSTER MISSISSIPPI
• Average elevation: 107.2 feet (Figure 12-29; Table 12-4)
12.5.2 ELEVATION – SIMS-AGATE
• Average elevation: 83.6 feet (Figure 12-30; Table 12-4)
Table 12-4: Historical average elevations for Trout Brook subwatershed stormwater ponds from 2006-2014.
2006 2007 2008 2009 2010 2011 2012 2013 2014
Arlington-Jackson 118.8 119.0 118.8 118.8 118.8 118.8 118.8 119.2 NA 118.9
Westminster-Mississippi 107.3 107.6 107.6 107.6 108.1 108.1 109.3 107.4 107.2 107.8
Willow Reserve 149.6 150.1 149.8 149.7 NA 150.2 149.8 150.6 NA 150.0
Sims-Agate 83.7 83.5 83.5 83.4 83.6 83.6 83.4 84.1 83.5 83.6
PondElevation (feet) Average
Elevation
2014 CRWD Stormwater Monitoring Report 228
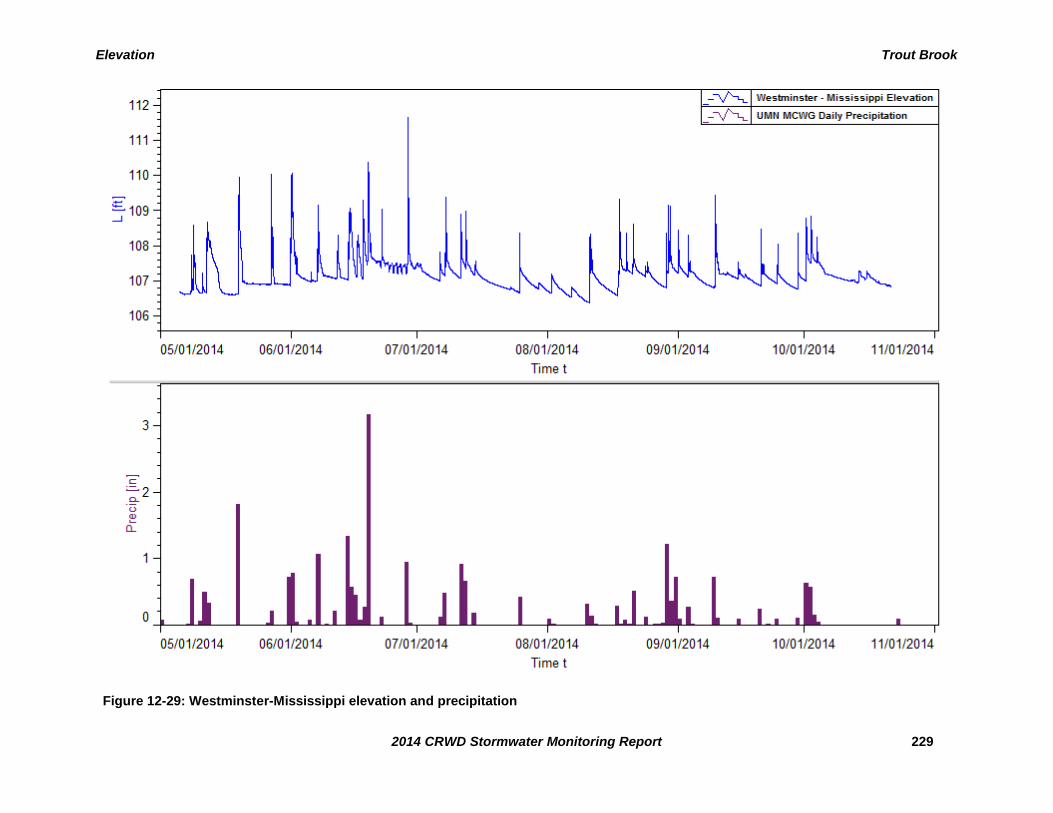
Elevation Trout Brook
Figure 12-29: Westminster-Mississippi elevation and precipitation
2014 CRWD Stormwater Monitoring Report 229

Elevation Trout Brook
Figure 12-30: Sims-Agate elevation and precipitation
2014 CRWD Stormwater Monitoring Report 230

Trout Brook
Table 12-5: 2014 Trout Brook - West Branch subwatershed loading table.
Sampled Event Sample Event Loading Interval Event Volume (cf)
Interval TP (lb)
Interval TSS (lb) Start End
Snowmelt 03/09/2014 13:45 03/09/2014 14:45 842 1.11 274 x Snowmelt 03/10/2014 10:45 03/11/2014 01:15 605,219 57.04 35,927 Snowmelt 03/11/2014 11:30 03/11/2014 21:00 284,945 14.32 3,318 Snowmelt 03/12/2014 13:45 03/12/2014 17:15 57,051 4.56 1,083 x Snowmelt 03/13/2014 11:45 03/14/2014 01:30 606,208 42.72 13,715 Snowmelt 03/14/2014 11:00 03/15/2014 02:30 358,482 24.65 5,820 Snowmelt 03/20/2014 11:45 03/20/2014 13:00 4,648 1.57 385 Snowmelt 03/21/2014 12:30 03/21/2014 20:00 197,435 11.01 2,568 x Storm 03/27/2014 09:45 03/27/2014 23:45 600,667 74.02 32,875 Storm 03/29/2014 12:00 03/29/2014 14:15 42,264 3.54 843 Storm 03/30/2014 10:15 03/30/2014 11:30 18,548 1.88 452 Storm 04/06/2014 07:45 04/06/2014 08:00 4,907 0.25 135 Storm 04/12/2014 07:15 04/12/2014 10:00 17,942 1.07 593 Storm 04/16/2014 18:30 04/17/2014 06:45 409,313 9.79 4,959 Storm 04/19/2014 18:00 04/19/2014 18:45 353 0.34 196 Storm 04/23/2014 20:00 04/23/2014 21:15 8,683 0.70 394 x Storm 04/24/2014 07:15 04/24/2014 18:30 529,890 13.35 9,102 Storm 04/25/2014 19:00 04/26/2014 13:15 199,900 8.41 4,530 x Storm 04/27/2014 04:15 05/01/2014 16:35 14,081,466 226.39 130,050 x Storm 05/08/2014 16:00 05/08/2014 22:00 404,433 25.10 24,896 x Storm 05/11/2014 22:45 05/12/2014 23:00 1,054,231 49.47 76,961 x Storm 05/19/2014 11:00 05/21/2014 16:45 4,827,315 150.00 54,408 x Storm 05/27/2014 04:15 05/27/2014 12:15 1,425,699 31.50 11,777 Storm 05/31/2014 15:00 05/31/2014 20:00 95,204 5.56 3,647 x Storm 05/31/2014 20:40 06/01/2014 16:35 3,473,992 92.22 66,557 x Storm 06/07/2014 07:45 06/11/2014 12:00 3,428,626 95.48 34,893 Storm 06/11/2014 23:30 06/12/2014 02:30 114,696 6.50 3,604 Storm 06/14/2014 11:30 06/14/2014 12:45 15,800 2.04 1,172 x Storm 06/14/2014 20:00 06/17/2014 22:00 4,617,134 44.67 11,314 x Storm 06/18/2014 02:45 06/18/2014 10:30 1,441,200 38.44 71,469 Storm 06/19/2014 03:30 06/19/2014 19:25 6,291,147 205.05 107,876 Storm 06/20/2014 10:29 06/21/2014 05:00 415,502 49.33 28,310 Storm 06/22/2014 11:00 06/22/2014 14:45 218,639 12.78 7,095 x Storm 06/28/2014 15:45 06/28/2014 18:20 1,019,138 31.25 43,034 Storm 06/30/2014 10:29 07/01/2014 21:15 517,533 57.81 33,113 x Storm 07/07/2014 18:00 07/09/2014 01:45 1,322,402 32.40 9,406 x Storm 07/11/2014 08:15 07/11/2014 14:30 808,660 11.25 4,378 x Storm 07/12/2014 13:15 07/12/2014 19:30 673,107 9.78 3,158 Storm 07/14/2014 16:15 07/14/2014 17:45 25,108 1.69 907 Storm 07/25/2014 05:30 07/25/2014 09:45 202,796 6.29 3,143 Storm 08/10/2014 22:15 08/11/2014 00:30 143,654 5.12 3,127 Storm 08/11/2014 01:30 08/11/2014 05:15 285,703 9.28 5,584 Storm 08/11/2014 18:30 08/11/2014 19:45 19,990 1.57 1,031 x Storm 08/18/2014 00:00 08/18/2014 11:45 901,470 20.45 29,681 Storm 08/19/2014 18:15 08/19/2014 20:45 69,876 2.85 1,773 Storm 08/21/2014 06:15 08/21/2014 10:00 205,273 7.37 4,501 Storm 08/24/2014 18:15 08/24/2014 19:45 48,985 2.37 1,505 Storm 08/29/2014 03:30 08/29/2014 06:45 171,945 5.19 3,086 x Storm 08/29/2014 17:15 08/29/2014 21:00 555,817 12.42 4,458 x Storm 08/30/2014 00:45 08/30/2014 07:45 1,077,817 18.21 13,421
2014 CRWD Stormwater Monitoring Report 231

Trout Brook
Storm 08/31/2014 22:15 09/01/2014 03:00 266,101 10.45 6,462 Storm 09/03/2014 10:15 09/03/2014 12:15 9,399 3.60 1,118 Storm 09/09/2014 21:00 09/14/2014 09:30 4,406,792 158.86 49,101 Storm 09/20/2014 17:45 09/20/2014 21:00 186,067 7.39 2,285 Storm 09/24/2014 15:15 09/24/2014 18:30 46,344 3.88 1,202 Storm 09/29/2014 10:00 09/29/2014 20:30 168,683 9.78 3,029 x Storm 10/01/2014 08:15 10/01/2014 18:15 763,943 18.23 3,304 x Storm 10/02/2014 13:00 10/02/2014 21:15 572,672 13.70 2,957 Storm 10/03/2014 23:45 10/04/2014 06:00 175,574 7.53 2,696 Storm 10/23/2014 03:45 10/23/2014 05:15 13,816 1.27 472 Storm 12/15/2014 12:45 12/15/2014 15:45 48,305 0.27 57 Storm 12/21/2014 15:00 12/22/2014 01:30 287,569 1.62 339
Snowmelt Subtotal 2,114,830 157 63,091 Storm Subtotal 58,732,088 1,620 926,437 Total 60,846,917 1,777 989,528
Month Base Loading Interval Monthly Base Volume (cf)
Interval TP (lb)
Interval TSS (lb) Start End
January 01/01/2014 00:00 01/31/2014 23:59 14,216,826 41.71 5,325 February 02/01/2014 00:00 02/28/2014 23:59 13,535,668 60.84 16,899 March 03/01/2014 00:00 03/31/2014 23:59 22,965,672 128.06 13,238 April 04/01/2014 00:00 04/30/2014 23:59 35,171,000 137.46 13,746 May 05/01/2014 00:00 05/31/2014 23:59 32,975,905 167.26 31,393 June 06/01/2014 00:00 06/30/2014 23:59 32,104,116 144.94 15,027 July 07/01/2014 00:00 07/31/2014 23:59 25,359,957 127.70 17,395 August 08/01/2014 00:00 08/31/2014 23:59 20,139,593 116.80 15,426 September 09/01/2014 00:00 09/30/2014 23:59 22,801,863 74.63 20,969 October 10/01/2014 00:00 10/31/2014 23:59 24,074,865 121.75 18,037 November 11/01/2014 00:00 11/30/2014 23:59 15,829,295 53.50 11,833 December 12/01/2014 00:00 12/31/2014 23:59 19,045,130 111.93 22,505
Base Subtotal 278,219,889 1,287 201,792
TOTAL ANNUAL 339,066,807 3,063 1,191,320
2014 CRWD Stormwater Monitoring Report 232

Trout Brook
Table 12-6: 2014 Trout Brook - East Branch subwatershed loading table.
Sampled Event Sample
Event Loading Interval Event Volume (cf) Interval TP (lb)
Interval TSS (lb) Start End
x Snowmelt 03/10/2014 14:10 03/10/2014 14:30 281 0.19 197 x Snowmelt 03/13/2014 12:50 03/13/2014 22:25 152,843 8.26 4,601 Snowmelt 03/14/2014 12:05 03/14/2014 20:25 114,748 4.40 772 x Storm 03/27/2014 12:00 03/27/2014 20:35 264,341 21.72 5,909 Storm 03/30/2014 11:20 03/30/2014 21:40 99,460 3.88 684 Storm 03/31/2014 11:30 03/31/2014 19:25 56,490 2.63 482 Storm 04/05/2014 12:05 04/05/2014 22:25 106,944 2.09 848 Storm 04/16/2014 18:15 04/17/2014 18:00 319,008 4.96 1,920 Storm 04/24/2014 07:00 04/24/2014 23:00 336,563 5.03 1,928 x Storm 04/27/2014 04:00 05/01/2014 16:20 4,038,831 52.31 21,709 x Storm 05/08/2014 15:45 05/09/2014 08:00 142,689 4.36 5,210 x Storm 05/11/2014 22:45 05/13/2014 06:30 412,780 10.57 3,866 x Storm 05/19/2014 10:45 05/21/2014 06:30 1,201,641 22.94 5,667 x Storm 05/27/2014 05:00 05/29/2014 04:00 848,372 34.68 21,305 x Storm 05/31/2014 20:15 06/04/2014 02:30 1,869,233 65.58 37,487 x Storm 06/07/2014 07:45 06/08/2014 09:30 548,398 17.25 11,169 Storm 06/11/2014 23:30 06/12/2014 05:30 27,200 1.47 557 x Storm 06/14/2014 20:00 06/15/2014 22:55 918,015 20.37 10,043 x Storm 06/16/2014 17:15 06/17/2014 11:00 205,468 4.91 636 Storm 06/18/2014 02:45 06/19/2014 01:15 369,771 12.49 4,488 x Storm 06/19/2014 03:40 06/20/2014 21:55 2,599,200 117.35 73,691 Storm 06/22/2014 11:00 06/22/2014 22:00 70,082 2.90 1,068 x Storm 06/28/2014 15:30 06/29/2014 20:30 1,492,701 70.46 39,969 Storm 07/07/2014 18:00 07/08/2014 09:30 420,237 9.83 3,680 Storm 07/11/2014 08:20 07/11/2014 19:50 281,625 7.72 2,963 x Storm 07/12/2014 13:15 07/13/2014 03:45 321,434 9.04 3,879 x Storm 07/25/2014 05:15 07/25/2014 15:15 74,232 3.15 3,496 x Storm 08/10/2014 21:45 08/12/2014 02:45 263,119 5.23 7,180 x Storm 08/18/2014 00:00 08/18/2014 12:15 386,249 12.95 6,556 x Storm 08/21/2014 06:15 08/25/2014 18:45 483,258 13.64 5,586 Storm 08/29/2014 03:30 08/29/2014 14:30 40,515 1.26 437 x Storm 08/29/2014 17:00 08/31/2014 00:45 642,081 14.46 4,355 Storm 08/31/2014 22:00 09/02/2014 00:45 225,531 5.40 1,776 x Storm 09/09/2014 21:15 09/10/2014 14:30 363,782 10.88 5,153 Storm 10/01/2014 09:35 10/01/2014 18:05 157,679 7.48 963 Storm 10/02/2014 12:45 10/03/2014 15:15 359,110 14.02 1,797 Storm 12/21/2014 20:50 12/21/2014 23:45 13,046 0.07 6
Snowmelt Subtotal 267,872 13 5,569 Storm Subtotal 19,959,085 593 296,464 Total 20,226,957 606 302,033
Month Base Loading Interval Monthly Base Volume (cf)
Interval TP (lb)
Interval TSS (lb) Start End
January 01/01/2014 00:00 01/31/2014 23:59 2,029,555 6.34 2,155 February 02/01/2014 00:00 02/28/2014 23:59 1,897,287 8.00 2,458 March 03/01/2014 00:00 03/31/2014 23:59 4,272,669 44.00 2,140 April 04/01/2014 00:00 04/30/2014 23:59 4,514,394 15.52 1,411 May 05/01/2014 00:00 05/31/2014 23:59 4,210,285 16.55 2,626 June 06/01/2014 00:00 06/30/2014 23:59 5,580,390 33.48 4,534 July 07/01/2014 00:00 07/31/2014 23:59 6,301,400 32.66 4,328 August 08/01/2014 00:00 08/31/2014 23:59 4,531,254 28.69 3,110
2014 CRWD Stormwater Monitoring Report 233

Trout Brook
September 09/01/2014 00:00 09/30/2014 23:59 3,511,271 17.45 1,756 October 10/01/2014 00:00 10/31/2014 23:59 3,228,863 13.70 1,410 November 11/01/2014 00:00 11/30/2014 23:59 1,906,198 7.84 535 December 12/01/2014 00:00 12/31/2014 23:59 2,325,843 11.35 1,019 Base Subtotal 44,309,409 236 27,481 TOTAL ANNUAL 64,536,366 842 329,514
2014 CRWD Stormwater Monitoring Report 234

Trout Brook
Table 12-7: 2014 Trout Brook Outlet subwatershed loading table.
Sampled Event Sample Event Loading Interval Event Volume (cf)
Interval TP (lb)
Interval TSS (lb) Start End
Snowmelt 03/09/2014 14:00 03/09/2014 17:45 59,651 8.83 1,998 x Snowmelt 03/10/2014 11:00 03/11/2014 01:15 970,651 169.79 119,447 Snowmelt 03/11/2014 12:15 03/11/2014 20:30 365,585 26.66 5,961 Snowmelt 03/12/2014 13:00 03/12/2014 18:30 59,054 11.03 2,501 x Snowmelt 03/13/2014 11:30 03/14/2014 03:45 1,081,792 69.40 39,730 Snowmelt 03/14/2014 11:00 03/14/2014 23:15 632,397 40.81 9,100 x Snowmelt 03/20/2014 12:45 03/20/2014 21:30 441,117 35.02 15,578 Snowmelt 03/21/2014 13:30 03/21/2014 18:15 69,981 10.63 2,405 x Storm 03/27/2014 09:45 03/28/2014 04:30 1,075,989 233.70 155,947 Storm 03/28/2014 13:00 03/28/2014 14:15 3,191 3.03 691 Storm 03/29/2014 13:30 03/29/2014 20:00 132,075 16.20 3,655 Storm 03/30/2014 12:00 03/31/2014 00:15 486,738 38.93 8,722 Storm 03/31/2014 05:45 03/31/2014 08:40 26,512 8.25 1,877 Storm 04/04/2014 14:00 04/04/2014 21:00 174,977 11.18 5,648 Storm 04/05/2014 12:30 04/06/2014 00:15 471,447 21.19 10,540 Storm 04/06/2014 12:00 04/06/2014 13:45 3,707 2.35 1,224 Storm 04/12/2014 08:00 04/12/2014 10:15 35,751 2.61 1,324 Storm 04/16/2014 18:30 04/18/2014 12:45 2,580,818 79.33 38,487 Storm 04/19/2014 22:15 04/20/2014 07:00 411,130 16.80 8,313 Storm 04/23/2014 15:30 04/23/2014 18:00 17,195 2.63 1,354 Storm 04/23/2014 20:00 04/23/2014 23:20 123,658 5.59 2,782 x Storm 04/24/2014 06:20 04/25/2014 05:35 1,928,797 46.62 15,882 Storm 04/26/2014 22:15 04/26/2014 23:25 7,215 1.55 804 x Storm 04/27/2014 04:00 05/01/2014 04:20 16,113,090 460.33 236,158 Storm 05/08/2014 16:00 05/09/2014 01:45 630,806 34.29 20,600 x Storm 05/11/2014 22:45 05/12/2014 23:45 1,485,766 76.75 38,612 x Storm 05/19/2014 11:00 05/22/2014 12:00 7,712,877 280.92 164,406 x Storm 05/27/2014 04:45 05/28/2014 04:00 2,737,395 148.11 116,136 x Storm 05/31/2014 15:15 06/04/2014 15:45 11,573,386 370.59 229,560 x Storm 06/07/2014 07:30 06/11/2014 03:30 4,094,409 146.86 67,076 Storm 06/11/2014 23:45 06/12/2014 05:15 242,553 16.40 9,644 Storm 06/14/2014 11:30 06/14/2014 18:30 249,472 20.84 12,387 x Storm 06/14/2014 20:00 06/18/2014 20:20 9,626,613 180.61 87,656 x Storm 06/19/2014 03:50 06/20/2014 04:55 5,660,205 213.01 129,949 Storm 06/22/2014 11:10 06/22/2014 15:05 276,063 18.41 10,819 x Storm 07/11/2014 08:15 07/14/2014 02:00 2,883,954 131.34 71,848 Storm 07/25/2014 05:45 07/25/2014 09:45 209,929 6.89 3,703 x Storm 08/10/2014 22:15 08/11/2014 23:00 1,031,394 240.41 207,071 x Storm 08/18/2014 00:15 08/18/2014 08:30 774,212 39.36 32,615 Storm 08/19/2014 18:15 08/19/2014 21:45 83,330 5.16 2,993 Storm 08/21/2014 06:15 08/21/2014 15:00 359,853 16.24 9,288 Storm 08/24/2014 18:45 08/24/2014 20:15 27,864 2.58 1,514 Storm 08/29/2014 03:45 08/29/2014 07:15 119,913 5.89 3,384 x Storm 08/29/2014 17:15 08/31/2014 04:00 1,956,219 52.20 20,694 x Storm 08/31/2014 22:15 09/01/2014 03:30 278,419 7.36 3,418 Storm 09/03/2014 10:00 09/03/2014 12:30 31,441 5.55 3,547 x Storm 09/09/2014 21:00 09/11/2014 07:00 1,644,092 78.20 70,193 Storm 09/20/2014 18:00 09/20/2014 20:45 86,857 6.20 3,882 Storm 09/29/2014 10:30 09/29/2014 12:45 36,220 4.05 2,566 x Storm 10/01/2014 08:45 10/01/2014 18:00 481,725 34.77 11,458
2014 CRWD Stormwater Monitoring Report 235

Trout Brook
Storm 10/02/2014 12:45 10/03/2014 04:45 778,169 30.94 11,699 Storm 10/04/2014 00:15 10/04/2014 05:30 96,431 7.55 2,961 Storm 12/21/2014 14:30 12/22/2014 02:15 314,723 0.98 177
Snowmelt Subtotal 3,680,228 372 196,718 Storm Subtotal 79,076,582 3,133 1,843,264 Total 82,756,810 3,505 2,039,982
Month Base Loading Interval Monthly Base Volume (cf)
Interval TP (lb)
Interval TSS (lb) Start End
January 01/01/2014 00:00 01/31/2014 23:59 41,921,628 124.31 24,861 February 02/01/2014 00:00 02/28/2014 23:59 38,424,448 129.53 27,585 March 03/01/2014 00:00 03/31/2014 23:59 50,024,195 254.18 39,225 April 04/01/2014 00:00 04/30/2014 23:59 66,362,255 196.70 30,023 May 05/01/2014 00:00 05/31/2014 23:59 66,955,111 222.42 33,101 June 06/01/2014 00:00 06/30/2014 23:59 74,421,379 320.54 39,569 July 07/01/2014 00:00 07/31/2014 23:59 43,935,197 154.53 25,287 August 08/01/2014 00:00 08/31/2014 23:59 38,278,443 125.06 20,344 September 09/01/2014 00:00 09/30/2014 23:59 43,152,094 129.14 17,488 October 10/01/2014 00:00 10/31/2014 23:59 38,755,822 142.74 15,725 November 11/01/2014 00:00 11/30/2014 23:59 36,381,838 130.98 28,918 December 12/01/2014 00:00 12/31/2014 23:59 39,857,954 128.52 22,460
Base Subtotal 578,470,364 2,059 324,586
TOTAL ANNUAL 661,227,173 5,564 2,364,568
2014 CRWD Stormwater Monitoring Report 236

Trout Brook
Table 12-8: 2014 Trout Brook - West Branch subwatershed laboratory data.
Sample Sampling Start Sampling End Ortho-P Cl Cd Cr Cu Pb Ni Zn NH3 TKN Total P NO3 NO2 TDS TSS VSS Hardness CBOD SO4 E. coli Dissolved PType Date/Time Date/Time mg/L mg/L mg/L mg/L mg/L mg/L mg/L mg/L mg/L mg/L mg/L mg/L mg/L mg/L mg/L mg/L mg/L mg/L mg/L mpn/100 mL mg/LBase Grab 01/22/2014 10:00 01/22/2014 10:00 0.010 84.0 0.00020 0.00051 0.00092 0.00022 0.00095 0.00340 0.290 0.8 0.04 0.56 0.03 369 3 1 240 1.0 33.1 1,300 0.020Base Grab 02/12/2014 12:15 02/12/2014 12:15 0.007 94.2 0.00020 0.00120 0.00260 0.00230 0.00150 0.01170 0.220 0.9 0.07 0.61 0.03 354 20 8 220 - - 980 0.020Base Grab 03/17/2014 09:35 03/17/2014 09:35 0.008 119.6 0.00040 0.00400 0.01020 0.00880 0.00340 0.04310 0.230 2.4 0.24 0.66 0.03 448 104 35 248 - - 816 0.020Base Grab 04/11/2014 08:50 04/11/2014 08:50 0.005 120.8 0.00020 0.00038 0.00350 0.00042 0.00110 0.01020 0.220 1.5 0.06 0.77 0.03 414 5 2 236 - - 118 0.020Base Grab 05/14/2014 10:40 05/14/2014 10:40 - - - - - - - - - - - - - - - - - - - 105 -Base Composite 05/14/2014 11:01 05/15/2014 09:46 0.005 110.4 0.00020 0.00067 0.00220 0.00170 0.00120 0.01100 0.100 1.4 0.08 0.47 0.03 386 25 12 196 - - - 0.029Base Grab 05/29/2014 10:30 05/29/2014 10:30 - - - - - - - - - - - - - - - - - - - 145 -Base Composite 05/29/2014 10:46 05/30/2014 09:00 0.007 101.7 0.00020 0.00027 0.00130 0.00050 0.00120 0.00400 0.040 0.9 0.09 0.60 0.03 403 6 4 232 - - - 0.020Base Grab 06/10/2014 10:15 06/10/2014 10:15 - - - - - - - - - - - - - - - - - - - 387 -Base Composite 06/10/2014 10:31 06/11/2014 10:01 0.011 104.1 0.00020 0.00025 0.00200 0.00042 0.00100 0.00330 0.020 0.9 0.09 0.40 0.03 359 10 5 180 - - - 0.020Base Grab 07/02/2014 10:12 07/02/2014 10:12 - - - - - - - - - - - - - - - - - - - 172 -Base Composite 07/02/2014 14:20 07/03/2014 10:00 0.019 100.3 0.00020 0.00028 0.00240 0.00031 0.00120 0.00750 0.080 0.8 0.09 0.56 0.03 351 4 2 172 - - - 0.038Base Grab 07/21/2014 10:30 07/21/2014 10:30 0.011 354.5 0.00020 0.00033 0.00080 0.00017 0.00350 0.01230 0.140 0.5 0.03 0.66 0.03 1,020 8 1 536 - - 108 0.020Base Grab 08/13/2014 11:00 08/13/2014 11:00 - - - - - - - - - - - - - - - - - - - 6,300 -Base Composite 08/13/2014 11:16 08/14/2014 10:31 0.008 87.4 0.00020 0.00050 0.00180 0.00055 0.00110 0.00600 0.050 0.6 0.03 0.67 0.03 358 4 2 212 1.3 30.3 - 0.020Base Grab 09/08/2014 10:45 09/08/2014 10:45 - - - - - - - - - - - - - - - - - - - 1 -Base Composite 09/08/2014 11:16 09/09/2014 10:31 0.012 83.6 0.00020 0.00044 0.00190 0.00110 0.00100 0.00800 0.050 0.8 0.09 0.55 0.03 326 13 7 216 - - - 0.020Base Grab 09/29/2014 09:40 09/29/2014 09:40 - - - - - - - - - - - - - - - - - - - 178 -Base Grab 10/09/2014 11:10 10/09/2014 11:10 - - - - - - - - - - - - - - - - - - - 17 -Base Composite 10/09/2014 11:31 10/09/2014 18:16 0.008 86.6 0.00020 0.00052 0.00200 0.00160 0.00110 0.00850 0.070 0.8 0.07 0.63 0.04 318 12 6 224 - - - 0.021Base Grab 11/20/2014 10:55 11/20/2014 10:55 0.007 87.1 0.00020 0.00056 0.00110 0.00083 0.00099 0.00360 0.200 0.8 0.04 0.60 0.03 359 12 5 252 1.2 32.8 1,046 0.020Base Grab 12/18/2014 10:30 12/18/2014 10:30 0.008 98.4 0.00020 0.00053 0.00110 0.00059 0.00110 0.00400 0.160 0.8 0.05 0.53 0.03 361 7 3 300 - - 326 0.020
Base Average 0.009 116.6 0.00021 0.00075 0.00242 0.00139 0.00145 0.00976 0.134 1.0 0.08 0.59 0.03 416 17 7 247 1.2 32.1 800 0.022
Snow melt Grab 02/18/2014 14:40 02/18/2014 14:40 0.012 599.4 0.00020 0.00750 0.01240 0.01080 0.00430 0.07590 0.380 1.7 0.16 0.65 0.05 1,200 86 32 220 - - 473 0.022Snow melt Grab 02/19/2014 14:50 02/19/2014 14:50 0.010 1,401.6 0.00046 0.02500 0.03740 0.02850 0.01140 0.18900 0.530 4.8 0.84 0.80 0.08 1,080 368 112 288 - - - 0.020Snow melt Grab 03/10/2014 14:15 03/10/2014 14:15 0.129 1,160.1 0.00042 0.02090 0.04490 0.02780 0.01260 0.23600 1.230 6.3 0.83 0.42 0.13 2,070 500 148 148 - - 2,420 0.153Snow melt Grab 03/13/2014 13:55 03/13/2014 13:55 0.176 656.8 0.00040 0.01000 0.02580 0.01900 0.00730 0.13000 0.720 5.8 0.71 0.42 0.09 1,180 220 76 164 - - 987 0.229Snow melt Grab 03/20/2014 14:35 03/20/2014 14:35 - 321.7 0.00040 0.01130 0.02730 0.02150 0.00810 0.13800 0.360 4.3 0.51 0.50 0.07 686 204 70 124 - - - 0.138Storm Grab 03/27/2014 14:25 03/27/2014 14:25 0.291 75.1 0.00028 0.01680 0.03950 0.02330 0.01160 0.20700 0.800 4.8 0.93 0.52 0.06 210 396 128 76 - - 464 0.506Storm Grab 04/24/2014 10:25 04/24/2014 10:25 0.073 29.4 0.00020 0.00450 0.01050 0.01230 0.00300 0.05320 0.500 1.5 0.19 0.37 0.03 119 108 36 48 - 7.8 2,000 0.076Storm Composite 04/27/2014 04:46 04/27/2014 12:48 0.044 36.2 0.00020 0.00450 0.01160 0.01440 0.00370 0.06010 0.320 2.0 0.26 0.33 0.03 145 161 48 100 - - - 0.033Storm Composite 04/28/2014 11:46 04/28/2014 17:46 0.026 49.5 0.00020 0.00220 0.00510 0.00520 0.00190 0.02600 0.110 1.1 0.12 0.51 0.03 173 38 9 88 - - - 0.020Storm Composite 05/08/2014 16:31 05/08/2014 17:46 0.020 26.0 0.00029 0.01050 0.02810 0.03010 0.00810 0.14700 0.730 4.0 0.61 0.55 0.04 112 578 172 68 - - - 0.044Storm Composite 05/11/2014 23:16 05/12/2014 04:01 0.039 28.6 0.00020 0.00290 0.01190 0.01280 0.00300 0.05450 0.070 1.8 0.32 0.07 0.03 115 346 40 60 - - - 0.088Storm Composite 05/12/2014 11:01 05/12/2014 18:01 0.005 105.4 0.00053 0.00780 0.03010 0.02660 0.00770 0.13000 0.060 3.0 0.41 0.41 0.03 354 664 278 168 - - - 0.050Storm Composite 05/19/2014 11:31 05/19/2014 16:04 0.044 18.7 0.00020 0.00470 0.01040 0.01210 0.00340 0.05060 0.180 2.0 0.37 0.22 0.03 163 130 35 60 - - - 0.081Storm Grab 05/19/2014 12:15 05/19/2014 12:15 - - - - - - - - - - - - - - - - - - - 4,100 -Storm Composite 05/27/2014 05:46 05/27/2014 09:05 0.043 22.1 0.00020 0.00330 0.00820 0.00980 0.00270 0.03620 0.170 1.5 0.29 0.22 0.03 110 105 32 56 - - - 0.043Storm Composite 05/31/2014 23:46 06/01/2014 02:53 0.040 15.6 0.00020 0.00480 0.01190 0.01530 0.00410 0.06290 0.060 1.7 0.32 0.05 0.03 91 - 212 52 - - - 0.049Storm Composite 06/07/2014 08:16 06/07/2014 12:17 - 25.9 0.00020 0.00270 0.00720 0.00620 0.00250 0.02880 0.130 1.5 0.27 0.26 0.03 121 90 32 68 - - - 0.052Storm Composite 06/14/2014 23:16 06/15/2014 04:31 0.029 19.6 0.00020 0.00130 0.00460 0.00490 0.00160 0.01830 0.060 0.9 0.13 0.19 0.03 109 26 10 50 - - - 0.028Storm Composite 06/18/2014 03:31 06/18/2014 05:17 0.037 14.9 0.00020 0.00400 0.01140 0.01360 0.00380 0.04950 0.080 1.8 0.34 0.23 0.03 84 602 94 52 - - - 0.052Storm Grab 06/19/2014 09:20 06/19/2014 09:20 - - - - - - - - - - - - - - - - - - - 8,500 -Storm Composite 06/28/2014 16:16 06/28/2014 18:42 0.083 12.8 0.00022 0.00620 0.02030 0.02570 0.00570 0.09880 0.160 2.4 0.45 0.13 0.06 90 611 139 52 - - - 0.101Storm Composite 07/07/2014 18:47 07/07/2014 21:31 0.067 21.9 0.00020 0.00320 0.00820 0.00620 0.00220 0.02730 0.090 1.3 0.25 0.36 0.03 112 67 16 64 - - - 0.083Storm Composite 07/11/2014 09:01 07/11/2014 11:16 0.056 17.0 0.00020 0.00290 0.00840 0.00630 0.00190 0.03430 0.080 1.0 0.18 0.24 0.04 93 64 24 108 - - - 0.060Storm Grab 07/11/2014 09:49 07/11/2014 09:49 - - - - - - - - - - - - - - - - - - - 8,500 -Storm Composite 07/12/2014 14:01 07/12/2014 16:46 0.047 27.4 0.00020 0.00310 0.00750 0.00670 0.00200 0.02690 0.170 1.1 0.18 0.36 0.04 129 53 17 100 - - - 0.048Storm Grab 07/25/2014 08:25 07/25/2014 08:25 - - - - - - - - - - - - - - - - - - - 4,100 -Storm Composite 08/18/2014 00:46 08/18/2014 02:46 0.045 13.6 0.00020 0.00370 0.01460 0.01510 0.00350 0.06210 0.070 1.4 0.31 0.33 0.03 78 408 97 64 - - - 0.069Storm Grab 08/21/2014 09:50 08/21/2014 09:50 - - - - - - - - - - - - - - - - - - - 8,500 -Storm Composite 08/29/2014 18:16 08/29/2014 19:01 - 7.1 0.00020 0.00460 0.01390 0.01340 0.00300 0.05440 0.050 1.3 0.29 0.37 0.04 68 99 29 36 - - - 0.064Storm Composite 08/30/2014 02:01 08/30/2014 03:46 - 16.9 0.00020 0.00290 0.00770 0.00580 0.00210 0.02300 0.030 1.0 0.22 0.16 0.03 80 147 36 64 - - - 0.070Storm Composite 09/29/2014 09:47 09/29/2014 17:16 0.016 57.3 0.00020 0.00350 0.01280 0.00620 0.00300 0.05210 0.020 2.1 0.41 0.47 0.03 252 81 33 156 - - - 0.103Storm Grab 10/01/2014 10:05 10/01/2014 10:05 - - - - - - - - - - - - - - - - - - - 32,800 -Storm Composite 10/01/2014 11:16 10/01/2014 13:17 0.087 13.9 0.00020 0.00320 0.00970 0.00600 0.00210 0.03830 0.020 1.1 0.27 0.16 0.03 63 48 21 68 8.1 5.2 - 0.115Storm Composite 10/02/2014 13:32 10/02/2014 16:17 0.056 17.3 0.00020 0.00350 0.00820 0.00580 0.00230 0.03620 0.060 1.2 0.23 0.33 0.03 100 47 24 88 - - - 0.061
Snow melt Average 0.082 827.9 0.00038 0.01494 0.02956 0.02152 0.00874 0.15378 0.644 4.6 0.61 0.56 0.08 1,243 276 88 189 - - 1,293 0.112Storm Average 0.057 29.2 0.00022 0.00464 0.01312 0.01234 0.00369 0.05989 0.175 1.8 0.32 0.30 0.03 129 221 68 76 8.1 6.5 8,621 0.082
Annual Average 0.042 153.4 0.00024 0.00457 0.01151 0.00978 0.00355 0.05436 0.217 1.9 0.27 0.43 0.04 357 158 50 147 2.9 21.8 3,263 0.066Annual Maximum 0.291 1,401.6 0.00053 0.02500 0.04490 0.03010 0.01260 0.23600 1.230 6.3 0.93 0.80 0.13 2,070 664 278 536 8.1 33.1 32,800 0.506Annual Minimum 0.005 7.1 0.00020 0.00025 0.00080 0.00017 0.00095 0.00330 0.020 0.5 0.03 0.05 0.03 63 3 1 36 1.0 5.2 1 0.020Annual Median 0.023 66.2 0.00020 0.00320 0.00830 0.00625 0.00260 0.03620 0.120 1.4 0.23 0.42 0.03 231 81 31 116 1.3 30.3 898 0.046
Actual number less than value (<)Actual number greater than value (>)Estimated concentration above the adjusted method detection limit and below the adjusted reporting limit.
- Not collected
2014 CRWD Stormwater Monitoring Report 237

Trout Brook
2014 CRWD Stormwater Monitoring Report 238

Trout Brook
Table 12-9: 2014 Trout Brook - East Branch subwatershed laboratory data.
Sample Sampling Start Sampling End Ortho-P Cl Cd Cr Cu Pb Ni Zn NH3 TKN Total P NO3 NO2 TDS TSS VSS Hardness CBOD SO4 E. coli Dissolved PType Date/Time Date/Time mg/L mg/L mg/L mg/L mg/L mg/L mg/L mg/L mg/L mg/L mg/L mg/L mg/L mg/L mg/L mg/L mg/L mg/L mg/L mpn/100 mL mg/LBase Grab 01/22/2014 09:45 01/22/2014 09:45 0.017 407.0 0.00020 0.00110 0.00200 0.00260 0.00260 0.01190 0.190 0.7 0.08 0.21 0.03 1,060 17 4 520 1.0 54.5 219 0.023Base Grab 02/12/2014 10:00 02/12/2014 10:00 0.011 317.8 0.00020 0.00260 0.00470 0.00800 0.00340 0.02140 0.190 1.3 0.13 0.28 0.03 904 50 11 500 - - 14 0.020Base Grab 03/17/2014 09:20 03/17/2014 09:20 0.008 472.4 0.00020 0.00069 0.00230 0.00200 0.00260 0.01800 0.300 1.6 0.08 0.38 0.03 1,180 11 3 480 - - 236 0.020Base Grab 04/11/2014 08:40 04/11/2014 08:40 0.005 600.6 0.00020 0.00029 0.00100 0.00062 0.00200 0.00780 0.240 1.5 0.05 0.52 0.03 1,110 5 3 500 - - 1 0.020Base Grab 05/14/2014 10:30 05/14/2014 10:30 - - - - - - - - - - - - - - - - - - - 13 -Base Composite 05/14/2014 10:46 05/15/2014 09:15 0.007 344.3 0.00020 0.00028 0.00120 0.00170 0.00240 0.01110 0.150 1.6 0.02 0.66 0.03 988 4 2 524 - - - 0.027Base Grab 05/29/2014 10:25 05/29/2014 10:25 - - - - - - - - - - - - - - - - - - - 131 -Base Composite 05/29/2014 10:31 05/30/2014 05:15 0.032 232.5 0.00020 0.00032 0.00380 0.00056 0.00340 0.00680 0.080 1.0 0.18 0.19 0.03 686 6 3 344 - - - 0.036Base Grab 06/10/2014 10:00 06/10/2014 10:00 - - - - - - - - - - - - - - - - - - - 179 -Base Composite 06/10/2014 10:16 06/11/2014 07:30 0.013 353.1 0.00020 0.00066 0.00160 0.00130 0.00270 0.00630 0.040 0.7 0.10 0.46 0.03 971 11 3 484 - - - 0.020Base Grab 07/02/2014 10:00 07/02/2014 10:00 - - - - - - - - - - - - - - - - - - - 23,800 -Base Composite 07/02/2014 10:16 07/03/2014 10:00 0.010 368.1 0.00020 0.00310 0.00640 0.00390 0.01360 0.02190 0.210 1.4 0.17 0.88 0.03 1,040 102 7 532 - - - 0.028Base Grab 07/21/2014 10:20 07/21/2014 10:20 0.013 98.2 0.00020 0.00022 0.00084 0.00010 0.00090 0.00160 0.140 0.6 0.04 0.84 0.04 421 3 2 240 - - 46 0.021Base Grab 08/13/2014 10:45 08/13/2014 10:45 - - - - - - - - - - - - - - - - - - - 10 -Base Composite 08/13/2014 11:01 08/14/2014 10:15 0.022 293.8 0.00020 0.00080 0.00260 0.00110 0.00320 0.01420 0.090 0.7 0.04 0.44 0.06 846 11 2 436 1.0 54.2 - 0.069Base Grab 09/08/2014 10:35 09/08/2014 10:35 - - - - - - - - - - - - - - - - - - - 387 -Base Composite 09/08/2014 11:00 09/09/2014 10:00 0.027 216.6 0.00020 0.00700 0.00910 0.01140 0.00670 0.03500 0.160 1.4 0.22 0.33 0.05 717 102 16 420 - - - 0.027Base Grab 09/29/2014 09:30 09/29/2014 09:30 - - - - - - - - - - - - - - - - - - - 1 -Base Grab 10/09/2014 11:00 10/09/2014 11:00 - - - - - - - - - - - - - - - - - - - 23 -Base Composite 10/10/2014 10:40 10/10/2014 10:40 0.026 353.5 0.00020 0.00180 0.00210 0.00260 0.00410 0.00770 0.110 1.0 0.05 0.31 0.03 976 27 4 528 - - - 0.042Base Grab 11/20/2014 11:15 11/20/2014 11:15 0.029 316.0 0.00020 0.00078 0.00120 0.00180 0.00300 0.00720 0.050 0.6 0.10 0.27 0.03 881 5 2 532 7.8 52.6 326 0.043Base Grab 12/18/2014 10:10 12/18/2014 10:10 0.017 303.8 0.00020 0.00230 0.00390 0.00620 0.00380 0.01650 0.070 0.8 0.11 0.20 0.03 876 40 9 468 - - 272 0.020
Base Average 0.017 334.1 0.00020 0.00157 0.00305 0.00313 0.00389 0.01339 0.144 1.1 0.10 0.43 0.03 904 28 5 465 3.3 53.8 133 0.030
Snow melt Grab 02/18/2014 14:30 02/18/2014 14:30 0.018 2,025.9 0.00085 0.05390 0.06590 0.03480 0.01700 0.36600 0.780 4.1 1.37 0.40 0.07 3,630 380 128 508 - - 2,010 0.024Snow melt Grab 02/19/2014 14:40 02/19/2014 14:40 0.030 1,887.3 0.00035 0.02030 0.03760 0.02210 0.01140 0.22200 0.700 4.8 0.53 0.30 0.08 3,330 252 112 460 - - - 0.043Snow melt Grab 03/10/2014 14:20 03/10/2014 14:20 0.129 1,217.1 0.00026 0.01580 0.03220 0.01970 0.00930 0.18300 1.040 6.7 0.54 0.26 0.12 2,150 404 144 260 - - 1,050 0.149Snow melt Grab 03/13/2014 13:45 03/13/2014 13:45 0.133 669.7 0.00040 0.01410 0.02990 0.01770 0.01040 0.14300 0.580 3.6 0.55 0.27 0.07 1,340 270 82 268 - - 450 0.161Snow melt Grab 03/20/2014 14:45 03/20/2014 14:45 - 650.1 0.00040 0.00780 0.01840 0.00870 0.00610 0.09810 0.460 3.5 0.33 0.23 0.06 1,270 108 46 260 - - - 0.099Storm Grab 03/27/2014 14:15 03/27/2014 14:15 0.270 245.8 0.00026 0.01710 0.03730 0.02310 0.01120 0.20000 0.930 4.8 0.90 0.45 0.07 598 232 92 216 - - 3,260 0.308Storm Grab 04/24/2014 10:20 04/24/2014 10:20 - - - - - - - - - - - - - - - - - - - 1,553 -Storm Composite 04/28/2014 11:31 04/29/2014 07:30 0.046 47.2 0.00020 0.00600 0.01030 0.00740 0.00460 0.04290 0.140 1.1 0.18 0.69 0.03 203 71 12 84 - - - 0.087Storm Composite 05/08/2014 17:01 05/08/2014 18:15 0.029 153.5 - - - - - - 0.520 2.5 0.30 0.72 0.06 464 331 20 - - - - 0.049Storm Composite 05/11/2014 23:46 05/12/2014 10:52 0.042 93.7 0.00020 0.00460 0.01220 0.00770 0.00440 0.05160 0.060 1.4 0.29 0.16 0.03 313 102 20 148 - - - 0.088Storm Grab 05/19/2014 12:10 05/19/2014 12:10 - - - - - - - - - - - - - - - - - - - 921 -Storm Composite 05/19/2014 12:15 05/20/2014 10:15 0.053 82.0 0.00020 0.00630 0.01080 0.00780 0.00410 0.04360 0.090 1.5 0.27 0.26 0.04 262 66 15 116 - - - 0.079Storm Composite 05/27/2014 05:46 05/27/2014 10:30 0.042 46.6 0.00020 0.01410 0.01950 0.01510 0.00960 0.06310 0.070 1.9 0.53 0.05 0.03 200 320 40 72 - - - 0.113Storm Composite 05/31/2014 22:16 06/01/2014 09:46 0.071 33.8 0.00021 0.01190 0.02210 0.02720 0.01080 0.07350 0.080 1.6 0.46 0.22 0.05 168 258 39 84 - - - 0.082Storm Composite 06/07/2014 08:31 06/07/2014 10:30 - 95.5 0.00020 0.00690 0.01420 0.01450 0.00690 0.05070 0.140 1.6 0.39 0.25 0.06 323 238 42 152 - - - 0.061Storm Composite 06/14/2014 21:16 06/15/2014 22:30 0.051 52.0 0.00020 0.00820 0.01480 0.01570 0.00710 0.04220 0.020 1.1 0.30 0.11 0.03 207 140 24 74 - - - 0.055Storm Composite 06/16/2014 18:31 06/17/2014 06:45 0.071 82.8 0.00020 0.00430 0.00640 0.00410 0.00250 0.02080 0.030 1.2 0.27 0.05 0.03 268 35 10 128 - - - 0.073Storm Composite 06/19/2014 04:31 06/19/2014 09:30 0.056 20.3 0.00031 0.01960 0.03350 0.03930 0.01700 0.09090 0.070 1.9 0.61 0.20 0.04 157 374 50 62 - - - 0.072Storm Grab 06/19/2014 09:25 06/19/2014 09:25 - - - - - - - - - - - - - - - - - - - 1,220 -Storm Composite 06/28/2014 16:16 06/29/2014 05:00 0.095 39.4 0.00031 0.02010 0.03270 0.04180 0.01610 0.09680 0.250 3.0 0.67 0.26 0.07 187 368 44 48 - - - 0.100Storm Composite 07/07/2014 15:46 07/08/2014 08:30 0.061 99.6 0.00020 0.01080 0.01670 0.01550 0.00800 0.05060 0.080 1.8 0.46 0.48 0.05 322 170 26 168 - - - 0.062Storm Grab 07/11/2014 09:35 07/11/2014 09:35 - - - - - - - - - - - - - - - - - - - 14,500 -Storm Composite 07/11/2014 08:15 07/11/2014 23:00 0.068 90.5 0.00020 0.00350 0.01210 0.00440 0.00310 0.02020 0.100 0.9 0.20 0.28 0.05 292 41 10 156 - - - 0.072Storm Composite 07/12/2014 14:30 07/13/2014 07:00 0.056 98.2 0.00020 0.01120 0.01980 0.02100 0.00950 0.04830 0.140 1.3 0.33 0.31 0.05 356 134 17 160 - - - 0.063Storm Grab 07/25/2014 08:20 07/25/2014 08:20 - - - - - - - - - - - - - - - - - - - 26,200 -Storm Composite 07/25/2014 06:00 07/25/2014 10:45 - 287.5 0.00020 0.00450 0.00990 0.00780 0.00710 0.03420 0.020 1.4 0.35 0.60 0.07 787 346 22 368 - - - 0.020Storm Composite 08/10/2014 22:30 08/11/2014 10:15 0.073 154.5 0.00020 0.00980 0.01890 0.02120 0.01150 0.04930 0.160 0.9 0.23 0.59 0.08 495 245 37 208 - - - 0.057Storm Composite 08/18/2014 00:46 08/18/2014 09:15 0.092 62.7 0.00020 0.00950 0.01740 0.02570 0.00940 0.04570 0.030 1.4 0.45 0.46 0.05 244 220 36 116 - - - 0.097Storm Grab 08/21/2014 09:45 08/21/2014 09:45 - - - - - - - - - - - - - - - - - - - 11,000 -Storm Composite 08/21/2014 07:01 08/21/2014 11:30 0.082 76.0 0.00020 0.00580 0.00980 0.00560 0.00450 0.02760 0.020 1.1 0.29 0.36 0.03 273 105 27 146 - - - 0.218Storm Composite 08/29/2014 17:46 08/30/2014 01:00 - 40.2 0.00020 0.00620 0.01170 0.00820 0.00480 0.03560 0.060 1.1 0.33 0.34 0.06 174 74 18 84 - - - 0.126Storm Composite 08/30/2014 01:30 08/30/2014 08:30 - 22.3 0.00020 0.00910 0.02020 0.01000 0.00760 0.04010 0.020 0.8 0.30 0.18 0.03 146 109 21 36 - - - 0.093Storm Composite 09/09/2014 21:46 09/10/2014 09:45 0.101 37.9 0.00020 0.00910 0.01450 0.01410 0.00700 0.04620 0.030 1.5 0.39 0.45 0.04 169 178 24 116 - 7.6 - 0.087Storm Composite 09/29/2014 09:46 09/30/2014 02:45 0.071 210.7 0.00020 0.00170 0.00410 0.00190 0.00270 0.01430 0.150 1.3 0.20 0.26 0.03 655 17 7 364 - - - 0.079Storm Grab 10/01/2014 10:00 10/01/2014 10:00 - - - - - - - - - - - - - - - - - - - 32,700 -
Snow melt Average 0.078 1,290.0 0.00045 0.02238 0.03680 0.02060 0.01084 0.20242 0.712 4.5 0.66 0.29 0.08 2,344 283 102 351 - - 1,170 0.095Storm Average 0.075 94.5 0.00021 0.00910 0.01677 0.01541 0.00770 0.05401 0.140 1.6 0.38 0.34 0.05 316 181 28 141 - 7.6 11,419 0.093
Annual Average 0.053 316.7 0.00024 0.00815 0.01453 0.01185 0.00678 0.05824 0.209 1.8 0.32 0.36 0.05 753 142 29 277 3.3 42.2 4,635 0.072Annual Maximum 0.270 2,025.9 0.00085 0.05390 0.06590 0.04180 0.01700 0.36600 1.040 6.7 1.37 0.88 0.12 3,630 404 144 532 7.8 54.5 32,700 0.308Annual Minimum 0.005 20.3 0.00020 0.00022 0.00084 0.00010 0.00090 0.00160 0.020 0.6 0.02 0.05 0.03 146 3 2 36 1.0 7.6 1 0.020Annual Median 0.042 182.6 0.00020 0.00620 0.01170 0.00800 0.00610 0.04010 0.125 1.4 0.29 0.31 0.04 547 104 19 240 1.0 53.4 357 0.063
Actual number less than value (<)Actual number greater than value (>)Estimated concentration above the adjusted method detection limit and below the adjusted reporting limit.
- Not collected
2014 CRWD Stormwater Monitoring Report 239

Trout Brook
2014 CRWD Stormwater Monitoring Report 240

Trout Brook
Table 12-10: 2014 Trout Brook Outlet subwatershed laboratory data.
Sample Sampling Start Sampling End Ortho-P Cl Cd Cr Cu Pb Ni Zn NH3 TKN Total P NO3 NO2 TDS TSS VSS Hardness CBOD SO4 E. coli Dissolved PType Date/Time Date/Time mg/L mg/L mg/L mg/L mg/L mg/L mg/L mg/L mg/L mg/L mg/L mg/L mg/L mg/L mg/L mg/L mg/L mg/L mg/L mpn/100 mL mg/LBase Grab 01/22/2014 11:15 01/22/2014 11:15 0.010 159.0 0.00020 0.00091 0.00160 0.00120 0.00140 0.00660 0.200 1.4 0.07 0.84 0.03 629 18 3 396 1.0 68.4 488 0.020Base Grab 02/12/2014 11:10 02/12/2014 11:10 0.007 188.3 0.00020 0.00094 0.00170 0.00130 0.00150 0.00970 0.240 0.9 0.05 0.79 0.03 656 12 4 380 - - 727 0.020Base Grab 03/17/2014 10:05 03/17/2014 10:05 0.006 182.9 0.00040 0.00200 0.00480 0.00430 0.00230 0.02280 0.270 1.9 0.13 0.85 0.03 686 47 17 352 - - 345 0.020Base Grab 04/11/2014 09:20 04/11/2014 09:20 0.005 180.4 0.00020 0.00046 0.00110 0.00055 0.00120 0.01080 0.210 1.6 0.05 0.96 0.03 616 8 3 368 - - 81 0.020Base Grab 05/14/2014 11:00 05/14/2014 11:00 - - - - - - - - - - - - - - - - - - - 79 -Base Composite 05/14/2014 11:17 05/15/2014 09:16 0.005 156.2 0.00020 0.00065 0.00230 0.00150 0.00150 0.01160 0.130 1.4 0.09 0.72 0.03 552 22 10 276 - - - 0.027Base Grab 05/29/2014 10:55 05/29/2014 10:55 - - - - - - - - - - - - - - - - - - - 178 -Base Composite 05/29/2014 11:01 05/30/2014 09:46 0.011 155.9 0.00020 0.00026 0.00120 0.00045 0.00100 0.00540 0.120 1.0 0.10 0.84 0.03 588 6 4 312 - - - 0.020Base Grab 06/10/2014 10:30 06/10/2014 10:30 - - - - - - - - - - - - - - - - - - - 105 -Base Composite 06/10/2014 10:47 06/11/2014 09:16 0.020 142.1 0.00020 0.00044 0.00230 0.00160 0.00140 0.00790 0.080 1.0 0.09 0.65 0.03 530 10 4 288 - - - 0.020Base Grab 07/02/2014 10:35 07/02/2014 10:35 - - - - - - - - - - - - - - - - - - - 1,733 -Base Composite 07/02/2014 10:47 07/03/2014 09:31 0.014 147.8 0.00020 0.00064 0.00350 0.00130 0.00180 0.01450 0.110 0.9 0.10 0.78 0.03 532 12 3 300 - - - 0.031Base Grab 07/21/2014 10:55 07/21/2014 10:55 0.010 184.8 0.00020 0.00077 0.00170 0.00070 0.00180 0.01270 0.160 0.6 0.05 0.98 0.05 687 15 3 432 - - 114 0.020Base Grab 08/13/2014 11:20 08/13/2014 11:20 - - - - - - - - - - - - - - - - - - - 1,414 -Base Composite 08/13/2014 11:32 08/14/2014 09:46 0.009 158.5 0.00020 0.00050 0.00270 0.00096 0.00160 0.00810 0.080 0.7 0.03 1.01 0.04 614 10 3 344 1.0 67.2 - 0.020Base Grab 09/08/2014 11:20 09/08/2014 11:20 - - - - - - - - - - - - - - - - - - - 166 -Base Grab 09/09/2014 10:10 09/09/2014 10:10 0.010 160.9 0.00020 0.00045 0.00092 0.00066 0.00110 0.00330 0.130 0.1 0.03 0.89 0.04 606 9 2 372 - - - 0.020Base Grab 10/09/2014 11:30 10/09/2014 11:30 - - - - - - - - - - - - - - - - - - - 81 -Base Composite 10/09/2014 11:47 10/10/2014 08:31 0.009 158.1 0.00020 0.00064 0.00180 0.00100 0.00160 0.00780 0.090 0.9 0.06 0.88 0.04 594 9 4 392 - - - 0.020Base Grab 11/20/2014 12:10 11/20/2014 12:10 0.007 177.8 0.00020 0.00160 0.00270 0.00300 0.00210 0.01220 0.170 0.9 0.08 0.74 0.03 625 45 8 396 1.1 69.8 727 0.020Base Grab 12/18/2014 11:20 12/18/2014 11:20 0.006 157.5 0.00020 0.00064 0.00140 0.00075 0.00160 0.00580 0.170 0.8 0.04 0.62 0.03 626 7 3 384 - - 179 0.020
Base Average 0.009 165.0 0.00021 0.00078 0.00212 0.00138 0.00156 0.00994 0.154 1.0 0.07 0.83 0.03 610 16 5 357 1.0 68.5 458 0.021
Snow melt Grab 02/18/2014 14:00 02/18/2014 14:00 0.009 628.1 0.00020 0.00540 0.01000 0.01020 0.00390 0.04820 0.330 2.2 0.22 0.85 0.03 1,240 88 28 368 - - 246 0.022Snow melt Grab 02/19/2014 14:15 02/19/2014 14:15 0.008 689.0 0.00025 0.01330 0.02130 0.01710 0.00710 0.11400 0.350 3.3 0.38 0.79 0.04 1,380 196 60 356 - - - 0.020Snow melt Grab 03/10/2014 13:54 03/10/2014 13:54 0.062 1,400.6 0.00072 0.02760 0.05690 0.04460 0.01630 0.31500 1.150 9.6 1.28 0.56 0.13 2,460 876 220 244 - - 2,420 0.129Snow melt Grab 03/13/2014 14:20 03/13/2014 14:20 0.149 615.9 0.00040 0.01160 0.02880 0.02360 0.00820 0.13000 0.710 4.2 0.54 0.51 0.09 1,220 292 82 228 - - 1,450 0.164Snow melt Grab 03/20/2014 15:05 03/20/2014 15:05 - 365.1 0.00040 0.01240 0.02830 0.02290 0.00870 0.15200 0.450 4.7 0.54 0.53 0.07 782 226 72 168 - - - 0.107Storm Grab 03/27/2014 14:25 03/27/2014 14:25 0.255 54.2 0.00060 0.02850 0.06860 0.02130 0.01970 0.19500 0.930 6.4 1.41 0.59 0.07 338 916 272 108 - - 4,350 0.293Storm Composite 04/24/2014 07:32 04/24/2014 13:16 0.030 79.0 0.00020 0.00470 0.00980 0.00880 0.00310 0.04650 0.350 1.5 0.19 0.50 0.03 280 59 22 120 - - - 0.033Storm Grab 04/24/2014 10:45 04/24/2014 10:45 - - - - - - - - - - - - - - - - - - - 1,120 -Storm Composite 04/27/2014 05:16 04/27/2014 15:18 0.034 47.5 0.00024 0.01030 0.02050 0.02820 0.00770 0.09060 0.220 2.0 0.42 0.32 0.03 216 237 59 88 - - - 0.046Storm Composite 04/28/2014 11:02 04/29/2014 07:46 0.023 71.4 0.00020 0.00300 0.00700 0.00730 0.00260 0.02740 0.110 1.3 0.17 0.62 0.03 254 51 12 112 - - - 0.025Storm Composite 05/11/2014 23:32 05/12/2014 10:46 0.024 77.2 0.00020 0.00510 0.01520 0.01390 0.00480 0.06380 0.090 2.0 0.33 0.34 0.03 258 155 60 128 - - - 0.040Storm Composite 05/19/2014 11:47 05/19/2014 21:46 0.043 39.7 0.00020 0.00800 0.01500 0.02010 0.00630 0.05840 0.140 1.9 0.37 0.22 0.03 175 208 42 88 - - - 0.085Storm Grab 05/19/2014 12:25 05/19/2014 12:25 - - - - - - - - - - - - - - - - - - - 6,300 -Storm Composite 05/27/2014 05:16 05/27/2014 10:01 0.034 36.5 0.00020 0.01060 0.01950 0.02890 0.00850 0.07190 0.150 2.4 0.50 0.15 0.03 175 378 67 76 - - - 0.050Storm Composite 05/31/2014 21:46 06/01/2014 07:04 0.045 33.0 0.00020 0.00660 0.01430 0.02190 0.00610 0.05430 0.070 1.5 0.34 0.27 0.04 154 202 42 80 - - - 0.043Storm Composite 06/07/2014 08:32 06/08/2014 01:01 - 78.0 0.00020 0.00330 0.00760 0.00730 0.00330 0.02500 0.070 1.2 0.24 0.36 0.03 279 94 30 148 - - - 0.070Storm Composite 06/14/2014 20:47 06/15/2014 07:01 0.032 33.5 0.00020 0.00520 0.01060 0.01260 0.00430 0.03800 0.050 1.1 0.23 0.26 0.03 159 132 49 74 - - - 0.028Storm Composite 06/16/2014 22:17 06/17/2014 10:01 0.033 97.5 0.00020 0.00099 0.00290 0.00150 0.00140 0.00920 0.050 0.9 0.13 0.41 0.03 358 16 5 180 - - - 0.034Storm Composite 06/19/2014 04:32 06/19/2014 10:46 0.043 16.9 0.00020 0.00940 0.01730 0.02550 0.00830 0.05610 0.040 1.4 0.37 0.10 0.03 114 204 34 58 - - - 0.053Storm Grab 06/19/2014 09:45 06/19/2014 09:45 - - - - - - - - - - - - - - - - - - - 8,500 -Storm Grab 07/11/2014 09:50 07/11/2014 09:50 - - - - - - - - - - - - - - - - - - - 14,600 -Storm Composite 07/11/2014 08:47 07/11/2014 12:47 0.045 39.3 0.00020 0.00590 0.01260 0.01220 0.00460 0.04140 0.070 1.1 0.26 0.31 0.05 171 133 30 116 - - - 0.050Storm Composite 07/12/2014 14:16 07/12/2014 17:16 0.044 38.7 0.00020 0.00890 0.01590 0.01860 0.00660 0.05120 0.130 1.3 0.32 0.39 0.05 173 153 31 180 - - - 0.042Storm Grab 07/25/2014 08:40 07/25/2014 08:40 - - - - - - - - - - - - - - - - - - - 12,200 -Storm Composite 08/10/2014 23:02 08/11/2014 03:31 0.013 37.0 0.00027 0.00820 0.02780 0.02760 0.00840 0.12800 0.100 3.4 1.74 0.70 0.09 181 1,480 140 112 - - - 0.051Storm Composite 08/18/2014 00:47 08/18/2014 05:31 0.048 37.0 0.00023 0.00850 0.02440 0.02840 0.00820 0.09630 0.050 2.1 0.49 0.46 0.05 181 392 73 112 - - - 0.084Storm Grab 08/21/2014 09:25 08/21/2014 09:25 - - - - - - - - - - - - - - - - - - - 8,500 -Storm Composite 08/30/2014 01:46 08/30/2014 07:31 - 39.1 0.00020 0.00430 0.00960 0.00990 0.00370 0.03270 0.020 1.1 0.22 0.27 0.03 180 81 20 104 - - - 0.059Storm Composite 08/31/2014 23:01 09/01/2014 04:16 - 50.1 0.00020 0.00210 0.00620 0.00370 0.00210 0.02160 0.020 0.9 0.19 0.30 0.03 211 74 19 132 - - - 0.051Storm Composite 09/09/2014 21:47 09/10/2014 03:46 0.071 37.3 0.00020 0.00670 0.01600 0.02110 0.00540 0.07290 0.030 1.8 0.37 0.26 0.05 168 311 50 96 6.5 11.8 - 0.075Storm Grab 10/01/2014 09:40 10/01/2014 09:40 - - - - - - - - - - - - - - - - - - - 33,200 -Storm Composite 10/01/2014 11:32 10/01/2014 13:46 0.079 29.6 0.00021 0.00960 0.01780 0.02280 0.00700 0.06900 0.020 1.7 0.48 0.17 0.04 134 150 38 80 - - - 0.158
Snow melt Average 0.057 739.7 0.00039 0.01406 0.02906 0.02368 0.00884 0.15184 0.598 4.8 0.59 0.65 0.07 1,416 336 92 273 - - 1,372 0.088Storm Average 0.053 48.6 0.00023 0.00749 0.01693 0.01708 0.00611 0.06247 0.136 1.9 0.44 0.35 0.04 208 271 55 110 6.5 11.8 11,096 0.069
Annual Average 0.036 179.0 0.00024 0.00593 0.01317 0.01229 0.00483 0.05507 0.202 1.9 0.33 0.56 0.04 507 188 42 219 2.4 54.3 3,972 0.054Annual Maximum 0.255 1,400.6 0.00072 0.02850 0.06860 0.04460 0.01970 0.31500 1.150 9.6 1.74 1.01 0.13 2,460 1,480 272 432 6.5 69.8 33,200 0.293Annual Minimum 0.005 16.9 0.00020 0.00026 0.00092 0.00045 0.00100 0.00330 0.020 0.1 0.03 0.10 0.03 114 6 2 58 1.0 11.8 79 0.020Annual Median 0.023 97.5 0.00020 0.00470 0.00980 0.00990 0.00370 0.03800 0.130 1.4 0.22 0.56 0.03 358 88 28 180 1.1 67.8 727 0.034
Actual number less than value (<)Actual number greater than value (>)Estimated concentration above the adjusted method detection limit and below the adjusted reporting limit.
- Not collected
2014 CRWD Stormwater Monitoring Report 241

Trout Brook
2014 CRWD Stormwater Monitoring Report 242

2014 CRWD Stormwater Monitoring Report 243
13 CONCLUSIONS & RECOMMENDATIONS
13.1 CONCLUSIONS
The 2014 stormwater monitoring data collected from twelve monitoring stations in Capitol
Region Watershed District was analyzed for total discharge, pollutant loads, metals toxicity, and
bacteria. The data reported herein represents annual water quality results from seven of the
sixteen major subwatersheds in CRWD.
This 2014 Stormwater Monitoring Report was the first time CRWD reported on the Como 3 and
Hidden Falls subwatersheds. Flow and water quality data has been collected seasonally at the
Como 3 station since 2012. The Hidden Falls monitoring station was established in May 2014, so
2014 was the first season of data collection at this location.
The 2014 monitoring season was the fifth year since 2010 that six CRWD monitoring stations
(East Kittsondale, Phalen Creek, St. Anthony Park, Trout Brook-East Branch, Trout Brook-West
Branch, and Trout Brook Outlet) continuously collected data year-round from January through
December. Therefore, the total recorded annual discharge and pollutant loads for these sites
were higher from 2010-2014 than the annual data recorded from 2005-2009.
CLIMATE
Climatologically, 2014 was unique with a cold winter and deep snowpack, followed by a wet and
cool spring, and then an unseasonably dry summer and fall. June 2014 was the wettest June in
Minnesota history. Large precipitation events were frequent in mid-May to late-June 2014 and
generated the majority of stormflow at all CRWD monitoring sites. Large storm events
contributed a significant portion of the annual yield of TSS and TP. Additionally, the melting of
a deep winter snowpack in March and April of 2014 significantly contributed to total annual
discharge as well as high pollutant loading. A drier than average July through November resulted
in reduced pollutant loading during this period.
DISCHARGE
For discharge, the Trout Brook subwatershed exported the greatest amount of water
(666,381,676 cf) in 2014 because it has the largest drainage area in CRWD (5,028 acres). The
2014 water yields for all monitored subwatersheds were greater than the historical averages of
previous monitoring years (2005-2013), largely due to an above average annual precipitation
year. Phalen Creek recorded the highest annual water yield (145,979 cf/ac) in comparison to all
other continuously monitored stations in 2014.
In 2014, snowmelt made up a larger portion of discharge, TSS load, and TP load at all stations
monitored year-round (East Kittsondale, Phalen Creek, St. Anthony Park, Trout Brook-East

2014 CRWD Stormwater Monitoring Report 244
Branch, Trout Brook-West Branch, and Trout Brook Outlet). An above average snowpack depth
during the 2013-2014 winter contributed to this observation (76.2 inches; 21.8 inches above
normal). Also, colder than normal winter temperatures that extended through late March 2014
resulted in a gradual late-season melt of the snowpack. In 2014, a greater effort was made to
sample snowmelt events and to standardize how snowmelt discharge volumes are quantified.
POLLUTANT LOADS
In 2014, all monitored subwatersheds exceeded their historical average (2010-2013) TSS yield
(lbs/acre), except for Trout Brook-West Branch and Villa Park. At most stations, TSS yields
were likely greater than historical averages in 2014 because of the above average precipitation
that occurred; TSS loading is primarily driven by stormwater runoff. East Kittsondale produced
the highest total annual TSS yields on a per acre basis in 2014 (711 lbs/ac). Trout Brook Outlet
had the largest total annual TSS load (2,364,568 lbs) in 2014, of which 78% of the total load was
transported by stormflow.
The 2014 total annual TP yields (lbs/acre) generally increased at all sites in comparison to
historical averages (2010-2013). East Kittsondale produced the highest total annual TP yield
(1.37 lb/ac). Como 3 (0.14 lbs/ac) and Sarita (0.16 lbs/ac) had the lowest annual TP yields of all
subwatershed in 2014. Overall, in 2014 Trout Brook Outlet produced the largest total annual TP
load (5,564 lbs). TP loading in 2014 primarily occurred during storm events at all continuously
monitored stations, even though baseflow accounted for the majority of the total discharge.
METALS
For metals, the 2014 average stormflow toxicity of lead exceeded the Minnesota Pollution
Control Agency (MPCA) toxicity standards at all stations, except Villa Park. Yearly copper
toxicity was also exceeded from most monitored subwatersheds in 2014, except St. Anthony
Park, Trout Brook (East Branch, West Branch, and Outlet) and Villa Park. Average stormflow
toxicity of zinc exceeded the MPCA toxicity standard at Hidden Falls, Como 3, and Como 7. For
all sites, average concentrations of cadmium, chromium, and nickel for all flow types (base,
snowmelt, storm, and yearly) did not exceed the MPCA toxicity standards in 2014 (except yearly
cadmium at Hidden Falls).
BACTERIA
During stormflow events, the majority (80%) of E. coli samples for all stations exceeded the
MPCA maximum numeric standard (1,260 cfu/100 mL) in 2014. The highest bacteria count
observed was at Hidden Falls in October 2014 with 71,700 cfu/100 mL. Baseflow bacteria
samples typically did not exceed the standard in 2014, with the exception of a few isolated
occurrences.
WATER QUALITY STANDARDS & COMPARISONS
In 2014, stormwater discharging from CRWD was measured to be more polluted than the
Mississippi River at Lambert’s Landing. High stormwater pollutant levels contribute to the
various water quality impairments found in CRWD lakes and the Mississippi River.

2014 CRWD Stormwater Monitoring Report 245
The 2014 median stormwater concentrations for nutrients, solids, metals, and bacteria were
compared to other urbanized areas in the United States using data reported in the National
Stormwater Quality Database (NSQD). When comparing to NSQD’s mixed residential land use
category, most CRWD monitored subwatersheds exceeded median stormwater concentrations for
TSS and E. coli.
STORMWATER PONDS
CRWD stormwater ponds were able to provide adequate water storage while maintaining surface
levels commensurate with previous monitoring years. Stormwater ponds experienced slight
increases in water levels during large storm events; however, excess water generally drained
within 72 hours.
13.2 ACCOMPLISHMENTS & RECOMMENDATIONS
It is the goal of CRWD to continually improve the monitoring program with new ideas in order
to advance the program in quality, efficiency, and data application. The monitoring program
aims to collect and analyze high quality data from multiple locations to better understand the
water quality in individual subwatersheds as well as the watershed as a whole. Data collection
and analysis through the monitoring program helps to further CRWD’s mission “to protect,
manage and improve the water resources of the Capitol Region Watershed District.”
ACCOMPLISHMENTS IN 2014
In 2014, CRWD achieved many of the goals stated in both the 2013 Monitoring Report and the
Monitoring Program Review & Recommendations (2014-2016), including:
CRWD established new full water quality monitoring stations in unmonitored CRWD
subwatersheds, including Hidden Falls subwatershed, and the Green Line.
CRWD worked to establish AC power connection and remote data access to Trout
Brook-East Branch and Trout Brook-West Branch in 2014 in order to increase data
collection efficiency and data quality.
CRWD adjusted the sampling season schedule to:
o Reduce the total number of monthly baseflow sampling events;
o Target specific precipitation events for sampling for storm volume and intensity.
CRWD implemented a long-term monitoring database for improved data organization,
data accessibility, data querying, and data analysis.
o The database (Kisters WISKI) was launched in December 2014
CRWD worked with the MPCA to monitor chloride pollution in stormwater to contribute
data to the Twin Cities Metro Area Chloride Project (MPCA, 2012b).

2014 CRWD Stormwater Monitoring Report 246
Partnered with the University of Minnesota on several projects by collecting and
analyzing water quality samples.
Identified and eliminated an illicit discharge observed at Trout Brook-East Branch using
IDDE protocols.
RECOMMENDATIONS FOR 2015
For 2015, CRWD has developed several goals and recommendations aimed at improving the
monitoring program’s efficiency as well as CRWD’s water quantity and quality dataset. Goals
for 2015 are:
1. CRWD will further explore and implement the many functions of the newly acquired
monitoring database software (Kisters WISKI) in order to improve efficiency, data
organization, data access, data analysis, and automation of data QA/QC, such as:
a. Automate baseflow and stormflow interval identification
b. Automate pollutant loading calculations
c. Recalculate discharge and pollutant loads for historical data using automated
scripts in order to streamline calculations and eliminate year-to-year subjectivity
2. CRWD will consider analyzing water quality samples for additional parameters not
currently analyzed, such as: bacteria/microbial source tracking, oil/grease, trash, PAHs,
contaminants of emerging concern.
3. CRWD will consider expanding remote data access capabilities to other baseline
monitoring station in the District, such as East Kittsondale, Phalen Creek, or St Anthony
Park.
4. CRWD will develop and implement a CRWD Monitoring Quality Assurance Program
Plan (QAPP) in 2015 to ensure data quality. The QAPP will act as a primary guidance
document to:
a. Define field and laboratory quality assurance goals and procedures;
b. Summarize monitoring program goals, design, sampling methods, analytical
procedures, and data review protocols.
5. CRWD will seek to enhance partnerships with the City of Saint Paul, Ramsey County,
other local urban watershed districts, and research groups (e.g. University of Minnesota)
to broaden our understanding of urban hydrology and pollutant loading.
6. CRWD will document illicit discharges throughout the watershed and work with District
municipalities to eliminate other potential sources of pollution.

2014 CRWD Stormwater Monitoring Report 247
14 REFERENCES
Capitol Region Watershed District (CRWD), 2015. 2014 Lakes Monitoring Report. Saint Paul,
MN.
Capitol Region Watershed District (CRWD), 2014. 2013 Stormwater Monitoring Report. Saint
Paul, MN.
Capitol Region Watershed District (CRWD), 2012. Stormwater BMP Performance Assessment
and Cost-Benefit Analysis. Saint Paul, MN.
Capitol Region Watershed District (CRWD), 2010. CRWD 2010 Watershed Management Plan.
Saint Paul, MN.
Capitol Region Watershed District (CRWD), 2002. Como Lake Strategic Management Plan.
Saint Paul, MN.
Capitol Region Watershed District (CRWD), 2000. Watershed Management Plan 2000.
Roseville, MN.
Community Collaborative Rain, Hail & Snow Network (CoCoRaHS), 2014. Maps: Daily
Precipitation. Accessed online from http://www.cocorahs.org/Maps/ViewMap.aspx?state=usa
ESRI, 2011. ArcGIS 9.3 Redlands, CA, USA.
Janke, B.D., 2015. Analysis of Nutrient Loading and Performance of the Villa Park Wetland,
2006 – 2012. University of Minnesota—Department of Ecology, Evolution and Behavior: St.
Paul, MN.
Massa, S., Brocchi, G.F., Peri, G. Altieri, C. and Mammina, C., 2001. Evaluation of recovery
methods to detect fecal streptococci in polluted waters. Letters in Applied Microbiology. 32:
298-302.
Metropolitan Council Environmental Services (MCES), 2015. Environmental Information
Management System. St. Paul, MN.
Minnesota Climatology Working Group (MCWG), 2015a. Minneapolis/St. Paul Metro Snow
Resources. Accessed online from http://climate.umn.edu/doc/twin_cities/twin_cities_snow.htm
Minnesota Climatology Working Group (MCWG), 2015b. St. Paul Campus Climatological
Observatory: 15-minute precipitation data. Saint Paul, MN. Accessed online from
http://climate.umn.edu/doc/observatory.htm
2014 CRWD Stormwater Monitoring Report 248
Minnesota Department of Natural Resources (DNR), 2015a. 2014 Lake Ice Out Dates. Saint
Paul, MN. Accessed on-line from http://www.dnr.state.mn.us/ice_out/index.html?year=2014
Minnesota Department of Natural Resources (DNR), 2015b. Minneapolis/St. Paul Climate Data,
Snowfall Data Resources. Saint Paul, MN. Accessed online from
http://climate.umn.edu/doc/twin_cities/snowvar.htm
Minnesota Department of Natural Resources (DNR), 2015c. Median Lake Ice Out Dates. Saint
Paul, MN. Accessed online from http://www.dnr.state.mn.us/ice_out/index.html?year=median
Minnesota Department of Natural Resources (DNR), 2015d. Record-Setting Rainfall in June
2014. Saint Paul, MN. Accessed online from
http://www.dnr.state.mn.us/climate/journal/140630_wet_june.html
Minnesota Pollution Control Agency (MPCA), 2013. TMDL Project: Lake Pepin – Excess
Nutrients. Accessed online from http://www.pca.state.mn.us/index.php/water/water-types-and-
programs/minnesotas-impaired-waters-and-tmdls/tmdl-projects/lower-mississippi-river-basin-
tmdl-projects/project-lake-pepin-excess-nutrients.html
Minnesota Pollution Control Agency (MPCA), 2012a. Final TMDL list of impaired waters.
Accessed online from http://www.pca.state.mn.us/index.php/view-document.html?gid=8281.
Saint Paul, MN.
Minnesota Pollution Control Agency (MPCA), 2012b. Metro Area Chloride Project. Accessed
online from http://www.pca.state.mn.us/index.php/view-document.html?gid=16384.
Minnesota Pollution Control Agency (MPCA), 2012c. South Metro Mississippi River Total
Suspended Solids Total Maximum Daily Load Draft. Accessed online from
http://www.pca.state.mn.us/index.php/view-document.html?gid=15794.
National Oceanic and Atmospheric Administration (NOAA), 2015a. 1981-2010 U.S. Climate
Normals. Accessed on-line from https://www.ncdc.noaa.gov/data-access/land-based-station-
data/land-based-datasets/climate-normals/1981-2010-normals-data
National Oceanic and Atmospheric Administration (NOAA), 2015b. Yearly Precipitation
Rankings at Minneapolis. Accessed on-line from
http://www.crh.noaa.gov/news/display_cmsstory.php?wfo=mpx&storyid=102952&source=0
National Weather Service (NWS), 2015. Past weather information for the Twin Cities. Twin
Cities, MN. Accessed online from http://www.weather.gov/mpx/mspclimate
National Weather Service (NWS), 2015b. Mississippi River at St. Paul. Accessed online from
http://water.weather.gov/ahps2/hydrograph.php?wfo=mpx&gage=stpm5

2014 CRWD Stormwater Monitoring Report 249
Office of the Revisor of Statutes (ORS), 2012. Minn. Stat. § 7050.0222 Specific Water Quality
Standards for Class 2 Waters of the State; Aquatic Life and Recreation. Saint Paul, MN.
Accessed online from https://www.revisor.mn.gov/rules/?id=7050.0222
Pitt, R., Maestre, A., Hyche, H., and Togawa, N., 2008. The Updated National Stormwater
Quality Database (NSQD), Version 3. Proceedings of the Water Environment Federation,
WEFTEC 2008: Session 11 through Session 20, 1007-1026(20).

2014 CRWD Stormwater Monitoring Report 250

2014 CRWD Stormwater Monitoring Report 251
APPENDIX A: METAL STANDARDS BASED ON HARDNESS

2014 CRWD Stormwater Monitoring Report 252

2014 CRWD Stormwater Monitoring Report 253
APPENDIX A METAL STANDARDS BASED ON HARDNESS
Metals standards for cadmium, chromium, copper, lead, nickel, and zinc were calculated on an
individual site basis for the entire monitoring season (yearly) as well as for base, storm, and
illicit discharge event types (Table A-1). Listed below are the equations used to calculate the
event type and yearly metals standards for cadmium, chromium, copper, lead, and zinc.
Average hardness concentrations for each individual monitoring site were used in the
calculations, which is why each site has a different standard. To convert from micrograms (µg)
to milligrams (mg), the standard was multiplied by the conversion factor of 1𝑚𝑔
1,000µ𝑔.
𝐶𝑎𝑑𝑚𝑖𝑢𝑚 𝑆𝑡𝑎𝑛𝑑𝑎𝑟𝑑 (𝜇𝑔
𝐿⁄ ) = 𝑒0.7852∗ln[𝐴𝑣𝑒𝑟𝑎𝑔𝑒 𝐻𝑎𝑟𝑑𝑛𝑒𝑠𝑠(𝑚𝑔
𝐿⁄ )]−3.49
𝐶ℎ𝑟𝑜𝑚𝑖𝑢𝑚 𝑆𝑡𝑎𝑛𝑑𝑎𝑟𝑑(𝜇𝑔
𝐿⁄ ) = 𝑒0.819∗ln[𝐴𝑣𝑒𝑟𝑎𝑔𝑒 𝐻𝑎𝑟𝑑𝑛𝑒𝑠𝑠(𝑚𝑔
𝐿⁄ )]+1.561
𝐶𝑜𝑝𝑝𝑒𝑟 𝑆𝑡𝑎𝑛𝑑𝑎𝑟𝑑(𝜇𝑔
𝐿⁄ ) = 𝑒0.620∗ln[𝐴𝑣𝑒𝑟𝑎𝑔𝑒 𝐻𝑎𝑟𝑑𝑛𝑒𝑠𝑠(𝑚𝑔
𝐿⁄ )]−0.57
𝐿𝑒𝑎𝑑 𝑆𝑡𝑎𝑛𝑑𝑎𝑟𝑑(𝜇𝑔
𝐿⁄ ) = 𝑒1.273∗ln[𝐴𝑣𝑒𝑟𝑎𝑔𝑒 𝐻𝑎𝑟𝑑𝑛𝑒𝑠𝑠(𝑚𝑔
𝐿⁄ )]−4.705
𝑍𝑖𝑛𝑐 𝑆𝑡𝑎𝑛𝑑𝑎𝑟𝑑(𝜇𝑔
𝐿⁄ ) = 𝑒0.8473∗ln[𝐴𝑣𝑒𝑟𝑎𝑔𝑒 𝐻𝑎𝑟𝑑𝑛𝑒𝑠𝑠(𝑚𝑔
𝐿⁄ )]+0.7615
The Minnesota Rules also states that for waters with hardness values greater than 212 mg/L, the
chronic standard for nickel shall not exceed 0.297 mg/L. For those event types or yearly
averages which have average hardness values which exceed 212 mg/L, the nickel standard for
those event types or year was set equal to the state standard of 0.297 mg/L. If the average
hardness value was less than 212 mg/L, the following equation was used to calculate the nickel
standard:
𝑁𝑖𝑐𝑘𝑒𝑙 𝑆𝑡𝑎𝑛𝑑𝑎𝑟𝑑(𝜇𝑔
𝐿⁄ ) = 𝑒0.846∗ln[𝐴𝑣𝑒𝑟𝑎𝑔𝑒 𝐻𝑎𝑟𝑑𝑛𝑒𝑠𝑠(𝑚𝑔
𝐿⁄ )]+1.1645

2014 CRWD Stormwater Monitoring Report 254
Table A-1: Metals standards based on average hardness, 2014.
Parameter Average
Lambert's
Landing
East
Kittsondale
Hidden
Falls
Phalen
Creek
St.
Anthony
Park
Trout
Brook -
East
Branch
Trout
Brook -
West
Branch
Trout
Brook
Outlet Villa Park Como 3 Como 7 Sarita
Base -- 400* 390 400* 334 400* 247 357 272 -- -- --
Illicit Discharge -- 200 -- -- -- -- -- -- -- -- -- --
Snowmelt -- 89 -- 246 342 351 189 273 393 122 158 --
Storm -- 55 87 69 58 141 76 110 179 30 26 52
Yearly 246 238 34 246 217 277 147 219 247 45 43 52
Base -- 0.0034 0.0034 0.0034 0.0029 0.0034 0.0023 0.0031 0.0025 -- -- --
Illicit Discharge -- 0.0020 -- -- -- -- -- -- -- -- -- --
Snowmelt -- 0.0010 -- 0.0023 0.0030 0.0030 0.0019 0.0025 0.0033 0.0013 0.0016 --
Storm -- 0.0007 0.0010 0.0009 0.0007 0.0015 0.0009 0.0012 0.0018 0.0004 0.0004 0.0007
Yearly 0.0023 0.0022 0.0005 0.0023 0.0021 0.0025 0.0015 0.0021 0.0023 0.0006 0.0006 0.0007
Base -- 0.6442 0.6442 0.6442 0.5553 0.6442 0.4347 0.5863 0.4697 -- -- --
Illicit Discharge -- 0.3652 -- -- -- -- -- -- -- -- -- --
Snowmelt -- 0.1887 -- 0.4320 0.5661 0.5791 0.3483 0.4709 0.6347 0.2436 0.3010 --
Storm -- 0.1272 0.1847 0.1533 0.1325 0.2745 0.1652 0.2231 0.3336 0.0772 0.0677 0.1212
Yearly 0.4326 0.4216 0.0855 0.4326 0.3903 0.4772 0.2830 0.3936 0.4338 0.1076 0.1030 0.1212
Base -- 0.0232 0.0232 0.0232 0.0207 0.0232 0.0172 0.0216 0.0183 -- -- --
Illicit Discharge -- 0.0151 -- -- -- -- -- -- -- -- -- --
Snowmelt -- 0.0092 -- 0.0172 0.0210 0.0214 0.0146 0.0183 0.0230 0.0111 0.0131 --
Storm -- 0.0068 0.0090 0.0078 0.0070 0.0122 0.0083 0.0104 0.0141 0.0047 0.0042 0.0066
Yearly 0.0172 0.0168 0.0050 0.0172 0.0159 0.0185 0.0125 0.0160 0.0172 0.0060 0.0058 0.0066
Base -- 0.0186 0.0186 0.0186 0.0147 0.0186 0.0101 0.0161 0.0114 -- -- --
Illicit Discharge -- 0.0077 -- -- -- -- -- -- -- -- -- --
Snowmelt -- 0.0028 -- 0.0100 0.0152 0.0157 0.0071 0.0114 0.0182 0.0041 0.0057 --
Storm -- 0.0015 0.0027 0.0020 0.0016 0.0049 0.0022 0.0036 0.0067 0.0007 0.0006 0.0014
Yearly 0.0100 0.0096 0.0008 0.0100 0.0085 0.0117 0.0052 0.0086 0.0100 0.0012 0.0011 0.0014
Base -- 0.5094 0.5094 0.5094 0.4369 0.5094 0.3393 0.4622 0.3676 -- -- --
Illicit Discharge -- 0.2834 -- -- -- -- -- -- -- -- -- --
Snowmelt -- 0.1433 -- 0.3372 0.4458 0.4563 0.2699 0.3685 0.5017 0.1866 0.2322 --
Storm -- 0.0954 0.1401 0.1157 0.0994 0.2111 0.1249 0.1704 0.2582 0.0569 0.0497 0.0907
Yearly 0.3377 0.3288 0.0633 0.3377 0.3036 0.3737 0.2178 0.3062 0.3386 0.0802 0.0767 0.0907
Base -- 0.3431 0.3431 0.3431 0.2942 0.3431 0.2284 0.3113 0.2475 -- -- --
Illicit Discharge -- 0.1907 -- -- -- -- -- -- -- -- -- --
Snowmelt -- 0.0963 -- 0.2270 0.3002 0.3073 0.1816 0.2481 0.3379 0.1255 0.1562 --
Storm -- 0.0641 0.0942 0.0777 0.0668 0.1420 0.0839 0.1146 0.1737 0.0382 0.0334 0.0609
Yearly 0.2273 0.2213 0.0425 0.2273 0.2043 0.2516 0.1465 0.2061 0.2279 0.0539 0.0515 0.0609
*For hardness values greater than 400mg/L, 400 mg/L is used as the value for metals standards calculations (MPCA)
-- No data available
Zinc
Hardness
Cadmium
Chromium
Copper
Lead
Nickel

2014 CRWD Stormwater Monitoring Report 255
APPENDIX B: MISCELLANEOUS REFERENCE TABLES

2014 CRWD Stormwater Monitoring Report 256

2014 CRWD Stormwater Monitoring Report 257
APPENDIX B MISCELLANEOUS REFERENCE TABLES
Table B-1: Data collection efficiency at CRWD monitoring sites, 2014.
Site Possible Days Possible Hours Hours Missing Efficiency
East Kittsondale 365 8,760 27 100%
Hidden Falls 196 4,705 0 100%
Phalen Creek 365 8,760 497 94%
St. Anthony Park 365 8,760 486 94%
Trout Brook-East Branch 365 8,760 0 100%
Trout Brook-West Branch 365 8,760 210 98%
Trout Brook Outlet 365 8,760 48 99%
Villa Park 206 4,943 0 100%
Como 3 196 4,704 0 100%
Como 7 196 4,705 31 99%
Sarita 196 4,708 0 100%
Arlington-Jackson 170 4,076 4,076 0%
Sims-Agate 162 3,896 0 100%
Westminster-Mississippi 169 4,061 129 97%
Willow Reserve 189 4,530 4,530 0%
McCarrons Outlet 197 4,727 221 95%
Como Outlet 188 4,515 0 100%
Total 4,256 102,130 10,255 90%

2014 CRWD Stormwater Monitoring Report 258
Table B-2: Total rainfall during monitoring days at CRWD sites, 2005-2014.
Table B-3: Number of possible monitoring days for continuously monitored sites, 2005-2014.
2005 2006 2007 2008 2009 2010 2011 2012 2013 2014
East Kittsondale 29.05 24.67 24.25 18.89 20.95 35.61 33.62 30.26 36.36 35.66
Hidden Falls 28.37
Phalen Creek 29.28 24.13 13.96 17.73 20.34 36.32 33.62 29.73 31.20 35.44
St. Anthony Park 28.27 24.13 23.99 9.95 18.72 26.84 29.24 29.71 34.00 33.60
Trout Brook-East Branch 23.87 23.92 17.91 20.63 36.27 33.43 30.01 36.36 35.66
Trout Brook-West Branch 28.78 24.67 24.25 18.99 20.63 36.32 33.62 29.72 36.36 35.46
Trout Brook Outlet 29.28 24.67 24.23 15.54 20.95 36.32 24.53 30.26 36.36 35.50
Villa Park 24.66 24.16 19.45 19.11 31.32 28.90 26.38 26.00 29.38
Como 3 26.02 24.70 28.37
Como 7 28.96 24.16 17.40 18.82 30.92 28.90 26.02 24.70 28.37
Sarita 18.19 23.19 17.64 18.72 30.62 28.90 26.16 24.70 28.37
30.61
35.66Total 2014 Precipitation at UMN Climatological Observatory
SiteRainfall (inches)
NWS 30-Year Normal Precipitation (January-December)
2005 2006 2007 2008 2009 2010 2011 2012 2013 2014
East Kittsondale 200 210 225 218 277 365 365 366 365 364
Hidden Falls 196
Phalen Creek 197 194 134 210 262 365 365 366 342 344
St. Anthony Park 191 192 215 126 218 230 269 366 351 345
Trout Brook-East Branch 191 217 212 273 365 349 366 365 365
Trout Brook-West Branch 191 212 228 220 273 365 365 366 365 356
Trout Brook Outlet 198 211 226 198 277 365 344 366 365 363
Villa Park 204 228 223 220 212 211 232 197 206
Como 3 220 190 196
Como 7 195 222 209 217 209 205 223 194 195
Sarita 159 227 203 213 205 203 228 193 196
SiteMonitoring Days

2014 CRWD Stormwater Monitoring Report 259
APPENDIX C: MEDIAN MONTHLY CONCENTRATIONS BY SITE

2014 CRWD Stormwater Monitoring Report 260

2014 CRWD Stormwater Monitoring Report 261
APPENDIX C HISTORIC MEDIAN MONTHLY CONCENTRATIONS BY SITE
Table C-1: Median monthly baseflow concentrations by site, 2005-2014.
Month n median n median n median n median n median n median n median n median
Jan 5 0.040 7 0.050 7 0.060 5 0.050 6 0.050 6 0.050 1 0.180
Feb 5 0.030 8 0.070 7 0.050 7 0.070 8 0.070 6 0.050 1 0.160
Mar 6 0.050 7 0.050 6 0.080 8 0.160 7 0.090 9 0.080 1 0.270
Apr 20 0.070 1 0.030 9 0.050 9 0.090 18 0.060 10 0.060 8 0.050 1 0.120
May 33 0.050 2 0.030 14 0.070 13 0.050 30 0.060 17 0.080 13 0.050 2 0.120
June 36 0.050 2 0.020 12 0.090 12 0.080 29 0.100 15 0.070 13 0.070 1 0.230
July 41 0.070 2 0.030 19 0.050 19 0.070 44 0.080 22 0.080 18 0.060 2 0.150
Aug 44 0.060 3 0.040 20 0.050 17 0.060 45 0.100 18 0.090 14 0.050 1 0.090
Sep 40 0.090 1 0.030 13 0.050 14 0.070 32 0.080 14 0.050 14 0.050 1 0.250
Oct 33 0.060 1 0.020 14 0.060 14 0.060 32 0.070 13 0.080 11 0.060 1 0.120
Nov 12 0.040 8 0.060 9 0.050 10 0.070 10 0.050 7 0.060 1 0.170
Dec 4 0.020 6 0.060 6 0.050 7 0.080 7 0.090 6 0.050 1 0.200
Jan 5 2 0 7 3 7 8 5 17 6 6 6 10 1 5
Feb 5 2 0 8 18 7 12 7 21 8 20 6 12 1 4
Mar 6 3 0 7 3 6 18 8 8 7 9 9 13 1 6
Apr 20 4 1 3 9 4 9 10 18 5 10 6 8 7 1 5
May 33 4 2 4 14 4 13 15 30 10 17 15 13 8 2 5
June 36 6 2 2 12 6 12 22 29 13 15 7 13 8 1 4
July 41 6 2 3 19 2 19 13 44 11 22 11 18 9 2 5
Aug 44 6 3 34 20 4 17 20 45 11 18 12 14 9 1 6
Sep 40 5 1 7 13 2 14 18 32 8 14 15 14 7 1 6
Oct 33 8 1 6 14 2 14 15 32 7 13 12 11 7 1 6
Nov 12 4 0 6 8 3 9 18 10 5 10 12 7 13 1 5
Dec 4 2 0 6 2 6 8 7 7 7 19 6 9 1 10
*Villa Park outlet median values reflect only 2014 values, not historical.
Hidden FallsVilla Park
Outlet*
Total Phosphorus (mg/L)
Total Suspended Solids (mg/L)
Kittsondale Phalen CreekSt. Anthony
Park
Trout Brook-
East Branch
Trout Brook-
West Branch
Trout Brook
Outlet

2014 CRWD Stormwater Monitoring Report 262
Table C-2: Median monthly event flow concentrations by site, 2005-2014.
Month n median n median n median n median n median n median n median n median n median n median n median n median
Jan 1 0.230 1 0.320 1 0.100 1 0.050 1 0.120 1 0.470 1 0.690
Feb 6 0.500 4 0.140 6 0.590 6 0.390 4 0.280 1 0.430 2 0.510 2 0.850
Mar 5 0.410 17 0.490 14 0.280 15 0.390 13 0.440 12 0.430 9 0.520 12 0.570 4 0.330 6 0.420 4 0.300
Apr 21 0.330 3 0.200 12 0.210 14 0.270 19 0.180 12 0.180 11 0.230 7 0.260 13 0.180 2 0.250 9 0.190 3 0.130
May 52 0.440 4 0.250 21 0.400 23 0.200 48 0.370 31 0.370 29 0.360 20 0.280 29 0.370 9 0.200 14 0.250 3 0.140
June 54 0.420 3 0.140 28 0.520 30 0.230 39 0.370 30 0.450 24 0.390 19 0.180 29 0.470 10 0.220 22 0.210 4 0.220
July 59 0.330 2 0.220 26 0.400 23 0.270 44 0.300 29 0.310 28 0.290 15 0.240 23 0.460 12 0.170 21 0.250 1 0.090
Aug 67 0.280 2 0.160 30 0.430 31 0.290 51 0.290 36 0.350 24 0.330 13 0.220 22 0.290 8 0.130 25 0.210 1 0.140
Sep 37 0.350 2 0.300 21 0.350 21 0.190 26 0.300 18 0.410 11 0.370 6 0.300 12 0.400 4 0.200 14 0.280 1 0.230
Oct 40 0.270 2 0.560 17 0.250 17 0.260 32 0.480 18 0.300 14 0.300 9 0.230 18 0.330 10 0.240 17 0.210 2 0.270
Nov 4 0.690 1 0.440 1 0.100 1 0.240 1 0.570 2 0.430 1 0.830 1 0.160
Dec 1 0.110
Jan 1 68 1 338 1 20 1 9 1 23 1 197 1 237
Feb 6 172 4 130 6 177 6 145 4 93 1 260 2 255 2 150
Mar 5 264 17 71 14 202 15 59 13 96 12 93 9 107 12 94 4 19 6 15 4 29
Apr 21 246 3 125 12 102 14 156 19 63 12 76 11 102 7 195 13 102 2 80 9 58 3 19
May 52 246 4 314 21 162 23 92 48 123 31 218 29 203 20 77 29 194 9 12 14 52 3 9
June 54 189 3 130 28 189 30 143 39 124 30 232 24 207 19 114 29 236 10 33 22 68 4 17
July 59 163 2 264 26 194 23 119 44 108 29 142 28 144 15 86 23 178 12 21 21 76 1 4
Aug 67 140 2 129 30 271 31 195 51 88 36 194 24 177 13 108 22 146 8 13 25 64 1 10
Sep 37 177 2 330 21 121 21 86 26 87 18 127 11 214 6 56 12 158 4 29 14 55 1 9
Oct 40 96 2 547 17 73 17 75 32 61 18 97 14 104 9 28 18 102 10 12 17 28 2 11
Nov 4 382 1 49 1 15 1 3 1 289 2 163 1 79 1 7
Dec 1 40
*Villa Park outlet median values reflect only 2014 values, not historical.
GCP Outlet
Total Phosphorus (mg/L)
Total Suspended Solids (mg/L)
Kittsondale Phalen CreekSt. Anthony
Park
Trout Brook-
East Branch
Trout Brook-
West Branch
Trout Brook
OutletSarita Outlet
Villa Park
Outlet*Hidden Falls Como 3 Como 7

2014 CRWD Stormwater Monitoring Report 263
APPENDIX D: ANALYSIS OF NUTRIENT LOADING AND PERFORMANCE OF THE VILLA PARK WETLAND, 2006-2012

2014 CRWD Stormwater Monitoring Report 264

Villa Park Wetland Performance Analysis Report 1
Analysis of Nutrient Loading and Performance of the Villa Park Wetland, 2006 - 2012
Prepared for the Capitol Region Watershed District by:
Benjamin D. Janke
and
Jacques C. Finlay
Department of Ecology, Evolution, and Behavior
University of Minnesota
Saint Paul, MN, USA
April 6, 2015

2 Villa Park Wetland Performance Analysis Report
Table of Contents
1. Introduction ....................................................................................................................................... 4
1.1. The Villa Park Wetland ........................................................................................................................... 5 1.2. Data Collection ........................................................................................................................................... 6
Acknowledgements .............................................................................................................................. 7
2. Analytical And Statistical Methods ............................................................................................. 8
2.1. Reconstruction of Hydrologic Data and Load Calculations ....................................................... 8 2.2. Analytical Methods ................................................................................................................................... 9 2.3. Statistical Methods ................................................................................................................................ 10
3. Results ................................................................................................................................................ 12
3.1. Overall (Study Period) Nutrient Loading and Wetland Performance ................................ 12 3.2. Seasonal Net Loading and Removal (Load Ratio) by Year ...................................................... 14 3.3. Significance of Nutrient and Sediment Retention or Export .................................................. 15 3.4. Influence of Discharge, Air Temperature, and Precipitation on Nutrient Loading ....... 17
4. Discussion ......................................................................................................................................... 18
4.1. Hydrologic and Precipitation Controls on Nutrient Export from the Wetland ............... 18 4.1.1. Patterns of Stormflow and Baseflow Discharge in the Villa Park Wetland............................ 18 4.1.2. Precipitation Effects on Wetland Hydrology ....................................................................................... 21 4.1.3. Hydrologic Controls on Nutrient and Sediment Loading ............................................................... 24
4.2. Phosphorus .............................................................................................................................................. 27 4.2.1. Total Phosphorus ............................................................................................................................................ 27 4.2.2. Ortho-Phosphorus .......................................................................................................................................... 32
4.3. Nitrogen .................................................................................................................................................... 36 4.3.1. Total Nitrogen .................................................................................................................................................. 36 4.3.2. Ammonia Nitrogen ......................................................................................................................................... 39 4.3.3. Nitrate-Nitrite Nitrogen ............................................................................................................................... 43
4.4. Total Suspended Solids ........................................................................................................................ 47 4.5. Chloride ..................................................................................................................................................... 51
5. Supplemental Data and Analysis ............................................................................................... 54
6. Conclusions ....................................................................................................................................... 56
6.1. Hydrology and Climate ........................................................................................................................ 56 6.2. Phosphorus .............................................................................................................................................. 56 6.3. Nitrogen .................................................................................................................................................... 57 6.4. Total Suspended Solids ........................................................................................................................ 58
References ............................................................................................................................................. 59

Villa Park Wetland Performance Analysis Report 3
Appendix A: Summary of Wilcoxon Signed-Rank Test p-values and Correlation Coefficients for
Analysis of the Effects of Discharge, Precipitation, and Air Temperature on Nutrient Loads and
Concentrations at Villa Park
Appendix B: Supplementary Data and Excerpts
Appendix C: Cumulative Loading Plots for Volume, TSS, and Nutrients at Villa Park Inlet and Villa
Park Outlet, 2006-2012

4 Villa Park Wetland Performance Analysis Report
1. Introduction
The purpose of this report is to present an analysis of the effectiveness of the Villa Park wetland
system for the removal of nutrients and sediment from 2006 – 2012, and of the effects of factors
related to season, climate, precipitation, and vegetation that influence the wetland’s performance
for water quality improvement. The analysis was based primarily on monitoring data collected at
the inlet and outlet of the system by the Capitol Region Watershed District (CRWD), as well as
data from targeted studies by CRWD and others that include vegetation surveys, sediment
samples, and measurements of temperature, dissolved oxygen, and other water quality variables.
This project was motivated by several issues concerning the wetland. First, the results of
previous analyses (Janke 2013; CRWD 2013) suggested that the wetland was exporting a large
amount of sediment (as total suspended solids) and phosphorus in some years, particularly late in
the season. Since the wetland discharges directly to Lake McCarrons, and a large fraction (69%)
of the lake’s 1,070-ac watershed drains through the wetland, developing a better understanding
of the factors influencing nutrient export from the wetland is an issue crucial to maintaining and
improving water quality in the lake. Lake McCarrons, an 81-ac public lake located in Roseville,
MN, is considered mesotrophic and is not impaired for nutrients or water clarity. However,
maintaining water quality in the lake is desirable due to the number of people living on the lake
and to its importance as a public recreational destination. In 2004, the lake received an alum
treatment to lower phosphorus levels in the lake, and is routinely monitored by CRWD and other
entities to assess changes in water quality.
Second, in an effort to improve water quality of the lake, CRWD developed a management plan
for the wetland in 2010 to reduce phosphorus export to 109 lb per year (Wenck Associates
2010). Portions of the wetland were dredged during summer 2013 to improve its performance,
and with seven previous years of monitoring data, it was an opportunity to assess the baseline
effectiveness of the wetland before such a major overhaul.
Finally, while phosphorus and sediment may be of primary concern for treatment, the monitoring
data set also provided an opportunity to understand the timing of loading and wetland processing
of other nutrients and ions (including various nitrogen species as well as chloride) that could
impact water quality in the lake.
This report is organized as follows: (1) overview of the Villa Park wetland and data sets, (2)
description of the analytical and statistical methods used in the work, (3) summary and
interpretation of the most important results of the analyses, and (4) conclusion with the results
that are most relevant to the motivating questions. Appendices are included for selected
supplemental data sets that were used to guide interpretation of the results, cumulative loading
plots, as well as for tables of results from all analyses that were completed.
Villa Park Wetland Performance Analysis Report 5
1.1. The Villa Park Wetland
The Villa Park wetland system was originally constructed in 1985-1986 to improve water quality
of Lake McCarrons (Monson 2007). The wetland system collects runoff from roughly 740 acres
of primarily low-density residential and commercial land use, and discharges directly to Lake
McCarrons. The lake’s total watershed area is roughly 1,070 acres, so the Villa Park wetland
system is responsible for treating surface runoff from a large portion (69%) of the drainage area
of the lake and has thus been the subject of several previous studies (Oberts and Osgood 1991,
Monson 2007, Wenck Associates 2010) as well as on-going monitoring efforts by the Capitol
Region Watershed District (CRWD, 2013ab).
The wetland system consists of a series of ponds and cells (Fig. 1-1), which as of a 2004 retrofit
project are separated in the middle reaches of the system by permeable steel and timber weirs to
reduce channelization in the wetland (Monson et al. 2007; Wenck Associates 2010). A
sedimentation basin is located at the upstream end, to which most of the drainage area is
connected by major storm drains. CRWD’s Villa Park Inlet monitoring site is located at the
outlet of this sedimentation basin, and consists of an outlet stand pipe, as well as a secondary
outlet rock weir to serve as an overflow during high-flow conditions. A series of 5 wet cells are
located downstream of the sedimentation basin, with the last cell emptying into a roughly 3-acre
wet pond (Wenck Associates 2010). The CRWD Villa Park Outlet monitoring site is located at
the outlet of the wet pond, the primary outlet for which is a large pipe collecting overflow from a
6-ft wide weir. A secondary outlet weir designed to handle higher flows is also monitored for
level so that total outflow can be determined.
It should be noted that several un-monitored storm drains enter the wetland between the Inlet and
Outlet sites, as well as outflow from a smaller detention pond (“Hockey Rink Pond”), which
empties into the Villa Park wet pond. The total area drained by these additional elements is
roughly 128 ac, or 17% of the total drainage area of the wetland (740 ac).

6 Villa Park Wetland Performance Analysis Report
Figure 1-1. Aerial photograph of the Villa Park Wetland system showing the location of CRWD monitoring
sites, Villa Park Inlet and Villa Park Outlet, as well as the series of treatment cells and wet ponds (image
from Google Earth, dated April 2012).
1.2. Data Collection
The analyzed data set consists primarily of monitoring data collected by CRWD from 2006 to
2012 at the Villa Park Inlet and Outlet sites. Monitoring data include continuous flow rate during
the monitoring season and water chemistry of composite and grab samples collected during

Villa Park Wetland Performance Analysis Report 7
stormflow events and baseflow periods. Water chemistry variables of interest to this study
include total phosphorus (TP), soluble reactive phosphorus (Ortho-P), total nitrogen (TN),
nitrate-nitrite nitrogen (NO3-), ammonium (NH4
-), total suspended solids (TSS), and chloride
(Cl-). Monitoring data were collected during the warm season / open water periods of each year,
roughly April to November, with baseflow grab sampling occurring roughly once per month
during the off season. Details on sampling protocols and quality assurance / quality control can
be found in CRWD’s annual monitoring reports (e.g. CRWD 2013b).
Precipitation data were assembled from CRWD-maintained automatic and manual gauges
(including a manual gauge at the Villa Park Outlet), as well as from the State Climatology Office
station on the University of Minnesota St. Paul campus, and the Minneapolis (KMSP) and St.
Paul (KSTP) airports. Air temperature data from the UMN and KMSP stations were also used.
Several supplemental water quality data sets were also used to support or interpret the analyses.
These include data collected by CRWD in the wetland in 2007 for development of a phosphorus
management plan (Wenck and Associates 2010), as well as vegetation surveys in 2007, 2010,
and 2012. Data collected in the wetland in 2011 by Dr. Amy Hansen as part of her dissertation
work studying the role of epiphyton and submerged macrophytes for nitrogen and phosphorus
cycling at small scales has also been utilized (Hansen 2012). Data are also included from
samples provided by CRWD to the Ecology Evolution and Behavior Department at UMN from
2011 – 2012, which were analyzed for several nutrient forms and stable isotopes not included in
CRWD’s standard water chemistry variables, and were used to support an earlier project (Janke
et al. 2014).
Acknowledgements
Two sources in particular are acknowledged for the work described in this report. First, a very
similar study of wetland function was completed in the 1990’s by the USGS (Coon et al. 2000)
for a wetland on Irondequoit Creek in New York, and their report has proved a valuable
reference for presentation of some of the data and results, selection of statistical methods, and
interpretation of results. Much of this report is structured similarly to that of Coon et al. (2000).
A second source of information and interpretation of some of the results has come from
discussions with Dr. Amy T. Hansen, who conducted field work in the Villa Park wetland in
summer 2011 as part of her dissertation work at the University of Minnesota.

8 Villa Park Wetland Performance Analysis Report
2. Analytical And Statistical Methods
2.1. Reconstruction of Hydrologic Data and Load Calculations
Gaps in flow data are relatively common in stream or storm drain monitoring data sets due to
differences in timing of installations from year to year, battery or equipment failure, local
maintenance or construction, etc. Since a primary purpose of this project was to analyze nutrient
and sediment retention for the wetland, the loads needed to be calculated over the same intervals
within years, and for inter-annual comparisons to be made, these intervals needed to be the same
year to year. Therefore the data records for each year were reconstructed or truncated as
necessary to include only Apr 1 to Oct 31. Fortunately, very few large gaps were present in the
flow data for the two Villa Park sites, mostly occurring at the start of the season when equipment
installation did not occur until after Apr 1 (Table 2-1).
Table 2-1. Intervals of missing flow data by year at the monitoring sites during the period of analysis,
2006 – 2012. Missing days as the percent of the monitoring season is given, as well as the amount of
precipitation occurring during intervals of missing data.
Villa Park Inlet Villa Park Outlet
Year Missing Days % Season Precip (in) Missing Days % Season Precip (in)
2006 39 18% 5.3 17 8% 2.23
2007 2 1% 0.14 4 2% 0.2
2008 3 2% 0.28 4 2% 0.28
2009 23 11% 4.63 3 1% 0.04
2010 4 2% 0.19 5 3% 0.19
2011 11 5% 0.5 14 6% 0.5
2012 10 5% 3.37 3 1% 0.33
In the case of baseflow or stormflow intervals that extended beyond at the end of the season, the
intervals were simply truncated at Oct 31, 23:59 and assigned the corresponding fraction of the
interval’s total volume. Missing intervals during the April to October period had to be
reconstructed using the following procedure:
(1) Any days for which rainfall occurred were designated as stormflow intervals, and the
duration of the flow event was assumed to span the entire day regardless of timing of
rainfall. Volumes were assigned based on the method of Boyd et al. (1993) in which
an equation was derived from a line fit to rainfall and runoff data from observed
events at the sites (Fig. 2-1; Janke 2013).
(2) Days for which little or no rainfall occurred were assumed to be baseflow intervals.
Volumes were assigned to these intervals by simple linear extrapolation from the
observed baseflow intervals at the site during the rest of the year.
Once the hydrologic data were reconstructed, nutrient loads could be calculated. For all
stormflow and baseflow intervals for which a sample was collected, a load (in lb.) was calculated

Villa Park Wetland Performance Analysis Report 9
directly from the interval volume (ft3) and the nutrient concentration (mg/L). For un-sampled
intervals, a representative concentration had to be assigned. While several methods exist for this
calculation, a simple method employed in a previous analysis was used (Janke 2013). In this
method all observations at a given site are used to determine mean concentrations by month,
which are then assigned to the un-sampled interval based on month. While not statistically
rigorous, this method does attempt to capture some of the seasonal variability of nutrient
concentrations that are present at the Villa Park sites.
Figure 2-1. Regressions of runoff depth (in.) vs. rainfall depth (in.) at (a) Villa Park Inlet and (b) Villa Park
Outlet used to compute runoff volumes for un-gauged intervals (method of Boyd et al. 1993). Runoff
depth for each event was calculated by normalizing the runoff volume by the drainage area.
2.2. Analytical Methods
To statistically compare the upstream and downstream loads and concentration and to compute
nutrient removal (as a load ratio), a set of hydrologic events (storms and baseflow intervals) had
to be identified in which sampling occurred at both the Inlet and Outlet for a given event. Only
sampled events were used in order to remove the effect of any errors that might result from
reconstruction of intervals and loads. This was a manual process that involved combining some
intervals; for example, if two rainfall events were detected in succession at the Inlet but the
hydrograph at the Outlet only showed one event over the same period, then the two events at the
Inlet would be combined, with concentration assigned by volume weighting of the intervals.
The entire monitoring season (April – October) was also subdivided into bi-monthly (i.e. twice
per month) and monthly intervals, and water volumes and nutrient loads were determined for the
baseflow, stormflow, and combined flow for each interval by summing the event loads. Some
baseflow and stormflow events overlapping the breakpoints had to be split, in which case the
original load was divided proportionally between the split intervals. Longer intervals were used
to make the results more robust, as the event scale could be susceptible to sources of
methodological variation (e.g., presence of incomplete samples, or errors in pairing or classifying
upstream and downstream events), the effects of which would potentially be lessened when
integrated at the bi-monthly or monthly time scales.
y = 0.1704x - 0.007R² = 0.79
0.0
0.1
0.2
0.3
0.4
0.5
0.6
0.7
0.8
0.0 1.0 2.0 3.0 4.0
Ru
no
ff D
ep
th,
in.
Rainfall Depth (in)
(a) Villa Park Inlet
y = 0.1884x - 0.0237R² = 0.91
0.0
0.1
0.2
0.3
0.4
0.5
0.6
0.7
0.8
0.0 1.0 2.0 3.0
Ru
no
ff D
ep
th,
in.
Rainfall Depth (in)
(b) Villa Park Outlet

10 Villa Park Wetland Performance Analysis Report
In this report, nutrient and sediment removal efficiency by the wetland was defined as a load
ratio between the Outlet and the Inlet:
𝐿𝑜𝑎𝑑 𝑅𝑎𝑡𝑖𝑜 (𝐿𝑅) = 𝐿𝑜𝑎𝑑𝑂𝑢𝑡𝑙𝑒𝑡
𝐿𝑜𝑎𝑑𝐼𝑛𝑙𝑒𝑡
such that a value greater than 1.0 indicates export and value less than 1.0 indicates retention.
Load ratio was computed at the event scale for the paired loads and for the b-imonthly and
monthly intervals, and separately for stormflow, baseflow, and the combined (total) flow. One
drawback of this method of computing efficiency is that it can, especially at the event scale, lead
to very large ratios that vary substantially from event to event, especially for small Inlet loads.
These large ratios may be misleading since they do not necessarily indicate that a large amount
of a constituent was exported by the wetland, only that export was large relative to observed
inputs at the Inlet. The use of bi-monthly and monthly intervals was intended to smooth short-
term variation to reveal seasonal patterns in retention or export.
Cumulative loading plots were constructed for all years of data at the two sites to illustrate
seasonal and inter-annual variability of nutrient loading. Monthly mean and standard error of
nutrient concentrations were also plotted to illustrate seasonal variability of concentrations,
which were used qualitatively to interpret results of the statistical analyses.
2.3. Statistical Methods
Statistical methods for this project were similar to a study of wetland function and efficiency by
Coon et al. (2000). As in that study, a primary goal of this project was to investigate the
effectiveness of the Villa Park wetland for nutrient removal. A second goal was to investigate
climate factors that could influence removal efficiencies, nutrient concentrations, or loading.
Both goals required different statistical approaches, which are described below.
Wetland effectiveness was assessed using a Wilcoxon signed-rank method on paired (inlet-
outlet) nutrient loads and concentrations on several time scales (event, bi-monthly, and monthly),
as in Coon et al. (2000). This test determines whether the median difference between all pairs of
data is zero; if true, the upstream and downstream data have the same data distribution (Helsel
and Hirsch 2001). The test is non-parametric, and therefore appropriate for data that cannot be
assumed to follow a normal distribution (which is the case for some of the concentration data at
Villa Park). For this test, a p-value of less than 0.05 was assumed to indicate a significant
difference between the Inlet and Outlet loads or concentrations.
Interannual variability in net (Outlet –Inlet) loading by the wetland was expected to be
influenced by hydrology. This variability was investigated by simple linear regression of net
loads against net water volume (Outlet – Inlet) as well as several parameters related to
precipitation, with Pearson R2 and p-values used to assess the strength of correlations.
Parameters included snowfall during the preceding winter, snow meltwater equivalent (using

Villa Park Wetland Performance Analysis Report 11
heated rain gauge data at MSP Airport), seasonal (April – October) rainfall depth, and the total
number of “small” rainfall events or greater (> 0.1 in.), number of “medium” rainfall events or
greater (> 0.5 in.), and number of large rainfall events or greater (> 1.0 in.). While the small
number of years (n=7) available for the regression limits the power of the analysis, the purpose
was to reveal any general patterns among years.
The correlation of nutrient loads, concentrations, and load ratios with several climate,
precipitation, and hydrologic factors was assessed primarily using Spearman correlation
coefficients, as in Coon et al. (2000). This method provides a measure of how strongly the
relationship between two variables matches a monotonic relationship, i.e. does one variable
increase or decrease consistently as the other variable increases in order. A linear relationship
between the two variables is not required or assumed, as for a Pearson correlation coefficient.
Values of the Spearman coefficient, , range from -1 (one variable decreases perfectly as the
other increases) to +1 (both variables increase perfectly together), with 0 indicating no
relationship. A Spearman p-value of 0.05 or less was assumed to indicate a significant
relationship between the two variables. Correlations were generally considered “strong” for
Spearman > 0.70 or R2 > ~0.50, and “weak” for < 0.30 or R2 < ~0.10, though correlations
were sometimes significant at p < 0.05 even without being considered “strong”.
Climate factors used in the correlation analysis include a number of variables related to
temperature. Many processes responsible for nutrient cycling are microbially-controlled, and
processing rates are therefore affected by temperature. Since very little water temperature data
has been collected within the wetland, air temperature data from a nearby weather station (UMN
St. Paul campus) were used as a surrogate for water temperature. Daily minimum, mean, and
maximum temperatures were used as factors, as were the daily temperature exceedences, defined
as the difference between actual daily temperature and the 30-year mean temperature for the day
as measured at the Minneapolis-St. Paul airport from 1981-2010. Exceedences were computed
for the minimum, mean, and maximum temperatures, and were averaged over antecedent periods
of both 5 days and 10 days to give a measure of the extent to which antecedent conditions were
warmer or cooler than usual.
Several factors in the correlation analysis were used to characterize rainfall events and
antecedent precipitation patterns. Similar to a previous analysis (Janke 2013), rainfall events
were described by rainfall depth and rainfall intensity, and antecedent rainfall factors included
dry days, days since last 0.5 in. storm, days since last 1.0 in. storm, as well as accumulated
rainfall in the previous 7 days, previous 14 days, and previous 28 days.

12 Villa Park Wetland Performance Analysis Report
3. Results
Results of the analysis of the data from Villa Park are presented here, starting with an overview
of overall (study period) and annual nutrient loads and load ratios in Sections 3.1 and 3.2, and the
significance of upstream-downstream differences in nutrient loads and concentrations in Section
3.3. Results of the statistical analyses, which can be found in the Appendices, are listed in
Section 3.4 and include the correlations of nutrient loads, concentrations, and load ratios with
various hydrologic and climate factors on several time scales.
Discussion of results is presented in Section 4, which includes an overview of year-to-year
patterns in nutrient loading and removal (load ratio), a discussion of hydrologic and climatic
influences on these patterns, and a separate discussion of results for each constituent.
3.1. Overall (Study Period) Nutrient Loading and Wetland Performance
Over the monitoring period, 2006 – 2012, the Villa Park wetland system retained TP, TN, NO3,
and Cl (load ratio less than 1.0), while the wetland exported Ortho-P, NH4, and TSS (load ratio
greater than 1.0). Overall loading during the study period was dominated by stormflow (Table 3-
1), which was responsible for roughly 60% to 80% of combined monitoring season (April 1 –
October 31) loads for all constituents. Stormflow load ratios exceeded 1.0 for all constituents
except NO3, while during baseflow periods, overall load ratios were less than 1.0 for most
nutrients. Nutrient and sediment export during stormflow may have been caused in part by the
additional storm drain inflows along the wetland, which would contribute pollutants not
measured at the upstream (Inlet) monitoring site.
For phosphorus, a small net loss was observed over the study period for TP (78 lb or ~6%; Table
3-1), driven by retention during baseflow, while the wetland exported a large amount of Ortho-P
overall (104 lb), almost entirely in stormflow. These results suggest that the wetland is
effectively trapping or burying some amount of particulate P, but also receiving additional inputs
of dissolved P or recycling some deposited P to soluble forms.
For nitrogen, the wetland provided a substantial decrease in TN overall (20%; Table 3-1). A
small portion of this loss, roughly 13%, was the result of NO3 loss. Also noteworthy was the
amount of NH4 exported by the wetland (208 lbs), which was similar to the amount of NO3
retained (270 lbs) and, much as in the case of Ortho-P, was dominated by stormflow.
The wetland also exported a large amount of TSS, roughly 6,000 lbs per year, which is 31.5% of
TSS observed at the Inlet. Export is driven entirely by stormflow (51.9% stormflow removal
efficiency), which may be evidence of erosion in the wetland during high flows or of significant
inputs from the additional storm drains along the wetland.

Villa Park Wetland Performance Analysis Report 13
Table 3-1. Total loads over the 2006-2012 monitoring period at the VP Inlet and VP Outlet sites. Volume
is in ft3, nutrient and TSS loads are in lbs. Percentages in the first two columns are the portion of the
combined (baseflow and stormflow) load at that site due to either baseflow or stormflow; Load Ratio (LR)
is the loading at VP Outlet relative to that at VP Inlet, such that LR > 1.0 indicates export and LR < 1.0
indicates retention.
Combined
VP Inlet VP Outlet Net Load Ratio
Vol ft3 86,497,608 87,325,779 828,171 1.01
TP lb 1,396 1,318 -78.1 0.94
Ortho-P lb 184 288 103.8 1.57
TN lb 10,855 8,705 -2,150.4 0.80
NO3 lb 1,066 796 -270.0 0.75
NH4 lb 1,064 1,272 208.3 1.20
TSS lb 139,425 183,298 43,874 1.31
Cl lb 484,519 430,529 -53,989 0.89
Baseflow
VP Inlet VP Outlet Net Load Ratio
Vol ft3 27,884,263 32% 24,922,704 29% -2,961,559 0.89
TP lb 554 40% 449 34% -105.6 0.81
Ortho-P lb 76 41% 77 27% 0.5 1.01
TN lb 3,800 35% 2,556 29% -1,243.4 0.67
NO3 lb 249 23% 155 19% -94.1 0.62
NH4 lb 349 33% 324 25% -24.9 0.93
TSS lb 39,072 28% 30,819 17% -8,253 0.79
Cl lb 227,198 47% 172,036 40% -55,162 0.76
Stormflow
VP Inlet VP Outlet Net Load Ratio
Vol ft3 58,613,345 68% 62,403,075 71% 3,789,730 1.06
TP lb 842 60% 870 66% 27.5 1.03
Ortho-P lb 108 59% 211 73% 103.4 1.96
TN lb 7,055 65% 6,148 71% -907.0 0.87
NO3 lb 817 77% 641 81% -175.9 0.78
NH4 lb 715 67% 948 75% 233.2 1.33
TSS lb 100,353 72% 152,479 83% 52,126 1.52
Cl lb 257,320 53% 258,493 60% 1,173 1.00

14 Villa Park Wetland Performance Analysis Report
3.2. Seasonal Net Loading and Removal (Load Ratio) by Year
Net combined (baseflow + stormflow) seasonal loads for most constituents varied from year to
year over the monitoring period at the Villa Park wetland (Table 3-2). Of note, Ortho-P was
exported by the wetland in every year and had the highest overall load ratio (1.57), ranging from
1.12 to 1.97 across seasons (i.e. Ortho-P loading at the Outlet was 12% to 97% higher than that
observed at the Inlet across years). TSS was exported in all years except the first (2006) and had
the second highest overall load ratio (1.31), with the largest range in load ratios (1.10 to 2.24) of
all constituents. NO3 was retained in all years, with a load ratio ranging from 0.57 to 0.88. NH4
was actually retained in some years but was exported by the wetland overall in an amount that
exceeded measured Inlet loading by 20% (i.e. load ratio = 1.20). Cl- was retained by the wetland
overall (load ratio = 0.89), but was exported in two years (2008 and 2010). Hydrologic and
climatic factors influencing year-to-year variation in nutrient and sediment export are
investigated in later sections.
Table 3-2. Net seasonal (April – October) loads and load ratios by year for the Villa Park wetland. Net
loads are computed as the difference in combined (baseflow + stormflow) loads between the Outlet and
Inlet sites, and Load Ratio (LR) is the loading at VP Outlet relative to that at VP Inlet, such that LR > 1.0
indicates export and LR < 1.0 indicates retention.
Vol TP Ortho-P TSS
Year Net Load (ft3)
Load Ratio
Net Load (lb)
Load Ratio
Net Load (lb)
Load Ratio
Net Load (lb)
Load Ratio
2006 -1,108,231 0.91 0.8 1.00 10.4 1.62 -3,110 0.78
2007 -569,838 0.96 -6.5 0.97 22.9 1.97 6,980 1.37
2008 1,468,155 1.13 36.5 1.25 2.7 1.12 6,587 1.63
2009 -605,718 0.92 -22.6 0.82 6.3 1.37 11,659 2.24
2010 734,168 1.06 -93.9 0.70 21.4 1.88 4,847 1.10
2011 3,417,294 1.27 60.6 1.36 20.4 1.66 16,531 1.94
2012 -2,507,660 0.83 -52.9 0.76 19.8 1.41 380 1.02
2006-2012 828,171 1.01 -78.1 0.94 103.8 1.57 43,874 1.31
TN NO3 NH4 Cl
Year Net Load (lb)
Load Ratio
Net Load (lb)
Load Ratio
Net Load (lb)
Load Ratio
Net Load (lb)
Load Ratio
2006 -457 0.72 -44.3 0.72 34.4 1.30 -15,516 0.79
2007 -330 0.82 -43.4 0.75 125.3 1.65 -18,553 0.77
2008 25 1.02 -18.7 0.88 41.6 1.44 10,996 1.15
2009 -283 0.71 -36.8 0.57 -0.3 1.00 -8,084 0.83
2010 -692 0.63 -38.7 0.71 -53.1 0.74 174 1.00
2011 72 1.05 -29.3 0.83 69.2 1.41 -354 0.99
2012 -486 0.71 -58.7 0.68 -8.8 0.96 -22,651 0.73
2006-2012 -2,150 0.80 -270.0 0.75 208.3 1.20 -53,989 0.89

Villa Park Wetland Performance Analysis Report 15
3.3. Significance of Nutrient and Sediment Retention or Export
The effectiveness of the Villa Park wetland for nutrient retention or export was assessed using a
Wilcoxon signed-rank method on paired (Inlet-Outlet) nutrient loads and concentrations on
several time scales (event, bi-monthly, and monthly). A p-value of less than 0.5 was assumed to
indicate a significant difference between the inlet and outlet loads or concentrations. Results are
shown in Table 3-3 for all paired events in baseflow and stormflow separately, and in Table 3-4
for bi-monthly and monthly loading intervals. The effect of seasonality on the significance of
upstream-downstream differences in nutrient and sediment loads was investigated by repeating
analyses using early season (April-June) and late season (July – October) subsets of the data.
These results are shown in Appendix A-2 and discussed in later sections.
Table 3-3. Summary of p-values for Wilcoxon signed-rank test on paired (Inlet-Outlet) event loads and
concentrations. Differences between Inlet and Outlet quantities are considered significant for p < 0.05
(highlighted in blue). Difference in loading/concentration between Inlet and Outlet: ‘Gain’ = increase in
downstream direction (export), “Loss” = decrease in downstream direction (retention).
Baseflow Events Stormflow Events
Parameter Load Conc VPO-VPI Load Conc VPO-VPI
p-value p-value Difference p-value p-value Difference
Vol 2.55E-03 Loss 6.76E-01 Gain
TP 1.80E-01 3.59E-01 Loss 8.22E-01 4.58E-01 Gain
Ortho-P 7.68E-01 8.04E-02 Gain 1.72E-08 2.30E-10 Gain
TN 1.15E-05 1.05E-06 Loss 1.00E-01 1.38E-06 Loss
NO3 7.79E-05 6.83E-04 Loss 8.38E-06 1.67E-11 Loss
NH4 8.51E-02 8.42E-01 Loss 8.26E-01 8.87E-01 Gain
TSS 1.10E-02 2.63E-01 Loss 1.07E-02 1.81E-02 Gain
Cl 6.38E-06 1.45E-07 Loss 1.17E-01 1.31E-01 Loss
With the exception of TP and NH4, most constituents showed significant differences between the
inlet and outlet of the wetland. Water volume decreased significantly in the wetland during
baseflow, but not during stormflow. Export (gain) of Ortho-P was significant only in stormflow,
while loss of TN and NO3 in the wetland were significant in both stormflow and baseflow at
most time scales. For TSS, export was significant in stormflow at the event and monthly time
scales, with significant decreases in both TSS and Cl loading in baseflow. In contrast to the other
nutrients, TP and NH4 were not significantly retained or exported by the wetland in stormflow or
baseflow at any time scale, except NH4 in baseflow at the bi-monthly scale (significant loss).

16 Villa Park Wetland Performance Analysis Report
Table 3-4. Summary of p-values for Wilcoxon signed-rank test on paired (Inlet-Outlet) loads, summed
over bi-monthly and monthly intervals for baseflow, stormflow, and combined flow. Differences between
Inlet and Outlet quantities are considered significant for p < 0.05 (highlighted in blue). Difference in
loading/concentration between Inlet and Outlet: ‘Gain’ = increase in downstream direction (export), “Loss”
= decrease in downstream direction (retention).
Combined Flow
Bimonthly Monthly VPO-VPI
p-value p-value Difference
Vol 7.47E-02 3.85E-01 Gain
TP 2.91E-01 4.24E-01 Loss
Ortho-P 1.97E-05 2.98E-04 Gain
TN 1.95E-06 6.17E-05 Loss
NO3 2.90E-10 4.10E-08 Loss
NH4 7.75E-01 8.21E-01 Gain
TSS 6.71E-01 2.31E-01 Gain
Cl 2.85E-03 1.31E-02 Loss
Baseflow
Bimonthly Monthly VPO-VPI
p-value p-value Difference
Vol 1.46E-03 3.00E-02 Loss
TP 6.23E-02 1.53E-01 Loss
Ortho-P 8.08E-01 9.92E-01 Gain
TN 9.85E-08 2.59E-05 Loss
NO3 9.61E-09 2.66E-06 Loss
NH4 1.75E-02 7.65E-02 Loss
TSS 5.15E-04 2.12E-02 Loss
Cl 3.45E-06 3.40E-04 Loss
Stormflow
Bimonthly Monthly VPO-VPI
p-value p-value Difference
Vol 8.02E-01 9.53E-01 Gain
TP 9.70E-01 1.00E+00 Gain
Ortho-P 1.90E-09 2.09E-06 Gain
TN 1.45E-02 4.27E-02 Loss
NO3 7.09E-07 1.88E-05 Loss
NH4 5.66E-02 1.98E-01 Gain
TSS 1.38E-01 3.68E-02 Gain
Cl 7.42E-01 6.15E-01 Gain

Villa Park Wetland Performance Analysis Report 17
3.4. Influence of Discharge, Air Temperature, and Precipitation on Nutrient Loading
The effect of hydrology and climate on nutrient transport in the Villa Park wetland was assessed
using correlation analyses. Simple linear regression was used to investigate the influence of
discharge volume and precipitation on seasonal nutrient and sediment loads and load ratios. For
sub-seasonal time scales, the strength of correlation of nutrient loads, concentrations, and loading
ratios with factors describing temperature, precipitation, and flow was evaluated using the
Spearman correlation coefficient () and significance tests (p-value). Correlations amongst
nutrients and concentrations were also evaluated using the Spearman correlation coefficient. A
complete listing of the results is given below, with all results shown in Appendix A.
Appendix A-1: Correlation (Spearman ) of Event Nutrient Loads and Concentrations
Amongst the other Nutrient Loads and Concentrations
Appendix A-2: Wilcoxon Signed-Rank Tests (p-values) for Significant Inlet-Outlet
Differences in Nutrient Loads and Concentrations (Early Season and Late Season;
monitoring season results are shown in Tables 3-3 and 3-4)
Appendix A-3. Correlation of Season Inlet, Outlet, and Net (Outlet – Inlet) Nutrient
Loads and Load Ratios with Volume and Precipitation Parameters (Pearson R2)
Appendix A-4. Correlations (Spearman ) of Event Load Ratios with Air Temperature
and Antecedent Temperature Exceedence (Season, Early Season, and Late Season)
Appendix A-5. Correlations (Spearman ) of Event Load Ratios with Discharge and
Precipitation (Season, Early Season, and Late-Season)
Appendix A-6. Correlations (Spearman ) of Bi-monthly Load Ratios with Discharge,
Air Temperature, and Precipitation (Season, Early Season, and Late-Season)
Appendix A-7. Correlations (Spearman ) of Event Nutrient Loads and Concentrations
with Air Temperature and Antecedent Temperature Exceedence
Appendix A-8. Correlations (Spearman ) of Event Nutrient Loads and Concentrations
with Discharge and Precipitation
Appendix A-9. Correlations (Spearman ) of Bi-monthly Nutrient Loads with Discharge,
Air Temperature, and Precipitation
Appendix A-10. Correlations (Spearman ) of Monthly Nutrient Loads with Discharge,
Air Temperature, and Precipitation
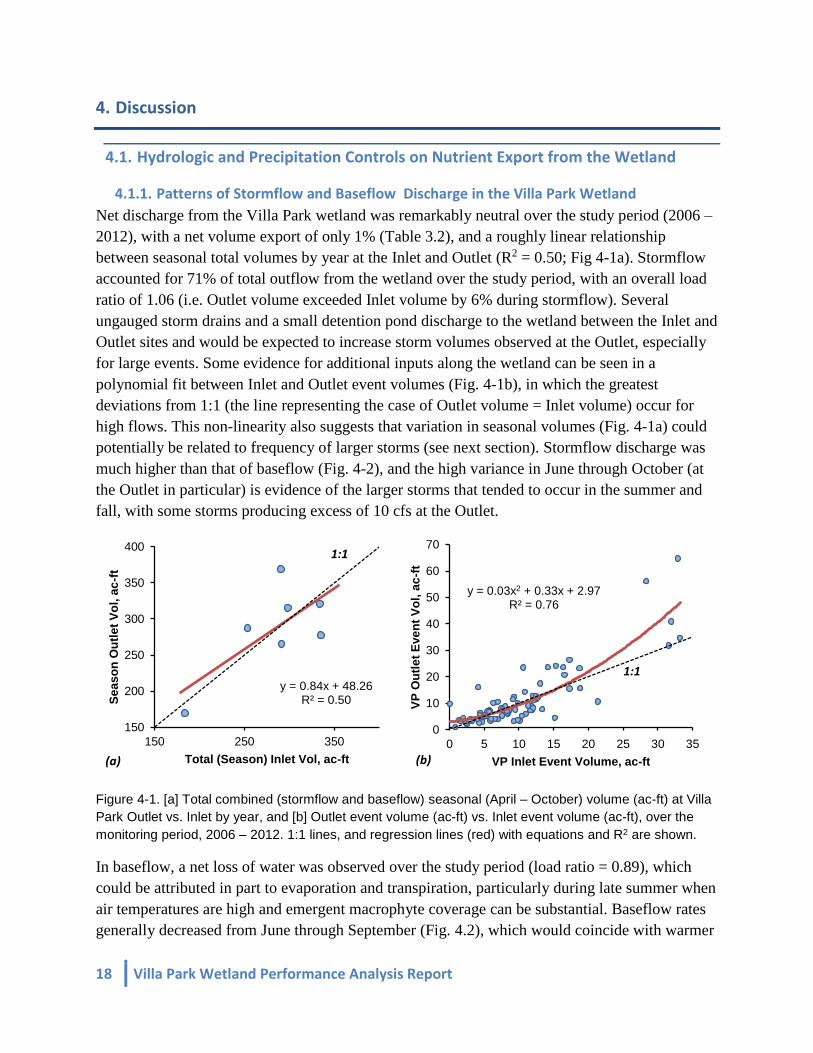
18 Villa Park Wetland Performance Analysis Report
4. Discussion
4.1. Hydrologic and Precipitation Controls on Nutrient Export from the Wetland
4.1.1. Patterns of Stormflow and Baseflow Discharge in the Villa Park Wetland
Net discharge from the Villa Park wetland was remarkably neutral over the study period (2006 –
2012), with a net volume export of only 1% (Table 3.2), and a roughly linear relationship
between seasonal total volumes by year at the Inlet and Outlet (R2 = 0.50; Fig 4-1a). Stormflow
accounted for 71% of total outflow from the wetland over the study period, with an overall load
ratio of 1.06 (i.e. Outlet volume exceeded Inlet volume by 6% during stormflow). Several
ungauged storm drains and a small detention pond discharge to the wetland between the Inlet and
Outlet sites and would be expected to increase storm volumes observed at the Outlet, especially
for large events. Some evidence for additional inputs along the wetland can be seen in a
polynomial fit between Inlet and Outlet event volumes (Fig. 4-1b), in which the greatest
deviations from 1:1 (the line representing the case of Outlet volume = Inlet volume) occur for
high flows. This non-linearity also suggests that variation in seasonal volumes (Fig. 4-1a) could
potentially be related to frequency of larger storms (see next section). Stormflow discharge was
much higher than that of baseflow (Fig. 4-2), and the high variance in June through October (at
the Outlet in particular) is evidence of the larger storms that tended to occur in the summer and
fall, with some storms producing excess of 10 cfs at the Outlet.
Figure 4-1. [a] Total combined (stormflow and baseflow) seasonal (April – October) volume (ac-ft) at Villa
Park Outlet vs. Inlet by year, and [b] Outlet event volume (ac-ft) vs. Inlet event volume (ac-ft), over the
monitoring period, 2006 – 2012. 1:1 lines, and regression lines (red) with equations and R2 are shown.
In baseflow, a net loss of water was observed over the study period (load ratio = 0.89), which
could be attributed in part to evaporation and transpiration, particularly during late summer when
air temperatures are high and emergent macrophyte coverage can be substantial. Baseflow rates
generally decreased from June through September (Fig. 4.2), which would coincide with warmer
y = 0.84x + 48.26R² = 0.50
150
200
250
300
350
400
150 250 350
Se
as
on
Ou
tle
t V
ol,
ac
-ft
Total (Season) Inlet Vol, ac-ft(a)
1:1
y = 0.03x2 + 0.33x + 2.97R² = 0.76
0
10
20
30
40
50
60
70
0 5 10 15 20 25 30 35
VP
Ou
tle
t E
ve
nt
Vo
l, a
c-f
t
VP Inlet Event Volume, ac-ft(b)
1:1

Villa Park Wetland Performance Analysis Report 19
temperatures and transpiration by growing vegetation. Baseflow discharge rebounded in October,
and while an explanation for this pattern is unclear it may be caused by decreased evaporation
during cooler weather and a loss of retention and transpiration due to senescence of vegetation.
Water loss in baseflow may also be due to groundwater recharge. A previous study by Wenck
Associates (2010) suggested that the upper portion of the wetland was recharging groundwater,
based on flow measurements taken along the wetland system. The presence of groundwater
recharge is also suggested by the substantial net loss of chloride observed during baseflow over
the study period (-24%). While some Cl- loss may be due to uptake by plants growing in the
wetland (Kadlec and Wallace 2009), it is generally conservative and thus expected to be neither
exported nor retained during baseflow (LR = 1.0) without some gain or loss of water in the
wetland.
Figure 4-2. Monthly mean and standard error of discharge (cfs) at the Villa Park sites, 2006-2012.
Number of samples comprising the mean is shown for each month.

20 Villa Park Wetland Performance Analysis Report
Figure 4-3. Time series of bi-monthly precipitation (in.) and combined (stormflow and baseflow) discharge (cfs) at VP Inlet and VP Outlet [top] and
volume ratio [bottom]. Red lines in bottom plot are the mean volume ratios for the given season.

Villa Park Wetland Performance Analysis Report 21
4.1.2. Precipitation Effects on Wetland Hydrology
Discharge at the Inlet and Outlet varied considerably among years and within seasons, with large
storms and wetter periods logically producing the highest flows in the wetland, especially at the
Outlet (Fig 4-3). When considered at the bi-monthly scale, which was chosen to even out some
of the variability in discharge, the wetland still often oscillated between water retention and
water export several times during a season (Fig 4-3). Extended periods of retention (i.e., when
inflow exceeded outflow) were apparent during several droughts in the study period, including
early summer 2007 and late summer and fall in 2008, 2011 and 2012.
The frequency of large storms appeared to have a greater influence on hydrologic export and
retention than overall (seasonal) precipitation. For example, seasonal (April – October)
precipitation depth was a poor predictor of seasonal net volume and load ratio of water, as well
as of seasonal volumes at both monitoring sites (Table A-3). However, the number of large (> 1
in.) events in a season was positively correlated with seasonal net volume and load ratio of water
(R2 = 0.60 and 0.63, respectively; Table A-3, Fig. 4-4a). Large storms often contribute
disproportionately to stormwater volumes in urban watersheds; at Villa Park, previous analyses
showed that roughly 45% and 55% of total volume loading over the study period at the Inlet and
Outlet, respectively, occurred during events of 1-in. depth or greater (Fig. B-1; Janke 2013).
Figure 4-4. Seasonal net (Outlet-Inlet) volume (ac-ft) versus [a] seasonal (Apr-Oct) precipitation depth
(in.), [b] number of large (>1-in.) events in a season, and [c] total snowfall (in.) during the preceding
winter. Linear regression lines with R2 are also shown.
R² = 0.12-80
-60
-40
-20
0
20
40
60
80
100
15 20 25 30 35
Net
Vo
lum
e (
ac
-ft)
Seasonal Precip Depth, in.(a)
R² = 0.60-80
-60
-40
-20
0
20
40
60
80
100
0 2 4 6 8 10
Net
Vo
lum
e (
ac
-ft)
No. of Large (>1-in.) Events(b)
R² = 0.77-80
-60
-40
-20
0
20
40
60
80
100
10 30 50 70 90
Net
Vo
lum
e (
ac
-ft)
Antecedent Snowfall (in)(c)

22 Villa Park Wetland Performance Analysis Report
Cumulative volume loading plots also showed the influence of large storms, with steep increases
in combined (stormflow and baseflow) loading rates occurring for large rain events (e.g. August
2010 or July 2011; Appendix C). Large events also were capable of altering the relatively
constant loading rates in baseflow, causing small but persistent increases in discharge in the
wake of large storms (e.g., following a 4.0-in. storm in mid-July 2011; Appendix C). The
increased baseflow discharge may be related to higher water levels in the wetland, as well as to
increased shallow groundwater inflow from rising water tables.
Antecedent snowfall was also important to wetland hydrology, as it was strongly and positively
correlated with seasonal net volume and water load ratio (Pearson R2 = 0.77 and 0.72,
respectively; Table A-3, Fig. 4-4c). Antecedent snowfall and subsequent melt would be
important for setting initial water table and surface levels in the wetland in spring, with higher
levels potentially producing larger export volumes early in the season. An explanation is not
apparent for the relatively weaker correlation with snow meltwater equivalent as determined by a
heated rain gauge (R2 = 0.61; Table A-3); relative to raw snowfall depth, it was expected to be a
more accurate estimate of water added to the landscape by precipitation, as the water content of
snow can be variable.
At sub-annual time scales, wetland discharge was greatly influenced by precipitation patterns
(Tables A-8 to A-10). Greater rainfall depth was strongly correlated with larger storm and
combined volumes at both sites and across time scales, with Spearman ranging from 0.78 to
0.94 (Fig. 4-5; Tables A-8 to A-10). Antecedent precipitation also had an effect on event-scale
flow in the wetland, particularly at the Outlet, as 7-day and 14-day rainfall were significantly
correlated to higher baseflow discharge and to larger storm event volumes at the Outlet (=0.25
to 0.44; Fig. 4-6). Antecedent rainfall was also important at longer time scales, being
significantly correlated with larger monthly and bi-monthly stormflow and combined volumes
(=0.26 to 0.40; Table A-9, A-10). By contrast, drier antecedent conditions (dry days, days since
0.5-in. or 1-in.) were significantly correlated with smaller storm volumes and lower baseflow
discharge at the Outlet (=-0.23 to -0.41; Fig. 4-6). Spearman values were relatively low
(though significant), but the general patterns are sensible, as wetter antecedent conditions were
expected to increase water levels in the wetland and reduce stormwater retention, while drier
periods should decrease water levels and increase storage capacity for subsequent storms.

Villa Park Wetland Performance Analysis Report 23
Figure 4-5. Bi-monthly combined (stormflow and baseflow) volume (ac-ft) at [a] VP Inlet and at [b] VP
Outlet as a function of bi-monthly precipitation depth (in.). R2 for linear regression fit and Spearman are
shown, ** indicates significance at p<0.001.
Figure 4-6. [a] Baseflow discharge (cfs) and [b] Event storm volume (ac-ft) vs. 14-day antecedent
precipitation depth (in.), and [c] Baseflow discharge (cfs) and [d] Event storm volume (ac-ft) vs. days since
last 0.5-in. event, at VP Outlet. Spearman are shown, * indicates significance at p<0.05, ** for
significance at p<0.001.
0
10
20
30
40
50
60
70
0 2 4 6 8
Bi-
mo
nth
ly I
nle
t V
ol,
ac
-ft
Bi-monthly Precip, in.
R2 = 0.70
(a)
0
20
40
60
80
100
120
0 2 4 6 8
Bi-
mo
nth
ly O
utl
et
Vo
l, a
c-f
t
Bi-monthly Precip, in.
R2 = 0.73
= 0.89**
(b)
0.0
0.1
0.2
0.3
0.4
0.5
0.6
0.7
0.8
0.9
1.0
0.0 2.0 4.0 6.0
Ou
tle
t B
as
efl
ow
, c
fs
14-day Antecedent Precip, in.
= 0.44**
(a)
0
10
20
30
40
50
60
70
0.0 2.0 4.0 6.0
Ou
tle
t S
torm
Vo
l, a
c-f
t
14-day Antecedent Precip, in.
= 0.30*
(b)
0.0
0.1
0.2
0.3
0.4
0.5
0.6
0.7
0.8
0.9
1.0
-10 10 30 50
Ou
tle
t B
as
efl
ow
, c
fs
Days Since 0.5-in Event
= -0.36*
(c)
0
10
20
30
40
50
60
70
0 20 40 60
Ou
tle
t S
torm
Vo
l, a
c-f
t
Days Since 0.5-in. Event
= -0.34**
(d)

24 Villa Park Wetland Performance Analysis Report
4.1.3. Hydrologic Controls on Nutrient and Sediment Loading
Year-to-year variability in seasonal (April – October) net nutrient loading by the Villa Park
wetland was generally related to the volume of water retained or exported. As water export from
the wetland increased, so did the net (Outlet – Inlet) loads and load ratios of TP, TN, NO3, TSS,
and Cl- (R2 0.20 to 0.67; Fig. 4-7 and Table A-3). Seasonal loads of these constituents at the two
monitoring sites also tended to be correlated with their respective seasonal volumes, especially
for Outlet TP and for NO3, TSS, and Cl- at both sites (R2 = 0.53 to 0.85; Table A-3). It should be
noted that net loads of TP and TN for 2010 appear anomalously low (lowest points in Fig. 4-7),
as R2 for net loading vs. net volume increase to above 0.90 with this year removed. The cause of
low TP and TN (as well as NH4) loads for 2010 is uncertain, as there were few intervals of
missing data for this monitoring year (Table 2-1).
Figure 4-7. Seasonal (April – October) total net (Outlet – Inlet) loads of TP, TN, NO3, TSS, and Cl- (lb) vs.
net volume (ac-ft) over 2006 – 2012 at Villa Park. R2 shown for line fits to each constituent. NH4 and
Ortho-P not shown due to lack of correlation. The low net loads of TP and TN occurred in 2010; with
these points removed, R2 improved to 0.92 and 0.91 for regressions with TP and TN, respectively.
R² = 0.33
R² = 0.67
R² = 0.43
-900
-750
-600
-450
-300
-150
0
150
300
450
600
-100
-80
-60
-40
-20
0
20
40
60
80
-60 -40 -20 0 20 40 60 80
Ne
t Lo
ad, T
N (
lb)
Ne
t Lo
ad, T
P o
r N
O3
(lb
)
Net Volume (ac-ft)
tp
no3
tn
R² = 0.54
R² = 0.63
-25,000
-20,000
-15,000
-10,000
-5,000
0
5,000
10,000
15,000
20,000
-60 -40 -20 0 20 40 60 80
Ne
t Lo
ad (
lb)
Net Volume (ac-ft)
tss
cl

Villa Park Wetland Performance Analysis Report 25
By contrast, seasonal NH4 and Ortho-P loading were very poorly correlated with volume
retention in the wetland. Instead, seasonal net loading (export) and load ratio of Ortho-P was
positively correlated with seasonal precipitation total (R2 = 0.69) and with the number of events
0.5 in. or larger (R2 = 0.55; Fig. 4-8), suggesting that more frequent larger events leads to greater
export of Ortho-P. By contrast, NH4 net loading and load ratio were not well correlated with any
precipitation parameters. When loading was considered separately at the two sites (Table A-3),
seasonal Ortho-P loads were poorly correlated with precipitation, while seasonal NH4 loads were
well correlated to several precipitation parameters (R2 = 0.57 to 0.81). The inconsistency of
volume retention and precipitation to explain year-to-year variability in Ortho-P and NH4 loading
suggests an effect of nutrient processing in the wetland (as well as a high degree of within-season
variability of processing), which is discussed in more detail in later sections.
Figure 4-8. Seasonal (April – October) total net (Outlet – Inlet) loads of Ortho-P (lb) vs. [a] seasonal
precipitation depth (in) and [b] number of events 0.5-in. R2 shown for line fits.
Nutrient loading by the wetland was greatly affected by hydrology at sub-annual time scales, as
discharge (cfs) was positively and significantly correlated with the loading of most nutrients in
stormflow and baseflow at both sites, and for all analyzed time scales (Tables A-8 to A-10). The
effect of discharge on bi-monthly TP, Ortho-P, and TSS loading are shown in Fig. 4-9. In
addition, load ratios of TP, Ortho-P, TN, NO3, and Cl were significantly correlated with greater
discharge at the Outlet at both the event and bi-monthly time scales, though more so for baseflow
than for stormflow (i.e. lower p-values / higher Spearman for baseflow; Tables A-8 and A-9).
While nutrient loading should be well correlated to discharge because flow volumes are used to
calculate loads, these results generally suggest hydrologic control for much of the sub-seasonal
nutrient loading by the wetland. Further discussion is provided separately for each constituent in
later sections.
Wetland discharge had some effect on concentrations of nutrient and sediment as well (Appendix
A-8). In baseflow, higher flow rates at VP Outlet were significantly correlated with lower TP and
TSS ( = -0.33 and -0.39, respectively), but with higher NO3 ( = 0.32). While lower TP and
TSS concentrations could be explained by dilution at higher flow rates, NO3 enrichment may be
related to reduced uptake and processing of upstream NO3 (which is significantly higher at the
R² = 0.69
0
5
10
15
20
25
30
15 20 25 30 35
Net
Ort
ho
-P L
oa
d, lb
Seasonal Precip Depth, in.(a)
R² = 0.55
0
5
10
15
20
25
30
10 15 20 25
Net
Ort
ho
-P L
oa
d, lb
No. of Events, 0.5-in. or Larger(b)

26 Villa Park Wetland Performance Analysis Report
Inlet; Table 3-3) at higher flow rates. This pattern of significantly higher NO3 concentration for
greater discharge also appears for stormflow at the Inlet ( = 0.30) and at the Outlet ( = 0.46).
By contrast, lower Cl- concentration is significantly correlated with increased stormflow
discharge at both the Inlet and Outlet ( = -0.51 and -0.49, respectively), which is likely evidence
of Cl- dilution due to its highly soluble and conservative nature.
Figure 4-9. Bi-monthly combined (baseflow and stormflow) loads of TP, Ortho-P, and TSS (lb) vs.
discharge (cfs) at the Inlet ([a],[c],[e]) and at the Outlet ([b],[d],[f]). Pearson shown, ** indicates
significance at p<0.001. Note that in [e], two points plot above the graph (TSS > 12,000 lb), and in [f], one
point plots above the graph (TSS > 30,000 lb).
0
10
20
30
40
50
60
70
80
0.0 0.5 1.0 1.5 2.0 2.5
Bi-
mo
nth
ly I
nle
t T
P,
lb
Bi-monthly Inlet Q, cfs
= 0.68**
(a)
0
20
40
60
80
100
120
0.0 1.0 2.0 3.0 4.0B
i-m
on
thly
Ou
tle
t T
P, lb
Bi-monthly Outlet Q, cfs
= 0.81**
(b)
0
2
4
6
8
10
12
0.0 0.5 1.0 1.5 2.0 2.5
Inle
t O
rth
o-P
, lb
Bi-monthly Inlet Q, cfs
= 0.61**
(c)
0
5
10
15
20
25
0.0 1.0 2.0 3.0 4.0
Ou
tle
t O
rth
o-P
, lb
Bi-monthly Outlet Q, cfs
= 0.75**
(d)
0
2,000
4,000
6,000
8,000
10,000
0.0 1.0 2.0 3.0
Bi-
mo
nth
ly I
nle
t T
SS
, lb
Bi-monthly Inlet Q, cfs
= 0.75**
(e)
0
5,000
10,000
15,000
0.0 1.0 2.0 3.0 4.0
Bi-
mo
nth
ly O
utl
et
TS
S, lb
Bi-monthly Outlet Q, cfs
= 0.62**
(f)

Villa Park Wetland Performance Analysis Report 27
4.2. Phosphorus
Phosphorus is of particular concern in many freshwater bodies due to its potential to enhance
eutrophication, which can be detrimental to water quality and is an important water management
issue in urban and agricultural watersheds. The Villa Park wetland discharges directly to Lake
McCarrons and treats much of the runoff from the lake’s drainage area, and is therefore a crucial
element in controlling water quality in the lake. A primary goal of this project was to evaluate
the wetland’s effectiveness in removing phosphorus from inflows to the lake, and to potentially
better understand the timing of phosphorus export from the wetland as well as factors or
processes that may influence the wetland’s ability to retain phosphorus. Total phosphorus (TP)
and ortho-phosphate (Ortho-P) are monitored by CRWD. Other forms, including particulate
phosphorus (PP) and total dissolved phosphorus (TDP), have been sporadically measured by the
University of Minnesota, CRWD, and others.
Sediment washing into the wetland is likely the primary input of phosphorus (P), with a much
smaller input possible from atmospheric deposition. Primary losses (storage) of P within the
wetland include settling of sediment-bound P, uptake by plants and microbes, and precipitation
with certain metals; P sources may include decomposition of organic matter, erosion of
sediment, and release of iron-bound P under anoxic (reducing) conditions (Ardon et al. 2010;
Kadlec and Wallace 2009).
4.2.1. Total Phosphorus
The Villa Park wetland retained a small amount of TP (78 lbs) over the 2006 - 2012 study
period, with a net combined (baseflow and stormflow) load ratio of 0.94 (Table 3-1). This small
overall retention masked considerable variability in seasonal load ratios, which ranged from 0.70
(-94 lbs) in 2010 to 1.36 (61 lbs) in 2011 (Table 3-2, Fig. 4-12). This year-to-year variability of
TP removal was affected by hydrologic conditions, as seasonal load ratios were positively
correlated with volume ratio (R2 = 0.58) and antecedent snowfall (R2 = 0.56), as well as with net
(Outlet – Inlet) volume (R2 of only 0.30, but see Fig. 4-7). In addition, TP load ratio was strongly
correlated with volume ratio at the bimonthly time scale (Spearman = 0.70).
Differences may exist between stormflow and baseflow in how TP is transported and processed
by the wetland, as overall TP retention was driven by retention (loss) in baseflow (LR = 0.89),
with slight export of TP occurring during stormflow (LR = 1.03). However, no significant
differences existed between TP loads at the Inlet and Outlet in baseflow or in stormflow,
regardless of the time scale of analysis (Tables 3-3, 3-4). Together with small overall TP
retention and strong correlations of TP loading with hydrologic parameters (see below), these
results suggest that the wetland may not process much TP overall, or that TP inputs (whether
internal or from the additional storm drains along the wetland) are very similar to the amount of
TP retained by the wetland through sediment trapping and biological uptake.
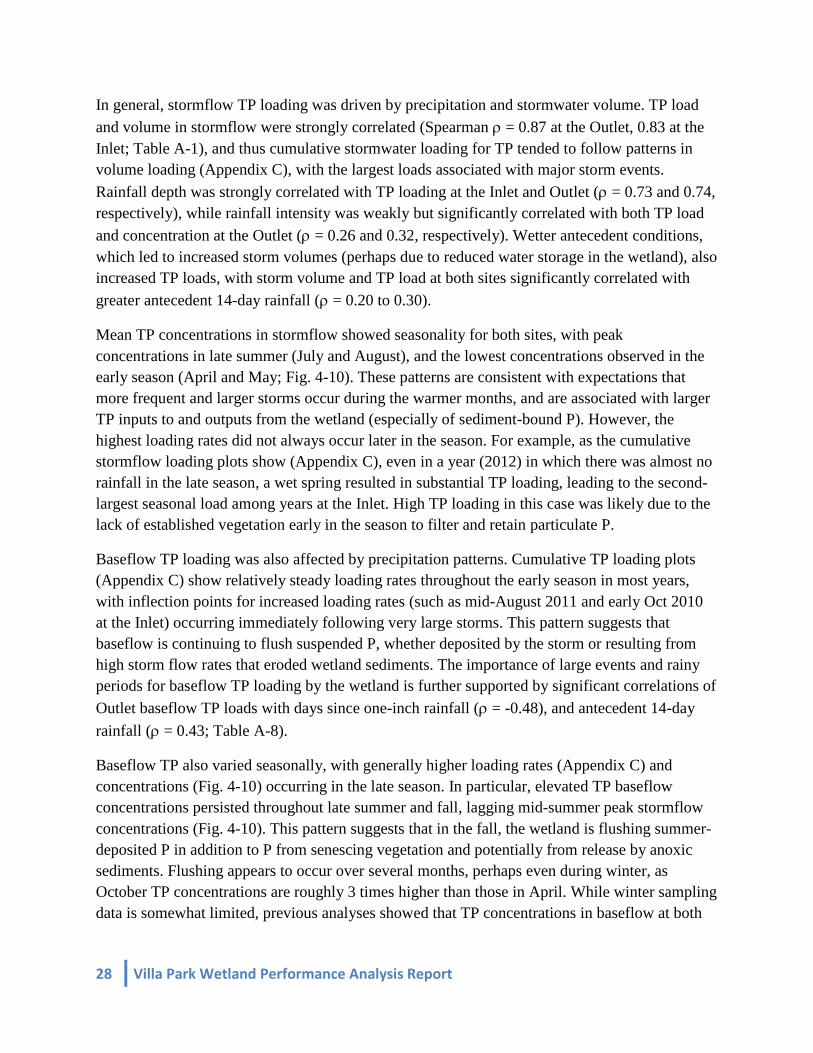
28 Villa Park Wetland Performance Analysis Report
In general, stormflow TP loading was driven by precipitation and stormwater volume. TP load
and volume in stormflow were strongly correlated (Spearman = 0.87 at the Outlet, 0.83 at the
Inlet; Table A-1), and thus cumulative stormwater loading for TP tended to follow patterns in
volume loading (Appendix C), with the largest loads associated with major storm events.
Rainfall depth was strongly correlated with TP loading at the Inlet and Outlet ( = 0.73 and 0.74,
respectively), while rainfall intensity was weakly but significantly correlated with both TP load
and concentration at the Outlet ( = 0.26 and 0.32, respectively). Wetter antecedent conditions,
which led to increased storm volumes (perhaps due to reduced water storage in the wetland), also
increased TP loads, with storm volume and TP load at both sites significantly correlated with
greater antecedent 14-day rainfall ( = 0.20 to 0.30).
Mean TP concentrations in stormflow showed seasonality for both sites, with peak
concentrations in late summer (July and August), and the lowest concentrations observed in the
early season (April and May; Fig. 4-10). These patterns are consistent with expectations that
more frequent and larger storms occur during the warmer months, and are associated with larger
TP inputs to and outputs from the wetland (especially of sediment-bound P). However, the
highest loading rates did not always occur later in the season. For example, as the cumulative
stormflow loading plots show (Appendix C), even in a year (2012) in which there was almost no
rainfall in the late season, a wet spring resulted in substantial TP loading, leading to the second-
largest seasonal load among years at the Inlet. High TP loading in this case was likely due to the
lack of established vegetation early in the season to filter and retain particulate P.
Baseflow TP loading was also affected by precipitation patterns. Cumulative TP loading plots
(Appendix C) show relatively steady loading rates throughout the early season in most years,
with inflection points for increased loading rates (such as mid-August 2011 and early Oct 2010
at the Inlet) occurring immediately following very large storms. This pattern suggests that
baseflow is continuing to flush suspended P, whether deposited by the storm or resulting from
high storm flow rates that eroded wetland sediments. The importance of large events and rainy
periods for baseflow TP loading by the wetland is further supported by significant correlations of
Outlet baseflow TP loads with days since one-inch rainfall ( = -0.48), and antecedent 14-day
rainfall ( = 0.43; Table A-8).
Baseflow TP also varied seasonally, with generally higher loading rates (Appendix C) and
concentrations (Fig. 4-10) occurring in the late season. In particular, elevated TP baseflow
concentrations persisted throughout late summer and fall, lagging mid-summer peak stormflow
concentrations (Fig. 4-10). This pattern suggests that in the fall, the wetland is flushing summer-
deposited P in addition to P from senescing vegetation and potentially from release by anoxic
sediments. Flushing appears to occur over several months, perhaps even during winter, as
October TP concentrations are roughly 3 times higher than those in April. While winter sampling
data is somewhat limited, previous analyses showed that TP concentrations in baseflow at both

Villa Park Wetland Performance Analysis Report 29
the Outlet and Inlet over the study period (2006-2012) were significantly lower in winter than in
summer and fall (Appendix B-1; Janke 2013).
Figure 4-10. Monthly mean and standard error of TP (mg/L) at the Villa Park sites, 2006-2012. The
number of samples comprising the mean are shown for each month.
Previous work suggests that particulate P, derived from sediment deposited or suspended in the
wetland, could be an important source of P at the Outlet. A 2007 CRWD study of soil cores
taken across the wetland (Wenck Associates 2010), found soil TP to be roughly 27% mobile P
(dissolved, bio-available P; mostly as Ortho-P), with the rest (73%) in particulate form as either
organic P (bound to sediment or organic matter) or refractory P. In a separate study, several

30 Villa Park Wetland Performance Analysis Report
stormflow and baseflow water samples taken during 2011 and 2012 from the Outlet were
analyzed by a lab in the Ecology Evolution and Behavior Department at UMN, and TP was
found to be roughly 70% to 75% particulate P (combined organic and refractory; Appendix B).
While a limited data set, these results imply roughly consistent particulate P composition
between wetland sediments and water at the outflow, suggesting that the sediments may be a
major source of P export. This conclusion is also suggested by significant positive relationships
between TSS and TP at both sites, in stormflow and in baseflow (Spearman = 0.54 to 0.85; Fig.
4-11).
The effect of air temperature on TP concentrations and loads, especially at the Outlet, suggests
that some processing of P occurs within the wetland at sub-annual time scales. For example, at
the event scale, stormflow TP concentration at the Outlet was weakly but significantly correlated
with 5-day and 10-day antecedent exceedences in maximum air temperature ( = 0.23-0.33;
Table A-7), and TP concentration in stormflow and baseflow at the Outlet was significantly
correlated with higher air temperature ( = 0.45-0.55; Table A-7). Monthly and bimonthly TP
(and Ortho-P) loads in stormflow and baseflow were also significantly related to higher
temperatures ( = 0.24-0.51; Tables A-9 and A-10). These positive (though relatively weak)
Spearman values may be evidence that decomposition rates, which would increase during warm
periods, may be releasing P from organic matter, to be slowly leached out during baseflow or
flushed during the next storm. By contrast, the lack of many significant correlations with
temperature exceedences over 5-day and 10-day intervals (especially relative to the daily
temperatures or exceedences) suggests that cycling of TP, if present, is occurring rapidly.
Figure 4-11. Event TP loads (lb) vs. Event TSS loads (lb) at [a] the Inlet and [b] the Outlet, over the study
period (2006-2012). Spearman correlation coefficient shown, ** indicates significance at p<0.001. Note
that both plots are shown on the same scale for comparison, and in [b] roughly 10 events are not shown
(TSS > 2,500 lbs, TP from 5 to 30 lb).
0
5
10
15
20
25
30
0 1,000 2,000 3,000
Inle
t T
P L
oa
d, lb
Inlet TSS Load, lb
= 0.85**
(a)
0
5
10
15
20
25
30
0 1,000 2,000 3,000
Ou
tle
t T
P L
oa
d, lb
Outlet TSS Load, lb
= 0.65**
(b)
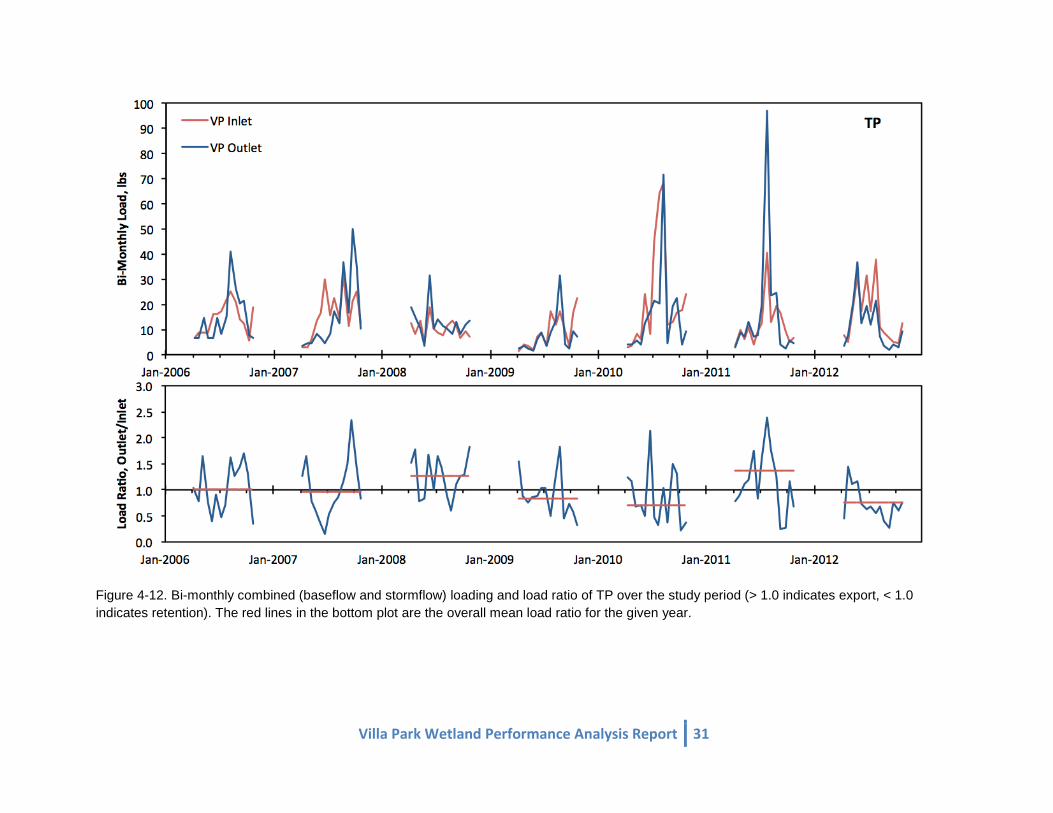
Villa Park Wetland Performance Analysis Report 31
Figure 4-12. Bi-monthly combined (baseflow and stormflow) loading and load ratio of TP over the study period (> 1.0 indicates export, < 1.0
indicates retention). The red lines in the bottom plot are the overall mean load ratio for the given year.
32 Villa Park Wetland Performance Analysis Report
4.2.2. Ortho-Phosphorus
Ortho-P had the highest overall load ratio of all constituents (1.57), and was exported from the
wetland in all years. Total export (104 lb) exceeded the magnitude of TP retention (78 lb) by
roughly 50%, even though Ortho-P comprised only 10% to 24% of TP on average. This export
was driven entirely by stormflow, as the amount of Ortho-P export in baseflow was negligible.
Load ratio was variable within seasons, ranging from 0.12 to 7.56, but was almost always greater
than 1.0, indicating export (Fig. 4-15). Consistent with the tendency to export Ortho-P,
concentrations and loads were significantly higher at the Outlet than at the Inlet in stormflow
(and in baseflow, though only in the early season, April – June; Table A-2).
Export of Ortho-P by the wetland was affected more strongly by precipitation patterns than by
hydrology. For example, interannual variability of net Ortho-P export and load ratio were well
explained by seasonal rainfall (R2 = 0.69, 0.66; Fig. 4-8), though not by annual net volumes or
volume ratio. In stormflow, event Ortho-P loads were significantly (though mostly weakly)
correlated with precipitation depth and intensity at both the Inlet ( = 0.23 and 0.24,
respectively) and at the Outlet ( = 0.78 and 0.41; Table A-8). In addition, cumulative loading
plots for Ortho-P (Appendix C) illustrate that loading patterns tended to be similar to those of
volume loading in stormflow, though the magnitude of Ortho-P loads were not always
proportional to the increases in volume, especially for the Inlet (see e.g., 2006, 2007, and 2008).
An explanation for Ortho-P export being strongly related to rainfall patterns but not to hydrology
is unclear, but may indicate that export is influenced by processes within the wetland that are
rapid enough to be enhanced by frequent storms.
Baseflow loading of Ortho-P, while minor relative to stormflow, was also influenced by
precipitation. Baseflow loading rates tended to be very low early in the season, with inflection
points corresponding to large events (e.g. mid-July 2011, mid-June 2012) in which loading rates
increased disproportionately to increases in cumulative volume (Appendix C). Wetter periods
seemed to result in greater Ortho-P loading by the Outlet, with weak but significant negative
correlations between Ortho-P loading and days since 0.5-in rainfall ( = -0.39), and significant
positive correlations with antecedent rainfall total over previous 7, 14, and 28 days ( = 0.34-
0.40). These relationships suggests a build-up of P in the wetland as a result of larger or more
frequent storms, perhaps from erosion of wetland sediments, or decomposition and leaching of
sediment and organic matter accompanying inflows from antecedent storms.
Ortho-P concentrations in both baseflow and stormflow exhibited similar seasonality as TP (Fig.
4-13), with the lowest concentrations occurring early in the season (April, May) and increasing
to peak concentrations in July and August. The summer peaks likely reflect the contribution of
internal sources, such as decomposition and/or release from anoxic sediments, in addition to
external inputs from summer storms. Stormflow concentrations at both sites also showed a
rebound in October; in the case of the Outlet, mean October concentration was essentially equal
to the peak concentration in July. The cause of this late fall peak might be related to leaching of
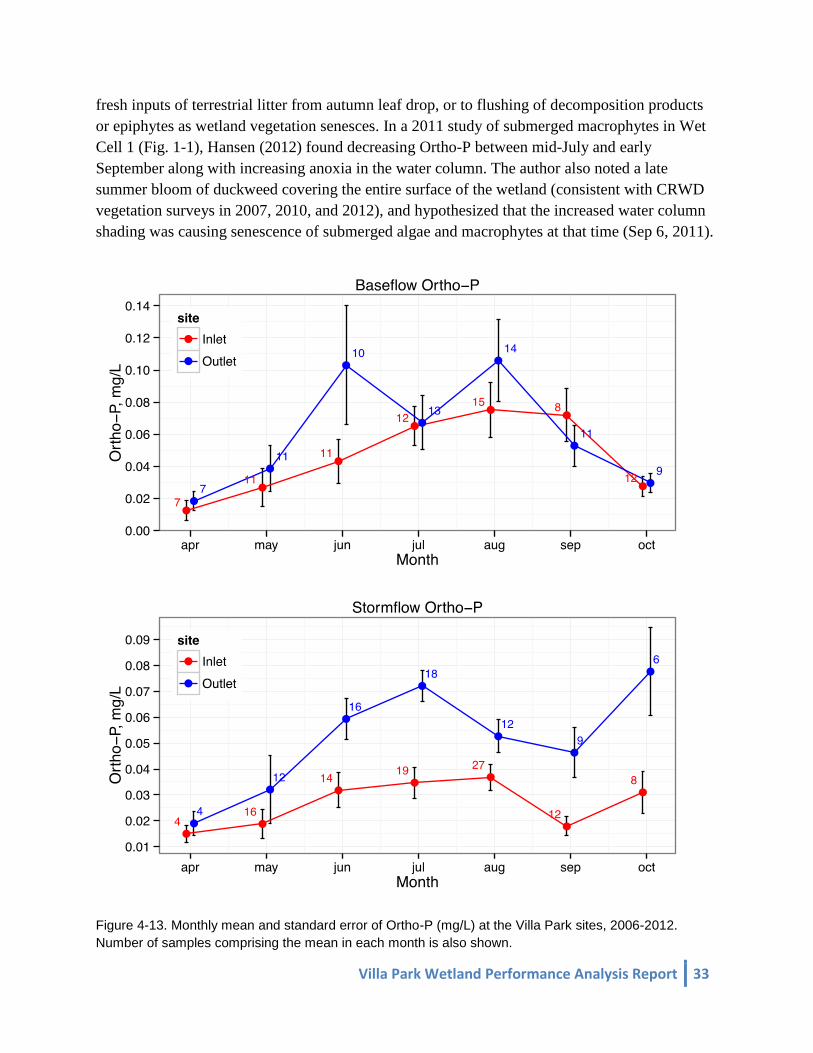
Villa Park Wetland Performance Analysis Report 33
fresh inputs of terrestrial litter from autumn leaf drop, or to flushing of decomposition products
or epiphytes as wetland vegetation senesces. In a 2011 study of submerged macrophytes in Wet
Cell 1 (Fig. 1-1), Hansen (2012) found decreasing Ortho-P between mid-July and early
September along with increasing anoxia in the water column. The author also noted a late
summer bloom of duckweed covering the entire surface of the wetland (consistent with CRWD
vegetation surveys in 2007, 2010, and 2012), and hypothesized that the increased water column
shading was causing senescence of submerged algae and macrophytes at that time (Sep 6, 2011).
Figure 4-13. Monthly mean and standard error of Ortho-P (mg/L) at the Villa Park sites, 2006-2012.
Number of samples comprising the mean in each month is also shown.

34 Villa Park Wetland Performance Analysis Report
Several results suggest that higher Ortho-P concentrations were caused by warmer weather
conditions. Ortho-P concentration was significantly correlated with higher air temperatures for
both sites, in stormflow and baseflow ( = 0.28 - 0.48; Fig. 4-14, Table A-7), and with 10-day
antecedent temperature exceedence for storm Ortho-P concentration at the Outlet ( = 0.29).
Baseflow load rate was also positively affected by temperature during the late season, when
temperatures were higher ( = 0.34 - 0.37). Warmer water temperatures in the wetland would
result in higher microbial activity, which should cause higher Ortho-P export from
decomposition, while higher respiration in relatively still backwaters of the wetland could create
anoxic conditions that would result in the release of P from reduced iron in sediment (Ardon et
al. 2010; Kadlec and Wallace 2009). Evidence for persistence of anoxic conditions in the
wetland and potential effects on nutrient concentrations is described in more detail in Section 5.
Figure 4-14. Event concentration of Ortho-P (mg/L) vs. mean air temperature (˚F) at [a] the Inlet and [b]
the Outlet, over the study period (2006-2012). Spearman correlation coefficients shown, * indicates
significance at p<0.05.
0.0
0.1
0.2
0.3
0 50 100
Inle
t O
rth
o-P
Co
nc
, m
g/L
Mean Air Temp, ˚F
= 0.34*
(a)
0.0
0.1
0.2
0.3
0 50 100
Ou
tle
t O
rth
o-P
, m
g/L
Mean Air Temp, ˚F
= 0.44*
(b)

Villa Park Wetland Performance Analysis Report 35
Figure 4-15. Bi-monthly combined (baseflow and stormflow) loading and load ratio of Ortho-P over the study period (> 1.0 indicates export, < 1.0
indicates retention). The red lines in the bottom plot are the overall mean load ratio for the given year.

36 Villa Park Wetland Performance Analysis Report
4.3. Nitrogen
Nitrogen is an abundant nutrient that can be a water quality concern in high enough
concentration, especially if paired with relatively high concentrations of P. Excess N loading
tends to be a more important issue in coastal waters (e.g. the Gulf of Mexico or Chesapeake Bay)
where N is often the limiting nutrient for photosynthesis, but it can have very localized water
quality effects as well, e.g. pollution of drinking water sources by excess nitrate. Total nitrogen
(TN) consists of dissolved inorganic forms (NO3 and NH4) and organic forms (both particulate
and dissolved).
4.3.1. Total Nitrogen
Total nitrogen was retained by the Villa Park wetland over the study period (load ratio = 0.80),
both in stormflow (LR = 0.87) and especially in baseflow (LR = 0.67). Net loading varied from
year to year (Fig. 4-17, Table 3-2), with net export occurring in 2008 and 2011, two years with
the largest water export from the wetland. TN concentrations were significantly lower at the
Outlet in both stormflow and baseflow at the event scale, while loads were significantly lower
only in baseflow, regardless of season interval used (Tables 3-3 and 3-4). Bimonthly and
monthly loads were significantly lower at the Outlet for all flow regimes.
TN loading is influenced to some extent by the wetland’s hydrology. Seasonal load ratio was
well-correlated with volume ratio (R2 = 0.59), while event load ratio was significantly correlated
to Outlet discharge in stormflow (Spearman = 0.32) and baseflow ( = 0.45). In addition, with
some small differences, cumulative loading patterns for TN generally followed the patterns in
cumulative volumes for both stormflow and baseflow (Appendix C).
TN concentrations did not show the same seasonality as TP and Ortho-P (i.e. peak concentrations
in late summer); instead concentrations were variable throughout the monitoring season (Fig. 4-
16). Storm TN at both sites generally decreased over the course of the season, which may
indicate processing of both internal and external sources of N over the course of the season. TN
in both stormflow and baseflow at the Outlet increased from August to October, perhaps the
result of decomposition of leaf litter or decay of macrophytes within the wetland in the fall. The
high variability (standard error) of Outlet baseflow TN in October may be caused by several
events with high TN concentrations from decomposition products in the wetland.
The other monitored forms of N, NO3 and NH4, together comprised roughly 15% to 19% of TN
in baseflow and 22% to 25% of TN in stormflow, and therefore most of TN is in the form of
organic matter (particulate and dissolved; see Appendix B). The retention of TN in the wetland is
therefore likely the result of a small amount of uptake of dissolved inorganic N (NO3 and NH4)
into plant biomass, with the bulk of retained TN likely occurring from deposition or trapping in
the wetland. This is supported in part by significant correlation between TSS and TN loads at the
event scale in baseflow ( = 0.61 and 0.51 for the Inlet and Outlet, respectively), when TN
retention is most likely (i.e. when LR generally < 1.0).

Villa Park Wetland Performance Analysis Report 37
Figure 4-16. Monthly mean and standard error of TN (mg/L) at the Villa Park sites, 2006-2012. Number of
samples comprising the mean for each month is also shown.

38 Villa Park Wetland Performance Analysis Report
Figure 4-17. Bi-monthly combined (baseflow and stormflow) loading and load ratio of TN over the study period (> 1.0 indicates export, < 1.0
indicates retention). The red lines in the bottom plot are the overall mean load ratio for the given year.

Villa Park Wetland Performance Analysis Report 39
4.3.2. Ammonia Nitrogen
Nitrogen transformation affects NH4 via several processes. NH4 may be removed from water and
sediment through assimilation by plants or microbes, or by conversion to NO3 via nitrification,
while NH4 may be produced or released by mineralization of organic N during decomposition,
leaching of organic matter, N-fixation from the atmosphere, or by diffusion from anoxic
sediments (Kadlec and Wallace 2009).
Ammonia nitrogen (NH4) was a significant portion of TN (9% to 15%), and except at the Inlet in
stormflow, comprised more of TN loading than NO3. The wetland exported 208 lb of NH4
overall (load ratio of 1.20), which was dominated by stormflow export (233 lb; LR = 1.33), with
a small proportion of NH4 retained in baseflow (-25 lb; LR = 0.93) (Table 3-2).
Several results suggest that in contrast to most of the other constituents, seasonal NH4 removal
does not appear to be greatly affected by wetland hydrology, and may be more impacted by
wetland processes or seasonality. Net loading varied year to year (Figure 4-20, Table 3-2), but
was not correlated with any annual precipitation characteristics or volume ratio. Loads and
concentrations of NH4 were not significantly different between the Inlet and Outlet for any flow
regime at the event scale, and few significant upstream-downstream differences were present
even when integrated at the bimonthly and monthly scales (Table 3-4). An exception to this is
when just the late season is considered (July – Oct), and the downstream loads become
significantly larger in stormflow (Table A-2).
The strong seasonality of NH4 in the wetland can be seen in the cumulative loading plots
(Appendix C) and in the monthly concentration data (Fig. 4-18). In most years, NH4 loading
rates in baseflow (and to a lesser extent stormflow) were very low in the early season regardless
of volume loading rates, especially at the Outlet. Loading rates increased greatly over the rest of
the season, beginning around mid-summer. The Outlet also showed a steadily increasing NH4
concentration in baseflow (similar to baseflow Ortho-P at the site), with elevated September and
October concentrations in stormflow (Fig. 4-18). Together these patterns may be evidence of
decomposition (and mineralization) of organic matter, a primary source of NH4, which would
occur at higher rates later in the season as organic matter builds up in the wetland and
temperatures warm, enhancing microbial processing rates (Kadlec and Wallace 2009).
The importance of temperature for NH4 processing is suggested by the weak but statistically
significant correlation of Outlet storm NH4 concentration with air temperature and antecedent
temperature exceeedence, especially exceedence in the maximum temperature (Spearman =
0.22 – 0.27; Table A-7). Higher temperatures would be expected to increase microbial activity,
and therefore decomposition, releasing NH4 from wetland detritus. If rates of decomposition and
respiration are high enough, anoxia could be occurring as well, which can result in release of
NH3 gas from sediments along with Ortho-P (Coon et al. 2000).
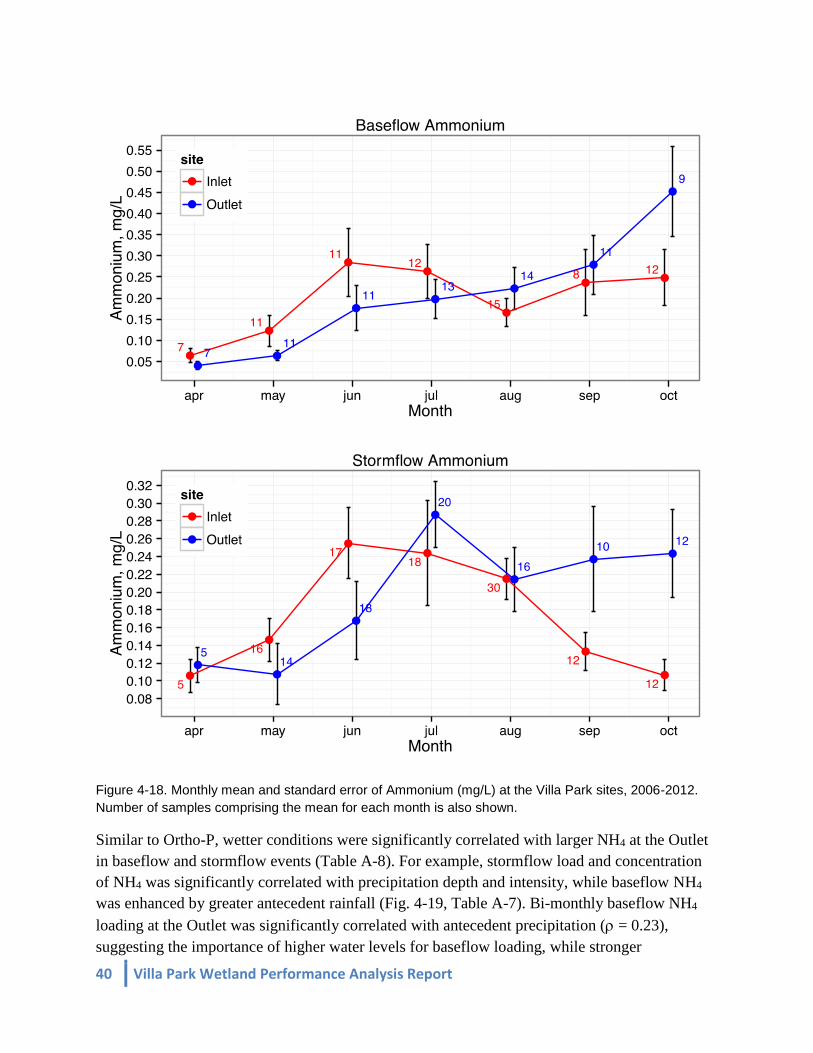
40 Villa Park Wetland Performance Analysis Report
Figure 4-18. Monthly mean and standard error of Ammonium (mg/L) at the Villa Park sites, 2006-2012.
Number of samples comprising the mean for each month is also shown.
Similar to Ortho-P, wetter conditions were significantly correlated with larger NH4 at the Outlet
in baseflow and stormflow events (Table A-8). For example, stormflow load and concentration
of NH4 was significantly correlated with precipitation depth and intensity, while baseflow NH4
was enhanced by greater antecedent rainfall (Fig. 4-19, Table A-7). Bi-monthly baseflow NH4
loading at the Outlet was significantly correlated with antecedent precipitation (= 0.23),
suggesting the importance of higher water levels for baseflow loading, while stronger

Villa Park Wetland Performance Analysis Report 41
correlations were present between precipitation depth and bi-monthly stormflow loads at both the
Inlet and the Outlet ( = 0.81 and 0.79, respectively). In addition, seasonal NH4 loads at the Inlet
and the Outlet were well-correlated with seasonal precipitation, number of events (> 0.1-in), and
number of medium (0.5-in) events or larger (R2 = 0.57 – 0.81; Table A-3). These results suggest
that frequent flushing of the wetland may not greatly dilute NH4 or deplete its source, and
persistent higher water levels may hydrologically connect more of the backwater areas where
decomposition (mineralization) may be occurring.
Figure 4-19. [a] Event storm NH4 load (lb) vs. precipitation depth (in.), and [b] Baseflow NH4
concentration (mg/L) vs. 14-day antecedent rainfall (in.), at VP Outlet. Spearman correlation coefficients
shown, ** indicates significance at p<0.001.
0
10
20
30
40
50
60
70
80
90
0 2 4 6
Ou
tle
t S
torm
NH
4 L
oa
d, lb
Event Precip Depth, in.
= 0.58**
(a)
0.0
0.5
1.0
1.5
0 2 4 6
Ou
tle
t B
as
e N
H4
Co
nc
, m
g/L
Precip in Previous 14 d, in.
= 0.47**
(b)

42 Villa Park Wetland Performance Analysis Report
Figure 4-20. Bi-monthly combined (baseflow and stormflow) loading and load ratio of NH4 over the study period (> 1.0 indicates export, < 1.0
indicates retention). The red lines in the bottom plot are the overall mean load ratio for the given year.

Villa Park Wetland Performance Analysis Report 43
4.3.3. Nitrate-Nitrite Nitrogen
Nitrate-nitrite nitrogen, much like ammonium, is a highly soluble form of N that is affected by
several N transformation processes. Primary NO3 removal processes include biological uptake as
well as denitrification (the conversion of NO3 to N2 gas under anoxic conditions), while NO3 is
produced or released by decomposition and by conversion of NH4 to NO3 (nitrification) under
aerobic conditions (Kadlec and Wallace 2009).
The retention of NO3 in the Villa Park wetland was the largest among all studied constituents,
with an overall load ratio of 0.75 (0.62 in baseflow and 0.78 in stormflow). The magnitude of net
NO3 loading varied from year to year (-18.7 lb to -58.7 lb; Fig. 4-23, Table 3-2) but was always
retained, and was well-correlated with net volume (R2 = 0.67; Fig. 4-7) and volume ratio (R2 =
0.53), but not seasonal precipitation or antecedent snowfall. NO3 loss between upstream and
downstream was statistically significant at the event, bimonthly, and monthly time scales, and for
both stormflow and baseflow (Table 3-3, 3-4). These patterns suggesting a strong effect of both
hydrology and wetland processing on NO3 retention.
Seasonal patterns in NO3 concentration were generally similar between the Inlet and Outlet (Fig.
4-21). Peak concentrations occurred in April in stormflow and baseflow at both sites, with some
variability the rest of the year in stormflow. In baseflow, concentrations were persistently near
the detection limit (0.08 mg/L) at both sites. The high spring concentrations may be explained by
nitrification of NH4 from decomposition of matter liberated from the wetland by spring
snowmelt and brought in from the watershed by early season rainfall. Rapid uptake over the
early summer by growing aquatic vegetation would result in low concentrations, especially at the
Outlet. Denitrification might also be occurring in any anoxic portions of the wetland; some
evidence is provided by corresponding late-season increases in concentrations of NH4 (Fig. 4-15)
and Ortho-P (Fig. 4-13), which may be released from anoxic sediments.
NO3 loading was enhanced by wetter conditions, as stormflow and baseflow event NO3 loads at
both sites were significantly correlated with antecedent rainfall, with generally higher correlation
coefficients for baseflow (Spearman = 0.24 to 0.43) than for stormflow ( = 0.21 to 0.27;
Table A-7) at the event scale. At the bi-monthly scale, stormflow NO3 loads at both sites were
strongly correlated with precipitation ( = 0.79 and 0.82). In addition, higher NO3 concentrations
were correlated with higher discharge in baseflow ( = 0.32) and stormflow (= 0.46) at the
Outlet (Fig. 4-22). These patterns suggest that higher water levels and flow rates in the wetland,
which would decrease hydrologic residence time, result in less removal (uptake or
denitrification) of upstream inputs of NO3. Since Inlet NO3 concentrations were significantly
higher than those at the Outlet (Table 3-3), the result of shorter residence time and less wetland
removal would be enhanced NO3 export from the wetland, rather than dilution, as might be
expected for greater flow rates and water volumes.

44 Villa Park Wetland Performance Analysis Report
Furthermore, antecedent dry days and days since 0.5-in rainfall were negatively correlated with
stormflow and baseflow NO3 event loads (r = -0.22 to -0.39), suggesting that NO3 removal by
uptake (or denitrification) was occurring while the wetland remained relatively undisturbed by
rainfall-runoff.
Figure 4-21. Monthly mean and standard error of NO3 (mg/L) at the Villa Park sites, 2006-2012. Number
of samples comprising the mean for each month is also shown.

Villa Park Wetland Performance Analysis Report 45
Temperature appeared to enhance NO3 retention, as bi-monthly baseflow NO3 loads were
significantly and negatively correlated with daily air temperature at both the Inlet and Outlet ( =
-0.25 to -0.43; Table A-6). While few significant correlations existed for other temperature
parameters, this result supports the idea that warmer conditions would lead to greater uptake of
NO3 by algae and macrophytes, while enhanced respiration and microbial processing rates at
warmer temperatures could lead to anoxia in the wetland, allowing for greater potential for
denitrification.
Figure 4-22. Outlet event NO3 concentration (mg/L) vs Outlet discharge (cfs) for [a] baseflow and for [b]
stormflow,. Spearman correlation coefficients shown, * indicates significance at p<0.05, ** indicates
significance at p<0.001. Note that the detection limit for NO3 was 0.08 mg/L; correlation would likely have
been stronger if points at the DL had been omitted.
0.0
0.1
0.2
0.3
0.4
0.0 0.5 1.0
Ou
tle
t N
O3
Co
nc
, m
g/L
Outlet Baseflow Discharge, cfs
= 0.32*
(a)
0.0
0.1
0.2
0.3
0.4
0.5
0 5 10 15
Ou
tle
t N
O3
Co
nc
, m
g/L
Outlet Stormflow Discharge, cfs
= 0.46**
(b)
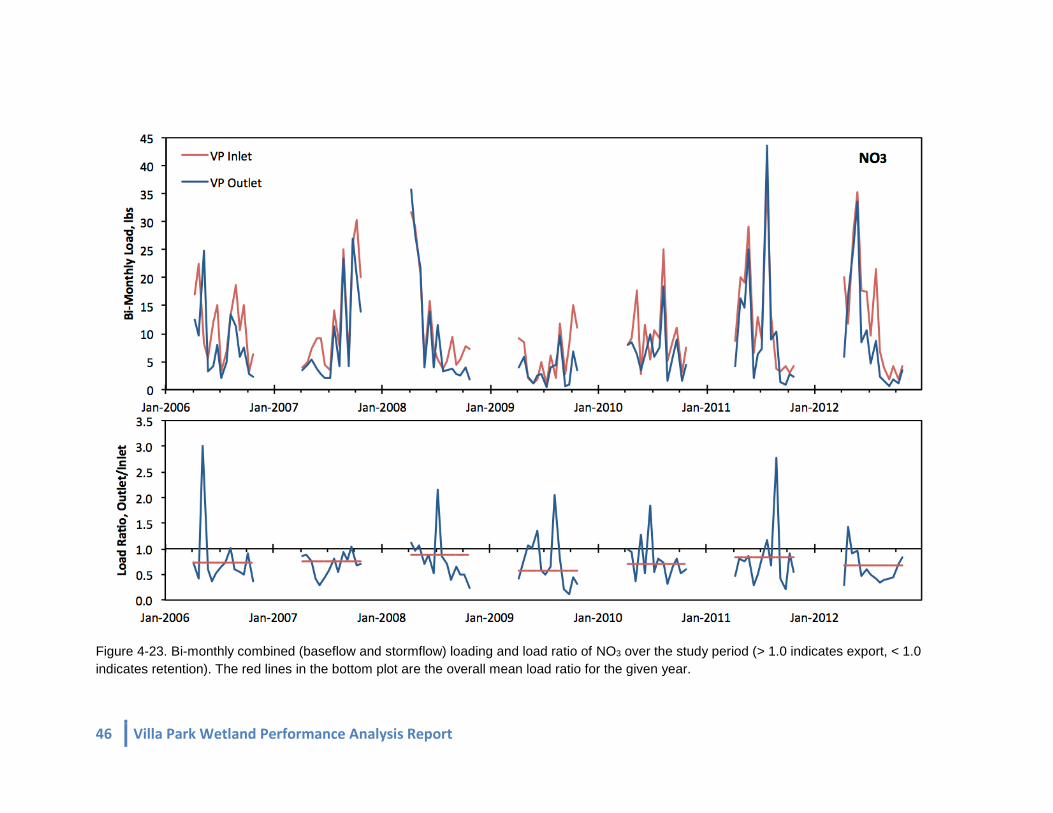
46 Villa Park Wetland Performance Analysis Report
Figure 4-23. Bi-monthly combined (baseflow and stormflow) loading and load ratio of NO3 over the study period (> 1.0 indicates export, < 1.0
indicates retention). The red lines in the bottom plot are the overall mean load ratio for the given year.

Villa Park Wetland Performance Analysis Report 47
4.4. Total Suspended Solids
The primary source of total suspended solids (TSS) is erosion of soils within the Villa Park
watershed, as well as scour and re-suspension of sediments in detention ponds and wetland cells
both upstream and within the wetland system. Sediment loss is generally a physical process, as it
drops out of suspension as flows decrease and can also be trapped by macrophytes, algae, and
debris. Sediment loading is a concern because it can increase turbidity of receiving waters, and
also may serve as a substrate for the transport of nutrients (P in particular), metals, and other
potential pollutants.
TSS export for the wetland is substantial (overall load ratio = 1.31), with overall retention of
21% (LR = 0.79) during baseflow and export of 52% (LR = 1.52) during stormflow. Net export
of TSS occurred in all years except the first (2006), and annual net TSS loads were correlated
with net volumes (R2 = 0.54; Fig. 4-7). Baseflow loads of TSS at both the Inlet and Outlet were
small relative to stormflow (28% and 17% of the combined load on average, respectively),
emphasizing the importance of stormflow for TSS export. TSS removal in baseflow and export
in stormflow were statistically significant at the event scale (Table 3-3), but load ratios were not
well-correlated with many precipitation or air temperature parameters (Tables A-4, A-5).
The significance of bi-monthly TSS export is worth noting, as TSS reduction is a primary
function of a constructed wetland like Villa Park. TSS retention only occurs during baseflow,
likely the result of decreasing flow rates that allow for deposition, and is statistically significant
only when considered for the whole monitoring season (Apr-Oct; Table 3-4).
In stormflow, TSS is a large net export from the wetland regardless of time scale considered, but
is significant only for the late season (July – Oct) period (Table A-2), when the largest load ratios
(net export) occurred in most years (Fig. 4-25). This late-season export of TSS was also seen in
the cumulative loading plots for several years, when greater than 50% of the seasonal TSS load
occurred after mid-summer (Appendix C). The cause of such large sediment loads is unclear, but
may be due to build-up of sediment during early summer flows. Hansen (2012) observed
accumulation of sediment within and behind dense canopies of macrophytes and algae in the
wetland during late summer 2011. This accumulated sediment could then be flushed out by
subsequent large, late-season storms, the effect of which may be exacerbated if vegetation has
begun senescing in the fall. In 2010, for example, a large (3-in.) June storm produced very high
TSS loading at VP Inlet but not at the Outlet, suggesting that the sediment had been effectively
trapped by the wetland. A series of storms producing over 4-in. of rainfall occurred in August of
the same year, resulting in a substantial TSS load at the Outlet (~60% of the season total).

48 Villa Park Wetland Performance Analysis Report
Figure 4-24. Monthly mean and standard error of TSS (mg/L) at the Villa Park sites, 2006-2012. Number
of samples comprising the mean for each month are also shown.
Storm event TSS loads and concentrations were significantly correlated with several
precipitation factors (Table A-8). Discharge and rainfall depth were significantly (though
weakly) correlated with storm event TSS loading at the Inlet (Spearman = 0.33 and 0.62,
respectively), and at the Outlet ( = 0.30 and 0.43). Rainfall intensity was significantly correlated
with increased event TSS concentration at the Inlet ( .28) and at the Outlet ( = 0.26),

Villa Park Wetland Performance Analysis Report 49
and with Outlet TSS load ( = 0.29). Correlations were generally stronger at the bi-monthly
scale, with larger storm TSS loads strongly correlated with greater discharge and precipitation at
both sites ( = 0.79 to 0.94; Table A-9). These patterns are sensible, as greater rainfall and the
high energy of more intense rainfall and discharge rates would increase sediment loads to the
wetland as well as contribute to scouring of wetland sediments.
In baseflow, a late season increase in TSS is also apparent at the Outlet site (and to a lesser
extent at the Inlet), as illustrated in the seasonal concentration plots (Fig. 4-24). These substantial
increases from summer to fall suggest accumulation of sediment in the downstream end of the
wetland, where it is perhaps consolidated or compacted over the winter.
A strong link between TSS and TP would be expected given that phosphorus is often transported
in particulate form with sediment. At both Villa Park sties, TSS was well-correlated with TP,
with significant positive relationships between TSS and TP in stormflow and in baseflow
(Spearman = 0.54 to 0.85; Fig. 4-11, Table A-1). For Ortho-P, higher stormflow concentrations
were significantly correlated with higher TSS concentrations at the Outlet ( = 0.46) but not at
the Inlet. Ortho-P loading at the Outlet was significantly correlated with TSS loading in both
stormflow and baseflow, but at lower than for the other forms of N and P (Table A-1).
Together these results support the conclusion that particulate P, the dominant form of P in the
wetland, is generally transported with TSS.

50 Villa Park Wetland Performance Analysis Report
Figure 4-25. Bi-monthly combined (baseflow and stormflow) loading and load ratio of TSS over the study period (> 1.0 indicates export, < 1.0
indicates retention). The red lines in the bottom plot are the overall mean load ratio for the given year. Note that high load ratios are produced
during dry periods with low Inlet TSS, and in some cases by Outlet TSS falling into the bi-monthly interval after that of a large TSS Inlet load.

Villa Park Wetland Performance Analysis Report 51
4.5. Chloride
Chloride was retained by the wetland overall (load ratio = 0.89), nearly all of which occurred in
baseflow (55,162 lb; LR = 0.76). The Cl- load was split almost evenly between stormflow and
baseflow at each site, but almost no retention occurred during stormflow. Interannual variability
in net Cl- loads and removal efficiency was related to net water volume (R2 = 0.63; Fig. 4-7) and
water load ratio (R2 = 0.66), but was poorly correlated with antecedent snowfall. As the primary
source of Cl- is likely from salt applied as a road deicer during winter, the lack of correlation
with snowfall illustrates that salt application rates may not be proportional to snowfall.
Cl- concentrations were very seasonal (Fig. 4-26), with the highest concentrations in spring and
lowest in mid-summer, in both stormflow and baseflow. By comparison, mean baseflow
concentrations were higher in winter (Dec – Feb) than during the monitoring season (348 mg/L
and 370 mg/L at the Outlet and Inlet, respectively; Janke 2013). The increase in concentrations
in September and October may be related to lower flow rates or water levels in the wetland, or to
release of Cl- from senescing vegetation. In addition, as evapotranspiration rates in the wetland
decrease in the fall, water tables would rise and inflow of Cl--contaminated shallow groundwater
may enhance fall Cl- concentrations. While there is no direct evidence for Cl- contamination of
groundwater in the Villa Park watershed, a recent study has shown Cl- concentrations in excess
of 250 mg/L in shallow (< 30 ft) wells in sand and gravel aquifers across the Twin Cities
Metropolitan area (Kroening and Ferry 2013). Furthermore, baseflow Cl- concentrations at two
CRWD monitoring sites (East Kittsondale and Trout Brook East Branch) exceed the MPCA
chronic standard of 230 mg/L Cl- year-round, suggesting contamination of shallow groundwater
by road salt (Janke 2013).
Cl- cumulative loading also illustrates the seasonality of Cl- concentrations in both stormflow and
baseflow (Appendix C), with high loading rates in the spring that level off in summer. In some
years loading rates increase again in the fall, both in stormflow and baseflow. Large events, such
as the mid-August event in 2011, appear to result in increased baseflow loading rates, as was the
case for other dissolved nutrients.
Several results suggest that the wetland may be recharging groundwater: Cl- loading and
concentrations in baseflow were significantly lower at the Outlet (Table 3-3), and a large net loss
of Cl- was observed during baseflow over the whole study period. Cl- should be mostly
conservative, unlike the other constituents in this study. Therefore, the Cl- load ratio should be
roughly 1.0 without any processes present to remove Cl-, though some Cl- could perhaps be
temporarily stored in soils or aquatic plants. Lower baseflow Cl- concentrations were
significantly correlated with higher daily air temperatures ( = -0.44 to -0.53 at the Outlet), a
somewhat puzzling result given that higher temperatures would be expected to enhance
evaporative losses and result in higher Cl- concentrations. This result suggests that perhaps plants
are taking up Cl- during warmer periods, when evapotranspiration rates would be higher (Kadlec
and Wallace 2009).

52 Villa Park Wetland Performance Analysis Report
Stormflow Cl- was negatively correlated with rainfall depth and rainfall intensity at both sites (
= -0.27 to -0.49), suggesting dilution by rainfall-runoff of Cl- stored in the wetland. Cl-
concentration was also significantly correlated with antecedent rainfall parameters, increasing for
drier periods and decreasing for wetter periods. This pattern also suggests that even if the
wetland is losing some water to groundwater or evaporation, Cl- is likely being stored in the
water, sediment, and vegetation of the wetland.
Figure 4-26. Monthly mean and standard error of Cl- (mg/L) at the Villa Park sites, 2006-2012. Number of
samples comprising the mean for each month is also shown.
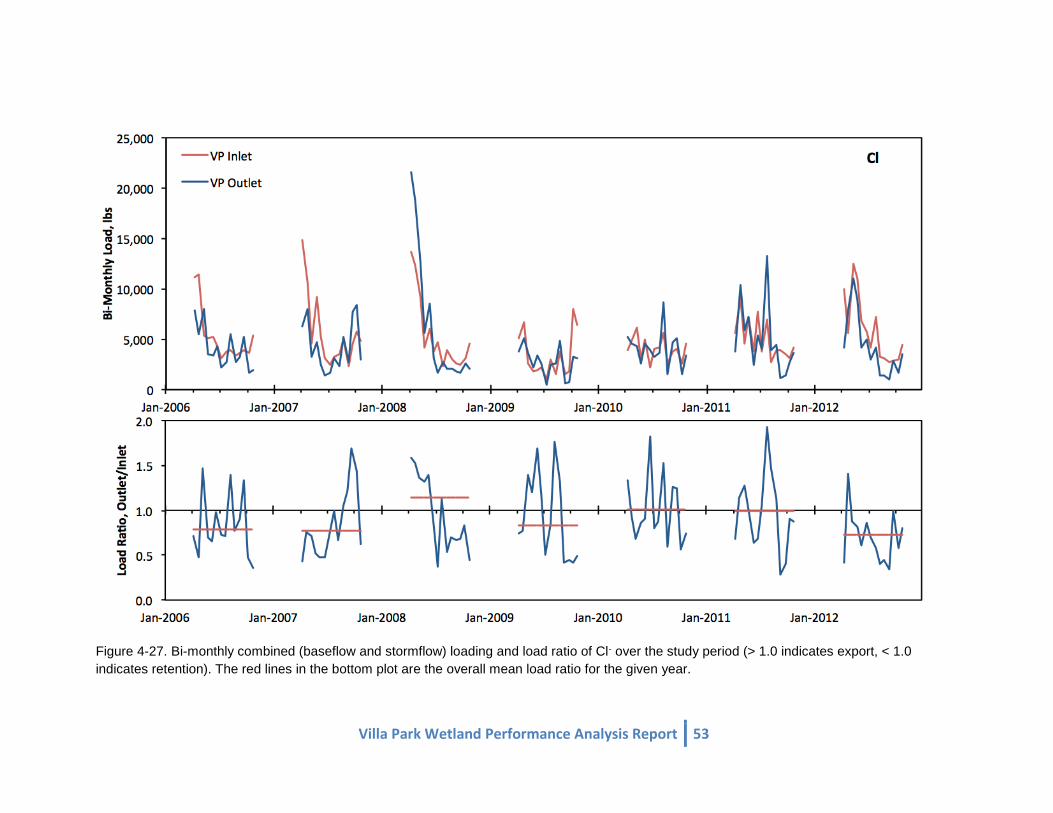
Villa Park Wetland Performance Analysis Report 53
Figure 4-27. Bi-monthly combined (baseflow and stormflow) loading and load ratio of Cl- over the study period (> 1.0 indicates export, < 1.0
indicates retention). The red lines in the bottom plot are the overall mean load ratio for the given year.

54 Villa Park Wetland Performance Analysis Report
5. Supplemental Data and Analysis
Dissolved oxygen of less than 2.0 mg/L can result in the release from sediments of iron-bound P
(often as Ortho-P), and can also stimulate denitrification or release of NH3 (Kadlec and Wallace
2009). Results of this analysis show that a significant loss of NO3 is occurring in the wetland
(Table 3-2), providing some evidence for denitrification (and thus for anoxia), although uptake
can also cause a substantial loss of both NH4 and NO3 (Kadlec and Wallace 2009). As might be
expected, Ortho-P concentration was significantly and positively correlated with NH4 at both
sites for stormflow and baseflow ( = 0.26 to 0.64), while a weakly significant, negative
correlation was present for NO3 in stormflow at the Outlet ( = -0.24), providing some evidence
for anoxic conditions required for denitrification (Fig. 5-1; Appendix A-1).
An inspection of other data sets, including from CRWD monitoring efforts in 2007 (Wenck
Associates 2010) and from the work of Hansen (2012) provide support for persistent hypoxic and
anoxic conditions in the middle cells of the wetland (Appendix B). For example, dissolved
oxygen measurements by CRWD in the sedimentation basin, Wet Cells 1, 3, and 5, as well as the
wet pond show anoxic conditions (< 0.5 mg/L) to be present in as much as 65% of all
measurements (Wet Cell 3; Table 5-1). Hansen (2012) noted that anoxic conditions within the
submerged macrophytes in Cell 1 in 2011 gradually increased from the sediment upward in the
water column over the growing season. While the sample size is low (n = 23) and DO
measurements were somewhat sparse, anoxic conditions in the middle three cells of the wetland
appeared to influence the dissolved inorganic nutrients: mean concentration of Ortho-P, NO3,
and NH4 in storm samples at the Outlet during summer and fall 2007 were 0.065 mg/L, 0.17
mg/L, and 0.40 mg/L, respectively when mean DO was less than 2.0 mg/L in Wet Cells 1, 3, and
5; concentrations were 0.052 mg/L (lower), 0.20 mg/L (slightly higher), and 0.40 mg/L
(unchanged), respectively, under oxic conditions (Appendix B). Higher Ortho-P from sediment
release and lower NO3 from denitrification might be expected, while relatively unchanged NH4
suggests that it is primarily a decomposition product.
Table 4-1. Persistence of hypoxia and anoxia based on Dissolved Oxygen measurements in several
locations in the Villa Park wetland, as a percentage of total measurements at the given thresholds. Sites
are organized left-to-right from upstream (Sedimentation Basin) to downstream (Wet Pond, WP).
Sed Basin WC 5 WC 3 WC 1 WP
Hypoxia (0.5 - 2.0 mg/L) 14.6% 37.4% 16.0% 20.0% 40.6%
Anoxia (< 0.5 mg/L) 34.2% 45.0% 64.9% 41.1% 7.5%
If portions of wetland are channelized, then backwater areas could become anoxic under
conditions of higher temperatures and large inputs of organic matter, such as after large storms or
vegetation senescence in the fall or during shifts in the vegetation community, e.g. when
duckweed covers the water surface in late summer and shades vegetation below it in the water

Villa Park Wetland Performance Analysis Report 55
column (A. Hansen, pers. comm.). If these areas of hydrologically disconnected wetland were
becoming anoxic and releasing Ortho-P, then concentrations might be expected to increase for
drier antecedent conditions or with days since the most recent large rainfall event. However, the
opposite trends were found for stormflow and baseflow Ortho-P at the Outlet (i.e. higher
concentrations and loads for wetter conditions). In addition, very little correlation was found
between measured DO in the wetland and stage at either the Inlet or Outlet, nor were Outlet
concentrations well correlated with DO measurements (data in Appendix B). Alternate
explanations may be that wetter conditions keep the backwater areas from drying out and re-
oxygenating, or that frequent flushing or more intense flows are able to leach the abundant
organic matter in the backwaters.
Figure 5-1. [a] Outlet storm event NH4 vs. Ortho-P concentration (mg/L), [b] Outlet baseflow NH4 vs
Ortho-P concentration (mg/L), and [c] Outlet storm event Ortho-P vs. NO3 concentration (mg/L). Pearson
correlation coefficients are shown; * indicates significance at p<0.05, ** significance at p<0.001. Note the
detection limit of NO3 was 0.08 mg/L.
0.0
0.1
0.2
0.0 0.2 0.4 0.6 0.8
Ou
tle
t S
torm
NH
4,
mg
/L
Outlet Storm Ortho-P Conc, mg/L
= 0.26*
(a)
0.0
0.1
0.2
0.0 0.5 1.0 1.5
Ou
tle
t B
as
e N
H4, m
g/L
Outlet Base Ortho-P, mg/L
= 0.45**
(b)
0.0
0.1
0.2
0.0 0.2 0.4 0.6 0.8
Ou
tle
t S
torm
Ort
ho
-P,
mg
/L
Outlet Storm NO3, mg/L
= -0.24*
(c)

56 Villa Park Wetland Performance Analysis Report
6. Conclusions
6.1. Hydrology and Climate
Snowfall during the previous winter was well-correlated with net (Outlet – Inlet) volumes
in the wetland (water export)
Frequency of large storms was more important than total rainfall for water export
As water export from the wetland increased, so did the net loads and load ratios of TP,
TN, NO3, TSS, and Cl-
By contrast, NH4 and Ortho-P net loads were not generally impacted by net volumes, and
instead were influenced more by precipitation and to a lesser extent air temperature
Stormflow was responsible for 60% to 80% of total seasonal loads for all constituents
Water loss in baseflow (i.e. Inlet > Outlet) was likely due to evapotranspiration within the
wetland, but a corresponding loss of a conservative constituent (Cl-) suggested that some
groundwater recharge may be occurring
6.2. Phosphorus
A small net loss of TP was observed over the study period (78 lb, or ~6% of Inlet TP),
driven by retention during baseflow and slight export during stormflow, though TP loss
and export were not statistically significant on any time scale
Year-to-year TP removal was affected by hydrologic conditions, including seasonal
rainfall, snowfall during the previous winter, and net volume (Outlet – Inlet)
TP loading in stormflow was driven by stormwater volume and precipitation depth
Particulate P was the primary component of TP, and TSS and TP loads were well-
correlated at both the Inlet and Outlet ( = 0.54 to 0.85)
Flushing of summer-deposited P likely occurred during the fall in some years
Ortho-P had the highest load ratio of all constituents (1.57) over the study period and was
exported by the wetland (104 lb), almost entirely in stormflow
Ortho-P comprised 10% to 24% of TP on average
Export of Ortho-P was affected more strongly by precipitation patterns than by hydrology
(e.g. was more strongly correlated with seasonal rainfall than with net volume),
suggesting the importance of wetland processing
Higher Ortho-P concentrations were caused by warmer weather conditions; microbial
processing rates increase with temperature, and would be responsible for processes that
produce Ortho-P (decomposition, release from anoxic sediments)
According to the Villa Park Wetland Management Plan (Wenck Associates 2010), the
management target for the wetland was to reduce TP flux from the wetland to 109 lbs or less.
Over the course of the monitoring period analyzed in this report (2006 – 2012), seasonal Outlet

Villa Park Wetland Performance Analysis Report 57
loading exceeded this target in all years except 2009 (106 lbs), with loads exceeding 200 lbs in 4
of the 7 years. To reduce TP export to an average of 106 lbs / year over the study period, an
additional reduction of roughly 71 lbs would have been needed, equivalent to a load ratio of
0.41; load ratio over the study period was only 0.94. Monitoring in 2014 and subsequent years
should show an improvement in TP export as a result of dredging of the lower wetland in 2013.
Additional inputs of P to the wetland are likely, and therefore the relatively simple approach of
comparing the Inlet and Outlet loading, as employed in this report, may limit the applicability of
the conclusions. Other potential sources include outflow from several unmonitored storm drains
and a small wet pond downstream of the Inlet site (representing roughly 17% of the Villa Park
drainage area), atmospheric deposition, groundwater, and internal sources from decades of
accumulation in the wetland. Wenck Associates (2010) estimated that the inflow P load to the
wetland from the Inlet site was only 38% of total inputs, with internal processes (primarily
sediment release) accounting for 45%. In 2007, this same study conducted leaching of soil cores
collected across the wetland, and estimated sediment release to be 126 lbs, which by itself would
have exceeded the loading target of 109 lbs.
Ortho-P export was relatively significant at 15 lbs per year over the study period, suggesting that
P release from decomposition and anoxic sediments within the wetland are not negligible. It is a
small quantity compared to the amount of reduction needed to meet water quality goals, and
management is potentially difficult. Ardon et al. (2010) showed increased soluble reactive
phosphorus (SRP) export from a restored wetland that was drawn down and re-flooded, due to
SRP release from anoxic sediments. In addition, in a study of N and P retention in 57 wetlands
across world, Fisher and Acreman (2004) recommended limiting the presence of reducing
(anoxic) conditions if P removal is a management goal due to the tendency of soluble P to be
released from anoxic sediments. While those studies occurred on much larger scales, a similar
response may have been observed at the Villa Park wetland, as Ortho-P export was significant
and anoxia appears persistent within the wetland (Hansen 2012, Wenck Associates 2010).
6.3. Nitrogen
TN was retained by the wetland over the study period (load ratio = 0.80), both in
stormflow (LR = 0.87) and especially in baseflow (LR = 0.67)
NH4 was a significant portion of TN (9% to 15%), and generally comprised more of TN
loading than NO3
The wetland exported 208 lb of NH4 overall (load ratio of 1.20), with export in stormflow
(233 lb; LR = 1.33), and a small amount of retention in baseflow (-25 lb; LR = 0.93)
NH4 was not greatly affected by wetland hydrology, and loads and concentrations were
not significantly different between the Inlet and Outlet
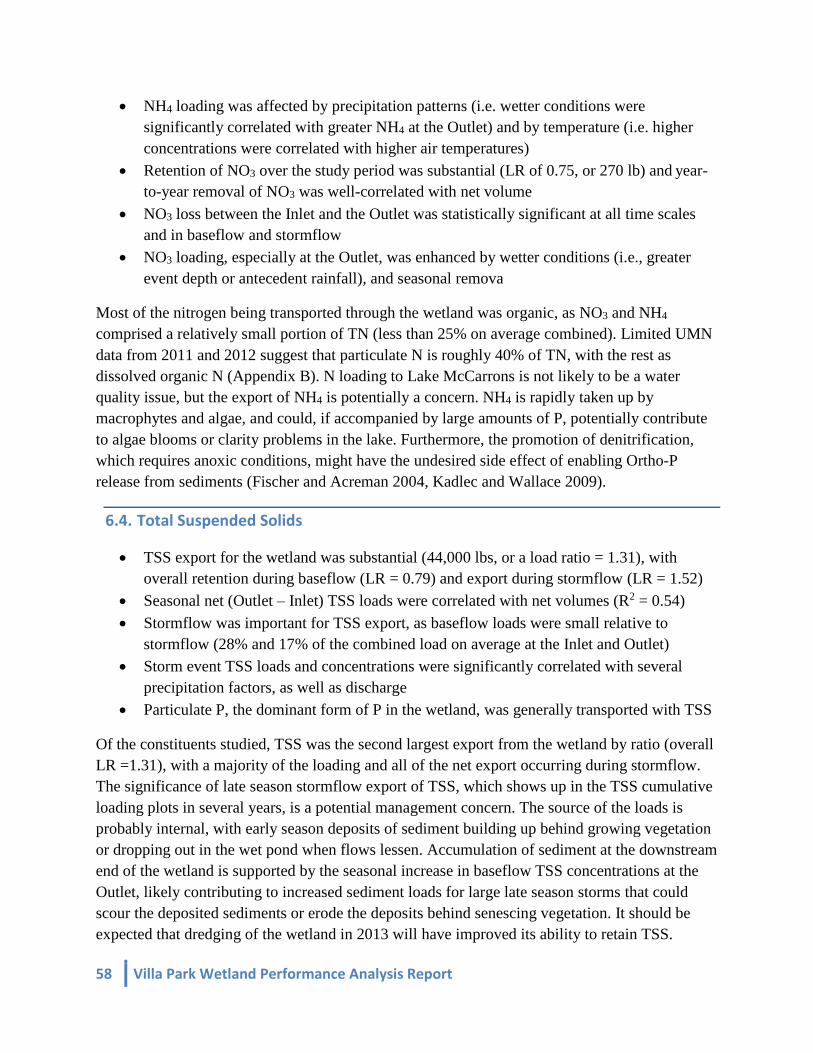
58 Villa Park Wetland Performance Analysis Report
NH4 loading was affected by precipitation patterns (i.e. wetter conditions were
significantly correlated with greater NH4 at the Outlet) and by temperature (i.e. higher
concentrations were correlated with higher air temperatures)
Retention of NO3 over the study period was substantial (LR of 0.75, or 270 lb) and year-
to-year removal of NO3 was well-correlated with net volume
NO3 loss between the Inlet and the Outlet was statistically significant at all time scales
and in baseflow and stormflow
NO3 loading, especially at the Outlet, was enhanced by wetter conditions (i.e., greater
event depth or antecedent rainfall), and seasonal remova
Most of the nitrogen being transported through the wetland was organic, as NO3 and NH4
comprised a relatively small portion of TN (less than 25% on average combined). Limited UMN
data from 2011 and 2012 suggest that particulate N is roughly 40% of TN, with the rest as
dissolved organic N (Appendix B). N loading to Lake McCarrons is not likely to be a water
quality issue, but the export of NH4 is potentially a concern. NH4 is rapidly taken up by
macrophytes and algae, and could, if accompanied by large amounts of P, potentially contribute
to algae blooms or clarity problems in the lake. Furthermore, the promotion of denitrification,
which requires anoxic conditions, might have the undesired side effect of enabling Ortho-P
release from sediments (Fischer and Acreman 2004, Kadlec and Wallace 2009).
6.4. Total Suspended Solids
TSS export for the wetland was substantial (44,000 lbs, or a load ratio = 1.31), with
overall retention during baseflow (LR = 0.79) and export during stormflow (LR = 1.52)
Seasonal net (Outlet – Inlet) TSS loads were correlated with net volumes (R2 = 0.54)
Stormflow was important for TSS export, as baseflow loads were small relative to
stormflow (28% and 17% of the combined load on average at the Inlet and Outlet)
Storm event TSS loads and concentrations were significantly correlated with several
precipitation factors, as well as discharge
Particulate P, the dominant form of P in the wetland, was generally transported with TSS
Of the constituents studied, TSS was the second largest export from the wetland by ratio (overall
LR =1.31), with a majority of the loading and all of the net export occurring during stormflow.
The significance of late season stormflow export of TSS, which shows up in the TSS cumulative
loading plots in several years, is a potential management concern. The source of the loads is
probably internal, with early season deposits of sediment building up behind growing vegetation
or dropping out in the wet pond when flows lessen. Accumulation of sediment at the downstream
end of the wetland is supported by the seasonal increase in baseflow TSS concentrations at the
Outlet, likely contributing to increased sediment loads for large late season storms that could
scour the deposited sediments or erode the deposits behind senescing vegetation. It should be
expected that dredging of the wetland in 2013 will have improved its ability to retain TSS.

Villa Park Wetland Performance Analysis Report 59
References
Ardón M, Montanari S, Morse JL, Doyle MW, and Bernhardt ES (2010). Phosphorus export
from a restored wetland ecosystem in response to natural and experimental hydrologic
fluctuations, J. Geophys. Res., 115
Capitol Region Watershed District (CRWD) (2013a) Capitol Region Watershed District 2013
Lakes Monitoring Report. 163 pp.
Capitol Region Watershed District (CRWD) (2013b) Capitol Region Watershed District 2013
Stormwater Monitoring Report. 358 pp.
Coon WF, Bernard JM, and Seischab FK (2000). Effects of a Cattail Wetland on Water Quality
of Irondequoit Creek near Rochester, New York. USGS Water Resources Investigations Report
00-0432. 81 pp.
Fischer J and Acreman MC (2004). Wetland nutrient removal: a review of the evidence.
Hydrology and Earth Sys Sci, 8(4): 673-685.
Hansen, AT (2012). The effects of fluid flow and epiphytes on submersed aquatic vegetation.
Dissertation, University of Minnesota. 131 pp.
Helsel DR and Hirsch RM (2002). Statistical Methods in Water Resources Techniques of Water
Resources Investigations, Book 4, Chapter A3. U.S. Geological Survey. 522 pages.
Janke BD, Finlay JC, Hobbie SE, Baker LA, Sterner RW, Nidzgorski D, Wilson BN (2014).
Contrasting influences of stormflow and baseflow pathways on nitrogen and phosphorus export
from an urban watershed. Biogeochemistry. doi: 10.1007/s10533-013-9926-1.
Janke BD (2013). Summary and Analysis of Water Quality Data from the Capitol Region
Watershed District’s Stormwater Monitoring Program, 2005-2012. University of Minnesota—
Department of Ecology, Evolution and Behavior: St. Paul, MN.
Kadlec RH and Wallace S (2009). Treatment Wetlands, 2nd Ed. Taylor-Francis: Boca Raton, FL.
Kroening S and Ferrey M (2013). The Condition of Minnesota’s Groundwater, 2007-2011.
Minnesota Pollution Control Agency, St. Paul, MN: 65pp.
Monson B (2007). Effectiveness of Stormwater Ponds/Constructed Wetlands in the Collection of
Total Mercury and Production of Methylmercury. MN Pollution Control Agency: 41 pp.
Oberts GL and Osgood RA (1991). Water-Quality Effectiveness of a Detention/Wetland
Treatment System and Its Effect on an Urban Lake. J Envir Mgmt 15(1), 131-138.
Wenck Associates Inc (2010). Villa Park Wetland System Management Plan. Wenck File #1486-
14. 283 pp.

Our Mission is to protect, manage and improve the water resources of Capitol Region Watershed District
Regular Meeting of the Capitol Region Watershed District (CRWD) Board of Managers, for Wednesday,
June 3, 2015 6:00 p.m. at the office of CRWD, 1410 Energy Park Drive, Suite 4, St. Paul, Minnesota
REGULAR MEETING MINUTES
I. A) Call to Order of Regular Meeting (President Joe Collins)
Managers
Joe Collins
Seitu Jones absent w/notice
Shirley Reider
Mike Thienes absent
w/notice
Mary Texer
Staff Present
Mark Doneux, CRWD
Anna Eleria, CRWD
Bob Fossum, CRWD
Forrest Kelley, CRWD
Britta Suppes, CRWD
Michelle Sylvander, CRWD
Nate Zwontizer, CRWD
Public Attendees Carrie Wasley, Ramsey
Conservation District
Todd Shoemaker, Wenck
Associates
B) Review, Amendments and Approval of the Agenda
President Collins asked for additions or changes to the agenda. Administrator Doneux requested item III. C.
Permit 15-014 East 7th Streetscape Withdrawal and Action Item IV. D. Approve comment period for MS4
Annual Report.
Motion 15-132: Approve the June 3, 2015 agenda with the addition of III. C. Permit 15-014 East 7th
Streetscape withdrawal and Action Item IV. D. to Approve the comment period for MS4 Annual Report.
Texer/Reider
Unanimously approved
II. Public Comment – For Items not on the Agenda
No Public Comments.
III. Permit Applications and Program Updates
A) Permit #14-041 Higher Ground (Kelley)
Mr. Kelley reviewed Permit #14-041 Higher Ground. The applicant, Catholic Charities, is constructing a new
Dorothy Day Center. The applicable rules are Stormwater Management (Rule C), Flood Control (Rule D), and
Erosion and Sediment Control (Rule F). The disturbed area of this project is 1.82 acres with 1.16 acres of
impervious surface.
Motion 15-133: Approve permit #14-041 Higher Ground with 5 conditions.
June 17, 2015 Board Meeting
V. Action Item A) Approve Minutes
of June 3, 2015
DRAFT Regular Board Meeting
(Sylvander)

Our Mission is to protect, manage and improve the water resources of Capitol Region Watershed District
1. Provide documentation of recorded maintenance agreement with Ramsey County.
2. Provide a copy of the NPDES permit.
3. Revise HydroCAD model to more accurately reflect the sand filtration layer. Either remove the layer
from the model (increase the bottom elevation to the bottom of the rock), or justify a separate void
ratio (likely 20-25%) just for the sand layer.
4. Provide plans for the green roof to match the HydroCAD model. The provided plans do not include
information on the number of roof drains, diameters and elevations. Therefore, rate control
predicted by the HydroCAD model cannot be verified.
5. Provide pretreatment of runoff for “Storage System A”.
Reider/Texer
Unanimously approved
B) Permit # 15-026 Victoria Park Apartments (Kelley)
Mr. Kelley reviewed Permit #15-026 Victoria Park Apartments. The applicant, Chase Real Estate, Inc., is
constructing a new apartment complex, parking lot, and associated amenities. The applicable rules are
Stormwater Management (Rule C), Flood Control (Rule D), and Erosion and Sediment Control (Rule F). The
disturbed area of this project is 3.89 acres with 2.61 acres of impervious surface.
Motion 15-134: Approve permit 15-026 Victoria Park Apartments with 4 conditions:
1. Provide documentation of recorded maintenance agreement with Ramsey County.
2. Revise plans to include the following:
a. Provide signage that deters snow management from using the filtration ponds for snow storage.
b. Provide detail that shows a 1 inch drop from pavement to filtration basins to ensure water entering is
not obstructed.
c. Revise filtration soil mix to be 80% sand and 20% compost.
3. Revise HydroCAD model to route the exfiltration device for Pond 2P to the culvert rather than the
horizontal orifice.
4. Revise plans or HydroCAD to be consistent:
a. Plans indicate the orifice inside CBMH has a 6” diameter. The HydroCAD model indicates 4”
diameter.
b. Plans indicate the outlet for the infiltration trench is a 4” perforated drain tile at elevation 778.0. The
HydroCAD model does not list this outlet.
Reider/Texer
Unanimously approved
Manager Reider asked for clarification on condition #3 exfiltration. Mr. Shoemaker clarified that exfiltration
means the same as infiltration
C) Permit #15-014 East 7th Streetscape (Kelley)
The project has been withdrawn. The project is no longer moving forward. The City is requesting the volume
reduction be added back into their bank.

Our Mission is to protect, manage and improve the water resources of Capitol Region Watershed District
Motion 15-135: Approve deposit of 4,476 cubic feet back into the volume reduction bank for permit #15-014
East 7th Streetscape.
Reider/Texer
Unanimously approved
IV. Special Reports – 2014 Lakes Report, Britta Suppes
Ms. Suppes reviewed that there are five lakes within the boundaries of CRWD: Como Lake, Crosby Lake, Little
Crosby Lake, and Loeb Lake in St. Paul, and Lake McCarrons in Roseville. Each lake is collaboratively
monitored by Ramsey County Public Works (RCPW), Ramsey Conservation District (RCD), the Minnesota
Department of Natural Resources (DNR), and CRWD to assess overall health, compliance with water quality
standards, and to determine if each lake supports its designated uses for swimming, fishing, and/or aesthetics.
Data has been collected annually on each lake for varying periods of record.
In 2014, the Managers reviewed the Enhanced Lake Biological Monitoring Work Plan, which included
initiating annual fisheries surveys on each CRWD lake, increasing the frequency of macrophyte data collection
during the growing season, performing additional spring and fall water quality sampling, and continuously
monitoring water level from April-November. The data collected through these expanded efforts are included
in the 2014 Lakes Monitoring Report.
Ms. Suppes reviewed the draft of the 2014 Lakes Monitoring Report with the Managers highlighting key
findings from the monitoring efforts. Individual lake chapters of the monitoring report will be available on the
CRWD website. The purpose of the report is to characterize the overall lake health and water quality in 2014.
The history of annual monitoring reports helps to examine trends and management make decisions for
continued protection. Based on the findings of the 2014 Lake Monitoring Report, Ms. Suppes reviewed the
goals and recommendations for the 2015 season.
For 2014, water quality in Como Lake improved over the previous year, while water quality degraded in
McCarrons, Crosby, and Little Crosby Lakes. Loeb Lake had no change and maintained its high water quality.
1. Analyze additional chemical and physical parameters.
2. Conduct sediment analyses of all District lakes.
3. Complete a comparative analysis of all parameters measured.
4. 2015 Fisheries Surveys.
5. Lake McCarrons Alum Treatment Efficiency Evaluation.
The managers were very pleased with the report. President Collins felt the report was well presented. Manager
Texer asked if any other agencies use the data collected in the report. Ms. Suppes replied that the University of
Minnesota and Department of Natural Resources Fishery use the data collected in the report.
Motion 15-136: Accept 2014 Lakes Monitoring Report.
Jones/Reider
Unanimously approved
V. Action Items
A) AR: Approve Minutes of the May 20, 2015 Regular Meeting (Sylvander)

Our Mission is to protect, manage and improve the water resources of Capitol Region Watershed District
Motion 15-137: Approve Minutes of the May 20, 2015 regular meeting.
Texer/Reider
Unanimously approved
B) AR: Approve Consultant Selection and Contract Willow Reserver Restoration Plan (Eleria)
Ms. Eleria reviewed that CRWD, in partnership with the City of Saint Paul and District 6 Planning Council, have
sought statements of qualifications and cost estimates from two qualified and interested consulting firms for the
development of the Willow Reserve Restoration Plan.
Applied Ecological Services (AES) and EOR, Inc. each submitted a statement of qualifications and cost estimate
for the project. AES’ base cost estimate is $31,680 while EOR’s base cost estimate was slightly higher, $34,863.
An interagency team comprised of two CRWD staff and three Saint Paul staff reviewed the statements of
qualifications and cost estimates. Out of the five team members, four are recommending AES because of their
strong relevant project examples and adequate allocation of time for project meetings and coordination.
AES presented two optional tasks for the project, baseline survey of select wildlife species and development of
water quality improvements concepts. CRWD staff would like the option of determining at a later time, in
consultation with AES and project partners, on whether or not to incorporate one or both optional tasks. This
would increase AES total cost estimate to $42,250. The amended 2015 budget for this project is $40,000.
Motion 15-138: Approve Applied Ecological Services as the consultant for the Willow Reserve Restoration Plan;
authorize Administrator to execute a consultant services agreement with Applied Ecological Services in an
amount not to exceed $31,680; and authorize Administrator to execute amendments in an aggregate amount not
to exceed $10,570 for a total consultant services agreement amount of $42,250.
Reider/Texer
Unanimously approved
C) AR: Approve Consultant Agreement with Houston Engineering for the Como Regional Park
Stormwater Management Plan – Phase 1 Stormwater Inventory (Zwonitzer)
In September, 2014, the CRWD Board approved a Memorandum of Understanding (MOU) with the City of St.
Paul to develop a stormwater management master plan for Como Regional Park. The MOU outlined shared goals
of intentional management of stormwater as a resource, and protection of the water resources within Como Park.
Subjects that must be addressed include an inventory of existing conditions and development of a 10-20 year
stormwater plan.
CRWD staff will be coordinating the first phase of the plan development; a stormwater inventory. The inventory
will include stormwater infrastructure within the park and the contributing subwatershed. It will involve collecting
information on existing park development, impervious surfaces, and analyzing existing treatment. CRWD has
requested services from Houston Engineering Inc. (HEI) for Phase 1.
CRWD staff are requesting authorization to enter into an agreement with HEI for Task 1 of the proposal. There
is $70,000 in the 2015 Budget for the Como Stormwater plan. HEI estimates the level of effort for Phase 1 to be
around $55,000 though there is uncertainty regarding the availability and location of City records. Initiating Task
1, Data Collection and Review, will result in the information needed to accurately estimate the additional work
required to complete the inventory. Task 1 is estimated to be $21,100. Staff will come back to the Board with a
request to initiate the remaining tasks once more accurate estimates are obtained.

Our Mission is to protect, manage and improve the water resources of Capitol Region Watershed District
Motion 15-139: Approve Consultant Agreement with Houston Engineering for Task 1 of the stormwater
inventory for an amount not to exceed $21,100, and authorize the Administrator to execute the agreement and
change orders not to exceed $5,000.
Reider/Texer
Unanimously approved
VI. Unfinished Business
A) 2010 Watershed Management Plan Mid-Term Review (Fossum)
Mr. Fossum reviewed that a special meeting was held in April with members of the CAC. A draft of the
Watershed Plan Mid-Term was presented for recommendations. The CAC was able to provide constructive input
which was used to change the structure of the report. Additional discussion is planned for June 10th with the
CAC.
B) Ford Site Update (Fossum)
Mr. Fossum reviewed the Goal and Vision Statement for stormwater and water features at the former Ford Site.
The Managers discussed the draft of the Stormwater Goal/Vision Statement. Mr. Fossum invited the Managers
to attend a public meeting scheduled for June 23rd from 7:00-8:30, at the Gloria Dei Church by the City of St.
Paul. The Great River Park Plan will be reviewed.
VII. General Information
Administrator Doneux gave his Administrators report.
1) Maintenance, Research and Monitoring
May precipitation was 4.42 inches (through May 28th) which is above the 3.24 average. Most field
equipment not installed in April was set up and made operational in May. Work continued in May on the
planning, set up and installation of monitoring stations for the Trout Brook Nature Sanctuary (TBNS).
CRWD is partnering with the City of St. Paul and others to conduct a comprehensive monitoring program at
the TBNS. CRWD will directly lead the water quality and discharge monitoring at six locations as well as
the aquatic biological and stream geomorphological monitor. Other monitoring of the site includes
performance testing of the Iron Enhanced Sand Filter, vegetation and wildlife. When not in the field this
busy spring season staff have been working on the lakes and stormwater reports as well as enhancing the
analysis and reporting aspects of the WISKI database. Infiltration monitoring of the AHUG system was
suspended in May. The Upper Villa site is being considered as a better location for the installation and
monitoring water infiltrated in an underground system.
2) Education and Outreach
May events included the Great River Gathering, Montana Greenbrier Planting Day, Arbor Month and the
Trout Brook Nature Sanctuary grand opening. Staff are currently working on June events that will include
the Montreal Avenue RSVP Planting Day, Landscape Revival Native Plant Expo and Market and Bugs
Night Out. Staff have been in discussions with Freshwater Society staff about the feasibility of participating
in the Master Water Steward program. Staff have also been evaluating the opportunities for a service
learning student to support the CAC. The CAC is likely to adopt to include a Project of the Year category in

Our Mission is to protect, manage and improve the water resources of Capitol Region Watershed District
the 2015 CRWD Awards Program. Press releases were drafted and submitted for the CHS Field Grand
Opening regarding the rainwater harvesting system. On-boarding continued for our Strategic
Communications consultant, Fourth Sector. Staff are investigating a Client Relationship Management
system to better manage citizen contacts.
3) Regulatory Program
CRWD and RWMWD rule amendments went into effect on May 1st. Much of the work in May shifted
focus from permit close outs to permit inspections as the construction season ramped up. There are
currently 26 permits active for 2015 which is ahead of pace for 2014 which had a total of 41 permits.
Standing weekly inspections include the Cayuga bridge project (12-017), MN Pass/35E (13-003) and
Kellogg Boulevard (15-017). Staff attended a meeting with the City of St. Paul regarding the scope,
function and construction of the Green Line Tree Trench System.
4) Capital Improvements and Projects
The major work on capital improvements in May was the bidding of the Upper Villa Project. Bids were
opened April 24th. Staff worked with our Project Engineer SRF to review bids and make a recommendation
of award to New Look Contracting on May 20th. Punch list items are being completed on the Highland
Ravine and Curtiss Pond projects. The Opti RTC system at Curtiss Pond will installed in June. Permitting
and contracting was completed for the 2015 Lake McCarron’s Aquatic Plant harvesting.
5) Studies and Plans
Work is wrapping up on the Willow Reserve History Report being conducted by Blue Stem Heritage Group.
This is going to be an update to the History report that District 6 completed about a year ago. Proposals
from EOR and Applied Ecological Services were received by staff for developing the Willow Reserve
Restoration Plan. . Staff attended a U of M Capstone presentation on the Willow Reserve Restoration
Project. Discussions are ongoing with the landowner of the Lafayette Park Campus and MPCA to address
concerns about liability as it relates to soil investigation and possible construction of BMPs. The Board
approved a contract amendment for the Eustis Street Stormwater Improvement project to expand the
analysis to include a hydrologic and hydraulic study of the contributing watershed to the project area.
Significant time and effort continues on planning work for the Ford Site. Much of the analysis completed in
May is working towards the June 23 Public meeting on stormwater, public realm and parks. Work
continues on the Watershed Management Plan Mid-Term Review. Work will continue this summer with the
final draft ready in July or August. Staff worked with City of St. Paul staff to draft the scope of work for
Phase I of the Como Regional Park Stormwater Plan. CRWD is a technical advisory committee member for
two Saint Paul bikeway initiatives, Grand Round, North Loop and Downtown Loop, and have participated
in a number of meetings offering recommendations for incorporating stormwater management into these
future bikeway projects.
6) Grant Programs
The Steward Grant Program has had 33 site visits and applications resulting in 12 Clean Water Plans. Quotes
were solicited for 2015 maintenance and a contract executed with Outdoor Lab for work along the Green Line
and Arlington Pascal. Final planning work for the two RSVP plating days were coordinated and associated
contracts with Great River Greening for planting assistance and watering. Numerous Special Grant agreements
were finalized in May including one with the Roseville School District for the Harambee Elementary project
and the complex agreement with St. Paul Public Schools for Central High School to transfer both CRWD and
State Clean Water Legacy funds. Gustavo Castro attended a U of M training course and has become a Certified
BMP Inspector.
7) Support Programs (GIS, Safety, BMP Database)

Our Mission is to protect, manage and improve the water resources of Capitol Region Watershed District
Staff are working with Ramsey County to identify specific features of the Impervious Surfaces Dataset.
This long awaited project finally was able to complete the aerial photography phase this spring and will
provide extremely detailed impervious surface GIS data. Impervious surface detail will enable staff to not
only accurately determine all impervious surfaces but they will also include identifiers such as buildings,
other structures, roads, parking and recreational features. Staff are working with our consultant Houston
Engineering to refine the BMP Database to provide a user friendly public interface as well as many more
searchable fields for staff queries of the data.
8) Administration
Staff are continuing to add reports and improvements to the SAGE accounting system to provide better and
up to date information for our project managers. Staff prepared and submitted their papers for publication
for the StormCon conference. Staff also submitted an abstract on the CHS Field for the MN Water
Resources Conference. Staff are in the process of wrapping up the final details of our fourth lease
amendment for the former Roof to Deck space. The Building Committee also conducted one potential office
site tour in May.
9) Administrator Approved or Executed Agreements
a) Change Order with Sunram Construction to repair irrigation system at Highland Ravine as requested
by City of St. Paul for an additional $2,575 with a total not to exceed $399,054.75.
b) Amendment No. 7 to Consultant Services Agreement with Wenck Associates for additional scope of
work in fall 2014 due to delay in construction – total not to exceed $158,411.
c) Amendment No. 8 for Consultant Services Agreement with Wenck Associates for additional scope
of work in St. Paul ROW - total not to exceed $163,411.
d) Amendment No. 9 to Consultant Services Agreement with Wenck Associates for additional work in
St. Paul ROW - total not to exceed $170,211.
e) Amendment No. 1 to Consultant Services Agreement with Barr Engineering Co. for regional
modeling in Lauderdale as part of the Eustis Street Modeling project - total not to exceed $39,845.
10) Board Approved or Executed Agreements
a) Memorandum of Agreement with Minnesota State Colleges and Universities on behalf of
Metropolitan State University for stormwater management practices at Metro State.
11) General updates including recent and upcoming meetings and events
a) Trout Brook Nature Sanctuary planting and opening celebration with Great River Greening and the
City of Saint Paul is on May 30th. The event runs from 12:30 to 3:00 with the formal program
starting at 1:00 PM.
b) Saint Paul Street Vitality Program boulevard rain garden planting events are planned for Saturday,
May 16 (Montana-Greenbrier project area) and Saturday, June 6 (Montreal Avenue project area).
c) Landscape Revival Native Plant Expo and Market is Saturday June 6 from 9 am – 3 pm at the Cub
Foods Community Pavilion on Larpenteur in Roseville.
d) Bugs Night Out, macroinvertebrate sampling event for children is Thursday, June 18 at Como
Lakeside Pavilion from 6 – 7:30 pm.
e) Como Lake Land and Water Cleanup with the Minnesota Standup Paddleboarders Association is
Sunday, July 12 from 10 am – 1 pm at Como Lakeside Pavilion.
VIII. Next Meeting
A) Next CAC meeting June 10, 2015 from 7:00 – 9:00 p.m., Manager Reider will attend
B) Next Board meeting is Wednesday, June 17, 2015 from 6:00 – 8:00 p.m.

Our Mission is to protect, manage and improve the water resources of Capitol Region Watershed District
Manager Thienes will be absent from May 26th – July 29th.
A public meeting regarding the former Ford site has been rescheduled for June 23rd. Mr. Fossum plans to attend
this public meeting.
WEFTEC 2015 abstracts were approved for Curtis Pond, RSVP Program, CHS field, and Villa Park dredging
project and will be presented. Administrator Doneux was appointed to be a chair for the WEFTEC National
Municipal Stormwater and Green Infrastructure Award Program.
MAWD Summer Tour will be June 24-26th in Duluth. Administrator Doneux, Manager Reider and Mr. Fossum
plan to attend.
Motion 15-140: Adjournment of the June 3, 2015 Regular Board Meeting at 7:15 p.m.
Reider/Texer
Unanimously Approved
Respectfully submitted,
Michelle Sylvander

Our Mission is to protect, manage and improve the water resources of Capitol Region Watershed District.
DATE: June 11, 2015
TO: CRWD Board of Managers
FROM: Michelle Sylvander, Office Manager
RE: May 2015 Accounts Payable/Receivable and Administrative/Program Budget
Report
_________________________________________________________________________________
Background
Enclosed are the Accounts Payable/Receivable and the Administrative/Program Budget Reports for the
Month of May 2015.
Issues
Summary of Accounts Payable/Receivable Report: Accts Payable $ 345,680.23
(Actual Paid in June) Accounts Receivable $ 42,700.00
Summary of Preliminary Budget Report: Administrative Budget $ 91,800.26
(Actual May Expenses) Program Budget $ 107,910.60
Project Budget $ 60,334.01
Capital Improvement Budget $ 30,551.71
TOTAL $ 290,596.58
Request Action
Approve May 2015 Accounts Payable/Receivable and April Budget Report, direct Treasurer and Board
President to endorse and disperse checks for these payments.
enc: May 2015 Accounts Payable
May 2015 Preliminary Budget Report
W:\02 Budget and Finance\Board Memos\Board Memos 2015\BD Memo AP Budget Report 6.17.15.docx
June 17, 2015
Board Meeting
V. Action Items – B) Accounts
Payable & Budget Update
(Sylvander)

Capitol Region Watershed District
Check RegisterFor the Period From June 1, 2015 - June 30, 2015
Date Payee Amount Check Total Check # Description
06/17/15 Al's Coffee 10.76 10.76 16682 Oasis Cooler Filter06/17/15 Allegra 526.02 526.02 16683 Newsletter Expense06/17/15 Barr Engineering 10,626.00 10,626.00 16684 Engineering Expense06/17/15 Benefit Extras, Inc. 66.75 66.75 16685 Emplyee Benefits06/17/15 Blue Stem Heritage Group 3,165.00 3,165.00 16686 Willow Reserve Mgmt.06/17/15 Bond Trust Services Corporation 56,321.88 56,321.88 16687 Bond Payments06/17/15 C Lanphear Communications 900.00 900.00 16688 Design Work06/17/15 Cabela's Marketing 192.57 192.57 16689 Monitoring Supplies06/17/15 City of St. Paul Financial Services 2,700.00 2,700.00 16690 Lease for Work Trucks06/17/15 City of St. Paul Park & Rec. 20,000.00 20,000.00 16691 Crosby Farm/Elway Parking Lot06/17/15 Computer Revolution 2,573.13 2,573.13 16692 Equipment Purchase/Rental/Lease06/17/15 District 10 150.00 150.00 16693 Como Fest Sponsorship06/17/15 Ellen Kloetzke 490.00 490.00 16694 Well-Sealing06/17/15 Emmons & Olivier Resources 3,971.35 3,971.35 16695 Engineering Expense06/17/15 Energy Park Plaza 5,927.15 5,927.15 16696 Rent06/17/15 Fleet One, LLC 114.25 114.25 16697 Vehicle Expense06/17/15 Ford Credit 535.81 535.81 16698 Equipment Lease/Purchase06/17/15 Ford Credit 454.44 454.44 16699 Equipment Lease/Purchase06/17/15 Forrest Kelley 600.00 600.00 16700 Utilities06/17/15 Fourth Sector Consulting 1,912.50 1,912.50 16701 Communication Services06/17/15 Fresh Color Press 974.02 974.02 16702 Postcards/Flyers06/17/15 Freshwater Society 1,165.00 1,165.00 16703 Membership/Award Ceremony06/17/15 Gene Sass 500.00 500.00 16704 Well-Sealing06/17/15 Geosyntec 3,101.70 3,101.70 16705 Upper Villa Park06/17/15 Goliath Hydro-Vac, Inc. 4,950.00 4,950.00 16706 CCLRT BMP/Como BMP06/17/15 Gray Line 405.00 405.00 16707 CAC Annual Tour Bus06/17/15 Health Advocates 3,500.00 3,500.00 16708 Partnership Funding06/17/15 HealthPartners 12,980.20 12,980.20 16709 Emplyee Benefits06/17/15 Impressive Print 1,376.53 1,376.53 16710 Adopt A Drain Door Hanger06/17/15 Integra-Monthly 789.72 789.72 16711 Utilities06/17/15 Joseph Collins 701.20 701.20 16712 Manager Per Diem/Expense06/17/15 League of MN Cities Ins. Trust 17,269.00 17,269.00 16713 Insurance & Bonds06/17/15 Lillie Suburban Newspapers, Inc. 849.50 849.50 16714 Landscape Revival Insert06/17/15 Lindsay M. VanPatten 90.46 90.46 16715 Staff Expense06/17/15 Marco-Minolta 1,043.36 1,043.36 16716 Equipment Purchase/Rental/Lease06/17/15 Mennards 138.05 138.05 16717 Monitoring Supplies06/17/15 MetLife 512.64 512.64 16718 Emplyee Benefits06/17/15 Minnesota State Auditor 1,795.00 1,795.00 16719 Audit Expense06/17/15 Nelson Cheese & Deli 229.03 229.03 16720 Meeting Supplies06/17/15 Park Press, Inc. 756.39 756.39 16721 Inserts06/17/15 Pioneer Press 152.40 152.40 16722 Board Workshops06/17/15 Pitney Bowes 500.00 500.00 16723 Postage 06/17/15 Ramsey County-Attorney 2,362.50 2,362.50 16724 Legal Fees06/17/15 Robert Fossum 920.98 920.98 16725 Staff Expense06/17/15 Roger Chinander 500.00 500.00 16726 Well-Sealing06/17/15 Sarah Wein 50.00 50.00 16727 Staff Expense
6/9/2015 at 5:02 PM Page: 1
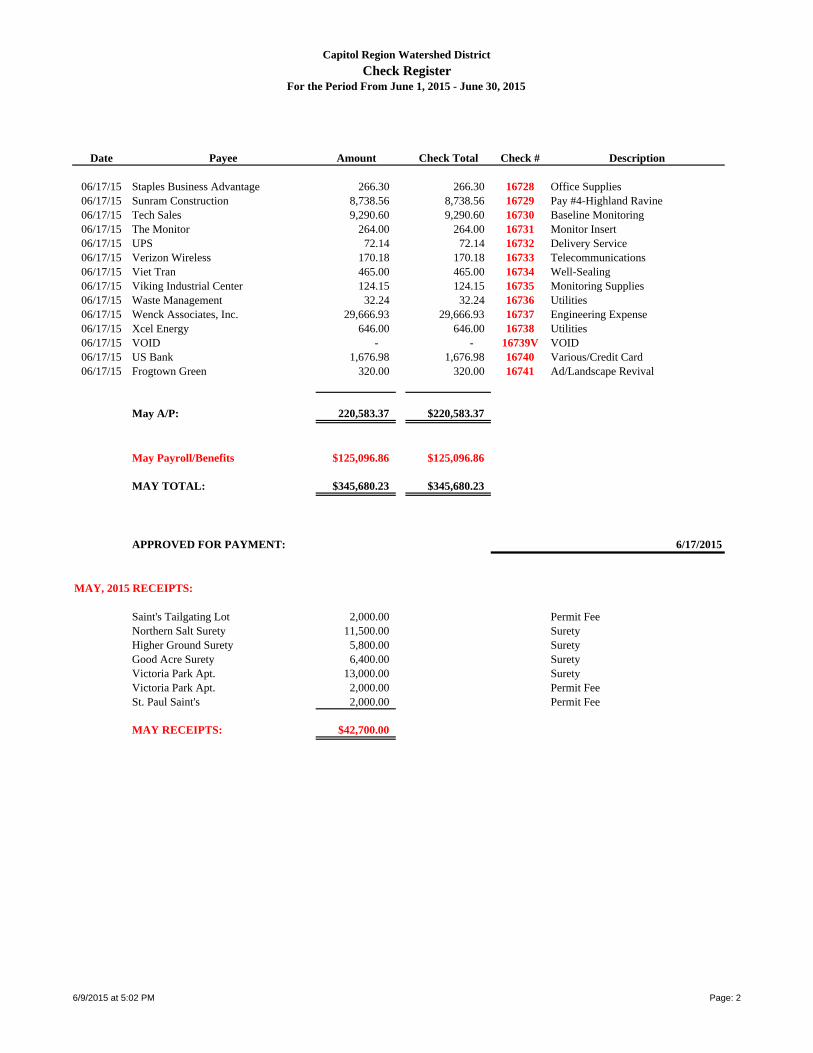
Capitol Region Watershed District
Check RegisterFor the Period From June 1, 2015 - June 30, 2015
Date Payee Amount Check Total Check # Description
06/17/15 Staples Business Advantage 266.30 266.30 16728 Office Supplies06/17/15 Sunram Construction 8,738.56 8,738.56 16729 Pay #4-Highland Ravine06/17/15 Tech Sales 9,290.60 9,290.60 16730 Baseline Monitoring06/17/15 The Monitor 264.00 264.00 16731 Monitor Insert06/17/15 UPS 72.14 72.14 16732 Delivery Service06/17/15 Verizon Wireless 170.18 170.18 16733 Telecommunications06/17/15 Viet Tran 465.00 465.00 16734 Well-Sealing06/17/15 Viking Industrial Center 124.15 124.15 16735 Monitoring Supplies06/17/15 Waste Management 32.24 32.24 16736 Utilities06/17/15 Wenck Associates, Inc. 29,666.93 29,666.93 16737 Engineering Expense06/17/15 Xcel Energy 646.00 646.00 16738 Utilities06/17/15 VOID - - 16739V VOID06/17/15 US Bank 1,676.98 1,676.98 16740 Various/Credit Card06/17/15 Frogtown Green 320.00 320.00 16741 Ad/Landscape Revival
May A/P: 220,583.37 $220,583.37
May Payroll/Benefits $125,096.86 $125,096.86
MAY TOTAL: $345,680.23 $345,680.23
APPROVED FOR PAYMENT: 6/17/2015
MAY, 2015 RECEIPTS:
Saint's Tailgating Lot 2,000.00 Permit FeeNorthern Salt Surety 11,500.00 SuretyHigher Ground Surety 5,800.00 SuretyGood Acre Surety 6,400.00 SuretyVictoria Park Apt. 13,000.00 SuretyVictoria Park Apt. 2,000.00 Permit FeeSt. Paul Saint's 2,000.00 Permit Fee
MAY RECEIPTS: $42,700.00
6/9/2015 at 5:02 PM Page: 2

CAPITOL REGION WATERSHE DISTRICTJOB COST RECAP
FOR THE PERIOD May 1, 2015 - May 31, 2015
2015 CURRENT MONTH YEAR-TO-DATE BALANCE OF BUDGET % OF BUDGET JOB COST #/NAME ANNUAL BUDGET EXPENDITURES EXPENDITURES REMAINING EXPENDED
15970 - General Adminitration 15 584,200.00 91,800.26 340,222.90 243,977.10 58.24%15999 - New Office 150,000.00 - - 150,000.00 0.00%00000 - Administration Allocation (122,500.00) - - (122,500.00) 0.00%
TOTAL GENERAL ADMINISTRATION: $611,700.00 $91,800.26 $340,222.90 $271,477.10 55.62%200 - Administration 80,850.00 - - 80,850.00 0.00%201 - Groundwater 8,050.00 661.21 1,743.38 6,306.62 21.66%207 - Rulemaking/Rule Revisions 21,150.00 501.44 4,257.89 16,892.11 20.13%208 - Permitting 192,590.00 11,141.86 41,137.32 151,452.68 21.36%210 - Stewardship Grants 257,980.00 26,836.44 65,370.90 192,609.10 25.34%211 - Monitoring & Data Collection 560,874.00 50,630.38 162,495.59 398,378.41 28.97%220 - Education & Outreach 185,590.00 14,101.02 66,560.63 119,029.37 35.86%225 - Technical Resources & Information Sharing 33,610.00 2,807.57 10,999.93 22,610.07 32.73%228 - Innovative BMP's Research 108,420.00 185.56 12,944.40 95,475.60 11.94%230 - Geographic Informatin Systems (GIS) 77,710.00 814.53 4,437.51 73,272.49 5.71%240 - Safety Program 35,790.00 230.59 8,086.66 27,703.34 22.59%
TOTAL PROGRAMS: $1,562,614.00 $107,910.60 $378,034.21 $1,184,579.79 24.19%300 - Administration 41,650.00 - - 41,650.00 0.00%301 - Shoreline & Streambank Maintenance 36,200.00 - - 36,200.00 0.00%305 - Como Lake Subwatershed 133,400.00 4,404.69 7,841.60 125,558.40 5.88%310 - Lake McCarron's Subwatershed 63,660.00 712.92 3,322.45 60,337.55 5.22%313 - Loeb lake Subwatershed 27,000.00 899.58 2,926.32 24,073.68 10.84%315 - Trout Brook Subwatershed 231,635.00 31,800.19 130,380.71 101,254.29 56.29%317 - Crosby Lake Subwatershed 12,000.00 668.75 2,564.26 9,435.74 21.37%325 - Wetland, Stream & Ecosystem Restoration 77,000.00 - 80.07 76,919.93 0.10%330 - Mississippi River Subwatershed 125,158.00 15,379.92 59,720.18 65,437.82 47.72%370 - Watershed Management Plan 60,000.00 6,467.96 11,611.33 48,388.67 19.35%
TOTAL PROJECTS: $807,703.00 $60,334.01 $218,446.92 $589,256.08 27.05%TOTAL OPERATING FUND: $2,982,017.00 $260,044.87 $936,704.03 $2,045,312.97 31.41%
401 - Shoreline & Streambank Restoration 32,000.00 411.09 946.36 31,053.64 2.96%405 - Como Lake BMP's 85,000.00 3,129.10 65,861.36 19,138.64 77.48%410 - Lake McCarron's BMP's 929,050.00 1,336.39 154,011.72 775,038.28 16.58%415 - Trout Brook BMP's 90,600.00 386.42 49,952.70 40,647.30 55.14%417 - Crosby Lake BMP's 38,200.00 1,893.94 48,069.36 (9,869.36) 125.84%425 - Wetland, Stream & Ecosystem Restoration 154,000.00 79.09 952.31 153,047.69 0.62%430 - Mississippi River Subwatersheds BMP's 110,000.00 - 698.19 109,301.81 0.63%440 - Special Projects & Grants 735,250.00 23,315.68 94,162.16 641,087.84 12.81%
TOTAL CAPITAL IMPROVEMENT: $2,174,100.00 $30,551.71 $414,654.16 $1,759,445.84 19.07%15104 - Debt & Loan Service 15 368,131.00 - - 368,131.00 0.00%
TOTAL DEBT SERVICES: $368,131.00 $0.00 $0.00 $368,131.00 0.00%
TOTAL ALL FUNDS: $5,524,248.00 $290,596.58 $1,351,358.19 $4,172,889.81 24.46%Unaudited Fund Balance Year-to-Date Year-to-Date Unaudited Fund Balance
FUND BALANCES @ 12/31/14 2015 Fund Transfers Revenue Expenditures @ 05/31/15 Operations 1,848,072.19 - 47,364.39 $936,704.03 958,732.55 Capital Improvement 3,571,332.70 - 222,079.69 414,654.16 3,378,758.23 Debt Service 49,377.78 - - - 49,377.78
TOTAL FUND BALANCE: $5,468,782.67 $0.00 $269,444.08 $1,351,358.19 4,386,868.56

CAPITOL REGION WATERSHE DISTRICTJOB COST DETAIL
FOR THE PERIOD May 1, 2015 - May 31, 2015
2015 CURRENT MONTH YEAR-TO-DATE BALANCE OF % OF BUDGET
JOB COST #/NAME ANNUAL BUDGET EXPENDITURES EXPENDITURES BUDGET REMAINING EXPENDED15970 - General Adminitration 15 584,200.00 91,800.26 340,222.90 243,977.10 58.24%15999 - New Office 150,000.00 - - 150,000.00 0.00%10000 - Administration Allocation (122,500.00) - - (122,500.00) 0.00%
TOTAL GENERAL ADMINISTRATION: $611,700.00 $91,800.26 $340,222.90 $271,477.10 55.62%20000 - Administration Allocation 80,850.00 - - 80,850.00 0.00%15000 - Implement Permit Program 99,060.00 8,604.29 34,181.61 64,878.39 34.51%15101 - Permit Tracking Data Mgmt 15 9,930.00 1,615.17 5,806.01 4,123.99 58.47%15102 - Construction Inspection 15 62,950.00 470.54 674.49 62,275.51 1.07%15103 - Permit Closure & Post Construction 20,650.00 451.86 475.21 20,174.79 2.30%15120 - Evaluate Rules & Conduct 15 21,150.00 501.44 4,257.89 16,892.11 20.13%15130 - Groundwater Prot Well Seal 15 8,050.00 661.21 1,743.38 6,306.62 21.66%15143 - Stewardship Grants 15 92,560.00 13,705.53 36,718.26 55,841.74 39.67%15144 - Partner Grants 15 85,900.00 4,158.91 5,495.16 80,404.84 6.40%15145 - Inspiring Communities Prog 15 60,600.00 837.15 3,562.54 57,037.46 5.88%15146 - RSVP Rain Garden Proj 15 18,920.00 8,134.85 19,594.94 (674.94) 103.57%15200 - Baseline Monitor & Data Col 15 301,254.00 39,294.27 126,232.22 175,021.78 41.90%15205 - Lake Monitor & Data Coll 15 89,980.00 4,228.47 7,319.39 82,660.61 8.13%15210 - Villa Park Mon & Data Coll 15 36,700.00 1,894.52 3,299.71 33,400.29 8.99%15215 - Wetland Bio Monitoring 15 20,020.00 - 192.35 19,827.65 0.96%15220 - Long-term Mon Data Devel 15 16,320.00 - 8,570.45 7,749.55 52.52%15225 - Remote Data Acct/Set-up 15 - 15.59 1,519.28 (1,519.28) 0.00%15230 - BMP Monitoring 15 96,600.00 3,097.43 5,809.14 90,790.86 6.01%15231 - AHUG Exfiltration Monitoring - 2,100.10 9,553.05 (9,553.05) 0.00%15250 - General 15 49,740.00 7,867.47 30,532.90 19,207.10 61.39%15253 - Community Capacity Assess 15 34,450.00 154.86 449.57 34,000.43 1.30%15255 - Clean Streets Outreach 15 17,900.00 93.35 538.35 17,361.65 3.01%15260 - Municipal Outreach 15 16,150.00 309.19 4,777.03 11,372.97 29.58%15262 - Youth Outreach - - 191.34 (191.34) 0.00%15265 - Partnerships 15 12,550.00 812.67 20,067.44 (7,517.44) 159.90%15270 - Website & Social Media 15 12,900.00 701.45 1,580.78 11,319.22 12.25%15271 - Master Water Stewards - 51.01 83.67 (83.67) 0.00%15275 - Events 15 30,000.00 4,111.02 8,147.56 21,852.44 27.16%15285 - Awards & Recognition Prog 15 11,900.00 - 191.99 11,708.01 1.61%15300 - Local & Agcy Plan Rev Tech Com 16,840.00 1,441.94 2,577.25 14,262.75 15.30%15303 - BMP Database Maint Updates 15 16,770.00 1,365.63 8,422.68 8,347.32 50.22%15330 - Innovative BMPs Research 15 9,000.00 185.56 12,502.74 (3,502.74) 138.92%

CAPITOL REGION WATERSHE DISTRICTJOB COST DETAIL
FOR THE PERIOD May 1, 2015 - May 31, 2015
2015 CURRENT MONTH YEAR-TO-DATE BALANCE OF % OF BUDGET
JOB COST #/NAME ANNUAL BUDGET EXPENDITURES EXPENDITURES BUDGET REMAINING EXPENDED15333 - Public Art Program 15 24,920.00 - - 24,920.00 0.00%15334 - Green Infrastructure Incentive 8,350.00 - - 8,350.00 0.00%15335 - Existing Site Stormwater Retro 11,000.00 - - 11,000.00 0.00%15336 - Climate Change Impacts 15 18,150.00 - - 18,150.00 0.00%15337 - Floating Island Pilot Proj 15 37,000.00 - 441.66 36,558.34 1.19%15370 - GIS Program Developement 15 27,850.00 617.86 4,240.84 23,609.16 15.23%15375 - Data Acquisition 15 10,000.00 29.23 29.23 9,970.77 0.29%15376 - Internal Mapping System 15 11,600.00 - - 11,600.00 0.00%15377 - Impervious Surface Data Set 15 28,260.00 167.44 167.44 28,092.56 0.59%15390 - Safety Training 15 12,830.00 101.87 4,626.62 8,203.38 36.06%15395 - Safety Program Update/Audit 15 10,650.00 50.54 1,135.10 9,514.90 10.66%15396 - CSE Equipment 15 12,310.00 78.18 2,324.94 9,985.06 18.89%
TOTAL PROJECTS: $1,562,614.00 $107,910.60 $378,034.21 $1,184,579.79 24.19%30000 - Administration Allocation 41,650.00 - - 41,650.00 0.00%15100 - Watershed Plan Audit 15 60,000.00 6,467.96 11,611.33 48,388.67 19.35%15400 - Lake McCarrons Shoreline Resto 16,600.00 - - 16,600.00 0.00%15405 - St Paul Natural Res Inter Prog 8,000.00 - - 8,000.00 0.00%15410 - Loeb Lake Shoreline Asses 15 5,800.00 - - 5,800.00 0.00%15411 - Crosby Lake Shoreline Asses 15 5,800.00 - - 5,800.00 0.00%15420 - Como Reg Park Stormwater 15 70,000.00 743.40 3,039.73 66,960.27 4.34%15421 - Como BMP Maint & Insp 15 42,750.00 3,560.21 4,441.80 38,308.20 10.39%15422 - Como Lake Impl Rpt Aud 15 20,650.00 101.08 360.07 20,289.93 1.74%15470 - Aquatic Plant Harvest 15 40,460.00 712.92 3,322.45 37,137.55 8.21%15471 - Aquatic Invasive Mgt Plan 15 23,200.00 - - 23,200.00 0.00%15510 - Willow Reserve Mgnt Plan 15 27,000.00 899.58 2,926.32 24,073.68 10.84%14550 - TB Inspection/Minor Maintenance - - 62,486.43 (62,486.43) 0.00%15550 - Inspection & Annual Maint 112,725.00 24,838.65 49,140.44 63,584.56 43.59%14552 - TBI Easement Verification/Doc 78,000.00 - 1,843.33 76,156.67 2.36%15554 - TBI Hydraulic/Hydrolic Model 17,000.00 - - 17,000.00 0.00%15570 - NPDES MS4 Stormwater Prog 15 7,170.00 1,236.92 2,050.41 5,119.59 28.60%15575 - Illicit Discharge Detn/Elim 15 16,740.00 75.81 410.52 16,329.48 2.45%15576 - Lafayette Stormwater Project - 5,648.81 14,449.58 (14,449.58) 0.00%15600 - Wetland/Stream Reestab Feas 15 77,000.00 - 80.07 76,919.93 0.10%15620 - Green Line Redevelop SSGI 15 36,000.00 - 2,708.53 33,291.47 7.52%15622 - Ford Stie Planning 15 - 11,639.28 26,856.87 (26,856.87) 0.00%14625 - Eustis St Stormwater Improv 30,100.00 2,024.54 27,212.01 2,887.99 90.41%15624 - CCLRT BMP Maintenance 15 59,058.00 1,716.10 2,942.77 56,115.23 4.98%15631 - Crosby Lake Mgmt Pl Imple 15 12,000.00 668.75 2,564.26 9,435.74 21.37%
TOTAL PROGRAMS: $807,703.00 $60,334.01 $218,446.92 $589,256.08 27.05%TOTAL OPERATING FUND: $2,982,017.00 $260,044.87 $936,704.03 $2,045,312.97 31.41%
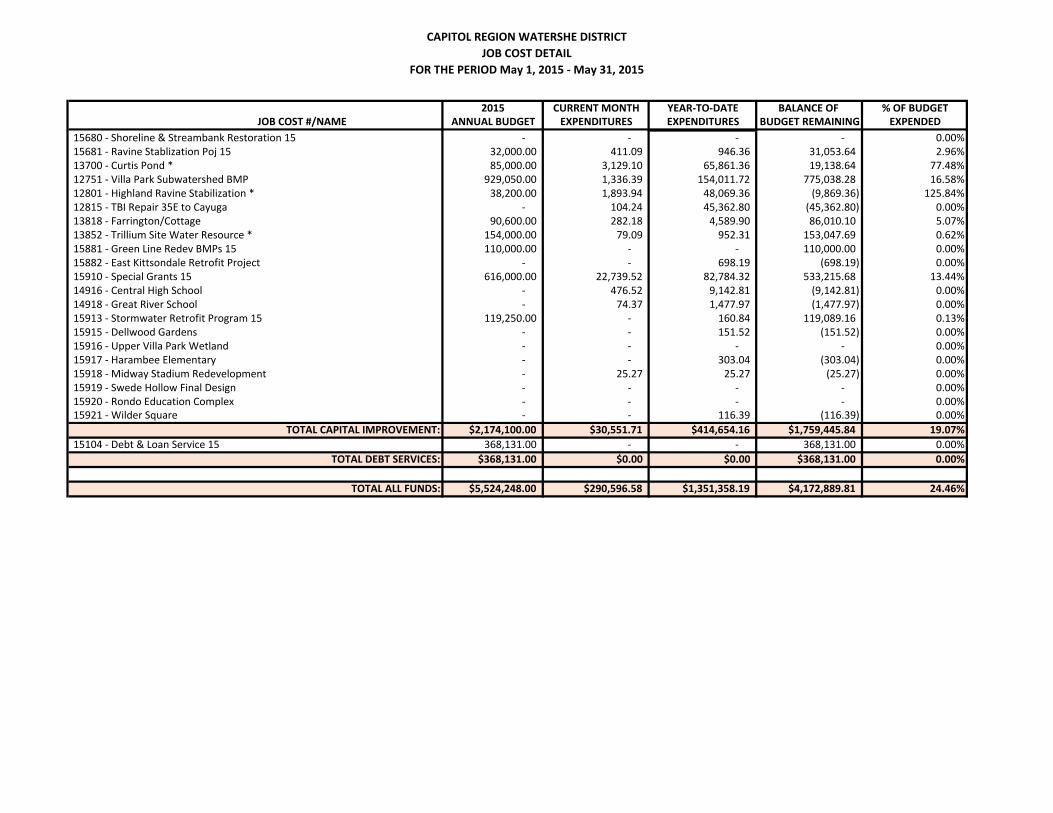
CAPITOL REGION WATERSHE DISTRICTJOB COST DETAIL
FOR THE PERIOD May 1, 2015 - May 31, 2015
2015 CURRENT MONTH YEAR-TO-DATE BALANCE OF % OF BUDGET
JOB COST #/NAME ANNUAL BUDGET EXPENDITURES EXPENDITURES BUDGET REMAINING EXPENDED15680 - Shoreline & Streambank Restoration 15 - - - - 0.00%15681 - Ravine Stablization Poj 15 32,000.00 411.09 946.36 31,053.64 2.96%13700 - Curtis Pond * 85,000.00 3,129.10 65,861.36 19,138.64 77.48%12751 - Villa Park Subwatershed BMP 929,050.00 1,336.39 154,011.72 775,038.28 16.58%12801 - Highland Ravine Stabilization * 38,200.00 1,893.94 48,069.36 (9,869.36) 125.84%12815 - TBI Repair 35E to Cayuga - 104.24 45,362.80 (45,362.80) 0.00%13818 - Farrington/Cottage 90,600.00 282.18 4,589.90 86,010.10 5.07%13852 - Trillium Site Water Resource * 154,000.00 79.09 952.31 153,047.69 0.62%15881 - Green Line Redev BMPs 15 110,000.00 - - 110,000.00 0.00%15882 - East Kittsondale Retrofit Project - - 698.19 (698.19) 0.00%15910 - Special Grants 15 616,000.00 22,739.52 82,784.32 533,215.68 13.44%14916 - Central High School - 476.52 9,142.81 (9,142.81) 0.00%14918 - Great River School - 74.37 1,477.97 (1,477.97) 0.00%15913 - Stormwater Retrofit Program 15 119,250.00 - 160.84 119,089.16 0.13%15915 - Dellwood Gardens - - 151.52 (151.52) 0.00%15916 - Upper Villa Park Wetland - - - - 0.00%15917 - Harambee Elementary - - 303.04 (303.04) 0.00%15918 - Midway Stadium Redevelopment - 25.27 25.27 (25.27) 0.00%15919 - Swede Hollow Final Design - - - - 0.00%15920 - Rondo Education Complex - - - - 0.00%15921 - Wilder Square - - 116.39 (116.39) 0.00%
TOTAL CAPITAL IMPROVEMENT: $2,174,100.00 $30,551.71 $414,654.16 $1,759,445.84 19.07%15104 - Debt & Loan Service 15 368,131.00 - - 368,131.00 0.00%
TOTAL DEBT SERVICES: $368,131.00 $0.00 $0.00 $368,131.00 0.00%
TOTAL ALL FUNDS: $5,524,248.00 $290,596.58 $1,351,358.19 $4,172,889.81 24.46%

Our Mission is to protect, manage and improve the water resources of Capitol Region Watershed District.
DATE: June 9, 2015
TO: CRWD Board of Managers
FROM: Nate Zwonitzer, Urban BMP Specialist
RE: Approve Joint Powers Agreement with Minnesota Pollution Control Agency for Exfiltration
Monitoring at Upper Villa
Background
Infiltration is a key tool of stormwater management since it filters pollutants and recharges groundwater
supplies. The Minnesota Pollution Control Agency (MPCA) approached CRWD looking for underground
BMP sites where exfiltration (water that has left the BMP) could be sampled to improve our understanding
of BMP performance. The information collected will guide BMP selection and design for future projects.
Issues
CRWD originally considered the Arlington-Hamline underground system (AHUG) as a study site.
Designs were created for horizontal wells at three depths below the BMP that would collect stormwater
for testing. Only one contractor bid on the well installation and the cost was about double what was
estimated.
Staff determined that the Upper Villa project might be another feasible, less expensive location since well
installation could coincide with the construction of the project (October, 2015) Installation estimates for
Upper Villa were generated by the project engineer and were within the budget proposed by the MPCA.
Final designs still need to be developed, but it is likely installation will consist of three pan lysimeters
installed at 3’, 8’, and 15’ below the bottom of the underground infiltration gallery.
Design and installation of the monitoring system is estimated to cost $23,500. Sampling equipment,
sample collection, and analysis for approximately two seasons is estimated to cost $37,350 for a total
project cost of $60,850. A JPA with the MPCA will reimburse CRWD $23,500 for design and installation,
and $7,325 for monitoring activities. The net cost to CRWD will be $30,025 over the two year project
period. CRWD has budgeted $15,000 in 2015 and will budget the balance of $15,025 in 2016.
Requested Action
Approve the Joint Powers Agreement with the Minnesota Pollution Control Agency for the Upper Villa
Park Exfiltration Performance Assessment pending review and approval of Ramsey County Attorney, and
authorize the District Administrator to execute the agreement.
enc: Joint Powers Agreement, workplan, and project budget (hard copies available at the meeting upon request)
\\CRWDC01\Company\07 Programs\Monitoring & Data Acquisition\0 Projects\2015 AHUG Vadose MPCA Project\Upper Villa\Board Memo Upper Villa Exfiltration Monitoring.docx
June 17, 2015
V. Action Items
C) JPA for Upper Villa
Exfiltration Monitoring
(Zwonitzer)

1
Joint Powers Agreement State of Minnesota
Doc Type: Contract
SWIFT Contract No.: 0000000000000000000090132
PO No.: 3000013714
CR No.: 8251
This Agreement is between the State of Minnesota, acting through its Commissioner of the Minnesota Pollution Control Agency, 520 Lafayette Road North, St. Paul, MN 55155 ("State" or "MPCA") and Capitol Region Watershed District, 1410 Energy Park Drive, St. Paul, MN 55108 ("Local Governmental Unit" (LGU)).
Recitals
1. Under Minn. Stat. §§ 15.061 and 471.59, subd. 10, the State is empowered to engage such assistance as deemed necessary.
2. The State is in need of the Stormwater Best Management Practice (BMP) – Upper Villa Park Exfiltration Performance Assessment ("Project").
3. The LGU represents that it is duly qualified and agrees to perform all services described in this Agreement to the satisfaction of the State.
Agreement
1. Term of Agreement
1.1 Effective date: June 30, 2015, or the date the State obtains all required signatures under Minn. Stat. § 16C.05, subd. 2, whichever is later. The LGU must not begin work under this Agreement until this Agreement is fully executed and the LGU has been notified by the State's Authorized Representative to begin the work.
1.2 Expiration date: June 29, 2017, or until all obligations have been satisfactorily fulfilled, whichever occurs first.
1.3 Survival of terms: The following clauses survive the expiration or cancellation of this Agreement: Liability; State Audits; Government Data Practices and Intellectual Property; Publicity and Endorsement; Governing Law, Jurisdiction, and Venue.
2. LGU's duties
The LGU, who is not a state employee, will conduct the Project and follow the Budget for the said Project as specified in Attachment A, which is attached and incorporated into this Agreement. No terms or conditions of the LGU's proposal will be construed to modify, diminish, or derogate the terms and conditions of this Agreement.
All water monitoring programs and projects that involve environmental data acquisition from direct measurement activities or laboratory analysis must have an approved Quality Assurance Project Plan (QAPP) to ensure all data collected are of known and suitable quality and quantity. The LGU shall cooperate in the development of the QAPP as necessary, and comply with the requisite elements of the plan.

2
The LGU shall, when applicable: 1) Organize water quality data into a spreadsheet format suitable for entry into Environmental Quality Information System (EQuIS). 2) Work with the MPCA Authorized Representative and data management staff to provide information on water quality or biological sampling, as needed, to enter the monitoring data in EQUIS. The LGU shall: A) Provide basic information including project name, purpose, staff assigned, and sampling procedures for project establishment in EQuIS, using the MPCA Project Establishment Form. B) Provide information on all laboratories used for water sample analysis, using the MPCA Lab Establishment Form. C) Provide information on monitoring station location for station establishment in EQuIS using the MPCA Station Establishment Form. Said Forms and other Storage and Retrieval Water Data Repository (STORET) information are available at MPCA EQuIS website, which may be accessed at: http://www.pca.state.mn.us/index.php/water/water-monitoring-and-reporting/equis/equis-program-and-surface-water-data.html.
With the exception of diatom core sampling and invertebrate analysis, all laboratory work conducted under this Project must be done by a laboratory currently certified by the Minnesota Department of Health for the parameter being measured.
The LGU shall ensure that all personnel involved in the performance of this Agreement are properly qualified, trained, and competent; and shall be, where applicable, appropriately medically monitored during activities undertaken.
3. Time The LGU must comply with all the time requirements described in this Agreement. In the performance of this Agreement, time is of the essence.
4. Consideration and payment
4.1 Consideration. The State will pay for all services performed by the LGU under this Agreement as follows:
(a) Compensation. The LGU will be paid in accordance with the breakdown of costs as set forth in the detailed Budget section of Attachment A, which is attached and incorporated into this Agreement.
(b) Travel expenses. Reimbursement for travel and subsistence expenses actually and necessarily incurred by the LGU as a result of this Agreement will not exceed the total amount set forth in travel expense section of the detailed Budget section of Attachment A, which is attached and incorporated into this Agreement, provided that the LGU will be reimbursed for travel and subsistence expenses in the same manner and in no greater amount than provided in the current "Commissioner's Plan" promulgated by the Commissioner of Minnesota Management and Budget office, which is incorporated into this Agreement by reference and which can be viewed at: http://www.mmd.admin.state.mn.us/commissionersplan.htm.
(c) Total obligation. The total obligation of the State for all compensation and reimbursements to the LGU under this Agreement will not exceed $30,825.00 (Thirty Thousand Eight Hundred Twenty Five Dollars and Zero Cents).
4.2 Payment
(a) Invoices. The State will promptly pay the LGU after the LGU presents an itemized invoice for the services actually performed and the State's Authorized Representative accepts the invoiced services. Invoices must be submitted timely and according to the following schedule: Quarterly.
Invoices will reference the SWIFT Contract number, Purchase Order number, and the name of the State's Authorized Representative and will be submitted electronically to: [email protected]
If there is a problem with submitting an invoice electronically, please contact the Accounts

3
Payable Unit at 651-757-2491.
The LGU shall submit an invoice for the final payment upon submittal of the final progress and financial report within 30 (thirty) days of the original or amended end date of this Agreement. State reserves the right to review submitted invoices after 30 (thirty) days and make a determination as to payment.
(b) Retainage. Under Minn. Stat. § 16C.08, subd. 2(10), no more than 90 percent of the amount due under this Agreement may be paid until the final product of this Agreement has been reviewed by the State's agency head. The balance due will be paid when the State's agency head determines that the LGU has satisfactorily fulfilled all the terms of this Agreement.
(c) Federal funds. N/A.
4.3 Reporting requirements. The LGU shall submit to the State for review and approval semi-annual reports in a format prescribed by the State. Semi-Annual Reports shall be due to the State each February 1 and August 1 during the life of the Agreement. The January 1 -- June 30 reporting period will be addressed in the August 1 report; the July1 -- December 31 reporting period will be addressed in the February 1 report. Payments shall be withheld if reporting requirements have not been met.
5. Legacy logo Minnesota Laws 2010, chapter 361, article 3, section 5, (b) states: "A recipient of the funds from the outdoor heritage fund, parks and trails fund, clean water fund or arts and cultural heritage fund shall display, where practicable, a sign with the logo developed under this section on construction projects and at access points to any land or water resources acquired in fee or an interest in less than fee title, or that were restored, protected, or enhanced, and incorporate the logo, where practicable, into printed and other materials funded with money from one or more of the funds."
Clean Water Land and Legacy Amendment Logo Usage Guidelines: http://www.legacy.leg.mn/sites/default/files/resources/Legacy_Logo_Guidelines.pdf
Download the Legacy Logo: http://www.legacy.leg.mn/legacy-logo/legacy-logo-download
6. Conditions of payment All services provided by the LGU under this Agreement must be performed to the State's satisfaction, as determined at the sole discretion of the State's Authorized Representative and in accordance with all applicable federal, state, and local laws, ordinances, rules, and regulations. The LGU will not receive payment for work found by the State to be unsatisfactory or performed in violation of federal, state, or local law.
7. Authorized Representative
The State's Authorized Representative/Project Manager is David Fairbairn, Minnesota Pollution Control Agency, 520 Lafayette Road, St. Paul, MN 55155, 651-757-2659, [email protected], or his successor, and has the responsibility to monitor the LGU's performance and the authority to accept the services provided under this Agreement. If the services are satisfactory, the State's Authorized Representative/Project Manager will certify acceptance on each invoice submitted for payment.
The LGU's Authorized Representative is Bob Fossum, 1410 Energy Park Drive, St. Paul, MN 55108, 651-644-8888, [email protected], or his successor. If the LGU's Authorized Representative changes at any time during this Agreement, the LGU must immediately notify the State.
8. Subcontracting If the LGU decides to fulfill its obligations and duties under this Agreement through a subcontractor, to be paid for by funds received under this Agreement, the LGU shall not execute an agreement with the subcontractor or otherwise enter into a binding agreement until it has first received written approval from the MPCA's Authorized Representative. All subcontracts shall reference this Agreement and require the subcontractor to comply with all of the terms and conditions of this Agreement. The LGU

4
shall be responsible for the satisfactory and timely completion of all work required under any subcontract and the LGU shall be responsible for payment of all subcontracts. The LGU shall pay all subcontractors, less any retainage, within 10 calendar days of receipt of payment to the LGU by the State for undisputed services provided by the subcontractor and must pay interest at the rate of one and one-half percent per month or any part of a month to the subcontractor on any undisputed amount not paid on time to the subcontractor.
The LGU must follow their policies and procedures for obtaining subcontractors and/or policies and procedures per Minn. Stat. § 471.345 as applicable.
9. Change Orders If the State's Project Manager or the LGU's Authorized Representative identifies a minor change needed in the Work Plan and Budget, either party may initiate a Change Order using the Change Order Form provided by the MPCA. Minor changes are defined as reallocating between tasks and objectives, less than ten percent (10%) of the overall Agreement, cumulatively, or $50,000, cumulatively, whichever is less. Change Orders may not delay or jeopardize the success of the Project, alter the overall scope of the Project, increase or decrease the overall amount of the Agreement, or cause an extension of the term of this Agreement. Major changes or reallocations (over 10% or $50,000) require an Amendment rather than a Change Order.
The State's Project Manager and the LGU's Authorized Representative shall sign the Change Order Form in advance of doing the work, which will then become an integral and enforceable part of the Agreement.
10. Assignment, amendments, waiver, and Agreement complete
10.1 Assignment. The LGU may neither assign nor transfer any rights or obligations under this Agreement without the prior consent of the State and a fully executed Assignment Agreement, executed and approved by the same parties who executed and approved this Agreement, or their successors in office.
10.2 Amendments. Any amendment to this Agreement must be in writing and will not be effective until it has been executed and approved by the same parties who executed and approved the original Agreement, or their successors in office.
10.3 Waiver. If the State fails to enforce any provision of this Agreement, that failure does not waive the provision or its right to enforce it.
10.4 Agreement complete. This Agreement contains all negotiations and agreements between the State and the LGU. No other understanding regarding this Agreement, whether written or oral, may be used to bind either party.
11. Liability
Each party agrees that it shall be responsible for its own acts and omissions and shall not be responsible for the acts or omissions of the other party. Each party therefore agrees that is shall assume liability for itself, its agents and employees for any injury to persons or property resulting in any manner from the conduct of its own operations and the operations of its agents and employees under this Agreement, and for any loss, cost, damage, or expense resulting at any time from failure to exercise proper precautions, by itself or through its agents and employees.
Nothing in this Agreement is intended to be construed as a waiver of the State Tort Claims Act, Minn. Stat. § 3. 736, the Municipal Tort Claims Act, Minn. Stat. ch. 466, or any law, legislative or judicial, limiting governmental liability. This clause will not be construed to bar any legal remedies either party may have against the other for its failure to fulfill its obligations under this Agreement.
12. State audits Under Minn. Stat. § 16C.05, subd. 5, the LGU's books, records, documents, and accounting procedures and practices relevant to this Agreement are subject to examination by the State and/or the State Auditor or Legislative Auditor, as appropriate, for a minimum of six years from the end of

5
this Agreement.
13. Government data practices and intellectual property
13.1 Government data practices. The LGU and State must comply with the Minnesota Government Data Practices Act, Minn. Stat. ch. 13, (or, if the State contracting party is part of the Judicial Branch, with the Rules of Public Access to Records of the Judicial Branch promulgated by the Minnesota Supreme Court as the same may be amended from time to time) as it applies to all data provided by the State under this Agreement, and as it applies to all data created, collected, received, stored, used, maintained, or disseminated by the LGU under this Agreement. The civil remedies of Minn. Stat. § 13.08 apply to the release of the data governed by the Minnesota Government Practices Act, Minn. Stat. ch. 13, by either the LGU or the State.
If the LGU receives a request to release the data referred to in this clause, the LGU must immediately notify the State. The State will give the LGU instructions concerning the release of the data to the requesting party before the data is released.
13.2 Intellectual property rights.
(a) Intellectual property rights: The rights, title, and interest in all of the intellectual property rights, including all copyrights, patents, trade secrets, trademarks, and service marks in the works and documents, shall be jointly owned by the LGU and the State. The "works" means all inventions, improvements, discoveries (whether or not patentable), databases, computer programs, reports, notes, studies, photographs, negatives, designs, drawings, specifications, materials, tapes, and disks conceived, reduced to practice, created or originated by the LGU, its employees, agents, and subcontractors, either individually or jointly with others in the performance of this Agreement. "Works" includes documents. The "documents" are the originals of any databases, computer programs, reports, notes, studies, photographs, negatives, designs, drawings, specifications, materials, tapes, disks, or other materials, whether in tangible or electronic forms, prepared by the LGU, its employees, agents, or subcontractors, in the performance of this Agreement. The ownership interests of the State and the LGU in the works and documents shall be equal. The party's ownership interest in the works and documents shall not be reduced by any royalties or revenues received from the sale of the products or the licensing or other activities arising from the works and documents. Each party hereto shall, at the request of the other, execute all papers and perform all other acts necessary to transfer or record the appropriate ownership interests in the works and documents.
(b) Obligations
(1) Notification: Whenever any invention, improvement, or discovery (whether or not patentable) is made or conceived for the first time or actually or constructively reduced to practice by the LGU, including its employees and subcontractors, in the performance of this Agreement, the LGU will immediately give the State's Authorized Representative written notice thereof, and must promptly furnish the State's Authorized Representative with complete information and/or disclosure thereon. All decisions regarding the filing of patent, copyright, trademark or service mark applications and/or registrations shall be the joint decision of the LGU and the State, and costs for such applications shall be divided as agreed by the parties at the time of the filing decisions. In the event the parties cannot agree on said filing decisions, the filing decision will be made by the State.
(2) Representation: The LGU must perform all acts, and take all steps necessary to ensure that all intellectual property rights in the works and documents are the sole property of the LGU and the State, as agreed herein, and that no LGU employee, agent, or subcontractors retains any interest in and to the works and documents. The LGU represents and warrants that the works and documents do not and will not infringe upon any intellectual property rights of others. The LGU shall indemnify; defend, and hold harmless the State, at the LGU's expense, from any action or claim brought

6
against the State to the extent that it is based on a claim that all or part of the works or documents infringe upon the intellectual property rights of others. The LGU shall be responsible for payment of any and all such claims, demands, obligations, liabilities, costs, and damages, including but not limited to, attorney fees. If such a claim or action arises, or in the LGU's or the State's opinion is likely to arise, the LGU must, at the State's discretion, either procure for the State the right or license to use the intellectual property rights at issue or replace or modify the allegedly infringing works or documents as necessary and appropriate to obviate the infringement claim. This remedy shall be in addition to and not exclusive of other remedies provided by law.
(c) Use of works and documents: The State and LGU shall jointly have the right to make, have made, reproduce, modify, distribute, perform, and otherwise use the works, including documents produced under this Agreement, for noncommercial research, scholarly work, government purposes, and other noncommercial purposes without payment or accounting to the other party. No commercial development, manufacture, marketing, reproduction, distribution, sales or licensing of the works, including documents, shall be authorized without a future written contractual agreement between the parties.
(d) Possession of documents: The documents may remain in the possession of the LGU. The State may inspect any of the documents at any reasonable time. The LGU shall provide a copy of the documents to the State without cost upon the request of the State.
(e) Survivability: The rights and duties of the State and the LGU, provided for above, shall survive the expiration or cancellation of this Agreement.
14. Insurance requirements Below are the minimum insurance limits required by the State of Minnesota for any entity that is not a state Agency or Local Government Unit (LGU) unless otherwise noted (**).
14.1 LGU shall not commence work under the Agreement until they (or subcontractor) have submitted acceptable evidence of insurance and the State of Minnesota has approved such insurance. LGU or subcontractor shall maintain such insurance in force and effect throughout the term of the Agreement. A certificate of insurance is acceptable evidence.
14.2 Subcontractor is required to maintain and furnish satisfactory evidence of the following insurance policies:
(a) Workers' Compensation Insurance. Subcontractor must provide Workers' Compensation insurance for all its employees and, in case any work is subcontracted, LGU will require the subcontractor to provide Workers' Compensation insurance in accordance with the statutory requirements of the State of Minnesota, including Coverage B, Employer's Liability. Insurance minimum amounts are as follows:
$100,000 -- Bodily Injury by Disease per employee $500,000 -- Bodily Injury by Disease aggregate $100,000 -- Bodily Injury by Accident
If Minn. Stat. § 176. 041 exempts subcontractor from Workers' Compensation insurance or if the subcontractor has no employees in the State of Minnesota, subcontractor must provide a written statement, signed by an authorized representative, indicating the qualifying exemption that excludes LGU from the Minnesota Workers' Compensation requirements.
If during the course of the Agreement the subcontractor becomes eligible for Worker's Compensation, the subcontractor must comply with the Workers' Compensation Insurance requirements herein and provide the State of Minnesota with a certificate of insurance.
(b) Commercial General Liability Insurance. Subcontractor is required to maintain insurance protecting it from claims for damages for bodily injury, including sickness or disease, death, and for care and loss of services as well as from claims for property damage, including loss of use which may arise from operations under the Agreement and in any case work is

7
subcontracted the LGU will require the subcontractor to provide Commercial General Liability. Insurance minimum amounts are as follows:
$2,000,000 -- per occurrence $2,000,000 -- annual aggregate $2,000,000 -- annual aggregate -- Products/Completed Operations
**For LGUs, the coverage shall be maintained in conformance with the Tort Claims limits set forth in Minn. Stat. ch. 466, with limits not less than $500,000 per claimant and $1,500,000 per occurrence for bodily injury and property damage.
The following coverages shall be included:
Premises and Operations Bodily Injury and Property Damage Personal and Advertising Injury Blanket Contractual Liability Products and Completed Operations Liability State of Minnesota named as an Additional Insured
(c) Commercial Automobile Liability Insurance. Subcontractor is required to maintain insurance protecting the LGU from claims for damages for bodily injury as well as from claims for property damage resulting from the ownership, operation, maintenance or use of all owned, hired, and non-owned autos which may arise from operations under this Agreement, and in case any work is subcontracted the LGU will require the subcontractor to provide Commercial Automobile Liability. Insurance minimum amounts are as follows:
$2,000,000 -- per occurrence Combined Single limit for Bodily Injury and Property Damage
**For LGUs, the coverage shall be maintained in conformance with the Tort Claims limits set forth in Minn. Stat. Ch. 466, with limits not less than $500,000 per claimant and $1,500,000 per occurrence for bodily injury and property damage.
In addition, the following coverages should be included:
Owned, Hired, and Non-owned Automobile
(d) Professional Liability Insurance. This policy will provide coverage for all claims the LGU, or its subcontractors, may become legally obligated to pay, resulting from any actual or alleged negligent act, error, or omission related to LGU's or its subcontractors' professional services required under the Agreement.
$2,000,000 -- per claim or event $2,000,000 -- annual aggregate
**For LGUs, the coverage shall be maintained in conformance with the Tort Claims limits set forth in Minn. Stat. ch. 466, with limits not less than $500,000 per claimant and $1,500,000 per occurrence for bodily injury and property damage.
Any deductible of the subcontractor will be the sole responsibility of the subcontractor and may not exceed $50,000 without the written approval of the State. If the subcontractor desires authority from the State to have a deductible in a higher amount, the subcontractor shall request in writing, specifying the amount of the desired deductible and providing financial documentation by submitting the most current audited financial statements or other approved documentation so that the State can ascertain the ability of the subcontractor to cover the deductible from its own resources.
The retroactive or prior acts date of such coverage shall not be after the effective date of this Agreement and LGU or subcontractor shall maintain such insurance for a period of at least three (3) years, following completion of the work. If such insurance is discontinued, extended reporting period coverage must be obtained by LGU or subcontractor to fulfill this requirement.

8
14.3 Additional insurance conditions: • LGU's or subcontractor's policy(ies) or subcontractor's shall be primary insurance to any
other valid and collectible insurance available to the State of Minnesota with respect to any claim arising out of the performance under this Agreement.
• LGU or subcontractor is responsible for payment of Agreement-related insurance premiums and deductibles.
• If LGU or subcontractor is self-insured, a Certificate of Self-Insurance must be attached, include legal defense fees in addition to liability policy limits, with the exception of 14. 2 D. above.
• Obtain insurance policies from an insurance company having an "AM BEST" rating of A- (minus); Financial Size Category (FSC) VII or better and must be authorized to do business in the State of Minnesota or obtain comparable coverage under a program of self-insurance.
• An Umbrella or Excess Liability insurance policy may be used to supplement the LGU's or subcontractor's policy limits to satisfy the full policy limits required by the Agreement.
• If LGU or subcontractor receives a cancellation notice from an insurance carrier affording coverage herein, LGU agrees to notify the State of Minnesota within five (5) business days with a copy of the cancellation notice, unless LGU's or subcontractor's policy(ies) contain a provision that coverage afforded under the policy(ies) will not be cancelled without at least thirty (30) days advance written notice to the State of Minnesota.
14.4 The State reserves the right to immediately terminate the Agreement if the LGU or subcontractor is not in compliance with the insurance requirements and retains all rights to pursue any legal remedies against the LGU. All insurance policies must be open to inspection by the State, and copies of policies must be submitted to the State's authorized representative upon written request.
14.5 The successful responder is required to submit Certificates of Insurance acceptable to the State of Minnesota as evidence of insurance coverage requirements prior to commencing work under the Agreement.
15. Publicity and endorsement
15.1 Publicity. Any publicity regarding the subject matter of this Agreement must identify the State as the sponsoring agency and must not be released without prior written approval from the State's Authorized Representative. For purposes of this provision, publicity includes notices, informational pamphlets, press releases, research, reports, signs, and similar public notices prepared by or for the LGU individually or jointly with others, or any subcontractors, with respect to the program, publications, or services provided resulting from this Agreement.
15.2 Endorsement. The LGU must not claim that the State endorses its products or services. 16. Governing law, jurisdiction, and venue
Minnesota law, without regard to its choice-of-law provisions, governs this Agreement. Venue for all legal proceedings out of this Agreement, or its breach, must be in the appropriate state or federal court with competent jurisdiction in Ramsey County, Minnesota.
17. Data disclosure
Under Minn. Stat. § 270C.65, subd. 3 and other applicable law, the LGU consents to disclosure of its social security number, federal employer tax identification number, and/or Minnesota tax identification number, already provided to the State, to federal and state agencies, and state personnel involved in the payment of state obligations. These identification numbers may be used in the enforcement of federal and state laws which could result in action requiring the LGU to file state tax returns, pay delinquent state tax liabilities, if any, or pay other state liabilities.
18. Payment to subcontractors
As required by Minn. Stat. § 16A.1245, the prime contractor must pay all subcontractors, less any retainage, within 10 calendar days of the prime contractor's receipt of payment from the State for

9
undisputed services provided by the subcontractor(s) and must pay interest at the rate of one and one-half percent per month or any part of a month to the subcontractor(s) on any undisputed amount not paid on time to the subcontractor(s).
19. Termination
19.1 Termination by the State. The State or Commissioner of Administration may cancel this Agreement at any time, with or without cause, upon 30 days' written notice to the LGU. Upon termination, the LGU will be entitled to payment, determined on a pro rata basis, for services satisfactorily performed.
19.2 Termination for insufficient funding. The State may immediately terminate this Agreement if it does not obtain funding from the Minnesota Legislature, or other funding source; or if funding cannot be continued at a level sufficient to allow for the payment of the services covered here. Termination must be by written or fax notice to the LGU. The State is not obligated to pay for any services that are provided after notice and effective date of termination. However, the LGU will be entitled to payment, determined on a pro rata basis, for services satisfactorily performed to the extent that funds are available. The State will not be assessed any penalty if the Agreement is terminated because of the decision of the Minnesota Legislature, or other funding source, not to appropriate funds. The State must provide the LGU notice of the lack of funding within a reasonable time of the State's receiving that notice.
20. Minn. Stat. § 181.59
The vendor will comply with the provisions of Minn. Stat. § 181.59 which requires:
Every Agreement for or on behalf of the State, or any county, city, town, township, school, school district, or any other district in the state, for materials, supplies, or construction shall contain provisions by which the LGU agrees: (1) That, in the hiring of common or skilled labor for the performance of any work under any Agreement, or any subcontract, no LGU, material supplier, or vendor, shall, by reason of race, creed, or color, discriminate against the person or persons who are citizens of the United States or resident aliens who are qualified and available to perform the work to which the employment relates; (2) That no LGU, material supplier, or vendor, shall, in any manner, discriminate against, or intimidate, or prevent the employment of any person or persons identified in clause (1) of this section, or on being hired, prevent, or conspire to prevent, the person or persons from the performance of work under any Agreement on account of race, creed, or color; (3) That a violation of this section is a misdemeanor; and (4) That this Agreement may be canceled or terminated by the state, county, city, town, school board, or any other person authorized to grant the contracts for employment, and all money due, or to become due under the Agreement, may be forfeited for a second or any subsequent violation of the terms or conditions of this Agreement.

www.pca.state.mn.us • 651-296-6300 • 800-657-3864 • TTY 651-282-5332 or 800-657-3864 • Available in alternative formats e-admin9-38 • 12/2/13 Page 1 of 5
Project Work Plan
Doc Type: Contract
MPCA Use Only
Swift #: 8251
CR #: 90132
Project Title: Stormwater BMP – Upper Villa Park Exfiltration Performance Assessment
1. Project Summary: Organization: Capitol Region Watershed District (CRWD)
Contractor contact name: Bob Fossum Title: Program Manager
Address: 1410 Energy Park Drive St. Paul, MN, 55108
Phone: 651-644-8888 Fax: 651-644-8894
E-mail: [email protected]
Subcontractor(s)/Partner(s): Organization: Metropolitan Council Environmental Services Analytical Laboratory (MCES)
Project manager: Dave Fuchs Address: 390 Robert St. North
St. Paul, MN 55101-1805 Phone: 651.602.8135 E-mail: [email protected]
Subcontractor(s)/Partner(s): Organization: New Look Contracting, Inc
Project manager: Nate Menge Address: 14045 Northdale Blvd
Rogers, MN 55374 Phone: 763-241-1596
Fax: 763-241-9196 E-mail: [email protected]
MPCA contact(s): MPCA project manager: David Fairbairn
Title: Research Scientist Address: 520 Lafayette Rd
St. Paul, MN, 55101 Phone: 651-757-2659 E-mail: [email protected]
Attachment A

www.pca.state.mn.us • 651-296-6300 • 800-657-3864 • TTY 651-282-5332 or 800-657-3864 • Available in alternative formats e-admin9-38 • 12/2/13 Page 2 of 5
Project information Latitude/Longitude: 45.004096, -93.124935
*County: Ramsey Start date: 06/30/2015 End date: 06/29/2017 Total cost: $30,825
*Full time equivalents: 0.06 (for each of 2 years)
*Major watershed(s): [Select all that apply.]
Statewide Kettle River Miss Rvr – GrandRpds Rainy Rvr – Baudette So Fork Crow River Big Fork River Lac Qui Parle River Miss Rvr –Headwaters Rainy Rvr – Black Rvr Lower St. Croix Rvr Upper Big Sioux Rvr Lake of the Woods Miss Rvr –LaCrescent Rainy Rvr – Rainy Rvr Upper St. Croix Rvr Lower Big Sioux Rvr Lake Superior – North Miss Rvr – Reno Rapid River St. Louis River Blue Earth River Lake Superior – South Miss Rvr – Sartell Red Lake River Red Rvr of the North
Tamarac River Bois de Sioux River Le Sueur River Miss Rvr – St. Cloud Upper Red Rvr Thief River Buffalo River Leech Lake River Miss Rvr – Twin Cities Redeye River Two Rivers Cannon River Little Fork River Miss Rvr – Winona Redwood River Upper/Lower Red Lk Cedar River Little Sioux River Miss Rvr – Lake Pepin Rock River Upper Iowa River Chippewa River Long Prairie River Mustinka River Root River Vermillion River Clearwater River Red Rvr of the North
Marsh River Nemadji River Roseau River Upper Wapsipinicon
River Cloquet River MN Rvr – Yellow
Medicine River No Fork Crow River Rum River Watonwan River
Cottonwood River MN Rvr – Headwaters Otter Tail River Red Rvr of the North Sandhill River
DesMoines Rvr Hdwtrs
Crow Wing River MN Rvr – Mankato Pine River Sauk River Lower DesMoines Rvr E Fork DesMoines Rvr Lower MN River Pomme de Terre Rvr Shell Rock River Wild Rice River Red Rvr of the North Grand Marais Creek
Miss Rvr – Brainerd Rainy Rvr – Hdwtrs Snake River Winnebago River Zumbro River
*Organization type:
Federal government For-profit Individual Non-profit
Local/Regional government Private college/university Public college/university State government
*Project type:
Analysis/Interpretation Assessment/Evaluation Demo/Pilot project Education/Outreach/Engagement
Modeling Monitoring Planning
Research Restoration/Enhancement Technical assistance
2. Statement of Problems, Opportunities, and Existing Conditions Stormwater professionals currently rely upon infiltration BMPs as an effective means to reduce pollutant and/or volume loads to surface waters. However, questions remain regarding the performance of these BMPs relative to surface water and groundwater in some circumstances. There is a need to assess the performance of existing BMPs, to which considerable resources have been dedicated, to ensure that desired environmental protections are being achieved and that future resources will be well-directed. Numerous BMPs in the TCMA provide opportunities to assess the loading to and performance of individual and groups of BMPs. The project described in this work plan is one several concurrent multi-year field projects. This project will use inflow and vadose zone sampling to investigate pollutant attenuation achieved by a large underground infiltration BMP (Upper Villa Park (UVP)). Data from multiple years will allow broad assessment of BMP condition, performance, and trends. This project provides an opportunity to leverage the capacities of the CRWD together with those of the MPCA. MPCA will provide funding for the installation of vadose zone sampling equipment and a portion of the laboratory analysis of samples. The CRWD will provide staff time and sampling/monitoring equipment as an “in-kind” contribution, and will fund a portion of the laboratory analysis. Results will enhance our understanding and use of underground infiltration BMPs in urban water resource management. 3. Goals, Objectives, Tasks, and Subtasks
Goal: Develop knowledge on pollutant removal and fate in infiltration BMPs. Results of this study will enhance pollutant reduction estimates, inform BMP planning and performance assessments, address groundwater protection concerns, and increase our

www.pca.state.mn.us • 651-296-6300 • 800-657-3864 • TTY 651-282-5332 or 800-657-3864 • Available in alternative formats e-admin9-38 • 12/2/13 Page 3 of 5
understanding of stormwater and stormwater BMPs in the water cycle.
Objective 1: Stormwater BMP site info, preparations, and monitoring
Task A: BMP Description. Includes site characteristics, context, and historical data. Reference to brief appendices can be used instead of rewriting information in this summary. Information of interest includes:
BMP characteristics List/description of similar TCMA BMPs (only requested if the Contractor already has this) Drainage area characteristics (connected area) Surrounding land use, hydrology, and hydrogeology Subsurface characteristics (beneath BMP) Any notable site constraints/considerations such as setbacks or nearby impaired/sensitive waters Any existing monitoring or performance data for the BMP and its fitness/relevance Any existing monitoring data for nearby water resources or BMPs, if relevant.
Deliverable: Summary of site info, with references, attachments, and data. Responsible Party: MPCA and CRWD
Task B: Write the Sampling Plan. Describe the project’s general approach, schedule, needs, and output. Detail on methods is not needed, as this will be provided in the Sampling SOP. The information in the Sampling Plan will help define the Sampling SOP. Be concise but provide enough detail to generally define the project. Sampling Plan should be followed unless otherwise agreed upon by the responsible parties. Include (if applicable): Overview of goals, approach, and rationale Identification of BMP sampling points Any site modifications needed for monitoring Any seasonal/site constraints on monitoring Equipment purchases/needs General sampling schedule
o Regime, targeted events, sample types, estimated numbers, equipment o In situ monitoring equipment, regime, considerations o Chemical, physical, and biological parameters of interest for various sample types and events
Timing and description of equipment deployment and collection (annual/seasonal) Threshold conditions for monitoring
o Conditions that will trigger grab or automated sampling (e.g., snowmelt, precipitation depth) o Timeframe for deployment and sampling once threshold conditions are achieved o If any threshold condition checks are needed (e.g., forecast), specify who will do this, how, and when
O&M needs/schedule for equipment and the BMP Total estimated number of site visits/other activities/samples/hrs over two years
o These are guidelines; actual conditions will determine activities; these will be invoiced and paid accordingly
Deliverable: Written Sampling Plan Responsible Parties: MPCA and CRWD
Task C: Write the Sampling Standard Operating Procedures (SOP). Develop a written Sampling SOP based on the strategies outlined in the Sampling Plan. An existing CRWD SOP can be used or adapted for this purpose, if available. The SOP should be followed unless otherwise agreed upon by the responsible parties. It should delineate the sequence of steps for proper collection of samples and monitoring data that are specified in the Sampling Plan. Topics to address (as applicable):
List of equipment and supplies needed for each type of sampling Any needed prep before the site visit (e.g., equipment calibration, inventory, lab contacts, condition checks) BMP location, access points, sampling points, and any associated considerations On-site preparations or observations to complete before sampling or equipment setup Automated equipment setup and programming procedures Sample collection procedures and associated activities Sample handling, transport, storage, and delivery procedures Maintenance and collection procedures for automated equipment during deployment Collection procedures for any corollary data Paperwork or documentation to complete during site visits Any other follow-up or between-visit activities, maintenance, documentation that is needed Any requirements of the QAPP (Quality Assurance Project Plan, see below)
Deliverable: Sampling SOP Responsible Parties: MPCA and CRWD

www.pca.state.mn.us • 651-296-6300 • 800-657-3864 • TTY 651-282-5332 or 800-657-3864 • Available in alternative formats e-admin9-38 • 12/2/13 Page 4 of 5
Task D: Quality Assurance Project Plan (QAPP). A QAPP will be developed in a format acceptable to MPCA administration. The QAPP will be used to inform the SOP, as necessary.
Deliverable: QAPP Responsible Party: MPCA
Task E: Design, materials, and installation of vadose zone samplers Three (3) vadose zone samplers will be designed and installed by New Look Contracting, Inc. (Subcontractor)
o CRWD will use funds from this task for purchasing vadose zone sampler materials and for the costs associated with the design and installation of the samplers
o Samplers will be designed according to specifications agreed upon by CRWD and MPCA o Samplers will be designed to allow collection of samples (at least 1 L in volume each) from 3 different
depths below Upper Villa Park Infiltration and Reuse infiltration pipe gallery (the current plan is for approx. 3’, 9’, 15’ below bottom of pipe)
o The initial plan is to install pan lysimeters for this purpose, but this plan may be adjusted based on cost and feasibility if agreed upon by CRWD and MPCA
o Samples will be collected either through the use of a sampling cup or through a pump/vacuum line, tbd prior to installation.
Deliverable: 3 vadose zone samplers, each suitable for collection of at least 1-liter of sample per event with materials suitable for analysis for analytes of interest (metals, nutrients, and chloride), installed at 3 different depths in the vadose zone below UVP.
Responsible Party: CRWD and New Look Contracting, Inc. Task F: Monitoring and sampling – preparation and execution. Activities and sample collection to be completed based on the Sampling Plan and SOP. Activities may include, but are not limited to: Site preparation Gaining permission for site access Equipment and supply preparations (e.g., acquisition, calibration, testing, inventory) Equipment set-up, O&M, retrieval, and any other site visits Development of stage-discharge relationship or other analyses needed prior to sampling Collection of the type and frequency of samples specified in the Sampling Plan and SOP
o Including duplicate, composite, or subsampling if necessary o Estimated at approximately 200 samples (100 from UVP inlet areas and 100 from subsurface samplers) o From events determined to meet threshold conditions for sampling, anticipated to be approximately 15
events per year for 2 years. In situ data and other monitoring data collection as specified in Sampling Plan and SOP Sample handling, transport, storage, and delivery to laboratory as specified in Sampling Plan and SOP Any QA/QC requirements of the QAPP Field notes and sample/data log sheets as specified Any needed communications with lab or other personnel, as specified in Sampling Plan and SOP
Deliverable: Samples (roughly 200) from UVP site Responsible Party: CRWD
Task G: Sample analysis. Laboratory analysis of samples for the parameters specified in the Sampling Plan. Responsible Party: MCES and CRWD
Objective 1 Timeline: Jun 2015 – Jun 2017 Objective 1 Total Cost: $30,825
Objective 2: Administrative tasks.
Task A: Project management and reporting. Project and data communication and tracking of purchases, time, activities, deliverables, and budget. This includes:
Meetings and Communications Data/information transfer, tracking, handling, and archiving. New data collected by CRWD for this site will
supplied to MPCA Project Manager with each quarterly invoice, if this has not already been completed by CRWD or the Subcontractor
Changes to work plan. Invoices submitted quarterly by Contractor to MPCA Project Manager, itemized to the “Task” level of the Budget.

www.pca.state.mn.us • 651-296-6300 • 800-657-3864 • TTY 651-282-5332 or 800-657-3864 • Available in alternative formats e-admin9-38 • 12/2/13 Page 5 of 5
Semi-annual progress reports (brief written summaries of project status and completed/pending activities) submitted by the Contractor to the MPCA Project Manager.
A budget tracking sheet will be maintained by MPCA Project Manager and updated quarterly upon receipt of invoices from the Contractor to track spent and remaining funds in the budget for each Task and Objective
Deliverables: Sample log sheets and field notes; In situ and other associated data; Laboratory data for samples Invoices (quarterly), Progress reports (semi-annual), Budget and activity tracking (quarterly), Meetings
(quarterly, if needed)
Responsible Party: CRWD and MPCA Objective 2 Timeline: June 2015 - June 2017 Objective 2 Cost: $0 - Staff hours to be contributed in-kind by MPCA and CRWD Objective 2 Responsible Parties: MPCA and CRWD
Objective 3: Data analysis and reporting.
Task A: Data management. Includes data QA/QC, analysis, tracking, and storage
Deliverables:
Archived data for all samples with associated monitoring, hydrologic, climactic data Data analysis (within 6 months of project end date) Results interpretation (within 6 months of project end date)
Responsible Party: MPCA and CRWD
Task B: Data reporting and report writing. Deliverables: Draft Report (within 8 months of project end date), Final Report (within 1 year of project end date) Responsible Party: MPCA
Objective 3 Timeline: June 2015 - June 2017 Objective 3 Cost: $0 - Staff hours to be contributed in-kind by MPCA and CRWD Objective 3 Responsible Party: MPCA and CRWD
4. Measurable Outcomes While this section is intended for describing expected measurable improvements to the environment, it is acknowledged that the MPCA does not fund physical implementation work (i.e., BMPs) using Clean Water Legacy funding. Rather, MPCA work plans using Clean Water Legacy provide needed information and analysis to make sure that implementation strategies are well thought-out and targeted. This work will retrospectively assess an implementation (BMP) to determine its efficacy and performance. Project outcomes will include:
1. New understandings of BMP performance and design that will lead to a. Enhanced understanding and numerical ranges for pollutant reduction in BMPs b. Enhanced stormwater BMP guidance that is fair to regulated parties and protective of health and the environment c. Improved future pollutant reductions d. Refinements in BMP design guidance e. Increased confidence in resource allocation for stormwater BMPs that will provide direct benefits to the citizens of
Minnesota, LGUs, state agencies, and other stakeholders. 2. Enhanced characterization of pollutant loading to groundwater and surface water from urban runoff that will inform future
water quality planning and assessment efforts.
5. Gantt charts - Attached
6. Project Budget - Attached

PROJECT NAME: Upper Villa Park Exfiltration Performance Assessment
J J A S O N D J F M A M J J A S O N D J F M A M J
OBJECTIVE 1: Stormwater BMP site info, preparations, and monitoring
Task A - BMP Description X X X X X X X X X X X X X X X X X X X X X X X X X
Task B - Write the Sampling Plan X X X X X X X X X
Task C - Write the Sampling Standard Operating Procedures (SOP) X X X X X X X X X
Task D - Quality Assurance Protection Plan (QAPP) X X X X X X X X X
Task E - Design and installation of vadose zone water samplers (3) X X X X X X X X X X X X
Task F - Monitoring and sampling – preparation and execution X X X X X X X X X X X X X X X X X X X X X
Task G - Sample analysis X X X X X X X X X X X X X X X X X X X X X
OBJECTIVE 2: Administrative tasks
Task A - Project management and reporting X X X X X X X X X X X X X X X X X X X X X X X X X
OBJECTIVE 3: Data analysis and reporting
Task A - Data management X X X X X X X X X X X X X X X X X X X X X X X X X
Task B - Data reporting and report writing X X X X X X X X X X X X X X X X X X X X X
Year 2015 Year 2016 Year 2017

Attachment A SWIFT
Contract No. 90132 CR 8251
4. Other
Expenses
Totals Budget
Per Objective
Project Budget - 2 Years
CRWD Staff -
In Kind
MPCA Staff - In
Kind
New Look Contracting - Design,
Materials, and Installation
Met Council Laboratory -
Laboratory Analysis
Subsurface Samplers -
Incidental Equipment and
Consumables
Samplers - Inlet Printing
$ Rate per Hour/Unit $0.00 $7,833.33 $113.75 $500 7000 $25
Type of Unit Hours Hours Sampler sample total Sampler report
Objective 1: Stormwater BMP site info, preparations, and monitoring
Task A - BMP Description 2 4 1
Task B - Write Sampling Plan 2 8 1
Task C - Write Sampling SOP 2 6 1
Task D - Write QAPP 2 6
Task E - Installation of Subsurface Samplers (3) 3
Task F - Monitoring and Sampling: Prep and Execution 80 20 1 2
Task G - Sample Analysis 200
Objective 1 - Total Units 3 200 1 2 3
Objective 1 - Total Hrs 88 44
Objective 1 - Total $ $23,500 $22,750 $500 $14,000 $75 $60,825
Objective 2: Administrative tasks
Task A - Project management and reporting 15 25
Objective 2 - Total Units
Objective 2 - Total Hrs 15 25
Objective 2 - Total $
Objective 3 - Data analysis and reporting
Task A - Data management 4 30
Task B - Data reporting and report writing 4 60 1
Objective 3 - Total Units 1
Objective 3 - Total Hrs 8 90
Objective 3 - Total $ $25 $25
Total Project Hours 111 159
Total Cost (MPCA)$23,500 $6,825 $500 $0 $0 $30,825
In Kind Cost (CRWD) $0 $15,925 $0 $14,000 $100 $30,025
1. Personnel 2. Subcontractor 3. Equipment

Our Mission is to protect, manage and improve the water resources of Capitol Region Watershed District.
DATE: June 11, 2015 TO: CRWD Board of Managers FROM: Anna Eleria, Water Resource Project Manager RE: CRWD Drainage Assistance Guidelines
Background Following the completion of the Sunny Slope Stabilization Feasibility Study and Highland Ravine Stabilization project in early January, the Board discussed formalizing an approach to the CRWD’s involvement and role in future drainage-related issues. While a number of ideas were shared and deliberated, the Board determined that CRWD would not lead, own or maintain drainage related engineering and construction projects on private property, however, CRWD can offer technical guidance and financial assistance to help address these issues. CRWD staff was directed to take the feedback of the Board and move forward on developing and implementing a formal approach for addressing drainage-related issues. Issues Based on both Board and staff input, CRWD staff have prepared the enclosed draft guidelines for CRWD’s involvement in assisting private property owners with drainage related issues. Different guidelines are presented for both single, private property drainage issues and drainage issues that involve or impact multiple private properties and/or public property. Under both scenarios, CRWD may offer technical guidance to private property owners in the form of a site visit, preliminary assessment of the scope and cause(s) of the issues, and potential next steps to address the issues. However, CRWD will not lead, own or maintain drainage-related projects. For larger, multi-property projects, CRWD may offer cost-share grants for engineering or construction. CRWD staff will present the guidelines to the Board and seek comments at the June 17th meeting. Action Requested None, for discussion purposes only enc: Draft CRWD Drainage Assistance Guidance
June 17, 2015 Board Meeting VI. Unfinished Business – B) CRWD
Drainage Assistance Guidelines (Eleria)

Our Mission is to protect, manage and improve the water resources of Capitol Region Watershed District.
CRWD Drainage Assistance Guidance Draft Version 2 – June 11, 2015 Capitol Region Watershed District’s (District) mission is to protect, improve and restore the waters of the District. To achieve its mission, the District has a cost‐share grant program that offers technical and financial assistance to residents and other property owners for projects that primarily address water quality related issues in the District. The District recognizes that certain situations related to drainage issues on private property may warrant the District’s assistance. Drainage issues include groundwater seepage, excessive, uncontrolled runoff over steep slopes, ravines, or other areas that leads to erosion, and excessive, uncontrolled runoff that leads to downstream flooding. District Assistance Private property owner(s) are responsible for leading and conducting private drainage improvement projects. The District will not design or construct private drainage‐related projects nor will it own or maintain private drainage‐related projects. However, the District may provide limited technical assistance to private property owners. In situations where the issue involves or affects multiple private properties and/or public property, the District may also consider providing financial assistance to those private property owners. There may be public benefit in addressing complex, multiple property drainage issues, such as improved water quality, reduction in flooding, protection of public infrastructure and/or safeguarding of public health, safety and welfare. Guidelines The District’s involvement with drainage projects on private property will follow these guidelines:
1. For both single properties and multiple involved and/or affected properties, the District may
provide technical assistance that includes a site visit of the affected properties, identification of
potential causes and contributing watershed area of the drainage issues, and determination of
potential next steps for the property owner(s). A summary of this information including a site
map will be provided to the property owner(s) in a technical memorandum.
2. For drainage issues involving and/or affecting multiple properties, the District may offer
assistance in the coordination of private drainage improvement projects.
3. For drainage issues involving and/or affecting multiple properties, the District may offer
reimbursement grants for engineering and construction of private drainage projects.
4. For engineering projects that receive District grant funds, the property owner must provide
District staff the opportunity to review and comment on plans.
5. Individual grant awards may not exceed 25% of the engineering costs nor more than 50% of the
construction costs.

DATE: June 9, 2015
TO: CRWD Board of Managers
FROM: Lindsay VanPatten
RE: Summer Event Schedule
Trout Brook Grand Opening – Grand Opening of Trout Brook with St. Paul Parks and GRG’s 20th
Anniversary Celebration
Saturday May 30, 2015 12:30 – 3 pm
Trout Brook Nature Sanctuary
Staff, Board and CAC members attended. Thank you.
Saint Paul Arbor Month Celebration – Community tabling event celebrating Arbor Month
Saturday May 30, 2015 10 am – 2 pm
Linwood Recreation Center
860 St. Claire, St. Paul, MN 55105
Thank you Michelle and Steve for tabling at the event!
Montreal SPSVP Boulevard Rain Garden Planting Day
Saturday, June 6, 2015 9 am – 12 pm
Kick-off and plant pickup at Highland Park Junior High
Landscape Revival Native Plant Expo and Market – Native Plant Expo and Market
Saturday, June 6, 2015 9 am – 3 pm
The following people helped table at the CRWD/RCD booth:
Gustavo Castro, CRWD Staff
Seth Ristow, RCD Staff
Bill Barton, CRWD CAC
Rick Sanders, CRWD CAC
David Arbeit, CRWD CAC
Hamline Midway Spring Festival – D11 Community Festival
Tuesday, June 16, 2015 4 – 8:30 pm
Hancock Recreation Center
1610 Hubbard Ave, St. Paul, MN 55104
4 – 6 pm________________________________________________
6 – 8 pm ________________________________________________
Bugs’ Night Out at Como Lake – Macroinvertebrate sampling and identification for youth
Thursday June 18, 2015 6 – 7:30 pm
Como Lakeside Pavilion
1360 N Lexington Pkwy, St Paul, MN 55108
5:30 – 7:30 pm__________________________________________
June 17, 2015
VII. General Information
A) Summer Event Schedule

Frogtown Neighborhood Association annual meeting
Tuesday, June 23, 2015 5 – 8 pm
Frogtown Park along Victoria
5 – 6:30 pm _______________________________________
6:30 – 8 pm________________________________________
Minnesota Green Roofs Council Annual Green Roof Bike Tour
Sunday, June 28, 2015, 12 – 5 pm
Tour of six green roofs in St. Paul
Purchase tickets on the MGRC website: mngreenroofs.org
Frogtown Garden Tour – Self-guided tour of gardens in Frogtown including some rain gardens
Saturday, July 11, 2015, 10 am – 2 pm
Purchase $5 tickets starting July 1 at NeighborWorks Home Partners, 533 N. Dale or visit
frogtowngreen.com for more info
Como Lake Land and Water Clean Up – In-lake Cleanup event with MN Standup Paddle Board
Association during Como Fest: Como Fest is July 10 – 1 2
Sunday, July 12, 2015 10 am – 1:00 pm
Como Lakeside Pavilion
1360 N Lexington Pkwy, St Paul, MN 55108
9:30 am – 12 pm_________________________________________
10:30 am – 1 pm_________________________________________
Little Mekong Night Markets – Open-air market coordinated by CRWD Partner Grant recipient,
Asian Economic Development Association
Friday and Saturday, July 3, 4 and August 7, 8 from 5 pm – 12 am
Corner of University and Western
SPSVP Boulevard Rain Garden Maintenance meetups for Montana Greenbrier and Montreal
Projects
Monday, July 13, 6:30 – 7:30 pm -- Montana Greenbrier project area – location TBD
Monday, July 20, 6:30 – 7:30 pm -- Montreal project area – location TBD
Frogtown Splashdown! – Water festival at Minnehaha Mall in Frogtown
Friday, July 31, 10 am – 2 pm
779 N Milton St, St Paul, MN 55104
Loeb Lake Family Fishing – Family Fishing Event with CRWD and DNR, MinnAqua
Wednesday, August, 12, 2015, 6 – 8 pm
Marydale Park
Meet near the dock on the east side of Loeb Lake off of Mackubin
6 – 8 pm________________________________________________
W:\07 Programs\Edu-Outreach\Board\2015 BMs\6-17-15 2015 CRWD Events.docx


